JULY 2002 2171 AUSTIN AND LENTZ q 2002 American Meteorological Society The Inner Shelf Response to Wind-Driven Upwelling and Downwelling * JAY A. AUSTIN Center for Coastal Physical Oceanography, Old Dominion University, Norfolk, Virginia STEVEN J. LENTZ Woods Hole Oceanographic Institution, Woods Hole, Massachusetts (Manuscript received 6 December 2000, in final form 9 January 2002) ABSTRACT A two-dimensional numerical model is used to study the response to upwelling- and downwelling-favorable winds on a shelf with a strong pycnocline. During upwelling or downwelling, the pycnocline intersects the surface or bottom, forming a front that moves offshore. The characteristics of the front and of the inner shelf inshore of the front are quite different for upwelling and downwelling. For a constant wind stress the upwelling front moves offshore at roughly a constant rate, while the offshore displacement of the downwelling front scales as because the thickness of the bottom layer increases as the front moves offshore. The geostrophic alongshelf ˇt transport in the front is larger during downwelling than upwelling for the same wind stress magnitude because the geostrophic shear is near the bottom in downwelling as opposed to near the surface in upwelling. During upwelling, weak stratification is maintained over the inner shelf by the onshore flux of denser near-bottom water. This weak stratification suppresses vertical mixing, causing a small reduction in stress at mid depth that drives a weak cross-shelf circulation over the inner shelf. For constant stratification, the inner shelf stratification and cross-shelf circulation are stronger. During downwelling on an initially stratified shelf, the inner shelf becomes unstratified because the very weak cross-shelf circulation forces lighter water under denser, driving convection which enhances the vertical mixing. As a result the stress is nearly constant throughout the water column and the cross-shelf circulation is slightly weaker than in the initially unstratified case. The downwelling response is essentially the same for the constant stratification and the two-layer cases. Model runs including the evolution of a passive tracer indicate that the inner shelf region acts as a barrier to cross-shelf transport of tracers from the coastal boundary to farther offshore and vice versa, due to strong vertical mixing and weak cross-shelf circulation in this region. 1. Introduction Wind-driven currents play a major role in circulation in coastal regions around the world (Smith 1995). Up- welling and downwelling circulations are of particular interest because of the role their secondary, cross-shelf, circulation plays in redistributing not only heat and salt (and hence density) but also nutrients and biological fields. In this paper, we consider the response to up- welling- and downwelling-favorable winds of a shelf that initially has a strong midwater pycnocline. This is a typical condition on many shelves during summer. We use a numerical model to investigate the response from a process-oriented perspective. Idealized bathymetry, * Woods Hole Oceanographic Institution Contribution Number 10406. Corresponding author address: Jay A. Austin, Center for Coastal Physical Oceanography, Crittendon Hall, Old Dominion University, Norfolk, VA 23529-0276. E-mail: [email protected]initial stratification, and forcing are used, as opposed to more realistic conditions, in order that simple analytic scalings can be derived and applied to a wide range of conditions. Our specific focus will be on the ‘‘inner shelf,’’ defined here as the region inshore of the front formed when upwelling or downwelling winds move the pycnocline offshore. The formation and offshore displacement of the up- welling or downwelling front partitions the shelf into dynamically distinct regions with different stratification. In both upwelling and downwelling, full Ekman trans- port develops in the region offshore of the upwelling or downwelling front because the strong stratification (and hence, weak vertical mixing) of the pycnocline acts to ‘‘insulate’’ the surface and bottom layers from each other. Onshore of the front, the stratification is relatively weak and the surface and bottom Ekman layers typically interact, causing a significant reduction in the net cross- shelf transport. The necessity for this divergence was recognized by Ekman (1905), though in that case the reduction is simply attributed to a reduction in depth, as his model assumed a constant eddy viscosity. Lentz
Transcript
JULY 2002 2171A U S T I N A N D L E N T Z
q 2002 American Meteorological Society
The Inner Shelf Response to Wind-Driven Upwelling and Downwelling*
JAY A. AUSTIN
Center for Coastal Physical Oceanography, Old Dominion University, Norfolk, Virginia
(Manuscript received 6 December 2000, in final form 9 January 2002)
ABSTRACT
A two-dimensional numerical model is used to study the response to upwelling- and downwelling-favorablewinds on a shelf with a strong pycnocline. During upwelling or downwelling, the pycnocline intersects thesurface or bottom, forming a front that moves offshore. The characteristics of the front and of the inner shelfinshore of the front are quite different for upwelling and downwelling. For a constant wind stress the upwellingfront moves offshore at roughly a constant rate, while the offshore displacement of the downwelling front scalesas because the thickness of the bottom layer increases as the front moves offshore. The geostrophic alongshelfÏttransport in the front is larger during downwelling than upwelling for the same wind stress magnitude becausethe geostrophic shear is near the bottom in downwelling as opposed to near the surface in upwelling. Duringupwelling, weak stratification is maintained over the inner shelf by the onshore flux of denser near-bottom water.This weak stratification suppresses vertical mixing, causing a small reduction in stress at mid depth that drivesa weak cross-shelf circulation over the inner shelf. For constant stratification, the inner shelf stratification andcross-shelf circulation are stronger. During downwelling on an initially stratified shelf, the inner shelf becomesunstratified because the very weak cross-shelf circulation forces lighter water under denser, driving convectionwhich enhances the vertical mixing. As a result the stress is nearly constant throughout the water column andthe cross-shelf circulation is slightly weaker than in the initially unstratified case. The downwelling response isessentially the same for the constant stratification and the two-layer cases. Model runs including the evolutionof a passive tracer indicate that the inner shelf region acts as a barrier to cross-shelf transport of tracers fromthe coastal boundary to farther offshore and vice versa, due to strong vertical mixing and weak cross-shelfcirculation in this region.
1. Introduction
Wind-driven currents play a major role in circulationin coastal regions around the world (Smith 1995). Up-welling and downwelling circulations are of particularinterest because of the role their secondary, cross-shelf,circulation plays in redistributing not only heat and salt(and hence density) but also nutrients and biologicalfields. In this paper, we consider the response to up-welling- and downwelling-favorable winds of a shelfthat initially has a strong midwater pycnocline. This isa typical condition on many shelves during summer. Weuse a numerical model to investigate the response froma process-oriented perspective. Idealized bathymetry,
Corresponding author address: Jay A. Austin, Center for CoastalPhysical Oceanography, Crittendon Hall, Old Dominion University,Norfolk, VA 23529-0276.E-mail: [email protected]
initial stratification, and forcing are used, as opposed tomore realistic conditions, in order that simple analyticscalings can be derived and applied to a wide range ofconditions. Our specific focus will be on the ‘‘innershelf,’’ defined here as the region inshore of the frontformed when upwelling or downwelling winds movethe pycnocline offshore.
The formation and offshore displacement of the up-welling or downwelling front partitions the shelf intodynamically distinct regions with different stratification.In both upwelling and downwelling, full Ekman trans-port develops in the region offshore of the upwellingor downwelling front because the strong stratification(and hence, weak vertical mixing) of the pycnocline actsto ‘‘insulate’’ the surface and bottom layers from eachother. Onshore of the front, the stratification is relativelyweak and the surface and bottom Ekman layers typicallyinteract, causing a significant reduction in the net cross-shelf transport. The necessity for this divergence wasrecognized by Ekman (1905), though in that case thereduction is simply attributed to a reduction in depth,as his model assumed a constant eddy viscosity. Lentz
2172 VOLUME 32J O U R N A L O F P H Y S I C A L O C E A N O G R A P H Y
(1995) used this divergence as the definition of the innershelf, calling it ‘‘the region characterized by cross-shelfdivergence in the (surface) Ekman transport due to theinteraction of the surface and bottom boundary layers.’’As the water needs to be deep before the surface andbottom boundary layers are separate in weakly stratifiedor unstratified waters, the region inshore of the up-welling or downwelling front is, for all practical pur-poses, equivalent to the inner shelf under this definition.Defining the inner shelf as the region inshore of theupwelling or downwelling front is a more practical def-inition to apply to field observations, as these fronts areconsiderably easier to observe than divergence in thesurface Ekman transport (Lentz 2001). The fact that theeddy viscosity depends on flow and stratification, andhence is not constant, makes it difficult if not impossibleto classify regions of the shelf in terms of the Ekmannumber.
The development of progressively more complex tur-bulence closure models has allowed numerical modelsto more faithfully reproduce the role of mixing in up-welling systems. Models such as those of Hamilton andRattray (1978), Foo (1981), and Kundu (1984) all con-sidered two-dimensional upwelling of a stratified fluidover a flat bottom or a deep but weakly sloping bottom.With a configuration similar to the one used in this study,Allen et al. (1995) and Allen and Newberger (1996)used the Princeton Ocean Model to study the responseto upwelling-favorable and downwelling-favorablewind stress, respectively. The parameters used in theirstudy were motivated by bathymetric and hydrographicconditions typical of the west coast of North America,relatively constant stratification over a narrower, steepershelf. In this study, the focus is on conditions moretypical of the North American East Coast; specifically,a wide, shallow shelf and stratification characterized bya strong vertically localized pycnocline (Austin andLentz 1999). In addition, the focus of the Allen et al.(1995) and Allen and Newberger (1996) paper was onthe entire shelf response, whereas we will focus moreon the inner shelf response.
This study, as with most other two-dimensional mod-els, leaves out several potentially important sources ofvariation in order to focus on the wind-driven responsealone, and in particular the response of the inner shelf.Any study of a realistic upwelling event must includealongshore variation, as inevitably exists in nature.Alongshore gradients in effective alongshore windstress, bathymetry, or stratification can lead to differ-ences in alongshore transport, which serve to buildalongshore pressure gradients counter to the wind stress.These pressure gradients eventually drive cross-shelfcirculation that can bring the pycnocline back onshore.The study also does not consider the role of the specificmixing parameterization chosen. However, the most im-portant aspect of the mixing appears to be the stronginverse dependence of eddy viscosity on stratification,which is a feature common to most of the more so-
phisticated mixing parameterizations. Finally, this studydoes not consider the role of surface heating, to whichrelaxation after upwelling has been partially attributed(Send et al. 1987). However, this does not account forthe fact that the salinity field is also observed to relax,suggesting that the alongshore pressure gradient is likelythe most important omission in this work.
The paper proceeds as follows. In section 2, the nu-merical model is briefly outlined and the configurationdescribed. Section 3 contains a description of ‘‘basecase’’ upwelling and downwelling responses, as well asconsideration of the dependence of the response on themodel parameters. Section 4 is a discussion of somerelated topics, specifically the response of a continu-ously stratified shelf and the behavior of passive tracerson the inner shelf. A short summary of results followsin section 5.
2. The numerical model
In this section the numerical model and the physicalparameters used in the model are described, including the‘‘base case’’ model run, which is the focus of section 3.
a. Description of the model
The numerical model used is the Princeton OceanModel (POM: Blumberg and Mellor 1987). POM is ahydrostatic, free-surface, numerical model, written forthe study of coastal circulation, and has been used bymany investigators in the past. The model is run in atwo-dimensional channel configuration eliminatingalongshelf variability. Vertical turbulent mixing is pa-rameterized with the Mellor–Yamada level 2.5 turbu-lence submodel (Mellor and Yamada 1982), with themodification limiting the mixing length scale describedby Galperin et al. (1988). In addition, there is a back-ground vertical eddy viscosity and diffusivity of n 5 23 1025 m2 s21 and a constant horizontal eddy viscosityand diffusivity of AM 5 AH 5 2 m2 s21.
1) THE FIELD EQUATIONS
The cross-shelf and alongshelf momentum equationsare
]u ]u ]u 1 ]p ] ]u1 u 1 w 2 fy 5 2 1 KM1 2]t ]x ]z r ]x ]z ]z0
] ]u1 A (1)M1 2]x ]x
]y ]y ]y ] ]y ] ]y1 u 1 w 1 fu 5 K 1 A . (2)M M1 2 1 2]t ]x ]z ]z ]z ]x ]x
A right-handed ‘‘east coast’’ coordinate system is used,with x positive offshore, y positive northward, and zpositive upward; KM is the vertical eddy viscosity de-
JULY 2002 2173A U S T I N A N D L E N T Z
termined by the turbulence closure scheme. In all of themodel runs, the Coriolis parameter f 5 1024 s21, thegravitational acceleration g 5 9.80 m s22, and the ref-erence density r0 5 1020 kg m23.
The density equation is
]r ]r ]r ] ]r ] ]r1 u 1 w 5 K 1 A , (3)H H1 2 1 2]t ]x ]z ]z ]z ]x ]x
where KH is the vertical eddy diffusivity determined bythe turbulence closure scheme. Although technicallydensity is not a conserved quantity, a linear equation ofstate is assumed so that density is linearly proportionalto temperature, which is conserved.
The water is assumed to be incompressible, so
]u ]w1 5 0. (4)
]x ]z
2) BOUNDARY CONDITIONS
The surface boundary condition is
](u, y)sx sy 21K 5 (t , t )r , (5)M 0)]z z50
where t sx and t sy are the surface cross-shelf and along-shelf wind stress components, respectively. There is nobuoyancy flux through the surface.
The bottom boundary condition for momentum is aquadratic drag law:
](u, y)2 2 1/2K 5 r C (u 1 y ) (u , y ), (6)M 0 D b b b b)]z z52H
where (ub, y b) represents the velocity in the bottom gridcell. Here CD is a drag coefficient determined by
22Dzb2C 5 k ln , (7)D 1 2z0
where k 5 0.4 is von Karman’s constant, Dzb is halfthe vertical grid spacing at the bottom, and z0 5 1022
m is the bottom roughness scale. Due to variation inthe grid spacing as a function of the water depth, CD
varies in the base case from approximately 4.8 3 1022
in 5 m of water to 6.9 3 1023 in 55 m of water. Thereis no buoyancy flux through the bottom.
At the coastal wall, the boundary condition for thealong-channel velocity is free-slip, and there is no cross-channel flow or buoyancy flux.
3) SPATIAL AND TEMPORAL GRIDS
POM is a sigma-level model, meaning that the verticalgrid resolution is proportional to the water depth. In thebase case, the depth varies from 5 m at the coast to 55m in the middle of the channel (in a steep-slope runwith a 5 0.005, the maximum depth is 255 m). With
40 sigma levels, the vertical resolution varies from ap-proximately 0.13 m in shallow water to 1.4 m in thedeepest portion of the domain (4.1 m in the steep-slopecase). The vertical spacing near the surface and bottomis slightly smaller to resolve the boundary layers.
The horizontal grid size varies in proportion to thesquare root of the local depth, maintaining numericalstability while providing high resolution in shallowerwater. The horizontal resolution varies from approxi-mately 150 m in the shallowest portion of the domainto approximately 450 m in the deepest portion. In thebase case there are 339 grid cells in the horizontal; thisnumber varies from 175 for the steep-slope case to 562for the shallow-slope case.
The model utilizes a split time step, with an externaltime step (DtE 5 10 s) to resolve the barotropic modeand an internal time step (DtI 5 150 s) to resolve thebaroclinic portion of the solution. Halving the time stepsand halving both the time steps and the spatial gridresolution made no qualitative or significant quantitativechange in the response.
b. Configuration of the base case model run
Three components are varied in the two-dimensionalmodel runs: the bathymetry, the initial stratification, andthe wind forcing (the initial condition is at rest). Simpleforms are used so that these three components can bedescribed with as few parameters as possible, therebysimplifying the analysis (Fig. 1). The ‘‘base case’’ pa-rameters described in this section are motivated by theobservations made during the CoOP Inner Shelf Study(Austin and Lentz 1999; Austin 1998). The dependenceof the model response on the wind forcing, stratification,and bathymetry are considered by varying these param-eters.
1) BATHYMETRY
The model domain is a symmetric channel with ba-thymetry H(x) given by
H 1 ax, x , L0H(x) 5 H 1 aL, L , x , 2L (8)0H 1 a(3L 2 x), 2L , x , 3L, 0
where H0 is the water depth at the coastal boundary, ais bottom slope, and L is the width of the sloped portionof the shelf. In all of the model runs L 5 50 km. Testruns (not presented here) showed doubling L did notqualitatively affect the response over the sloped shelf,suggesting that the channel was sufficiently wide thatthe opposite sides of the domain do not influence eachother. In the base case, H0 5 5 m and a 5 1023. Theslope is approximately consistent with the bathymetryobserved over the northeastern North Carolina innershelf within 20 km of the coast, where the cross-shelfbottom slope was on the order of 1023, with significant
2174 VOLUME 32J O U R N A L O F P H Y S I C A L O C E A N O G R A P H Y
FIG. 1. The basic physical configuration of the model. (a) The channel geometry, along withthe definitions of the parameters determining the bathymetry (a, the bottom slope; L, the widthof the sloped region; and H0, the coastal wall depth), and the initial stratification (Z0, the initialsurface mixed layer depth; Dr, the density difference across the pycnocline; and DZ, the initialthickness of the pycnocline). The stratification is initially horizontally uniform. (b) The windforcing used in the model. Solid line, continuous forcing; dashed line, transient forcing. Timeunits are inertial periods.
variation on shorter spatial scales. An advantage of thesymmetric configuration is that the downwelling andupwelling cases are solved simultaneously on oppositesides of the channel.
2) STRATIFICATION
The initial stratification consists of well-mixed sur-face and bottom layers with a continuously stratifiedpycnocline in between. The initial density as a functionof depth is
r , z . 2Z0 0 (2Z 2 z)0r(z) 5 r 1 Dr , 2Z , z , 2Z 2 DZ0 0 0DZr 1 Dr, 2Z 2 DZ . z. 0 0
(9)
The variable parameters that determine the stratificationare Z0, the initial thickness of the surface mixed layer;Dr, the density change across the pycnocline; and DZ,
the thickness of the pycnocline. The typical stratificationobserved during August 1994 at the CoOp Inner ShelfStudy site was a strong pycnocline centered at approx-imately 10-m depth. The base case parameters are there-fore: Z0 5 8 m, DZ 5 4 m, and Dr 5 2 kg m23 (Fig.1).
3) WIND FORCING
The base case surface forcing consisted of alongshelfwind stress tSFC, uniform across-channel, ramped upover an inertial period, and left on for the duration ofthe model run (Fig. 1b). The wind stress is defined as
ft 2pSt , t , 2p f
SFC t (t) 5 (10)2p
St , t . .f
The ramp-up length was chosen to quell inertial energy.In the base case, t S 5 0.1 N m22, roughly equivalent
JULY 2002 2175A U S T I N A N D L E N T Z
to a wind speed of about 8 m s21 at 10 m above thesea surface (Fairall et al. 1996). Wind events during theCoOP Inner Shelf Study typically lasted a couple ofdays (Austin and Lentz 1999). To investigate the re-sponse to the cessation of the wind, the wind forcing isramped down after five inertial periods in several modelruns and the subsequent relaxation is observed for fourinertial periods.
Different model runs will be referred to by the pa-rameter that has been changed and by how much, rel-ative to the base case (BC). For instance, a model runidentical to the BC except that the wind stress is twiceas strong is called 2t S. A model run with no stratifi-cation, referred to as NEUT, is used as a control caseto study the role of stratification.
c. Nondimensionalizations
The dynamics of the shelf are fundamentally differentinshore and offshore of the upwelling front, and thismakes nondimensionalization of the problem difficult.However, nondimensionalizing some of the variablesaids in the interpretation of the results. In the rest ofthe paper, nonprimed variables are dimensional andprimed variables are dimensionless. The primes will beretained throughout the paper since not all variables arenondimensionalized.
Time is scaled by the inertial period (17.5 h)
ft9 5 t. (11)
2p
No simple cross-shelf or vertical length scales thatcharacterize the response were found. The internal Ross-by radius of deformation (5 km in the base case) doesnot characterize the offshore location of the front. How-ever, the internal Rossby radius characterizes the widthof the front in the transient case in which the front comesinto equilibrium with an alongshore jet, as in the classicRossby adjustment problem.
The density anomaly r 2 r0 is scaled by the initialdensity difference Dr
r 2 r 0r9 5 , (12)Dr
where r0 is the density of the water initially in thesurface mixed layer and hence the lightest water in thesystem. Therefore, initially r9 5 0 at the surface andr9 5 1 in the lower layer.
The internal stress is scaled by the applied wind stress
tt9 5 . (13)
S|t |
Thus, t9 ranges from 1 at the surface during the windforcing to 0 in the interior. The value of the stressthroughout the water column indicates whether the sur-face and bottom layers are in ‘‘direct contact’’ throughthe stress divergence field [i.e., Lentz’s (1995) inner
shelf] or whether there is an inviscid interior and thebottom boundary layer is driven entirely by the cross-shelf pressure gradient (i.e., the midshelf ).
Finally, the cross-shelf streamfunction C is definedas Cz 5 2u, C(z 5 0) 5 0, and is scaled by the Ekmantransport
21StC9 5 C. (14)1 2r f0
Thus, if there is no stress in the interior and a full Ekmanlayer develops, then \C9\ ø 1 in the interior.
3. Base-case response
In this section, we consider the two-dimensional re-sponse of an idealized stratified coastal ocean to con-stant upwelling- and downwelling-favorable windstresses. Descriptions of the base case upwelling anddownwelling scenarios are presented, followed by com-parisons and scalings of key elements of the response,such as the size of the inner shelf and the alongshoregeostrophic transport associated with the upwelling ordownwelling jet.
a. Upwelling
The response to upwelling favorable winds (Fig. 2)resembles the classic coastal upwelling circulation(Smith 1995). After one inertial period (t9 5 1), thewind stress, which has reached full intensity, acceleratesa surface-intensified alongshelf flow, which in turn ac-celerates an offshore flow due to the Coriolis force,resulting in the formation of a surface Ekman layer. Theoffshore Ekman transport in the surface boundary layersets up a cross-shelf pressure gradient that drives anonshore return flow that is evenly distributed throughoutthe water column. A bottom mixed layer has formedwhere the pycnocline intersects the bottom, and the is-opycnals have begun to move onshore. The alongshelfvelocity is surface intensified and strongest near thecoast. After two inertial periods (t9 5 2), divergence inthe wind-driven offshore transport near the coast forcesupwelling that causes the pycnocline to intersect thesurface, forming an upwelling front about 12 km off-shore. A region of less dense water is left near the coast,separated from the upwelling front by a bulge of denserupwelled water. The cross-shelf flow is well developedoffshore of the front with the surface-layer offshoretransport and the lower-layer onshore transport equal tothe classical Ekman transport t s f 21(C9 ø 1 in the21r 0
interior). Inshore of the front the cross-shelf flow de-creases toward the coast. This divergence in the cross-shelf transport leads to the large vertical velocities. Thealongshore flow increases throughout the domain and ajet develops at the front, with maximum velocities of;0.5 m s21. After three inertial periods (t9 5 3) theupwelling front and the associated alongshelf jet have
2176 VOLUME 32J O U R N A L O F P H Y S I C A L O C E A N O G R A P H Y
FIG. 2. Instantaneous fields of density, streamfunction, alongshore velocity, and internal stress at 1, 2, and 3 inertial periods duringupwelling. The displays of density, streamfunction, and bottom stress are scaled as discussed in the text. The region in which the internalstress is ,1% of the surface stress is shaded.
moved farther offshore (20 km), expanding the innershelf region. The stratification over the inner shelf hasweakened causing a reduction of the cross-shelf cir-culation. Consequently, most of the cross-shelf transportdivergence, and hence the upwelling, occurs near theupwelling front. However, weak stratification and aweak cross-shelf circulation do persist over the innershelf. At longer times, the front and associated featurescontinue to move offshore and the inner shelf regioncontinues to expand. Otherwise the density and flowfields remain essentially the same.
b. Downwelling
The initial response to downwelling-favorable windsis essentially the same as the initial response to up-welling-favorable winds except the cross-shelf andalongshelf flows are in the opposite direction (cf Figs.2 and 3, t9 5 1). However, at longer times there arenotable differences in the response. Downwelling-fa-vorable winds drive an onshore Ekman transport in the
surface boundary layer that results in a vertically uni-form offshore flow (Fig. 3, t9 5 1). The offshore flowdisplaces the pycnocline by deepening it across the shelfwith greater deepening closer to shore. The alongshelfflow is surface intensified and varies little across theshelf. After two inertial periods (t9 5 2), the offshoreflow is concentrated near the bottom, indicating the for-mation of a bottom boundary layer. The bottom bound-ary layer transport deflects and steepens the downwell-ing front, producing a region of strong cross-shelf den-sity gradient. Just onshore of the downwelling front isa region of large cross-shelf transport divergence andlarge downward vertical velocities. Farther onshore, onthe inner shelf, cross-shelf velocities are very small. Byt9 5 2, a strong surface-intensified jet has formed in thevicinity of the downwelling front. Velocities in the jetnear the surface approach 0.5 m s21, and increase intime as the depth of the downwelling front increases.Inshore of the jet the alongshelf velocities are muchweaker, and the flow is less sheared, with velocitiesthroughout the region on the order of 0.2 m s21. There
JULY 2002 2177A U S T I N A N D L E N T Z
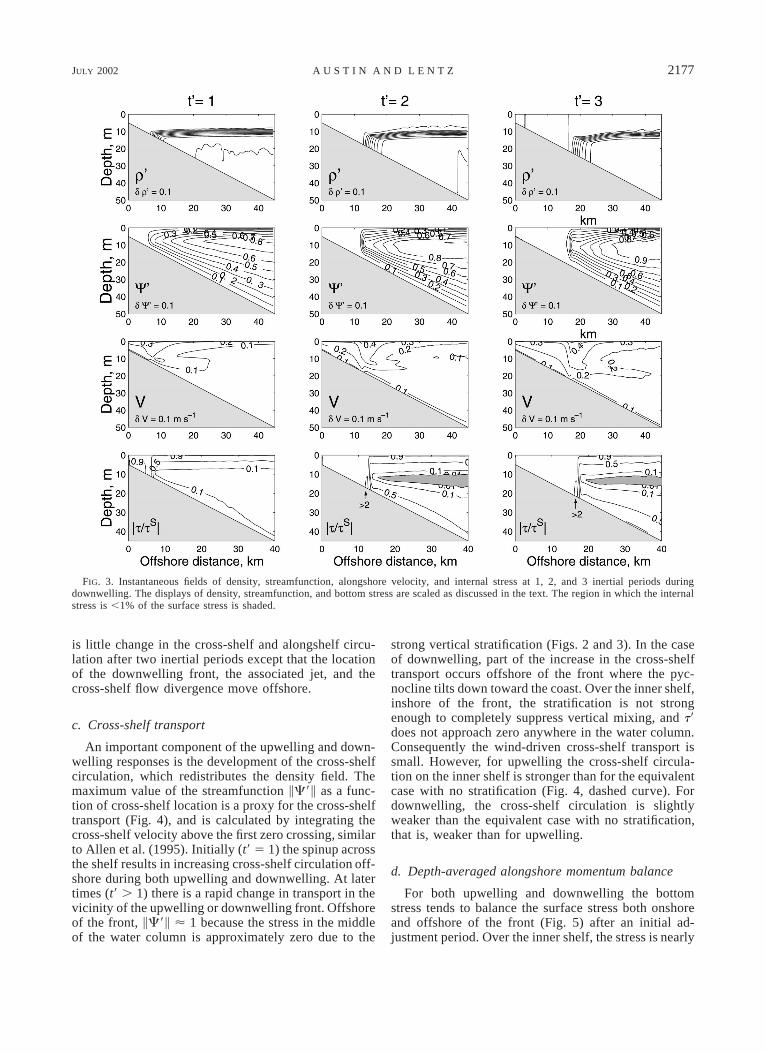
FIG. 3. Instantaneous fields of density, streamfunction, alongshore velocity, and internal stress at 1, 2, and 3 inertial periods duringdownwelling. The displays of density, streamfunction, and bottom stress are scaled as discussed in the text. The region in which the internalstress is ,1% of the surface stress is shaded.
is little change in the cross-shelf and alongshelf circu-lation after two inertial periods except that the locationof the downwelling front, the associated jet, and thecross-shelf flow divergence move offshore.
c. Cross-shelf transport
An important component of the upwelling and down-welling responses is the development of the cross-shelfcirculation, which redistributes the density field. Themaximum value of the streamfunction \C9\ as a func-tion of cross-shelf location is a proxy for the cross-shelftransport (Fig. 4), and is calculated by integrating thecross-shelf velocity above the first zero crossing, similarto Allen et al. (1995). Initially (t9 5 1) the spinup acrossthe shelf results in increasing cross-shelf circulation off-shore during both upwelling and downwelling. At latertimes (t9 . 1) there is a rapid change in transport in thevicinity of the upwelling or downwelling front. Offshoreof the front, \C9\ ø 1 because the stress in the middleof the water column is approximately zero due to the
strong vertical stratification (Figs. 2 and 3). In the caseof downwelling, part of the increase in the cross-shelftransport occurs offshore of the front where the pyc-nocline tilts down toward the coast. Over the inner shelf,inshore of the front, the stratification is not strongenough to completely suppress vertical mixing, and t9does not approach zero anywhere in the water column.Consequently the wind-driven cross-shelf transport issmall. However, for upwelling the cross-shelf circula-tion on the inner shelf is stronger than for the equivalentcase with no stratification (Fig. 4, dashed curve). Fordownwelling, the cross-shelf circulation is slightlyweaker than the equivalent case with no stratification,that is, weaker than for upwelling.
d. Depth-averaged alongshore momentum balance
For both upwelling and downwelling the bottomstress tends to balance the surface stress both onshoreand offshore of the front (Fig. 5) after an initial ad-justment period. Over the inner shelf, the stress is nearly
2178 VOLUME 32J O U R N A L O F P H Y S I C A L O C E A N O G R A P H Y
FIG. 4. The maximum value of the streamfunction C as a function of cross-shelf distance,plotted at 1, 2, 3, and 4 inertial periods. Dashed line is \C\ for the neutral (unstratified) case.(a) Upwelling. (b) Downwelling.
constant throughout the water column (Figs. 2 and 3).Offshore of the front, the stresses are concentrated nearthe surface and bottom and are small in the interior. Thetransport in the surface and bottom Ekman layers haveequal magnitudes, but opposite directions, and hencethe stresses are the same. For upwelling there is not asignificant variation in this balance in the vicinity of thefront. However, for downwelling there is a substantialvariation near the front. At the front and just offshoreof the front (where the isopycnals are warped down-ward) the acceleration term is significant since thealongshore velocity is adjusting to the shear suppliedby the horizontal density gradients present in these re-gions. In a narrow region just onshore of the front, themaximum bottom stress is over twice as large as thesurface stress because the strong vertical stratificationof the pycnocline has been advected offshore, leavingthe high-momentum water on the inshore edge of thejet ‘‘exposed’’ to the bottom. Thus the large bottomstress in this region decelerates the alongshelf flow. Asimple scaling of the dominant momentum balance inthis region:
y ø (K y )t M z z (15)
yields a scaling for the time it takes to dissipate thismomentum and reach the balance observed on the restof the inner shelf:
2HT ø , (16)adj
\K \M
where H is the local water depth and \KM\ is a repre-sentative eddy viscosity. For t9 5 3 in Fig. 5, H ø 25m. Using \KM\ 5 1022 m2 s21 (Fig. 6), this yields Tadj
5 0.7 days. Multiplying this by the offshore speed ofthe front, roughly 0.06 m s21, yields 4 km, consistentwith the observed width of the adjustment region (Fig.5).
e. Frontal speed and displacement
The displacement of the front during upwelling anddownwelling determines the width of the inner shelf.
The rate at which the front moves offshore is differentfor upwelling and downwelling. The surface and bottomtemperature fields from the upwelling and downwellingcases (Fig. 7) suggest that for upwelling the offshoreposition of the front is a linear function of time t, whilefor downwelling the position increases as roughly Ït(the scales of the model fits shown in this figure arethose derived later in this paper). The difference is duethe geometry as discussed below. In Allen and New-berger (1996), this dependence is evident in the down-welling case, but is less clear in the upwelling case ofAllen et al. (1995), largely because the surface front isnot as well defined in the continuously stratified caseconsidered there. Surface mixing, in this case, plays asignificant role in determining the surface density dis-tribution, obscuring the position of the surface front.
To first order, the rate of the offshore displacementof the upwelling front is simply the Ekman transportdivided by the surface Ekman layer depth dE; that is,the velocity of the front is hypothesized to be
Stu 5 , (17)F r fd0 E
where uF is the vertically averaged velocity in the sur-face Ekman layer. This corresponds to an offshore dis-placement of
StDX 5 t , (18)
r fd0 E
where t is the duration of the wind event. This equationis only approximate in that it does not take into accountthe time it takes the front to reach the surface or thelocation at which it does so. This issue is clearly evidentin Fig. 7, where a surface upwelling front does not startto form until after 1 inertial period. The velocity is notvertically uniform in the surface boundary layer, as theoffshore velocity at the surface is somewhat greater thanthat below. This leads to a weak overturning that keepsthe front steep. This behavior has been observed in othernumerical models (Chen and Wang 1990; Hamilton andRattray 1978). Based on the initial conditions, a rea-
JULY 2002 2179A U S T I N A N D L E N T Z
FIG. 5. (a: top panels) The terms of the vertically integrated alongshore momentum balance at t9 5 3 forupwelling (first column) and downwelling (second column). The next three fields duplicate those in Fig. 2,for reference. (b) The density field. (c) The alongshore velocity. (d) The cross-shelf streamfunction.
sonable estimate of the effective Ekman depth for thecase of a strong, shallow pycnocline considered here isdE ø Z0 1 DZ/2, where Z0 is the initial depth of thesurface mixed layer. The addition of a portion of thepycnocline (DZ/2) is similar to the ‘‘transition layer’’discussed in Lentz (1992). This estimate of dE assumesthe stratification in the pycnocline is strong enough toinhibit vertical mixing and deepening of the surfacemixed layer and is inaccurate if the mixed layer deepens
substantially over the forcing period. Estimates of mixedlayer deepening are discussed in appendix A. Takingthese estimates of mixed layer deepening into accountqualitatively improves the displacement estimates. TheEkman layer thickness estimate may also be invalid ifthe initial mixed layer depth is greater than the neutralEkman layer depth ku*/ f , where u* 5 , in whichs 21Ït rcase dE ø ku*/ f . However, this is not the case for anyof the scenarios tested here.
2180 VOLUME 32J O U R N A L O F P H Y S I C A L O C E A N O G R A P H Y
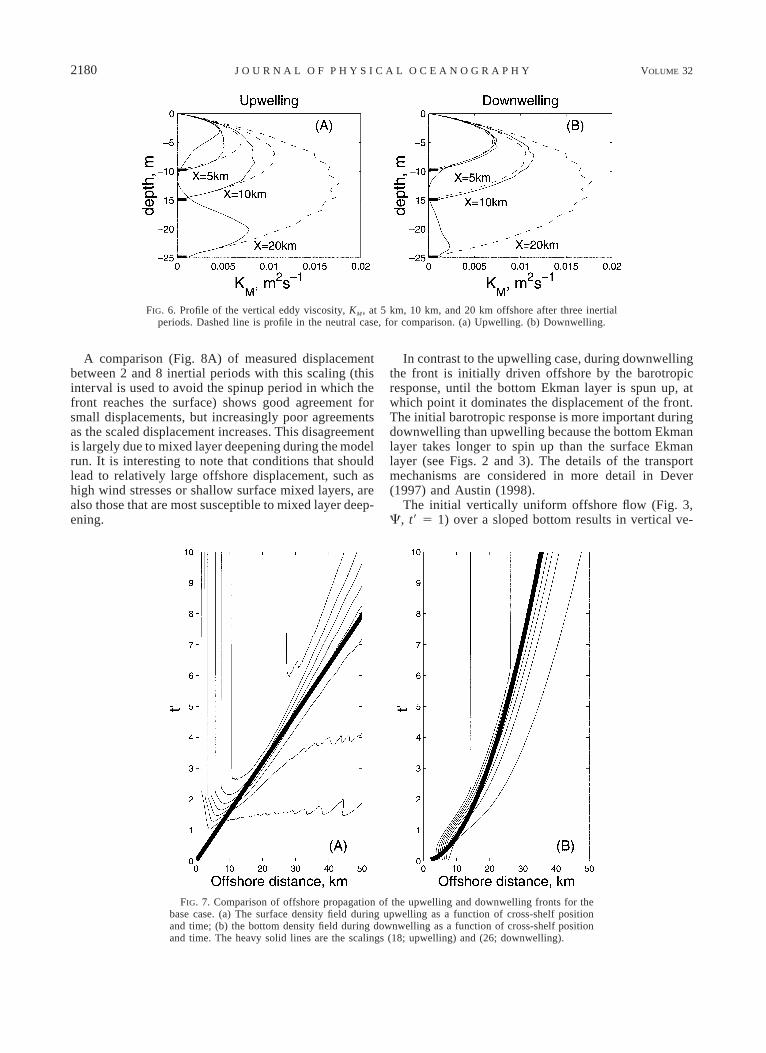
FIG. 6. Profile of the vertical eddy viscosity, KM, at 5 km, 10 km, and 20 km offshore after three inertialperiods. Dashed line is profile in the neutral case, for comparison. (a) Upwelling. (b) Downwelling.
FIG. 7. Comparison of offshore propagation of the upwelling and downwelling fronts for thebase case. (a) The surface density field during upwelling as a function of cross-shelf positionand time; (b) the bottom density field during downwelling as a function of cross-shelf positionand time. The heavy solid lines are the scalings (18; upwelling) and (26; downwelling).
A comparison (Fig. 8A) of measured displacementbetween 2 and 8 inertial periods with this scaling (thisinterval is used to avoid the spinup period in which thefront reaches the surface) shows good agreement forsmall displacements, but increasingly poor agreementsas the scaled displacement increases. This disagreementis largely due to mixed layer deepening during the modelrun. It is interesting to note that conditions that shouldlead to relatively large offshore displacement, such ashigh wind stresses or shallow surface mixed layers, arealso those that are most susceptible to mixed layer deep-ening.
In contrast to the upwelling case, during downwellingthe front is initially driven offshore by the barotropicresponse, until the bottom Ekman layer is spun up, atwhich point it dominates the displacement of the front.The initial barotropic response is more important duringdownwelling than upwelling because the bottom Ekmanlayer takes longer to spin up than the surface Ekmanlayer (see Figs. 2 and 3). The details of the transportmechanisms are considered in more detail in Dever(1997) and Austin (1998).
The initial vertically uniform offshore flow (Fig. 3,C, t9 5 1) over a sloped bottom results in vertical ve-
JULY 2002 2181A U S T I N A N D L E N T Z
FIG. 8. (a). The displacement of the upwelling front between t9 5 2 and t9 5 8 for the upwelling case vsthe displacement scale of Eq. (18). (b) The displacement of the downwelling front at t9 5 8 vs the Ekmanmodel [Eq. (25), symbol x] and barotropic model [Eq. (23), symbol o].
locities, which are zero at the surface and largest at thebottom. These vertical velocities cause the largest down-ward displacements of the pycnocline near the bottom(close to shore) and the smallest vertical displacementsnear the surface (farther offshore). This results in thepycnocline sloping downward towards the shore andbeing displaced offshore (see density contours Fig. 3 t95 2). Assuming that initially the offshore transport inthe interior equals the onshore surface Ekman transport(US 5 t/r f ), the approximate deflection of the pyc-nocline due to the barotropic response can be estimated.If the horizontal velocity field is
SUu (x) 5 2 , (19)BARO H(x)
continuity (ux 1 wz 5 0) can be used to estimate thevertical velocity field w:
SaU zw (x. z) 5 . (20)BARO H(x)
To determine the displacement of isopycnals, define acoordinate system x9 5 H0a21 1 x so that H 5 ax9.Then, writing (19) in terms of cross-shelf displacements
Sdx9 U5 2 (21)
dt ax9
and integrating in time yieldst
2 2 21 S(x9 2 X ) 5 2a U dt. (22)0 E0
The displacement of the location of the intersection ofthe pycnocline with the bottom can now be written asa function of time:
t S2U2x (t) 5 dt 1 X , (23)BARO E 0! a0
where X0 is the initial position of the front.
For times long compared to the frictional timescalethe offshore displacement of the front is dominated bythe transport in the bottom Ekman layer and the baro-tropic response can be neglected. In this case, the bottomEkman transport equals the surface Ekman transport(US). The bottom Ekman transport pushes slightly ligh-ter water from just onshore of the downwelling frontunder the front, resulting in steepening (Fig. 3, r, t9 52, 3). The steepening behavior is similar to that observedin upwelling fronts in other modeling studies (Hamiltonand Rattray 1978; Chen and Wang 1990). By setting thesurface volume transport equal to the volume displacedby the downwelling front, the location of the front canbe estimated:
t1S(Dx )(aDx ) 5 U dt, (24)EK EK E2 0
where DxEk is the displacement of the downwelling frontdue to this mechanism. This can be rearranged to yield:
t S2Ux (t) 5 X 1 dt. (25)EK 0 E! a0
The actual displacement is a combination of the initialshelfwide deepening of the pycnocline by the barotropicresponse, and then the steepening of the front by thebottom Ekman layer. However, for a constant windstress, the displacement scales in both mechanisms asapproximately:
S2t tDX ø , (26)!r fa0
where t is the time since onset of the wind. Variationsin the frontal displacement due to changes in tS and aare in good agreement with this scaling (Fig. 8b), exceptat very small values of a, in which the downwelling
2182 VOLUME 32J O U R N A L O F P H Y S I C A L O C E A N O G R A P H Y
front is smeared out, making the displacement difficultto measure. The success of this scaling suggests that theinitial density structure plays little role in determiningthe offshore propagation of the pycnocline and, in fact,model runs where stratification parameters are varied,including runs with constant stratification, show littlevariation in pycnocline displacement. It is clear fromFig. 8 that the cross-shelf frontal displacement scale fordownwelling is typically less than that for upwelling.Thus, though the surface Ekman transport is the samefor both upwelling and downwelling, the frontal dis-placement has significantly different dependences. Forupwelling the offshore displacement of the front is alinear function of time because dE is roughly constant.For downwelling, dE (or the depth for the barotropicresponse) increases with time as the front moves intodeeper water (see Fig. 3), so for a constant US the rateof offshore displacement must decrease with time.
f. The relaxation response: Alongshelf geostrophictransport
Alongshelf transport in the jet associated with theupwelling or downwelling front also plays an importantrole in shelf circulation. Alongshelf variation in thetransport gives rise to alongshore divergences, whichmay play an important role in setting up alongshorepressure gradients likely responsible for the observed(but not modeled) relaxation response. To understandwhat gives rise to these divergences, we must first un-derstand what sets the scale of the transport for the localresponse.
In both the upwelling and downwelling case, the geo-strophic transport in the jet is calculated from the localdensity field assuming no flow at the bottom. In the casewhere the alongshore wind is shut off, the system re-sponds by dissipating alongshore momentum throughbottom friction until the bottom velocity is zero; how-ever, thermal wind shear above the bottom allows mo-mentum to be ‘‘trapped’’ in the upper portion of thewater column, in geostrophic balance with the densityfield. From a model run that has had the wind shut offand allowed to come to equilibrium (Fig. 9), it is clearthat for both the upwelling and downwelling the systemdoes relax to a geostrophic balance. In the case of up-welling, the cross-shelf density gradients are in the up-per portion of the water column (Fig. 10a). Whereas,in downwelling, the cross-shelf density gradients areconcentrated near the bottom (Fig. 10b). An importantconsequence of this difference is that the transport inthe downwelling jet grows with offshore displacement,whereas it is constant in the upwelling case.
An estimate of the geostrophic transport in the up-welling jet, when the wind is turned off after a windstress of duration Dt, is
2gDr(Z 1 DZ /2)0V 5 . (27)trans 2r f0
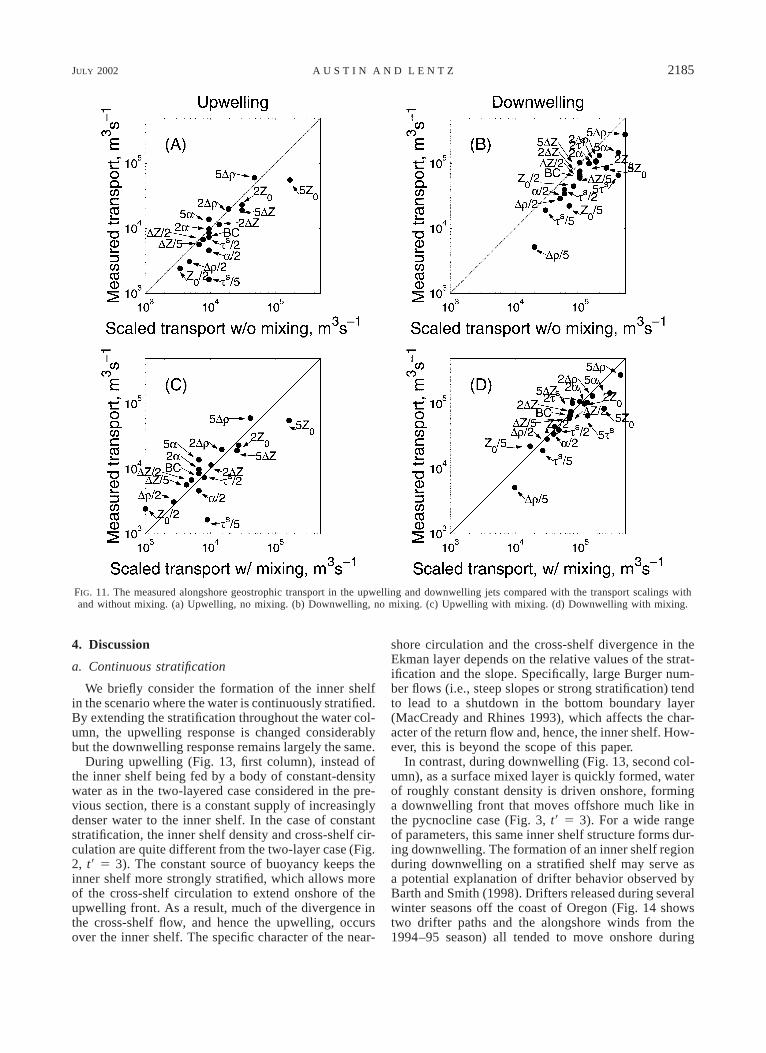
Thus, in the absence of substantial mixing across thepycnocline, the geostrophic transport in the jet after thewind is turned off is independent of the strength orduration of the forcing, as long as it is of sufficientduration to bring the pycnocline to the surface. Thisscale estimate of the geostrophic transport is in goodagreement with the observed transport from the nu-merical model runs (Figs. 11a and 11c). The scalingsfor weak forcing (t S/5) and deep initial surface layer(5Z0) overestimate the jet transport because in these twocases the wind stress event is insufficient to fully outcropthe pycnocline over the duration of the run. Taking intoaccount the deepening of the pycnocline due to mixingonly slightly improves the estimates since its effects atleast partially cancel out: Mixing simultaneously deep-ens the mixed layer (which increases jet transport) anddecreases the density difference across the front (whichdecreases transport).
In downwelling, the geostrophic transport is distrib-uted over a greater depth as the jet moves farther off-shore (Fig. 10b). The alongshelf, geostrophic velocityin the jet is
g Dr(H(X ) 2 Z ), z . 2ZF 0 0r f D0
y 5jetg Dr (z 1 H(X )), 2H(X ) , z , 2z ,F F 0r f D 0
(28)
where H(XF) is the water depth at the location of thefront, XF. Integrating y jet vertically and multiplying bythe width of the jet D results in an estimated total jettransport:
gdr2 2V 5 (H(X ) 2 Z ). (29)trans F 02r f0
This is initially difficult to interpret because the timedependence is buried in the XF term. However, the fron-tal depth H(XF) can be estimated using the displacementscaling (25). The variation in bottom depth over thewidth of the jet is ignored. The density difference andmixed layer depth can be approximated, to first order,as dr 5 Dr and dE 5 Z0, yielding
gdrSV 5 2U at. (30)trans 2r f0
The scaling underestimates the jet transport by nearlya factor of 2, but the parameter dependence is good(Fig. 11b). The difference is presumably due to inap-propriate choices of dr and ZS due to the effects ofentrainment. During downwelling, reducing the densitydifference and deepening the mixed layer both reducethe total transport, causing the simple scaling to sig-nificantly overestimate the transport. In this case, theinclusion of the mixing scaling significantly improvesthe estimate (Fig. 11b). The magnitude of the jet in thedownwelling case is much larger than in the upwelling
JULY 2002 2183A U S T I N A N D L E N T Z
FIG. 9. Contoured fields of (a) the density field, (b) the pressure gradient term ( px), and (c) the Coriolis term (2 fy),21r 0
at 10 inertial periods (after a five inertial period wind event) in the transient case. (d)–(f ) Same as (a)–(c) for downwellingcase.
case. For instance, the measured (modeled) transport inthe base case for upwelling is approximately 2 3 104
m3 s21, whereas for downwelling it is nearly 6 3 104
m3 s21.
g. The inner shelf
The inner shelf, inshore of the upwelling or down-welling front, is a distinct region with characteristicsdetermined by the interplay between stratification, ver-tical mixing, and the cross-shelf circulation. In this re-gion, the stress magnitude is significant relative to thesurface stress throughout the entire water column; thatis, the surface and bottom Ekman layers interact directly.In the absence of any initial stratification, the responseto upwelling and downwelling favorable winds is es-sentially the same except that the circulation patternsare reversed. However, in the stratified case, the innershelf response to upwelling and downwelling favorablewinds is different due to the cross-shelf advection ofdensity.
During upwelling, the inner shelf is characterized by
weak vertical stratification and weak cross-shelf cir-culation (Fig. 2). The weak vertical stratification ismaintained by the onshore flow of denser water nearthe bottom and offshore flow of lighter water near thesurface. The weak vertical stratification inhibits ver-tical mixing. Eddy viscosities, KM (Fig. 6a), from twosites on the inner shelf are smaller at mid depth thanfor the unstratified (neutral) model run. (The site 20km offshore, is offshore of the upwelling front, andhence the dip in the eddy viscosity profile halfwaythrough the water column is due to the strong verticalstratification of the pycnocline.) The reduced eddy vis-cosities at mid depth allow a small stress divergencethat drives a weak cross-shelf circulation, which isstronger (Fig. 4a) than the cross-shelf circulation in theneutral case (dashed curve). In the case of verticallyuniform initial stratification the inner shelf cross-shelfcirculation and stratification are stronger because thereis a continual source of denser water offshore (see sec-tion 4a below).
During downwelling, the inner shelf is unstratifiedand there is almost no cross-shelf circulation. The inner
2184 VOLUME 32J O U R N A L O F P H Y S I C A L O C E A N O G R A P H Y
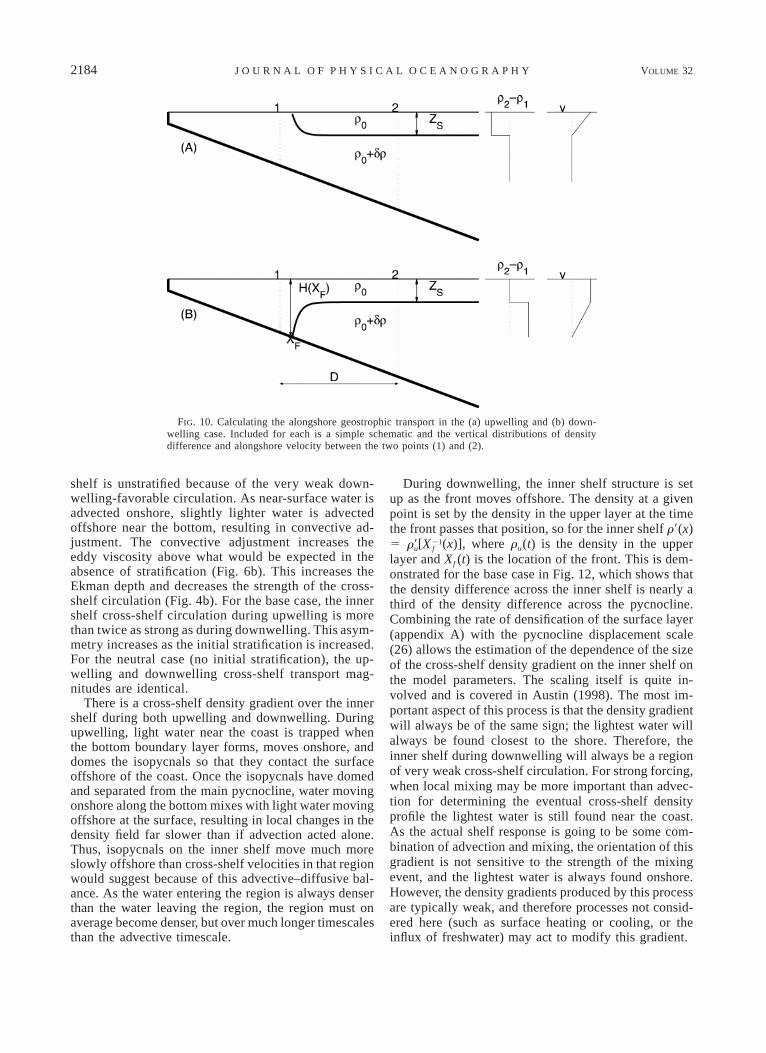
FIG. 10. Calculating the alongshore geostrophic transport in the (a) upwelling and (b) down-welling case. Included for each is a simple schematic and the vertical distributions of densitydifference and alongshore velocity between the two points (1) and (2).
shelf is unstratified because of the very weak down-welling-favorable circulation. As near-surface water isadvected onshore, slightly lighter water is advectedoffshore near the bottom, resulting in convective ad-justment. The convective adjustment increases theeddy viscosity above what would be expected in theabsence of stratification (Fig. 6b). This increases theEkman depth and decreases the strength of the cross-shelf circulation (Fig. 4b). For the base case, the innershelf cross-shelf circulation during upwelling is morethan twice as strong as during downwelling. This asym-metry increases as the initial stratification is increased.For the neutral case (no initial stratification), the up-welling and downwelling cross-shelf transport mag-nitudes are identical.
There is a cross-shelf density gradient over the innershelf during both upwelling and downwelling. Duringupwelling, light water near the coast is trapped whenthe bottom boundary layer forms, moves onshore, anddomes the isopycnals so that they contact the surfaceoffshore of the coast. Once the isopycnals have domedand separated from the main pycnocline, water movingonshore along the bottom mixes with light water movingoffshore at the surface, resulting in local changes in thedensity field far slower than if advection acted alone.Thus, isopycnals on the inner shelf move much moreslowly offshore than cross-shelf velocities in that regionwould suggest because of this advective–diffusive bal-ance. As the water entering the region is always denserthan the water leaving the region, the region must onaverage become denser, but over much longer timescalesthan the advective timescale.
During downwelling, the inner shelf structure is setup as the front moves offshore. The density at a givenpoint is set by the density in the upper layer at the timethe front passes that position, so for the inner shelf r9(x)5 [ (x)], where ru(t) is the density in the upper21r9 Xu f
layer and Xf (t) is the location of the front. This is dem-onstrated for the base case in Fig. 12, which shows thatthe density difference across the inner shelf is nearly athird of the density difference across the pycnocline.Combining the rate of densification of the surface layer(appendix A) with the pycnocline displacement scale(26) allows the estimation of the dependence of the sizeof the cross-shelf density gradient on the inner shelf onthe model parameters. The scaling itself is quite in-volved and is covered in Austin (1998). The most im-portant aspect of this process is that the density gradientwill always be of the same sign; the lightest water willalways be found closest to the shore. Therefore, theinner shelf during downwelling will always be a regionof very weak cross-shelf circulation. For strong forcing,when local mixing may be more important than advec-tion for determining the eventual cross-shelf densityprofile the lightest water is still found near the coast.As the actual shelf response is going to be some com-bination of advection and mixing, the orientation of thisgradient is not sensitive to the strength of the mixingevent, and the lightest water is always found onshore.However, the density gradients produced by this processare typically weak, and therefore processes not consid-ered here (such as surface heating or cooling, or theinflux of freshwater) may act to modify this gradient.
JULY 2002 2185A U S T I N A N D L E N T Z
FIG. 11. The measured alongshore geostrophic transport in the upwelling and downwelling jets compared with the transport scalings withand without mixing. (a) Upwelling, no mixing. (b) Downwelling, no mixing. (c) Upwelling with mixing. (d) Downwelling with mixing.
4. Discussion
a. Continuous stratification
We briefly consider the formation of the inner shelfin the scenario where the water is continuously stratified.By extending the stratification throughout the water col-umn, the upwelling response is changed considerablybut the downwelling response remains largely the same.
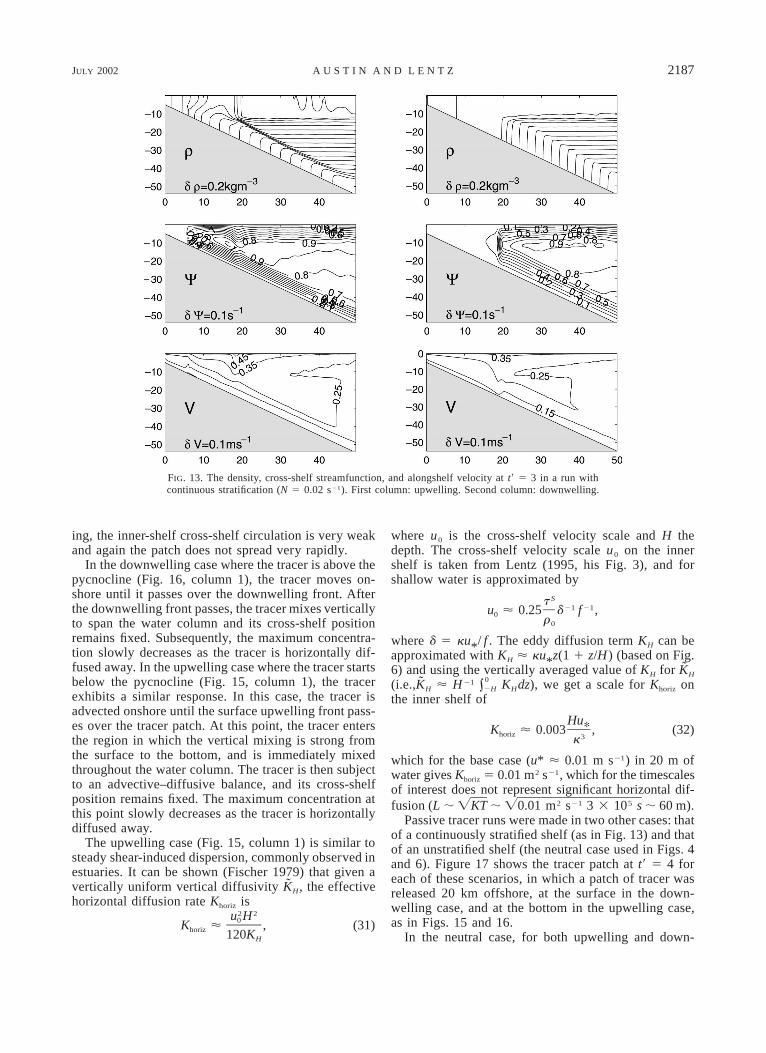
During upwelling (Fig. 13, first column), instead ofthe inner shelf being fed by a body of constant-densitywater as in the two-layered case considered in the pre-vious section, there is a constant supply of increasinglydenser water to the inner shelf. In the case of constantstratification, the inner shelf density and cross-shelf cir-culation are quite different from the two-layer case (Fig.2, t9 5 3). The constant source of buoyancy keeps theinner shelf more strongly stratified, which allows moreof the cross-shelf circulation to extend onshore of theupwelling front. As a result, much of the divergence inthe cross-shelf flow, and hence the upwelling, occursover the inner shelf. The specific character of the near-
shore circulation and the cross-shelf divergence in theEkman layer depends on the relative values of the strat-ification and the slope. Specifically, large Burger num-ber flows (i.e., steep slopes or strong stratification) tendto lead to a shutdown in the bottom boundary layer(MacCready and Rhines 1993), which affects the char-acter of the return flow and, hence, the inner shelf. How-ever, this is beyond the scope of this paper.
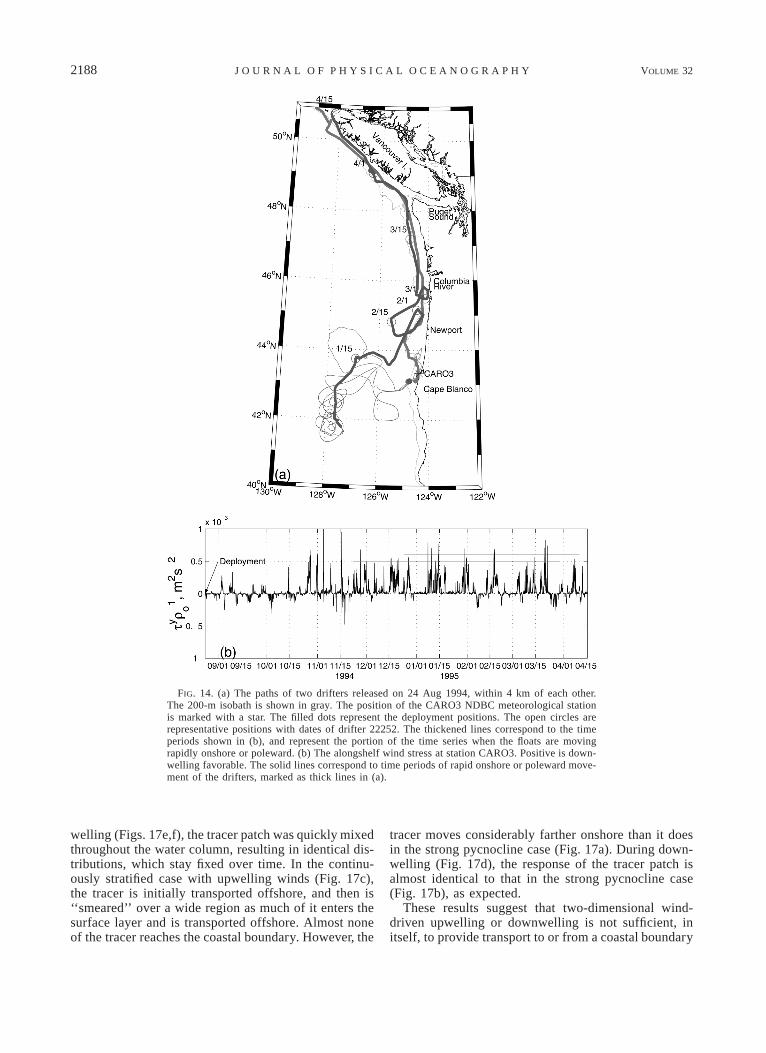
In contrast, during downwelling (Fig. 13, second col-umn), as a surface mixed layer is quickly formed, waterof roughly constant density is driven onshore, forminga downwelling front that moves offshore much like inthe pycnocline case (Fig. 3, t9 5 3). For a wide rangeof parameters, this same inner shelf structure forms dur-ing downwelling. The formation of an inner shelf regionduring downwelling on a stratified shelf may serve asa potential explanation of drifter behavior observed byBarth and Smith (1998). Drifters released during severalwinter seasons off the coast of Oregon (Fig. 14 showstwo drifter paths and the alongshore winds from the1994–95 season) all tended to move onshore during
2186 VOLUME 32J O U R N A L O F P H Y S I C A L O C E A N O G R A P H Y
FIG. 12. Cross-shelf density structure in the model and from scaling on the inner shelf at t9 53. The water on the inner shelf (onshore of the front, in this case approximately 31 km offshore)is vertically homogeneous. The solid lines are the surface and bottom density distributions, asindicated. The initial position of the pycnocline is specified by X0.
downwelling favorable wind events (the prevalent forc-ing during the winter). The drifters would approach thecoast, then rapidly be advected northward, maintaininga roughly constant distance from the coast. It appearsthat once drifters pass over the cross-shelf position ofthe downwelling front, the cross-shelf velocities theyare subjected to are very small, and they maintain theircross-shelf displacement over alongshore distances ofseveral hundred kilometers, even in the presence of sig-nificant downwelling-favorable winds. A more completeanalysis of the behavior of drifter motion over theOregon–Washington shelf during downwelling-favor-able winds is forthcoming (Austin and Barth 2002, man-uscript submitted to J. Phys. Oceanogr.).
b. Cross-shelf particle transport
A major objective of the CoOP Inner Shelf Study(Butman 1994) was to develop and test hypotheses con-cerning the cross-shelf transport of planktonic larvae.To establish a ‘‘baseline’’ hypothesis concerning cross-shelf transport on a two-layered shelf, model runs that
included a passive tracer release were conducted. Twoseparate configurations were tested, both intent on ex-ploring potential wind-driven processes that bring lar-vae to or away from the coastal boundary. In the firstexperiment, a patch of uniform concentration tracer wasplaced in the nearest 2 km to shore (Figs. 15 and 16,column 2). In the second experiment, a patch of uniformconcentration tracer is placed below the pycnocline forupwelling and above the pycnocline for downwelling,between 20 km and 22 km offshore (Figs. 15 and 16,column 1). Passive tracers started offshore above thepycnocline during upwelling or below the pycnoclineduring downwelling simply moved offshore at approx-imately the speed of the front (not shown). Results aresimilar for upwelling and downwelling.
In the case in which the tracer starts at the coast, itdoes not escape the nearshore region to be transportedoffshore. In the upwelling case the tracer patch istrapped inside the location of the initial pycnoclineshoaling and is subject to the same advective–diffusivebalance as the density field. Consequently it does notspread offshore very rapidly. In the case of downwell-
JULY 2002 2187A U S T I N A N D L E N T Z
FIG. 13. The density, cross-shelf streamfunction, and alongshelf velocity at t9 5 3 in a run withcontinuous stratification (N 5 0.02 s21). First column: upwelling. Second column: downwelling.
ing, the inner-shelf cross-shelf circulation is very weakand again the patch does not spread very rapidly.
In the downwelling case where the tracer is above thepycnocline (Fig. 16, column 1), the tracer moves on-shore until it passes over the downwelling front. Afterthe downwelling front passes, the tracer mixes verticallyto span the water column and its cross-shelf positionremains fixed. Subsequently, the maximum concentra-tion slowly decreases as the tracer is horizontally dif-fused away. In the upwelling case where the tracer startsbelow the pycnocline (Fig. 15, column 1), the tracerexhibits a similar response. In this case, the tracer isadvected onshore until the surface upwelling front pass-es over the tracer patch. At this point, the tracer entersthe region in which the vertical mixing is strong fromthe surface to the bottom, and is immediately mixedthroughout the water column. The tracer is then subjectto an advective–diffusive balance, and its cross-shelfposition remains fixed. The maximum concentration atthis point slowly decreases as the tracer is horizontallydiffused away.
The upwelling case (Fig. 15, column 1) is similar tosteady shear-induced dispersion, commonly observed inestuaries. It can be shown (Fischer 1979) that given avertically uniform vertical diffusivity KH, the effectivehorizontal diffusion rate Khoriz is
2 2u H0K ø , (31)horiz 120KH
where u0 is the cross-shelf velocity scale and H thedepth. The cross-shelf velocity scale u0 on the innershelf is taken from Lentz (1995, his Fig. 3), and forshallow water is approximated by
St21 21u ø 0.25 d f ,0 r 0
where d 5 ku*/ f . The eddy diffusion term KH can beapproximated with KH ø ku*z(1 1 z/H) (based on Fig.6) and using the vertically averaged value of KH for KH
(i.e.,KH ø H21 KHdz), we get a scale for Khoriz on0#2H
the inner shelf of
Hu*K ø 0.003 , (32)horiz 3k
which for the base case (u* ø 0.01 m s21) in 20 m ofwater gives Khoriz 5 0.01 m2 s21, which for the timescalesof interest does not represent significant horizontal dif-fusion (L ; ; ; 60 m).2 21 5ÏKT Ï0.01 m s 3 3 10 s
Passive tracer runs were made in two other cases: thatof a continuously stratified shelf (as in Fig. 13) and thatof an unstratified shelf (the neutral case used in Figs. 4and 6). Figure 17 shows the tracer patch at t9 5 4 foreach of these scenarios, in which a patch of tracer wasreleased 20 km offshore, at the surface in the down-welling case, and at the bottom in the upwelling case,as in Figs. 15 and 16.
In the neutral case, for both upwelling and down-
2188 VOLUME 32J O U R N A L O F P H Y S I C A L O C E A N O G R A P H Y
FIG. 14. (a) The paths of two drifters released on 24 Aug 1994, within 4 km of each other.The 200-m isobath is shown in gray. The position of the CARO3 NDBC meteorological stationis marked with a star. The filled dots represent the deployment positions. The open circles arerepresentative positions with dates of drifter 22252. The thickened lines correspond to the timeperiods shown in (b), and represent the portion of the time series when the floats are movingrapidly onshore or poleward. (b) The alongshelf wind stress at station CARO3. Positive is down-welling favorable. The solid lines correspond to time periods of rapid onshore or poleward move-ment of the drifters, marked as thick lines in (a).
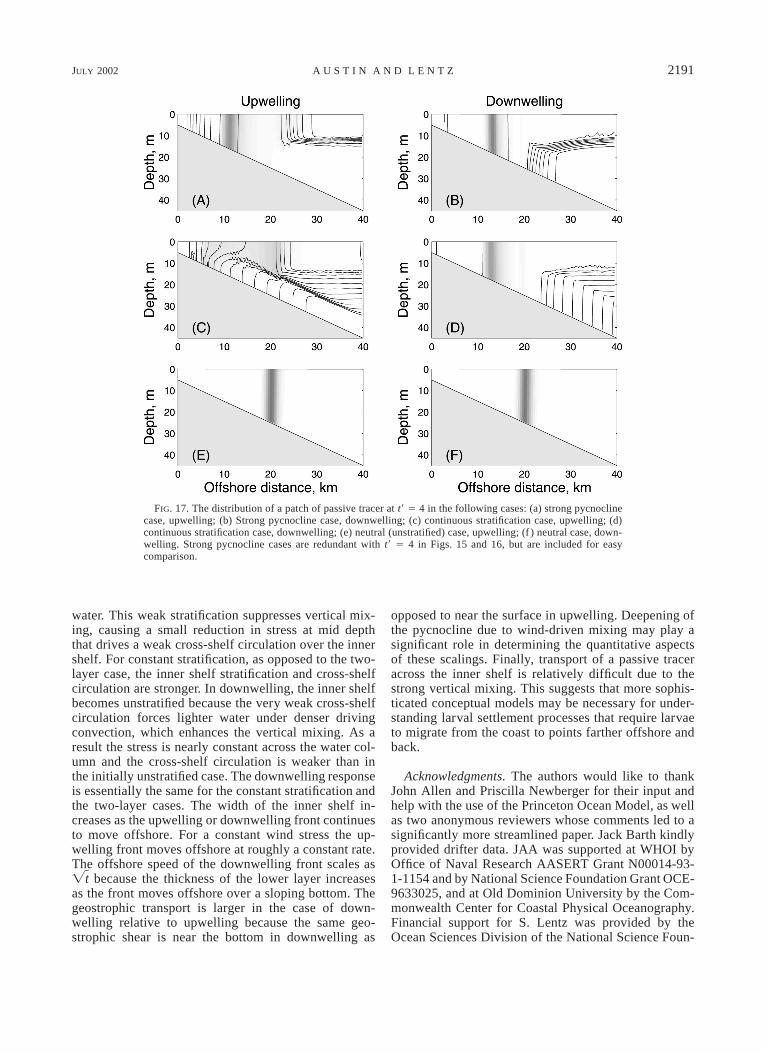
welling (Figs. 17e,f), the tracer patch was quickly mixedthroughout the water column, resulting in identical dis-tributions, which stay fixed over time. In the continu-ously stratified case with upwelling winds (Fig. 17c),the tracer is initially transported offshore, and then is‘‘smeared’’ over a wide region as much of it enters thesurface layer and is transported offshore. Almost noneof the tracer reaches the coastal boundary. However, the
tracer moves considerably farther onshore than it doesin the strong pycnocline case (Fig. 17a). During down-welling (Fig. 17d), the response of the tracer patch isalmost identical to that in the strong pycnocline case(Fig. 17b), as expected.
These results suggest that two-dimensional wind-driven upwelling or downwelling is not sufficient, initself, to provide transport to or from a coastal boundary
JULY 2002 2189A U S T I N A N D L E N T Z
FIG. 15. Evolution of a passive tracer patch during base case upwelling at t9 5 0, 1, 2, 3, 4. Shadingrepresents tracer concentration, contours are isopycnals. Column 1: Tracer patch initially below pycnoclineand offshore of upwelling front. Column 2: Tracer patch initially uniform over nearest 2 km to shore.
on a strongly two-layered shelf such as that off of theeast coast of the United States. This is not to say, ofcourse, that such transport does not or cannot occur.However, this places a larger burden of explanation oninvestigators who have, in the past, attributed such trans-port to simple two-dimensional wind-driven upwellingor downwelling. It must be combined with one of sev-eral possible supplemental mechanisms. Two likely can-didates are planktonic swimming behavior (notably, ver-
tical migration behavior) and alongshelf variation. Ver-tical migration behavior could play a role if, for in-stance, plankton were for some reason likely to swimtoward the bottom during upwelling. If the swimmingwas sufficiently strong to overcome the effects of ver-tical mixing, then the plankton would spend a dispro-portionate amount of time in the lower layer, and hencein water moving onshore. This may also work to theadvantage of species who must remain near the coastal
2190 VOLUME 32J O U R N A L O F P H Y S I C A L O C E A N O G R A P H Y
FIG. 16. Evolution of a passive tracer patch during base-case downwelling at t9 5 0, 1, 2, 3, 4. Shadingrepresents tracer concentration, contours are isopycnals. Column 1: tracer patch initially above pycnoclineand offshore of downwelling front. Column 2: Tracer patch initially uniform over nearest 2 km to shore.
boundary for their survival; the ‘‘nonleaky’’ characterof the inner shelf may help to keep some species nearthe coastal boundary.
5. Summary
Idealized numerical model studies of two-dimension-al upwelling and downwelling on a strongly stratified(two-layered) shelf are used to understand various as-
pects of the formation and characteristics of the innershelf. For the unstratified case, the response to upwell-ing- and downwelling-favorable winds is essentially thesame except the direction of the circulation is reversed.However, with stratification there are notable differencesin the characteristics of the upwelling and downwellingfronts and the inner shelf region inshore of the front.In upwelling, weak stratification is maintained over theinner shelf by the onshore flux of denser near-bottom
JULY 2002 2191A U S T I N A N D L E N T Z
FIG. 17. The distribution of a patch of passive tracer at t9 5 4 in the following cases: (a) strong pycnoclinecase, upwelling; (b) Strong pycnocline case, downwelling; (c) continuous stratification case, upwelling; (d)continuous stratification case, downwelling; (e) neutral (unstratified) case, upwelling; (f ) neutral case, down-welling. Strong pycnocline cases are redundant with t9 5 4 in Figs. 15 and 16, but are included for easycomparison.
water. This weak stratification suppresses vertical mix-ing, causing a small reduction in stress at mid depththat drives a weak cross-shelf circulation over the innershelf. For constant stratification, as opposed to the two-layer case, the inner shelf stratification and cross-shelfcirculation are stronger. In downwelling, the inner shelfbecomes unstratified because the very weak cross-shelfcirculation forces lighter water under denser drivingconvection, which enhances the vertical mixing. As aresult the stress is nearly constant across the water col-umn and the cross-shelf circulation is weaker than inthe initially unstratified case. The downwelling responseis essentially the same for the constant stratification andthe two-layer cases. The width of the inner shelf in-creases as the upwelling or downwelling front continuesto move offshore. For a constant wind stress the up-welling front moves offshore at roughly a constant rate.The offshore speed of the downwelling front scales as
because the thickness of the lower layer increasesÏtas the front moves offshore over a sloping bottom. Thegeostrophic transport is larger in the case of down-welling relative to upwelling because the same geo-strophic shear is near the bottom in downwelling as
opposed to near the surface in upwelling. Deepening ofthe pycnocline due to wind-driven mixing may play asignificant role in determining the quantitative aspectsof these scalings. Finally, transport of a passive traceracross the inner shelf is relatively difficult due to thestrong vertical mixing. This suggests that more sophis-ticated conceptual models may be necessary for under-standing larval settlement processes that require larvaeto migrate from the coast to points farther offshore andback.
Acknowledgments. The authors would like to thankJohn Allen and Priscilla Newberger for their input andhelp with the use of the Princeton Ocean Model, as wellas two anonymous reviewers whose comments led to asignificantly more streamlined paper. Jack Barth kindlyprovided drifter data. JAA was supported at WHOI byOffice of Naval Research AASERT Grant N00014-93-1-1154 and by National Science Foundation Grant OCE-9633025, and at Old Dominion University by the Com-monwealth Center for Coastal Physical Oceanography.Financial support for S. Lentz was provided by theOcean Sciences Division of the National Science Foun-
2192 VOLUME 32J O U R N A L O F P H Y S I C A L O C E A N O G R A P H Y
dation as part of the Coastal Ocean Processes programunder Grants OCE-9221615 and OCE-9633025.
APPENDIX
The Role of Mixing
The assumption that the surface mixed layer depth isapproximately Z0 1 DZ/2 breaks down when there issignificant deepening of the mixed layer. This can bequantified by comparing the amount of deepening dur-ing a model run to the initial thickness of the surfacemixed layer. The amount of deepening can be estimatedand scaled empirically from the model data. No previouswork on mixed layer development addresses the specificconfiguration used in this modeling study, but a fewpapers address similar scenarios. Perhaps the closest isthat of Trowbridge (1992), who solved for the deepeningof a surface mixed layer due to the input of surfacestress in the absence of rotation. The scaling that Trow-bridge proposes for the deepening rate:
1/2 23 Ri u*ch 5 , (A1)t 1/22 B
where B 5 r21 g # dr dz is the integrated buoyancyanomaly of the upper layer, Ric 5 1/4 is a critical Richardson number, and u* 5 is the surface friction21 sÏr t0
velocity, agrees qualitatively with the modeled deep-ening rate. However, by comparing this scaling to thatmodeled in a set of runs with a wide range of initialparameters, the quantitative rate of deepening in themodel tends to be about 5% of that predicted by thisscaling. This may be due to the absence of rotation inthe Trowbridge scaling, or the fact that the initial con-dition is different, with Trowbridge (1992) assuming atwo-layered fluid, while the model has a strong pyc-nocline. The deepening rate in the model runs can thenbe estimated as
1/2 23 Ri u*ch 5 b , (A2)t 1/22 B
where b 5 0.05 is a proportionality constant. The buoy-ancy B is constant in time since the density differencelessens as the depth of the mixed layer deepens. Thisimplies that the deepening rate should be approximatelyconstant in time, and that the amount of deepening istherefore proportional to the duration of the wind event.This scaling is not appropriate when surface heat fluxplays a major role in determining the mixed layer depth(Price et al. 1986), but it does allow inconsistenciesbetween the analytical scalings and the model runs tobe rationalized in this particular scenario.
The appropriate scaling, to determine whether a givenmodel run is going to experience significant deepening, is
h Dtt , (A3)ZS
where Dt is the duration of the run. If this fraction islarge, the deepening is significant compared to the initialmixed layer depth. Conversely, if it is small, the deep-ening does not significantly affect the model response.For the base case, for a model run of five days, thisvalue is 0.4, suggesting that the mixed layer deepensaround 4 m over the course of the model run, and thatthe velocity estimate should be an overestimate by ap-proximately 20%. For runs with stronger forcing or lessstratification, the deepening should be proportionallygreater.
REFERENCES
Allen, J. S., and P. A. Newberger, 1996: Downwelling circulation onthe Oregon continental shelf. Part I: Response to idealized forc-ing. J. Phys. Oceanogr., 26, 2011–2035.
——, ——, and J. Federiuk, 1995: Upwelling circulation on theOregon continental shelf. Part I: Response to idealized forcing.J. Phys. Oceanogr., 25, 1843–1866.
Austin, J. A., 1998: Wind-driven circulation on a shallow, stratifiedshelf. Ph.D. thesis, Massachusetts Institute of Technology–WoodsHole Oceanographic Institution, MIT/WHOI 98-19, 243 pp.
——, and S. J. Lentz, 1999: The relationship between synoptic weath-er systems and meteorological forcing on the North CarolinaInner Shelf. J. Geophys. Res., 104, 18 159–18 185.
Barth, J. A., and R. L. Smith, 1998: Separation of a coastal upwellingjet at Cape Blanco, Oregon, USA. Benguela Dynamics: Impactsof Variability on Shelf-Sea Environments and their Living Re-sources. S. C. Pillar, et al., Eds., S. Afr. J. Mar. Sci., 19, 5–14.
Blumberg, A. F., and G. L. Mellor, 1987: A description of a three-dimensional coastal ocean circulation model. Three DimensionalCoastal Ocean Models, N. Heaps, Ed., Coastal and EstuarineScience Series, Vol. 4, Amer. Geophys. Union, 1–16.
Butman, C. A., 1994: CoOP: Coastal Ocean Processes Study, inter-disciplinary approach, new technology to determine coupled bi-ological, physical, geological processes affecting larval transporton inner shelf. Sea Technol., 35, 44–49.
Chen, D., and D.-P. Wang, 1990: Simulating the time-variable coastalupwelling during CODE-2. J. Mar. Res., 48, 335–358.
Dever, E. P., 1997: Wind-forced cross-shelf circulation on the northernCalifornia shelf. J. Phys. Oceanogr., 27, 1566–1580.
Ekman, V. W., 1905: On the influence of the earth’s rotation on ocean-currents. Arkiv Math., Astro. Fys., 2, 1–53.
Fairall, C. W., E. F. Bradley, D. P. Rogers, J. B. Edson, and G. S.Young, 1996: Bulk parameterization of air–sea fluxes for Trop-ical Ocean–Global Atmospheric Coupled-Ocean AtmosphericResponse Experiment. J. Geophys. Res., 101, 3747–3764.
Fischer, H., 1979: Mixing in Inland and Coastal Waters. AcademicPress, 483 pp.
Foo, E.-C., 1981: A two-dimensional diabatic isopycnal model—Sim-ulating the coastal upwelling front. J. Phys. Oceanogr., 11, 604–626.
Galperin, B., L. H. Kantha, S. Hassid, and A. Rosati, 1988: A quasi-equilibrium turbulent energy model for geophysical flows. J.Atmos. Sci., 45, 55–62.
Hamilton, P., and M. Rattray Jr., 1978: A numerical model of thedepth-dependent, wind-driven upwelling circulation on a con-tinental shelf. J. Phys. Oceanogr., 8, 437–457.
Kundu, P. K., 1984: Numerical calculations of coastal flow with tur-bulent dynamics. Deep-Sea Res., 31, 39–60.
Lentz, S. J., 1992: The surface boundary layer in coastal upwellingsystems. J. Phys. Oceanogr., 22, 1517–1539.
——, 1995: Sensitivity of the inner-shelf circulation to the form ofthe eddy viscosity profile. J. Phys. Oceanogr., 25, 19–28.
——, 2001: The influence of stratification on the wind-driven cross-
JULY 2002 2193A U S T I N A N D L E N T Z
shelf circulation over the North Carolina Shelf. J. Phys. Ocean-ogr., 31, 2749–2760.
MacCready, P., and P. B. Rhines, 1993: Slippery bottom boundarylayers on a slope. J. Phys. Oceanogr., 23, 5–22.
Mellor, G. L., and T. Yamada, 1982: Development of a turbulenceclosure model for geophysical fluid problems. Rev. Geophys.Space Phys., 20, 851–875.
Price, J. F., R. A. Weller, and R. Pinkel, 1986: Diurnal cycling: Ob-servations and models of the upper ocean response to diurnalheating, cooling, and wind mixing. J. Geophys. Res., 91, 8411–8427.
Send, U., R. C. Beardsley, and C. D. Winant, 1987: Relaxation fromupwelling in the Coastal Ocean Dynamics Experiment. J. Phys.Oceanogr., 17, 1683–1698.
Smith, R. L., 1995: The physical processes of coastal ocean upwellingsystems. Upwelling in the Ocean: Modern Processes and AncientRecords, C. P. Summerhayes, K.-C. Emeis, M. V. Angel, R. L.Smith, and B. Zeitzschel, Eds., John Wiley and Sons, 39–64.
Trowbridge, J. H., 1992: A simple description of the deepening andstructure of a stably stratified flow driven by a surface stress. J.Geophys. Res., 97, 15 529–15 543.