Ž . Chemical Physics 233 1998 231–242 The intermolecular interaction mechanisms in liquid CS at 295 2 and 165 K probed with two-dimensional Raman spectroscopy A. Tokmakoff, M.J. Lang, X.J. Jordanides, G.R. Fleming ) Department of Chemistry and the James Franck Institute, UniÕersity of Chicago, 5735 S. Ellis AÕe., Chicago, IL 60637, USA Received 20 October 1997 Abstract Two-dimensional Raman spectroscopy is used to probe the intermolecular interaction dynamics of CS at 295 and 165 K. 2 The influence of nonlinear polarizability and liquid anharmonicity on the observable is discussed. It is found that the response at both temperatures is dominated by the nonlinear polarizability, which is most likely due to interaction-induced effects. A model using three Brownian oscillators to represent the collective motions on three time scales is unable to reproduce the 295 K data. At low temperature, the model presumably works better as a result of the time-scale separation between the inertial and diffusive dynamics. q 1998 Elsevier Science B.V. All rights reserved. 1. Introduction Building an understanding of physical processes and chemical reactions in condensed phases requires a microscopic description of dynamics between and Ž within molecules. Since measurements of bulk en- . semble averaged dynamics are not necessarily rep- resentative of all microscopic motions it is funda- mentally difficult to draw conclusions about the molecular dynamics. More specifically, most mea- surements of bulk dynamics can be related to an ensemble-averaged two-point correlation function, or equivalently a frequency domain spectral density, which are necessarily insensitive to distributions or w x interactions within the ensemble 1–3 . Techniques in this category that probe the collective dynamics of condensed phases include all forms of light, X-ray, or neutron scattering, dielectric relaxation, far-in- ) Corresponding author. Present address: Department of Chem- istry, University of California, Berkeley, CA, 94720-1460, USA. frared or terahertz absorption, and most spectro- wx scopies on electronic chromophores 4 . To better characterize the molecular motions requires measure- ments that define the makeup of the ensemble and define interactions between particular dynamics or time-scales. This type of information requires mea- surements of a higher dimensionality, those tech- niques that probe three-point or higher order correla- wx tion functions for molecular motions 5 . Much recent interest has been focused on fifth w x order Raman spectroscopy for this reason 2,3,6–17 . Ž . It is a two-dimensional 2D vibrational spectroscopy that allows the interactions between nuclear coordi- nates to be observed. Analogously to 2D NMR, the use of 2D Raman spectroscopy on well-defined high frequency vibrational motions allows the couplings between nuclear degrees of freedom to be quantified w x 12 . As an optical rephasing technique, it is also w x sensitive to heterogeneous dynamics 2,3 . In this paper the technique is used to study the mechanisms of intermolecular interactions in liquid CS . 2 0301-0104r98r$19.00 q 1998 Elsevier Science B.V. All rights reserved. Ž . PII: S0301-0104 98 00026-3
Transcript
Ž .Chemical Physics 233 1998 231–242
The intermolecular interaction mechanisms in liquid CS at 2952
and 165 K probed with two-dimensional Raman spectroscopy
A. Tokmakoff, M.J. Lang, X.J. Jordanides, G.R. Fleming )
Department of Chemistry and the James Franck Institute, UniÕersity of Chicago, 5735 S. Ellis AÕe., Chicago, IL 60637, USA
Received 20 October 1997
Abstract
Two-dimensional Raman spectroscopy is used to probe the intermolecular interaction dynamics of CS at 295 and 165 K.2
The influence of nonlinear polarizability and liquid anharmonicity on the observable is discussed. It is found that theresponse at both temperatures is dominated by the nonlinear polarizability, which is most likely due to interaction-inducedeffects. A model using three Brownian oscillators to represent the collective motions on three time scales is unable toreproduce the 295 K data. At low temperature, the model presumably works better as a result of the time-scale separationbetween the inertial and diffusive dynamics. q 1998 Elsevier Science B.V. All rights reserved.
1. Introduction
Building an understanding of physical processesand chemical reactions in condensed phases requiresa microscopic description of dynamics between and
Žwithin molecules. Since measurements of bulk en-.semble averaged dynamics are not necessarily rep-
resentative of all microscopic motions it is funda-mentally difficult to draw conclusions about themolecular dynamics. More specifically, most mea-surements of bulk dynamics can be related to anensemble-averaged two-point correlation function, orequivalently a frequency domain spectral density,which are necessarily insensitive to distributions or
w xinteractions within the ensemble 1–3 . Techniquesin this category that probe the collective dynamics ofcondensed phases include all forms of light, X-ray,or neutron scattering, dielectric relaxation, far-in-
) Corresponding author. Present address: Department of Chem-istry, University of California, Berkeley, CA, 94720-1460, USA.
frared or terahertz absorption, and most spectro-w xscopies on electronic chromophores 4 . To better
characterize the molecular motions requires measure-ments that define the makeup of the ensemble anddefine interactions between particular dynamics ortime-scales. This type of information requires mea-surements of a higher dimensionality, those tech-niques that probe three-point or higher order correla-
w xtion functions for molecular motions 5 .Much recent interest has been focused on fifth
w xorder Raman spectroscopy for this reason 2,3,6–17 .Ž .It is a two-dimensional 2D vibrational spectroscopy
that allows the interactions between nuclear coordi-nates to be observed. Analogously to 2D NMR, theuse of 2D Raman spectroscopy on well-defined highfrequency vibrational motions allows the couplingsbetween nuclear degrees of freedom to be quantifiedw x12 . As an optical rephasing technique, it is also
w xsensitive to heterogeneous dynamics 2,3 . In thispaper the technique is used to study the mechanismsof intermolecular interactions in liquid CS .2
0301-0104r98r$19.00 q 1998 Elsevier Science B.V. All rights reserved.Ž .PII: S0301-0104 98 00026-3
( )A. Tokmakoff et al.rChemical Physics 233 1998 231–242232
The 2D fifth order Raman experiment is shownschematically in Fig. 1. A series of five nonresonantfemtosecond pulses are incident on a sample. Thesepulses are used to create multilevel vibrational co-herences in all Raman active modes within the band-width of the excitation pulses, typically -500 cmy1.Two initial excitation pulses excite vibrational coher-
< :² <ences a b at time t . After a delay time t , a0 2
second Raman interaction allows the initial coher-ence to be transferred to new coherences involving a
< :third state c . The new coherence then evolves overa second period t until the fifth pulse probes it.4
Two possible interaction sequences corresponding toa rephasing and nonrephasing pathway are shown inFig. 1b and c, respectively.
The existence of the fifth order signal is an indica-< :tion that coherent superpositions between the a ,
< : < :b and c states can be formed. In fact, a fifthorder signal cannot be described by transitions on asingle vibrational state, but requires the interaction oftwo states. This is reflected in the three-point polar-izability correlation function that describes the fifth
w xorder Raman response 2
RŽ5. t ,tŽ .2 4
1sy a t qt ,a t ,a 0 1² :Ž . Ž . Ž . Ž .˜ ˜ ˜4 2 22
"
For any standard linear model based on harmonicoscillators this correlation function is zero. 2D Ra-man spectroscopy is a powerful technique primarilybecause of this two-state requirement. The existenceof a fifth order signal implies a nonlinearity orcoupling in the vibrational modes that are excited.
Ž .Fig. 1. a The time variables for the 2D fifth order RamanŽ .experiment. b,c Two representative ladder diagrams for pro-
cesses contributing to the fifth order signal.
Two particular coupling mechanisms have beenŽ .described as contributing to the fifth order signal: 1
A nonlinear dependence of the system polarizabilityŽ .on its nuclear coordinates, and 2 anharmonicity of
w xthe liquid potential 10–12,17 . The influence ofthese two interaction mechanisms on the signal char-acteristics of high frequency vibrational modes has
w xbeen discussed previously 12–14,17 . Of particularinterest now is the ability to distinguish these cou-pling mechanisms and their influence on intermolec-ular motions.
In this paper, we use 2D Raman experiments tostudy these interaction mechanisms in the inter-molecular motions in CS at room temperature and2
at 165 K. The emphasis is on understanding whichintermolecular interaction mechanisms are present inliquid CS , and the effectiveness of the existing2
theoretical models for describing liquid dynamics.The nonlinear polarizability mechanism is found tobe dominant in CS at both temperatures. An asym-2
metry is present in the 2D responses that cannot bedescribed by a small set of coupled Brownian oscil-lators, and indicates a need for an approach thatreflects the continuous evolution of the liquid struc-ture. At low temperature this model works better,presumably due to the time-scale separation betweenthe inertial and diffusive dynamics. Previous fifthorder Raman experiments on the intermolecular mo-tions of CS have interpreted the signal in terms of2
distributions of spatially varying dynamics in a man-ner that is similar to inhomogeneous line shape
w xanalysis 3,6–8 . Here, we show that these analysesare a special case of the coupling models describedabove and that the matrix of coupling elements is ameasure of such effects.
2. Theoretical background
Of fundamental importance in obtaining molecu-lar information from a Raman signal is relating thepolarizability observable to nuclear coordinates. Thegeneration of fifth order Raman signals is due to anonlinearity in the vibrational modes excited in theexperiment. In this paper we examine the two typesof nonlinearity that have been proposed and exploredtheoretically for their relationship to the nuclear co-
w xordinates 10–12,18 .
( )A. Tokmakoff et al.rChemical Physics 233 1998 231–242 233
For discussing the origin of a Raman signal froma harmonic oscillator, it is common to postulate aweak linear dependence of the polarizability on anuclear coordinate. In this case, the nested commuta-
Ž Ž ..tor Eq. 1 which describes the fifth order Ramansignal vanishes. For the same harmonic system it ispossible to postulate an origin to the fifth ordersignal by expanding the polarizability of the systemin its coordinates
Eaasa q q qŽ .˜ ˜ Ý0 iž /Eqi qi 0
21 E aq q q q . . . 2aŽ .Ý i jž /2 Eq Eqi jij q0
sa Ž0.qa Ž1.q qa Ž2.q q q . . . 2bŽ .i i i j i j
Here, a Ž2. is the first nonlinear polarizability expan-sion matrix. This expansion is inherently time-inde-pendent and therefore a Ž2. is diagonally symmetric.Within the assumption that the expansion coeffi-cients a Ž1.
4a Ž2., one can show that the leadingi i j
contributions to the signal arise from correlationfunctions which involve one two-quantum interac-
Ž1. Ž1. Ž2. ww Žtion. An example is ya a a - q t qi j i j i 2. Ž . Ž .x Ž .x 2t q t qt ,q t ,q 0 )r" , in which the two4 j 2 4 i 2 j
initial interactions are one quantum transitions, whilethe probing step involves two. Such a process ispictured in Fig. 1c.
The nonlinearity in the vibration can also beintroduced by introducing anharmonicity into theground state Hamiltonian. If the potential is ex-panded about its minimum q , it can be shown that0
the dominant fifth order signal contributions arisefrom correlation functions that are proportional tothe expansion coefficients of the cubic anharmonic-ity
31 E VŽ3.V s q q q 3aŽ .Ý i j kž /6 Eq Eq Eqi j kijk q0
sg Ž3. q q q 3bŽ .i jk i j k
Here, g Ž3. is the cubic anharmonicity tensor which isalso symmetric to interchange of indices. The corre-lation functions in this case are of the formŽ3. Ž1. Ž1. Ž1. ww Ž . Ž .x Ž .xg a a a - q t q t ,q t ,q 0 ) , ini jk i j k i 2 4 j 2 k
which the coordinates q are now not in a harmonici
basis but represent the anharmonically mixed states.
Under the circumstances described above, thedominant term in the third order response is given bya sum over the individual responses of the ensemble
Ž3. Ž1. Ž1.R t s2 a a C t 4Ž . Ž . Ž .Ý i i ii
where C is the correlation function for a giveni
vibrational mode. The same expression is obtainedfor a linear harmonic system. The nonlinearitiesdescribed above contribute additional terms propor-tional to a Ž2.a Ž2. and g Ž3. a Ž1.a Ž2., which are as-i j i j i jk j i j
sumed to be negligible.Keeping only the leading terms, it can be shown
that if both nonlinearities described are present, thefifth order response can be written as a sum ofcontributions due to the nonlinear polarizability andanharmonic potential of the system
RŽ5. t ,t sRŽ5. t ,t qRŽ5. t ,t 5Ž . Ž . Ž . Ž .2 4 NP 2 4 AN 2 4
Each signal contribution is given by a sum overcorrelation functions
Ž5. Ž5.R t ,t s R t ,t 6Ž . Ž . Ž .ÝNP 2 4 NP , i j 2 4ij
Ž5. Ž5.R t ,t s R t ,t 7Ž . Ž . Ž .ÝAN 2 4 AN, i jk 2 4ijk
The individual 2D signal contributions are given byw x18
RŽ5. t ,t s8a Ž2.a Ž1.a Ž1.C tŽ . Ž .NP , i j 2 Ž4. i j i j i 4
= C t qC t qt 8Ž . Ž . Ž .Ž .j 2 j 2 4
t4Ž5. Ž3. Ž1. Ž1. Ž1.R t ,t s48 g a a a dt C t ytŽ . Ž .HAN , i jk 2 4 i jk i j k i 40
=C t C t qt 9Ž . Ž . Ž .j k 2
From these expressions for the fifth order response itis clear that for a given set of basis modes, the 2Dfifth order Raman response is described by a linearcombination of their 2D responses weighted by thecoupling elements a Ž2. or g Ž3..i j i jk
Ž .Eq. 8 is a generalization of the previously de-rived fifth order response based on a nonlinear polar-
w xizability 2 . The interpretation of fifth order datawithin the traditional line shape classifications of‘homogeneous’ and ‘inhomogeneous’ are limitingcases of these expressions. The inhomogeneous caseis described by decoupling all basis modes that
( )A. Tokmakoff et al.rChemical Physics 233 1998 231–242234
Ž Ž2. Ž1. Ž1..describe the 1D response a s d a a ,i j i j i j
whereas the traditional homogeneous case is repre-Ž Ž2. Ž1. Ž1..sented by fully coupling all modes a sa a .i j i j
The same limits hold for the anharmonic couplingcase where the homogeneous and inhomogeneouslimits are given by g Ž3.Aa Ž1.a Ž1.a Ž1. and g Ž3.Ai jk i j k i jk
d d a Ž1.a Ž1.a Ž1..i j jk i j k
For interpreting the data below, we use the Brow-nian oscillator model, which allows qualitative de-scription of collective intermolecular motions cou-pled to a harmonic bath, varying from overdamped
w xto underdamped 5 :
C t sh sin V t exp yL t 10Ž . Ž . Ž .Ž .i i j i
2 2(Here, h sy"r2m V , V s v yL is the re-i i i i i i
duced frequency, and L sg r2 is the dampingi i
constant. Within this model, the temporal behaviorof the nonlinear polarizability contribution is appar-
Ž .ent from Eq. 8 . The anharmonic contribution canbe evaluated as
RŽ5. t ,tŽ .AN , i jk 2 4
s12 g Ž3. a Ž1.a Ž1.a Ž1.h h hi jk i j k i j k
=exp yL tŽ .k 2Ý 2 2G qji jk i jk ,ababs"1
= ab exp y L qL tŽ .Ž .k j 4
= j cos V t qt qbV tŽ .Ž .Ž i jk ,ab k 2 4 j 4
qG sin V t qt qbV tŽ .Ž . .i jk k 2 4 j 4
yb exp yL t j cos aV t qV tŽ . Ž .Ži 4 i jk ,ab k 2 i 4
qG sin aV t qV t 11Ž . Ž ..i jk k 2 i 4
Ž . Žwith j s V yabV yaV and G s L yi jk ,ab i j k i jk i.L yL .j k
Ž . Ž .In the limit of a single mode is jsk , Eq. 11w xis equivalent to that derived previously 11,13 . The
lack of temperature dependence to the anharmonicresponse arises from the assumption that the anhar-monicity is a weak perturbation to the harmonicsystem.
Unlike 2D NMR, the Hamiltonian for describingvibrational systems in a 2D vibrational spectroscopyare significantly more complicated. The two vibra-tional mode interaction mechanisms described aboveare the only contributions that have been discussedthus far, but other coupling mechanisms should be
investigated. While it can be argued that these effectsmay be small, it would still be important to investi-gate the role of Coriolis or centrifugal couplings onthe 2D Raman experiment.
3. Experimental
One- and two-dimensional Raman experimentswere performed with a regeneratively amplifiedTi:sapphire laser producing Gaussian pulses of 47 fs
w xduration at 3.8 kHz 19 . This pulse duration gives abroad enough bandwidth to excite all intermolecularmotions in CS , but not intramolecular vibrations.2
All measurements were made with parallel polariza-tions. One-dimensional Raman responses of the in-termolecular motions of CS were taken using a2
nonresonant pump-probe experiment. A 0.5 mJ pumpand probe beam were focused with a 30 cm singletto 270 mm in a 1 mm fused silica cuvette of multiplyfiltered CS . The pump beam was chopped at 1.92
kHz and the modulation of the probe beam ampli-tude at that frequency was detected with a lock-inamplifier.
Fifth order Raman signals were detected using anintrinsic heterodyne detection geometry that has been
w xdescribed in detail previously 20 . Rather than mea-< Ž5.Ž . < 2suring the modulus squared response R t ,t ,2 4
this sensitive technique measures the cross termŽ3.Ž . Ž5.Ž .R t R t ,t . The same focusing optic was used4 2 4
and the combined beam energy for these measure-ments was 2 mJ. The data was collected by sweepingt from 200 to )1500 fs for fixed values of t , and2 4
then stepping t from y200 to )1200 fs for a total4
data collection time of ca. 14 h.Data for CS just above its freezing point was2
taken with a closed cycled helium refrigerator. TheCS sample was held in brass cell of 0.4 mm path2
length with fused silica windows. The temperature ofthe cell was regulated at 165"1 K over the datacollection time. The additional material of the sam-ple cell and cold-jacket windows were precompen-sated for to maintain the time resolution.
4. Results and discussion
Fig. 2 shows the polarized 1D Raman responsesŽ3.Ž .R t for CS at 295 and 165 K. At both tempera-2
( )A. Tokmakoff et al.rChemical Physics 233 1998 231–242 235
Ž3. Ž .Fig. 2. 1D third order Raman response R of CS at a 295ZZZZ 2Ž .and b 165 K. Also shown are the three Brownian oscillator
Ž .modes to which the responses are fit. The inset to b shows theŽ .long time decay at 165 K. c The spectral density representation
obtained from the sine transform of the time domain fits above:Ž . Ž .dash 295 and solid 165 K.
tures the data show a pulse limited electronic contri-bution at ts0 followed by the inertial response ofthe liquid to the impulsive excitation. The inertialresponse damps rapidly to diffusive behavior. In thelow temperature case, the response is somewhatunderdamped, with a clear oscillation. In the long
Ž .time limit )4 ps the decay is exponential with
Table 1Ž .Parameters for the fit of three Brownian oscillators Eq. 10 to the
time constants of 1.65 and 10.6 ps at 295 and 165 K,respectively. These results are in agreement withprevious temperature dependent experiments of the
w xRaman response of CS 21–24 .2
The 1D response from CS at room temperature2
has been widely studied 1, with a common observa-tion. There are effectively three time scales presentin the response. The inertial component damps in-500 fs and the diffusive component does not reachexponential behavior until )2 ps. The remainingdynamics belong to an intermediate time scale. Onthis basis it is common to fit the response to the sumof three collective oscillators with these characteris-tic time scales. The fit of both 1D decays to threeBrownian oscillators is also shown in Fig. 2, and thefit parameters are summarized in Table 1. For thefollowing discussion the inertial, intermediate, anddiffusive components are referred to as modes 1, 2and 3, respectively. The spectral density representa-tion of these data sets is shown in Fig. 2c as the sinetransform of the fits to the 1D impulse response.This shows the separation of the inertial and diffu-sive components on cooling the sample.
Ž3.Ž . Ž5.Ž .The 2D R t R t ,t responses from CS at4 2 4 2
both temperatures are shown in Fig. 3. A ridge thatextends along t , centered at t f150 fs dominates2 4
the response at both temperatures. The maximumvalue for t corresponds to the peak of the inertial4
component in the 1D response. At both temperaturesthe decays along t are much faster than along t .4 2
The slice out of the response along t for t f1502 4
fs is qualitatively the same as the 1D response.
1 The many studies of the room temperature response from CS2w xhave been reviewed in Ref 25 .
( )A. Tokmakoff et al.rChemical Physics 233 1998 231–242236
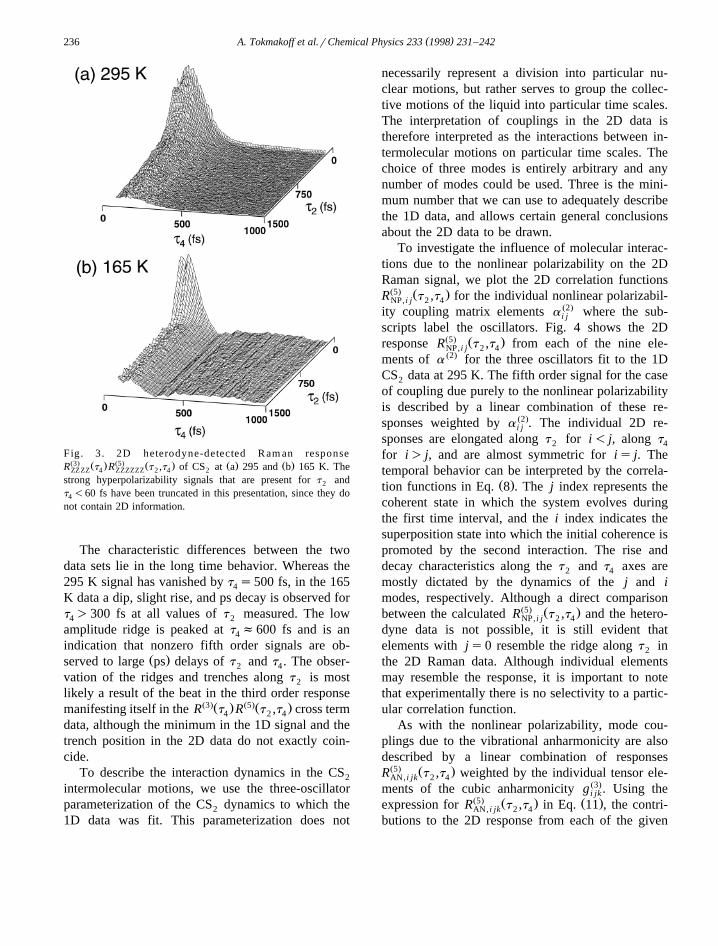
Fig. 3. 2D heterodyne-detected R am an responseŽ3. Ž . Ž5. Ž . Ž . Ž .R t R t ,t of CS at a 295 and b 165 K. TheZZZZ 4 ZZZZZZ 2 4 2
strong hyperpolarizability signals that are present for t and2
t -60 fs have been truncated in this presentation, since they do4
not contain 2D information.
The characteristic differences between the twodata sets lie in the long time behavior. Whereas the295 K signal has vanished by t s500 fs, in the 1654
K data a dip, slight rise, and ps decay is observed fort )300 fs at all values of t measured. The low4 2
amplitude ridge is peaked at t f600 fs and is an4
indication that nonzero fifth order signals are ob-Ž .served to large ps delays of t and t . The obser-2 4
vation of the ridges and trenches along t is most2
likely a result of the beat in the third order responseŽ3.Ž . Ž5.Ž .manifesting itself in the R t R t ,t cross term4 2 4
data, although the minimum in the 1D signal and thetrench position in the 2D data do not exactly coin-cide.
To describe the interaction dynamics in the CS2
intermolecular motions, we use the three-oscillatorparameterization of the CS dynamics to which the2
1D data was fit. This parameterization does not
necessarily represent a division into particular nu-clear motions, but rather serves to group the collec-tive motions of the liquid into particular time scales.The interpretation of couplings in the 2D data istherefore interpreted as the interactions between in-termolecular motions on particular time scales. Thechoice of three modes is entirely arbitrary and anynumber of modes could be used. Three is the mini-mum number that we can use to adequately describethe 1D data, and allows certain general conclusionsabout the 2D data to be drawn.
To investigate the influence of molecular interac-tions due to the nonlinear polarizability on the 2DRaman signal, we plot the 2D correlation functions
Ž5. Ž .R t ,t for the individual nonlinear polarizabil-NP, i j 2 4
ity coupling matrix elements a Ž2. where the sub-i j
scripts label the oscillators. Fig. 4 shows the 2DŽ5. Ž .response R t ,t from each of the nine ele-NP, i j 2 4
ments of a Ž2. for the three oscillators fit to the 1DCS data at 295 K. The fifth order signal for the case2
of coupling due purely to the nonlinear polarizabilityis described by a linear combination of these re-sponses weighted by a Ž2.. The individual 2D re-i j
sponses are elongated along t for i- j, along t2 4
for i) j, and are almost symmetric for is j. Thetemporal behavior can be interpreted by the correla-
Ž .tion functions in Eq. 8 . The j index represents thecoherent state in which the system evolves duringthe first time interval, and the i index indicates thesuperposition state into which the initial coherence ispromoted by the second interaction. The rise anddecay characteristics along the t and t axes are2 4
mostly dictated by the dynamics of the j and imodes, respectively. Although a direct comparison
Ž5. Ž .between the calculated R t ,t and the hetero-NP, i j 2 4
dyne data is not possible, it is still evident thatelements with js0 resemble the ridge along t in2
the 2D Raman data. Although individual elementsmay resemble the response, it is important to notethat experimentally there is no selectivity to a partic-ular correlation function.
As with the nonlinear polarizability, mode cou-plings due to the vibrational anharmonicity are alsodescribed by a linear combination of responses
Ž5. Ž .R t ,t weighted by the individual tensor ele-AN, i jk 2 4
ments of the cubic anharmonicity g Ž3.. Using thei jkŽ5. Ž . Ž .expression for R t ,t in Eq. 11 , the contri-AN, i jk 2 4
butions to the 2D response from each of the given
( )A. Tokmakoff et al.rChemical Physics 233 1998 231–242 237
Ž5. Ž . Ž2.Fig. 4. Calculated 2D response R t ,t for the nine elements of the nonlinear polarizability coupling matrix a in the three modeNP, i j 2 4
system derived from the fit to the 295 K CS data in Fig. 2a. The contours are drawn in 10% of maximum intervals.2
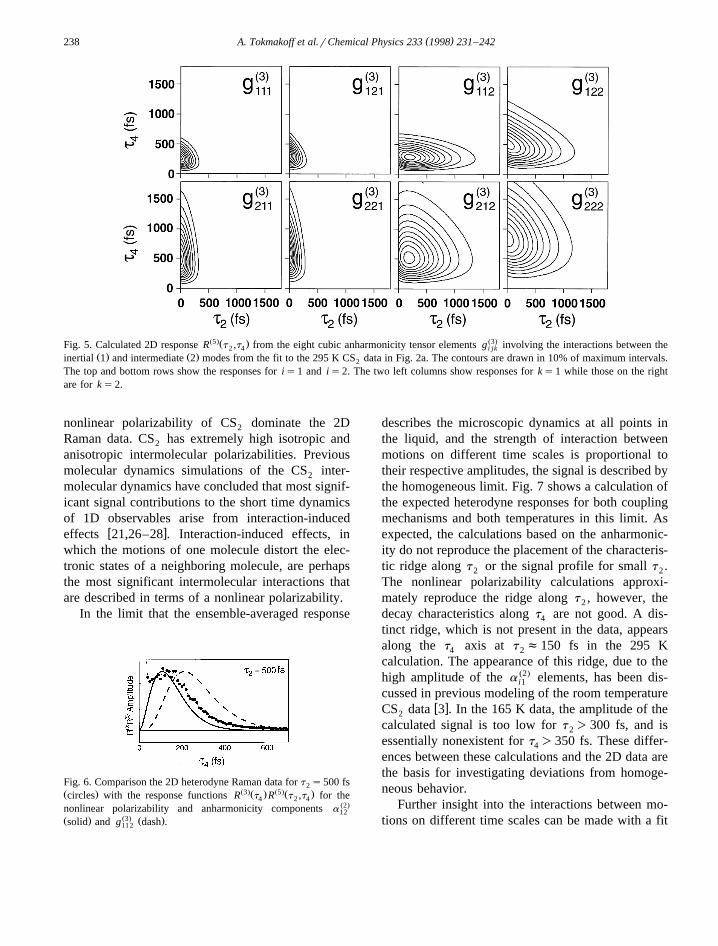
anharmonic tensor elements involving the interactionbetween the inertial and intermediate time scales areplotted in Fig. 5. The 2D response from a singleanharmonic mode g Ž3. is qualitatively the same asi i i
w xthose that were calculated previously 11,13 .The contours of the anharmonic responses have
markedly different characteristics from those in Fig.4. Unless k) j, the maximum signal is observed fort s0 rather than for positive values of t and t .2 2 4
Again the temporal behavior in the correlation func-tion is dictated by the ordering of the indices. The kindex represents the mode that is initially excited,and dictates the rate of decay with t . The i index is2
for the final state occupied, and dictates the decayalong t . Both j and k indices dictate the rise time4
along t .4
The significant difference between the anhar-monic and nonlinear polarizability responses are thecharacteristic rise times for slices along t . Although4
the 2D contribution from the anharmonic tensor ele-ments g Ž3. have the same elongation along the t11 k 2
axis observed in the 2D Raman, the ridges in theseŽresponses lie at longer delays t f250 fs than in the4
Ž .case of the nonlinear polarizability t f150 fs . Fig.4
6 shows a comparison of the rise times of the fastestnonlinear polarizability and anharmonicity compo-nents a Ž2. and g Ž3. with the 2D data along t . The12 112 4
nonlinear polarizability contribution rises rapidly andrepresents the short time behavior along t well, but4
the anharmonic contribution rises too slowly. Clearly,the anharmonic contribution cannot itself reproducethe data, and must be at most a small contribution tothe fifth-order signal from CS . The same conclu-2
sions can be drawn from the low temperature CS2
data. The dominance of the nonlinear polarizabilitycontribution allows no observation to be made on thetemperature dependence of the intermolecular anhar-monicity. On the basis of a single mode fit to room
w xtemperature homodyne data 3 , Okumura and Tan-imura have found anharmonicity is present in the 2D
w xRaman response from CS 11 .2
It is not surprising that interactions due to the
( )A. Tokmakoff et al.rChemical Physics 233 1998 231–242238
Ž5.Ž . Ž3.Fig. 5. Calculated 2D response R t ,t from the eight cubic anharmonicity tensor elements g involving the interactions between the2 4 i jkŽ . Ž .inertial 1 and intermediate 2 modes from the fit to the 295 K CS data in Fig. 2a. The contours are drawn in 10% of maximum intervals.2
The top and bottom rows show the responses for is1 and is2. The two left columns show responses for ks1 while those on the rightare for ks2.
nonlinear polarizability of CS dominate the 2D2
Raman data. CS has extremely high isotropic and2
anisotropic intermolecular polarizabilities. Previousmolecular dynamics simulations of the CS inter-2
molecular dynamics have concluded that most signif-icant signal contributions to the short time dynamicsof 1D observables arise from interaction-induced
w xeffects 21,26–28 . Interaction-induced effects, inwhich the motions of one molecule distort the elec-tronic states of a neighboring molecule, are perhapsthe most significant intermolecular interactions thatare described in terms of a nonlinear polarizability.
In the limit that the ensemble-averaged response
Fig. 6. Comparison the 2D heterodyne Raman data for t s500 fs2Ž . Ž3.Ž . Ž5.Ž .circles with the response functions R t R t ,t for the4 2 4
nonlinear polarizability and anharmonicity components a Ž2.12
Ž . Ž3. Ž .solid and g dash .112
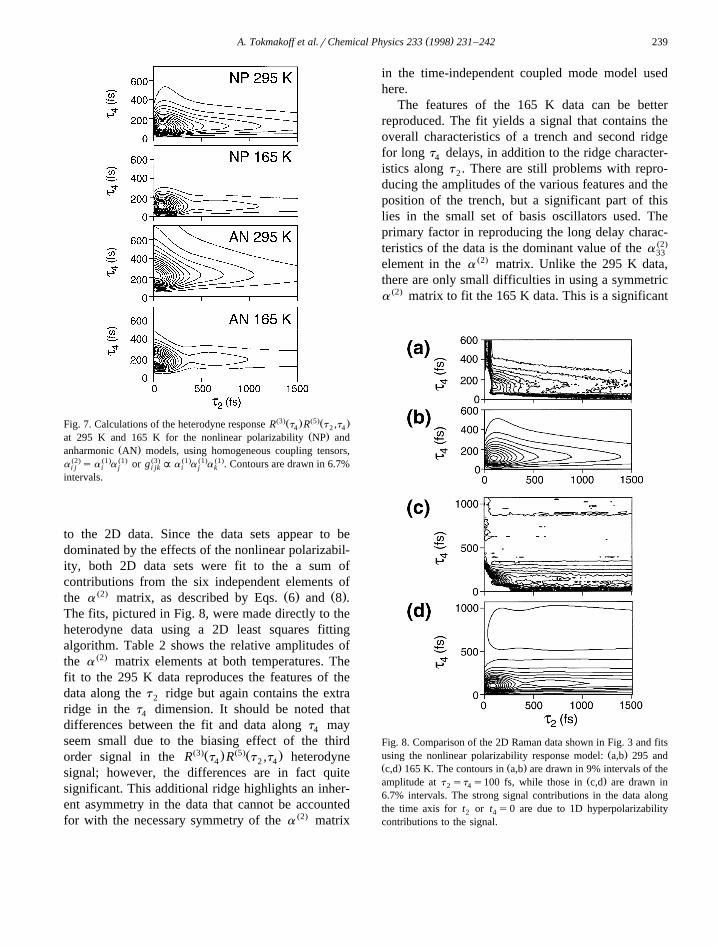
describes the microscopic dynamics at all points inthe liquid, and the strength of interaction betweenmotions on different time scales is proportional totheir respective amplitudes, the signal is described bythe homogeneous limit. Fig. 7 shows a calculation ofthe expected heterodyne responses for both couplingmechanisms and both temperatures in this limit. Asexpected, the calculations based on the anharmonic-ity do not reproduce the placement of the characteris-tic ridge along t or the signal profile for small t .2 2
The nonlinear polarizability calculations approxi-mately reproduce the ridge along t , however, the2
decay characteristics along t are not good. A dis-4
tinct ridge, which is not present in the data, appearsalong the t axis at t f150 fs in the 295 K4 2
calculation. The appearance of this ridge, due to thehigh amplitude of the a Ž2. elements, has been dis-i1
cussed in previous modeling of the room temperaturew xCS data 3 . In the 165 K data, the amplitude of the2
calculated signal is too low for t )300 fs, and is2
essentially nonexistent for t )350 fs. These differ-4
ences between these calculations and the 2D data arethe basis for investigating deviations from homoge-neous behavior.
Further insight into the interactions between mo-tions on different time scales can be made with a fit
( )A. Tokmakoff et al.rChemical Physics 233 1998 231–242 239
Ž3.Ž . Ž5.Ž .Fig. 7. Calculations of the heterodyne response R t R t ,t4 2 4Ž .at 295 K and 165 K for the nonlinear polarizability NP and
Ž .anharmonic AN models, using homogeneous coupling tensors,a Ž2.s a Ž1.a Ž1. or g Ž3.A a Ž1.a Ž1.a Ž1.. Contours are drawn in 6.7%i j i j i jk i j k
intervals.
to the 2D data. Since the data sets appear to bedominated by the effects of the nonlinear polarizabil-ity, both 2D data sets were fit to the a sum ofcontributions from the six independent elements of
Ž2. Ž . Ž .the a matrix, as described by Eqs. 6 and 8 .The fits, pictured in Fig. 8, were made directly to theheterodyne data using a 2D least squares fittingalgorithm. Table 2 shows the relative amplitudes ofthe a Ž2. matrix elements at both temperatures. Thefit to the 295 K data reproduces the features of thedata along the t ridge but again contains the extra2
ridge in the t dimension. It should be noted that4
differences between the fit and data along t may4
seem small due to the biasing effect of the thirdŽ3.Ž . Ž5.Ž .order signal in the R t R t ,t heterodyne4 2 4
signal; however, the differences are in fact quitesignificant. This additional ridge highlights an inher-ent asymmetry in the data that cannot be accountedfor with the necessary symmetry of the a Ž2. matrix
in the time-independent coupled mode model usedhere.
The features of the 165 K data can be betterreproduced. The fit yields a signal that contains theoverall characteristics of a trench and second ridgefor long t delays, in addition to the ridge character-4
istics along t . There are still problems with repro-2
ducing the amplitudes of the various features and theposition of the trench, but a significant part of thislies in the small set of basis oscillators used. Theprimary factor in reproducing the long delay charac-teristics of the data is the dominant value of the a Ž2.
33
element in the a Ž2. matrix. Unlike the 295 K data,there are only small difficulties in using a symmetrica Ž2. matrix to fit the 165 K data. This is a significant
Fig. 8. Comparison of the 2D Raman data shown in Fig. 3 and fitsŽ .using the nonlinear polarizability response model: a,b 295 and
Ž . Ž .c,d 165 K. The contours in a,b are drawn in 9% intervals of theŽ .amplitude at t st s100 fs, while those in c,d are drawn in2 4
6.7% intervals. The strong signal contributions in the data alongthe time axis for t or t s0 are due to 1D hyperpolarizability2 4
contributions to the signal.
( )A. Tokmakoff et al.rChemical Physics 233 1998 231–242240
Table 2The values of the matrix elements a Ž2. relative to the maximumi j
value based on a fit to the heterodyned 2D fifth order Raman data.These are the average values based on a number of 2D leastsquares fits. The error bars are approximately 10% for values)0.5, 20% for values )0.1 and larger for lower values
difference, implying that the inherent temporal asym-metry observed in the room temperature data ismuch smaller in the low temperature data.
From our discussion of the limiting homogeneousand inhomogeneous forms of the a Ž2. matrix, itshould be evident that the form of this matrix givesinformation on the sample heterogeneity. The classi-cal inhomogeneous line shape arises when fast dy-namics of an ensemble are decoupled from eachother. The lack of interaction between motions in theformalism of the nonlinear polarizability implies adiagonal a Ž2. matrix. High amplitude in the diagonala Ž2. elements is in many ways equivalent to theobservation of a temporal echo in the data.
To be more general, in a liquid it is of interest tosee to what extent modes interact with themselves asopposed to others. This can be measured by compar-ing the amplitude of diagonal elements of a Ž2. to theoff-diagonal ones. At room temperature the value ofthe diagonal elements seem to track the amplitude ofneighboring off-diagonal elements. This is an indica-tion that there is no preferential self-correlation formotions, and that the environment has little hetero-geneity. However at 165 K, the dominant element inthe low temperature data is a Ž2., the longest time33
diagonal component. The high amplitude of thiscomponent suggests that on a 1–2 ps time scale thereis still heterogeneity in the diffusive response of theliquid. To be more quantitative it will be necessaryto investigate the low temperature system at longertimes, and with a homodyne detection geometry toremove the biasing effect of the third order signal.
The requirement of a symmetric nonlinear polar-izability coupling tensor arises from a time-indepen-dent expansion of the polarizability in terms of col-lective oscillators used to represent the nuclear coor-
dinates of the liquid. Such an expansion, while com-mon for describing intramolecular vibrational spec-tra, is not necessarily appropriate for liquids wherethe collective modes may time-dependent. This isclear from normal mode models which work well for
Ž .the short time dynamics typically -300 fs , but failto capture the longer time scale motions which in-clude crossing of potential barriers and the largescale restructuring of the molecules. It is less obvi-ous that the collective Brownian oscillators wouldfail to describe the 2D data.
A clear result from Fig. 8 is that the coupledcollective oscillator model can fit the data better atlower temperatures. In other words, a symmetrica Ž2. appears to work better. We believe the arisesfrom a larger separation of inertial and diffusivemotions at low temperature so that time-independentoscillators would be approximately defined. In roomtemperature liquids, the time scales of the variousmotions vary continuously from inertial to diffusive,and even the collective Brownian oscillators evolvein time. As seen in Fig. 2c, as the sample is cooledthe strong inertial response becomes clearly sepa-rated from the much slower diffusive motions, and itseems reasonable to expect that the liquid dynamicsencompassed by these motions become effectivelydecoupled through the time scale separation. In thislimit, describing the collective coordinates associatedwith these motions as essentially time-independent isadequate, and grouping the time scales of the re-sponse into particular oscillators is more physicallyrealistic.
At high temperatures it is apparent that the use ofthe time-independent expansion is inadequate forroom temperature liquids. The 2D Raman data ex-hibits a clear temporal asymmetry that cannot beaccounted for within this model. The room tempera-ture data can only be fit in the context of the presentmodel if a Ž2./a Ž2.. Such breaking of the symmetryi j ji
of the current Hamiltonian could only occur if thecollective oscillators evolve in time.
A parallel picture to the one given above has beensuggested for polymer glasses and polar liquids as a
w xresult of resonant photon echo experiments 29–31 .In the dyerpolymer glass systems the linearly cou-pled harmonic bath combined with static inhomoge-neous broadening accurately describes the linear and
w xnonlinear spectroscopy from 30 to 300 K 29,31 . In
( )A. Tokmakoff et al.rChemical Physics 233 1998 231–242 241
other words, a temperature independent spectral den-sity and a temperature independent inhomogeneouswidth quantitatively describe the data. In the liquidethylene glycol, the inhomogeneous broadening hasnow become the diffusive component of the solva-tion dynamics and a temperature-independent spec-tral density no longer suffices, especially at lowfrequencies, suggesting a separation into librational
w xand diffusive time scales is no longer realistic 30 .Saito and Ohmine have used normal mode calcu-
lations to investigate the origin of the fifth orderw xRaman signal from CS at 300 K 16 . In their2
results, mode coupling plays an important role indescribing the observed response. With both instan-taneous and quenched normal modes, significant in-homogeneity is observed as the formation of an echoalong t st after averaging over )40 configura-2 4
tions. Although this feature is not observed in ourdata, the amplitude of the echo in mode-coupledsimulations was significantly decreased from mode-decoupled simulations. In a spectral analysis, theyalso found that the higher frequency componentsparticularly near 30 and 80–100 cmy1 were stronglyself-coupled. Although our results of fitting a Ž2.
predict a strong degree of self-coupling for fre-quency components )30 cmy1, we presume thatimproved models will show asymmetric couplingsinvolving lower frequency motions. Lower frequencycouplings are not seen in the calculation of Saito andOhmine because harmonic normal mode analyses donot incorporate the diffusive dynamics.
5. Concluding remarks
The 2D fifth order intermolecular Raman re-sponse from CS is dominated at both temperatures2
by nonlinear polarizability effects. These signal con-tributions are likely due to interaction-induced ef-fects, since these effects are significant in the 1Ddynamics of CS . While the role of anharmonicity in2
this response is not ruled out, it can be at most asmall contribution to the signal in the time rangestudied. Interpreting the results in terms of interac-tions between motions on different time-scales showsthat at room temperature, motions of all time-scalesappear to couple effectively to each other. We be-lieve that our inability to reproduce the 295 K data
results from the assumption of time-independent col-lective coordinates. At low temperature, the motionsseem separable and a model based on three coupledBrownian oscillators works reasonably well.
The use of the analysis presented here highlightsthe importance of 2D spectroscopy in understandingthe intermolecular interactions of liquids. Our previ-ous experiments on the interaction between intra-molecular modes in CCl and CHCl showed how4 3
couplings between well-defined vibrations could bew xobserved 12 . The present experiments show how
the same information content is present in studies ofthe intermolecular dynamics. More sophisticatedmodels than the one used here should provide con-siderable insight into the molecular motions of liq-uids.
Acknowledgements
The authors thank Prof. Shaul Mukamel and Dr.Vladimir Chernyak for valuable discussions on thenature of couplings in the fifth order Raman experi-ment, and for pointing out an error in an earlierversion of this manuscript. We also acknowledgeimportant discussions and preprints received fromProf. M. Cho, Dr. K. Okumura, and Dr. S. Saito.This research was supported by a grant from theNational Science Foundation. A.T. thanks the Na-tional Science Foundation for a postdoctoral researchfellowship. M.J.L. is a GAAN fellow.
References
w x Ž .1 G.R. Fleming, M. Cho, Annu. Rev. Phys. Chem. 47 1996109–134.
w x Ž .2 Y. Tanimura, S. Mukamel, J. Chem. Phys. 99 1993 9496.w x Ž .3 A. Tokmakoff, G.R. Fleming, J. Chem. Phys. 106 1997
2569.w x4 B.J. Berne, R. Pecora, Dynamic Light Scattering, Krieger,
Malabar, FL, 1990.w x5 S. Mukamel, Principles of Nonlinear Optical Spectroscopy,
Oxford University Press, New York, 1995.w x Ž .6 V. Khidekel, S. Mukamel, Chem. Phys. Lett. 240 1995
304; V. Khidekel, V. Chernyak, S. Mukamel, J. Chem. Phys.Ž .105 1996 8543.
w x Ž .7 K. Tominaga, K. Yoshihara, Phys. Rev. Lett. 171 1995Ž .179; J. Chem. Phys. 104 1996 4419; J. Chem. Phys. 104
Ž .1996 1159; K. Tominaga, G.P. Keogh, Y. Naitoh, K.
( )A. Tokmakoff et al.rChemical Physics 233 1998 231–242242
Ž .Yoshihara, J. Raman Spectrosc. 26 1995 495; K. Tomi-Ž .naga, Adv. Multi-Photon Process. Spectrosc. 11 1997 1.
w x Ž .8 T. Steffen, K. Duppen, Phys. Rev. Lett. 76 1996 1224; T.Ž .Steffen, J.T. Fourkas, K. Duppen, J. Chem. Phys. 105 1996Ž .7364; T. Steffen, K. Duppen, J. Chem. Phys. 106 1997
3854.w x Ž .9 A. Tokmakoff, J. Chem. Phys. 105 1996 13.
w x Ž .10 K. Okumura, Y. Tanimura, J. Chem. Phys. 106 1997 1687.w x Ž .11 K. Okumura, Y. Tanimura, J. Chem. Phys. 107 1997 2267.w x12 A. Tokmakoff, M.J. Lang, D.S. Larsen, G.R. Fleming, V.
Ž .Chernyak, S. Mukamel, Phys. Rev. Lett. 79 1997 2702.w x Ž .13 K. Okumura, Y. Tanimura, Chem. Phys. Lett. 277 1997
159.w x Ž .14 K. Okumura, Y. Tanimura, Chem. Phys. Lett. 278 1997
175.w x Ž .15 R.L. Murry, J.T. Fourkas, J. Chem. Phys. 107 1997 9726.w x Ž .16 S. Saito, I. Ohmine, J. Chem. Phys. 107 1998 240.w x17 M. Cho, K. Okumura, Y. Tanimura, J. Chem. Phys. 108
Ž .1998 1326.w x18 A. Tokmakoff, M.J. Lang, D.S. Larsen, G.R. Fleming, V.
Chernyak, S. Mukamel, J. Chem. Phys., in preparation.w x Ž .19 T. Joo, Y. Jia, G.R. Fleming, Opt. Lett. 20 1995 389.
w x20 A. Tokmakoff, M.J. Lang, D.S. Larsen, G.R. Fleming, Chem.Ž .Phys. Lett. 272 1997 48.
w x21 T.I. Cox, M.R. Battaglia, P.A. Madden, Mol. Phys. 38Ž .1979 1539.
w x Ž .22 S. Ruhman, K.A. Nelson, J. Chem. Phys. 94 1991 859.w x23 R.A. Farrer, B.J. Loughnane, J.T. Fourkas, J. Chem. Phys.
Ž .106 1997 6901.w x24 R.A. Farrer, B.J. Loughnane, J.T. Fourkas, J. Phys. Chem. A
Ž .101 1997 4005.w x25 D. McMorrow, N. Thantu, J.S. Melinger, S.K. Kim, W.T.
Ž .Lotshaw, J. Phys. Chem. 100 1996 10389.w x Ž .26 P.A. Madden, D.J. Tildesley, Mol. Phys. 55 1985 969.w x Ž .27 L.C. Geiger, B.M. Ladanyi, Chem. Phys. Lett. 159 1989
413.w x Ž .28 L.C. Geiger, B.M. Ladanyi, J. Chem. Phys. 87 1987 191.w x29 Y. Nagasawa, S.A. Passino, T. Joo, G.R. Fleming, J. Chem.
Ž .Phys. 106 1997 4640.w x30 S.A. Passino, Y. Nagasawa, G.R. Fleming, J. Chem. Phys.
Ž .107 1997 6094.w x31 Y. Nagasawa, J.-Y. Yu, G.R. Fleming, J. Chem. Phys.,