21
The LEA Indicators and Profile: Understand, Monitor, and Use them to your Advantage Dr. Kimberly Steinke Senior Director, ESE Orange County Public Schools AMM 2014
The LEA Indicators and Profile:
Understand, Monitor, and
Use them to your
Advantage
Dr. Kimberly Steinke
Senior Director, ESE
Orange County Public Schools
AMM 2014

Agenda
• Results-Driven Accountability
• LEA Profile
• Progress Monitoring Tools
• LEA Determinations
• Tips for Success

Results-Driven
Accountability
“IDEA requires the primary focus of federal and state monitoring to be on improving
educational results and functional outcomes for all children with disabilities and ensuring
that each state meets the program requirements under IDEA. “
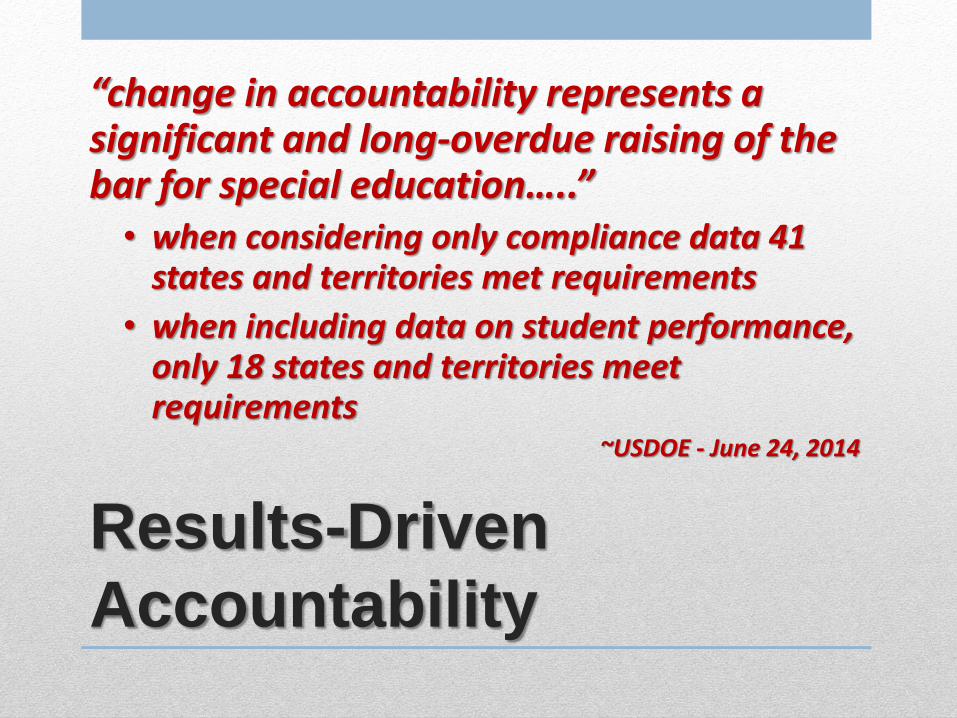
Results-Driven
Accountability
“change in accountability represents a significant and long-overdue raising of the bar for special education…..” • when considering only compliance data 41
states and territories met requirements
• when including data on student performance, only 18 states and territories meet requirements
~USDOE - June 24, 2014

LEA Profile
The LEA profile is intended to provide districts with a tool for use in planning for systemic improvement in exceptional education programs.

LEA Profile
The profile contains a series of data indicators that describe measures of educational benefit, educational environment, prevalence, parent involvement and provides information about district performance as compared to state level targets in Florida’s State Performance Plan.

LEA Profile
• Indicator 1: Graduation Rate • Indicator 2: Dropout Rate • Indicator 3: Participation/Performance on Statewide Assessments • Indicator 4: Discipline Rates • Indicator 5: LRE, Ages 6-21 • Indicator 6: LRE, Ages 3-5 • Indicator 7: Early Childhood Outcomes • Indicator 8: Parent Involvement • Indicator 9: Disproportionate Representation in Special Education • Indicator 10: Disproportionate Representation in Specific Disability Programs • Indicator 11: 60-Day Timeline • Indicator 12: Transition from Part C to Part B • Indicator 13: Secondary Transition IEP Components • Indicator 14: Postschool Outcomes

LEA Profile
Posted at http://www.fldoe.org/ese/datapage.asp

LEA Profile
• Calculation Guide includes information about the:
• Sources of district level data
• Descriptions of data collection and retrieval methods
• Procedures for calculating each Indicator’s results
• Key points:
• Data used for an indicator can be up to 2 years old
• Data is retrieved from a variety of sources
• Some indicators require self-reporting
• Deadlines for reporting and correcting data are critical
• Indicator results are used in LEA Determination

LEA Profile
Indicator 5: LRE, Ages 6-21 Key Data Elements
Student’s Age, IDEA Ed. Environment Codes, Time with Non-Disabled Peers, Time Total school week
Data Source Survey 2, current school year
Timeline(s) Original data submitted in October and Corrections in November
Data Calculation
= Percentage of students in each IDEA Ed. Env. Code X time with nondisabled peers divided by total SWD
Additional Info
LEA Determination requires 95% correction rate

LEA Profile
Indicator 11: 60 Day Timeline Key Data Elements
Initial evaluations completed, number of parent consents for evaluation
Data Source District web based system
Timeline(s) Due November 21, 2014
Data Calculation
= Total Number of initial evaluations completed within 60 days divided by total number of parent consents for evaluation
Additional Info
Indicator 11 target = 100% to be met LEA Determination requires 95% met AND timely submission

LEA Profile
Indicator 13: Secondary Transition IEPs Key Data Elements
IEPs for students age 16 and above T-IEP Protocol
Data Source Compliance Self-Assessment from previous year
Timeline(s) Typically September – December
Data Calculation
= Item T-16 on protocol marked “no” divided by the total number of records where item T-16 was applicable
Additional Info
LEA Determination requires 95% met AND timely submission

Progress Monitoring
Tools
• Strategic Plan
• Cumulative reviews & yearly comparison charts
• Outlines of internal district reporting procedures, responsibilities, and timelines
• Electronic Tools • OCPS EDW Dashboard set up to project Indicator results
• Graduation Database for monitoring leading indicators of achievement for students with disabilities

LEA Determinations
• Under IDEA, state level data reported to USDOE includes • Child count
• Educational environments
• Exit from special education
• Discipline
• Assessment
• USDOE
• includes data in annual report to Congress
• requests explanations of changes in data
• Requires states to use data for:
• LEA Determinations
• Coordinated Early Intervening Services (CEIS)

LEA Determinations
• LEA Determination required by IDEA, each district receives a determination of:
• Meets requirements
• Needs assistance
• Needs intervention or
• Needs substantial intervention
• Based in part on whether data submitted are valid, reliable, and timely
• BEESS focus on Data Verification activities

LEA Determinations
•Data Verification activities for: • IDEA Educational Environment
Codes
• Code D – Separate Schools
• also known as Center schools
• Coordinated Early Intervening Services (CEIS) – Fund Source “I”

LEA Determinations
• OSEP focus on student performance outcomes
• Results Driven Accountability
• New method and criteria for 2015 and 2016 emphasizing:
• CEIS data
• Graduation and Dropout Rates
• Regular Class Placements
• “Performance Criterion”

LEA Determinations
Additional “Performance Criterion” for 2016 Profile
• 2013-14 federal uniform graduation rate at or above state performance plan target
• 2014-15 federal uniform graduation rate at or above the state performance plan target
• Improvement in federal uniform graduation rate from 2013-14 to 2014-15 • 2013-14 dropout rate at or below state performance plan target • 2014-15 dropout rate at or below the state performance plan target • Improvement in dropout rate from 2013-14 to 2014-15 • 2013-14 regular class placement at or above state performance plan
target • 2014-15 regular class placement at or above performance plan target • Improvement in regular class placement from 2013-14 to 2014-15

Tips for Success
• Educate yourself on State Reporting Formats
• Know how your data is entered into, and is extracted from, your student information system
• Train key personnel on appropriate, accurate, and timely data entry/reporting
• Establish and maintain good relationships with your MIS department
• Hold tight to timelines
• Include LEA Indicator targets in your Strategic Plans

Tips for Success
• Project your data results and your LEA Determination Status

Contact Information
Dr. Kimberly K. Steinke Senior Director
407.317.3280
Fax: 407.317.3266 [email protected]


