41
History from 2010 to 2015 BROUGHT TO YOU BY THE FRANKINGS: THE LEAGUE FACTBOOK

Go Back to Home Page
History from 2010 to 2015
BROUGHT TO
YOU BY THE
FRANKINGS: THE LEAGUE FACTBOOK

Go Back to Home Page
HOME PAGE
Click on What You Want to Know The League Season Stats
Overall Regular Season Standings
25 Greatest Regular Seasons Ever by Points Scored
25 Greatest Regular Seasons Ever by League-Adjusted Points
25 Greatest Regular Seasons Ever by RIPE
Luckiest Regular Seasons Ever
Unluckiest Regular Seasons Ever
Overall Standings in Monk Madness
The League Game Stats
Every Regular Season and Monk Madness Game
25 Most Points in Regular Season and Monk Madness Games
25 Biggest Blowouts in Regular Season and Monk Madness Games
25 Closest Contests in Regular Season and Monk Madness Games
The League Owner Profiles:
FRANK
JEFF
JOE
MATTHEW
NICK
PARKS
WES
YESTER
SCHULKINS
JOSH
ADAM
JUSTIN
EGAN / LIL MIKE
*Notes: Every Game Ever Played
Full data for every game (Link): https://goo.gl/X5c5op

Go Back to Home Page
THE LEAGUE SEASON STATS
Overall Regular Season Standings Nick may as well be called the regular season champion of The League. He is tied with Wes for most total wins (47), but has also scored the most Points For in the history of the league (9,137.40 points). Nick’s points-per-game average of 108.78 ranks only behind Justin’s one season of glory. Three seasons in, both Schulkins and Josh have an impressive win percentage over 60%. The crazy thing? Other than Justin, none of the names mentioned have won a championship.
Rank Team G Points For
Points Per Game
W L Win % Point Differential
1 Nick 84 9,137.40 108.78 47 37 55.95% 47.22 2 Wes 84 8,962.72 106.70 47 37 55.95% 272.60 3 Parks 84 8,901.42 105.97 45 39 53.57% 280.58 4 Frank 84 8,894.22 105.88 43 41 51.19% 366.58 5 Matthew 84 8,770.06 104.41 41 43 48.81% 10.94 6 Jeff 84 8,988.22 107.00 38 46 45.24% 71.76 7 Joe 84 8,546.48 101.74 37 47 44.05% -456.00 8 Yester 84 8,358.92 99.51 34 50 40.48% -487.86 9 Schulkins 42 4,482.98 106.74 27 15 64.29% 125.36
10 Josh 42 4,556.06 108.48 26 16 61.90% 333.28 11 Adam 56 5,408.92 96.59 19 37 33.93% -658.34 12 Justin 14 1,625.74 116.12 10 4 71.43% 247.32 13 Egan 8 825.88 103.24 4 4 50.00% 3.54 14 Lil Mike 6 563.82 93.97 2 4 33.33% -35.56
Fantasy points scored rises and falls by the year. A better way of evaluating regular season performance might be to compare Points For against the league average, which is what the table below does. Here Nick’s regular season excellence is shown again. In the world of fantasy football, where randomness reigns, the expectation would be for “Points vs. League Average” to be positive some years and negative others, netting out at 0.00. But Nick, Justin, Josh, and (over a longer period of time) Jeff and Wes have all historically done very well. Looking at this, it’s not surprising that Adam had enough after four seasons.
Rank Team G Points For
Points Per Game
W L Win % Points vs. League Average
1 Nick 84 9,137.40 108.78 47 37 55.95% 326.24 2 Justin 14 1,625.74 116.12 10 4 71.43% 185.17 3 Jeff 84 8,988.22 107.00 38 46 45.24% 177.06 4 Josh 42 4,556.06 108.48 26 16 61.90% 172.28 5 Wes 84 8,962.72 106.70 47 37 55.95% 151.56 6 Parks 84 8,901.42 105.97 45 39 53.57% 90.26 7 Frank 84 8,894.22 105.88 43 41 51.19% 83.06 8 Schulkins 42 4,482.98 106.74 27 15 64.29% 67.93 9 Matthew 84 8,770.06 104.41 41 43 48.81% 59.39
10 Egan 8 825.88 103.24 4 4 50.00% -34.44 11 Lil Mike 6 563.82 93.97 2 4 33.33% -68.40 12 Joe 84 8,546.48 101.74 37 47 44.05% -264.68 13 Yester 84 8,358.92 99.51 34 50 40.48% -452.24 14 Adam 56 5,408.92 96.59 19 37 33.93% -481.46

Go Back to Home Page
However, the very best way to determine the overall leader of The League during regular seasons would probably be to sum up all of the Wins If Played Everybody (WIPE) and compared them to the Losses If Played Everybody (LIPE). In the table below, I have added the Record If Played Everybody (RIPE) for every single week that each owner has had a game. While Justin leads the way (61.1%), Josh, Schulkins, and Nick all have a RIPE of over 55%. Interestingly, Justin actually had a higher win percentage (71.4%) than his RIPE percentage (61.1%), indicating that he did get a little lucky during the first season of The League. Jeff has the most-negative difference between Win% and RIPE% (-7.3 percentage points). This means that Jeff has been the unluckiest owner of The League, at least during the regular season. Nick’s difference is zero, meaning that he has won exactly as many games as would be expected given his RIPE. Frank has also won almost exactly as many games as would be expected.
Rank Team G Points For
Points Per Game
W L Win % WIPE LIPE RIPE % Win % - RIPE %
1 Justin 14 1,625.74 116.12 10 4 71.43% 77 49 61.11% 10.32% 2 Josh 42 4,556.06 108.48 26 16 61.90% 217 161 57.41% 4.50% 3 Schulkins 42 4,482.98 106.74 27 15 64.29% 213 165 56.35% 7.94% 4 Nick 84 9,137.40 108.78 47 37 55.95% 423 333 55.95% 0.00% 5 Jeff 84 8,988.22 107.00 38 46 45.24% 397 359 52.51% -7.28% 6 Wes 84 8,962.72 106.70 47 37 55.95% 394 362 52.12% 3.84% 7 Matthew 84 8,770.06 104.41 41 43 48.81% 387 368 51.26% -2.45% 8 Frank 84 8,894.22 105.88 43 41 51.19% 386 370 51.06% 0.13% 9 Parks 84 8,901.42 105.97 45 39 53.57% 385 371 50.93% 2.65%
10 Egan 8 825.88 103.24 4 4 50.00% 34 38 47.22% 2.78% 11 Joe 84 8,546.48 101.74 37 47 44.05% 346 410 45.77% -1.72% 12 Yester 84 8,358.92 99.51 34 50 40.48% 313 443 41.40% -0.93% 13 Adam 56 5,408.92 96.59 19 37 33.93% 190 314 37.70% -3.77% 14 Lil Mike 6 563.82 93.97 2 4 33.33% 17 37 31.48% 1.85%

Go Back to Home Page
25 Greatest Regular Seasons Ever by Points Scored In each of these next three tables, it is clear that Wes-2011, Josh-2014, and Frank-2012 were the three most impressive regular seasons ever. None of these owners claimed The Monk Trophy in those years. Instead, Yester-2011, Matthew-2014, and Parks-2012 won the championships in those years. As we know, Yester and Matthew’s championships were complete bullshit, and that is further evidenced by the fact that their teams do not show up at all in the next three tables at all. And Parks only appears in one of the next three tables. In the 25 best seasons ever by points scored, only 16 teams (64.0%) had a record above .500. The Jeff-2012 team scored the 7th-most Points For in league history, but only went 5-9 that season – which is clearly the unluckiest season ever. Fortunately for Jeff, he followed that season up with the 9th-most Points For ever and a championship with his Jeff-2013 squad, defeating a Nick-2013 team that actually had a better regular season. Of the 25 best seasons ever by points scored, Nick appears on the list a record 5 times. Frank, Matthew, and Parks all follow with 3.
Rank Team Year Points For
Points Per Game
W L Win % Point Differential
1 Wes 2011 1,688.28 120.59 11 3 78.57% 313.46 2 Josh 2014 1,686.44 120.46 8 6 57.14% 196.56 3 Frank 2012 1,625.86 116.13 10 4 71.43% 212.00 4 Justin 2010 1,625.74 116.12 10 4 71.43% 247.32 5 Matthew 2011 1,616.70 115.48 9 5 64.29% 93.58 6 Nick 2013 1,590.94 113.64 10 4 71.43% 144.66 7 Jeff 2012 1,585.98 113.28 5 9 35.71% 6.68 8 Yester 2014 1,580.68 112.91 8 6 57.14% 74.98 9 Jeff 2013 1,568.52 112.04 8 6 57.14% 63.44
10 Wes 2010 1,560.10 111.44 10 4 71.43% 152.94 11 Parks 2011 1,528.84 109.20 6 8 42.86% 97.26 12 Nick 2015 1,523.84 108.85 10 4 71.43% 171.04 13 Matthew 2012 1,522.92 108.78 6 8 42.86% 55.30 14 Nick 2010 1,520.44 108.60 7 7 50.00% 5.30 15 Joe 2011 1,519.64 108.55 8 6 57.14% 29.96 16 Nick 2014 1,517.14 108.37 7 7 50.00% -75.94 17 Matthew 2010 1,516.96 108.35 7 7 50.00% 63.26 18 Frank 2015 1,515.78 108.27 10 4 71.43% 198.62 19 Schulkins 2015 1,509.52 107.82 8 6 57.14% 37.72 20 Joe 2013 1,506.72 107.62 8 6 57.14% -20.60 21 Parks 2015 1,506.40 107.60 6 8 42.86% -20.34 22 Nick 2012 1,504.74 107.48 7 7 50.00% -54.06 23 Frank 2013 1,498.90 107.06 5 9 35.71% 9.62 24 Parks 2010 1,495.76 106.84 9 5 64.29% -18.98 25 Schulkins 2013 1,490.88 106.49 10 4 71.43% 72.22
*Red = Champion of The League

Go Back to Home Page
25 Greatest Regular Seasons Ever by League-Adjusted Points Comparing each team’s Points For to the league average changes some, but not a lot. Josh-2014 scored over 200 points above the league average. Of the 25 best seasons ever by league-adjusted points scored, Nick appears on the list a record 5 times. Jeff has 4 teams on the rankings. Matthew and Parks both show up 3 times.
Rank Team Year Points For
Points Per Game
W L Win % Points vs. League Average
1 Josh 2014 1,686.44 120.46 8 6 57.14% 200.65 2 Wes 2011 1,688.28 120.59 11 3 78.57% 195.75 3 Justin 2010 1,625.74 116.12 10 4 71.43% 185.17 4 Frank 2012 1,625.86 116.13 10 4 71.43% 162.86 5 Matthew 2011 1,616.70 115.48 9 5 64.29% 124.17 6 Jeff 2012 1,585.98 113.28 5 9 35.71% 122.98 7 Wes 2010 1,560.10 111.44 10 4 71.43% 119.53 8 Nick 2013 1,590.94 113.64 10 4 71.43% 96.67 9 Yester 2014 1,580.68 112.91 8 6 57.14% 94.89
10 Nick 2015 1,523.84 108.85 10 4 71.43% 88.85 11 Frank 2015 1,515.78 108.27 10 4 71.43% 80.79 12 Nick 2010 1,520.44 108.60 7 7 50.00% 79.87 13 Matthew 2010 1,516.96 108.35 7 7 50.00% 76.39 14 Schulkins 2015 1,509.52 107.82 8 6 57.14% 74.53 15 Jeff 2013 1,568.52 112.04 8 6 57.14% 74.25 16 Parks 2015 1,506.40 107.60 6 8 42.86% 71.41 17 Matthew 2012 1,522.92 108.78 6 8 42.86% 59.92 18 Parks 2010 1,495.76 106.84 9 5 64.29% 55.19 19 Jeff 2015 1,483.86 105.99 9 5 64.29% 48.87 20 Nick 2012 1,504.74 107.48 7 7 50.00% 41.74 21 Parks 2011 1,528.84 109.20 6 8 42.86% 36.31 22 Nick 2014 1,517.14 108.37 7 7 50.00% 31.35 23 Joe 2011 1,519.64 108.55 8 6 57.14% 27.11 24 Parks 2012 1,482.06 105.86 9 5 64.29% 19.06 25 Jeff 2010 1,455.92 103.99 7 7 50.00% 15.35
*Red = Champion of The League

Go Back to Home Page
25 Greatest Regular Seasons Ever by RIPE Once again, the best way to evaluate an individual regular season is probably to use the Record If Played Everyone (RIPE) percentage. Here again we see Josh-2014 top the list, whose weekly wins should have netted him a win percentage of 68.3% even though he only went 8-6 (57.1%). Wes-2011 and Frank-2012 come in 2nd and 3rd. The two interesting teams are Jeff-2012 and Justin-2010 on this list. In 2012, Frank and Jeff both had the exact same RIPE of 65.1%. Frank slightly overperformed and went 10-4 (71.4%) while Jeff significantly underperformed and went 5-9 (35.7%). This table knocks Justin-2010 down. In fact, Justin-2010 has a lower RIPE than both Wes-2010 and Matthew-2010. Of the 25 best seasons ever by RIPE, Nick and Jeff appear on the list 4 times. Matthew, Parks, and Schulkins show up 3 times. The fact that Schulkins has 3 teams on this list and has only been in The League for three seasons is also very impressive.
Rank Team Year Points For
Points Per Game
W L Win % WIPE LIPE RIPE % Win % - RIPE %
1 Josh 2014 1,686.44 120.46 8 6 57.14% 86 40 68.25% -11.11% 2 Wes 2011 1,688.28 120.59 11 3 78.57% 84 42 66.67% 11.90% 3 Frank 2012 1,625.86 116.13 10 4 71.43% 82 44 65.08% 6.35% 4 Jeff 2012 1,585.98 113.28 5 9 35.71% 82 44 65.08% -29.37% 5 Matthew 2011 1,616.70 115.48 9 5 64.29% 81 45 64.29% 0.00% 6 Wes 2010 1,560.10 111.44 10 4 71.43% 81 45 64.29% 7.14% 7 Nick 2013 1,590.94 113.64 10 4 71.43% 78 48 61.90% 9.52% 8 Matthew 2010 1,516.96 108.35 7 7 50.00% 78 48 61.90% -11.90% 9 Justin 2010 1,625.74 116.12 10 4 71.43% 77 49 61.11% 10.32%
10 Frank 2015 1,515.78 108.27 10 4 71.43% 77 49 61.11% 10.32% 11 Parks 2010 1,495.76 106.84 9 5 64.29% 76 50 60.32% 3.97% 12 Yester 2014 1,580.68 112.91 8 6 57.14% 75 51 59.52% -2.38% 13 Nick 2015 1,523.84 108.85 10 4 71.43% 75 51 59.52% 11.90% 14 Nick 2010 1,520.44 108.60 7 7 50.00% 74 52 58.73% -8.73% 15 Schulkins 2015 1,509.52 107.82 8 6 57.14% 74 52 58.73% -1.59% 16 Jeff 2013 1,568.52 112.04 8 6 57.14% 74 52 58.73% -1.59% 17 Matthew 2012 1,522.92 108.78 6 8 42.86% 71 55 56.35% -13.49% 18 Schulkins 2014 1,482.58 105.90 9 5 64.29% 70 56 55.56% 8.73% 19 Joe 2011 1,519.64 108.55 8 6 57.14% 69 57 54.76% 2.38% 20 Schulkins 2013 1,490.88 106.49 10 4 71.43% 69 57 54.76% 16.67% 21 Jeff 2010 1,455.92 103.99 7 7 50.00% 68 58 53.97% -3.97% 22 Parks 2015 1,506.40 107.60 6 8 42.86% 67 59 53.17% -10.32% 23 Jeff 2015 1,483.86 105.99 9 5 64.29% 67 59 53.17% 11.11% 24 Nick 2012 1,504.74 107.48 7 7 50.00% 67 59 53.17% -3.17% 25 Parks 2011 1,528.84 109.20 6 8 42.86% 67 59 53.17% -10.32%
*Red = Champion of The League

Go Back to Home Page
Luckiest Regular Seasons Ever How the hell did Matthew and Yester each win a championship? Luck! Both Matthew-2014 and Yester-2011 had a win-loss record of 8-6 (57.1%) during their championship seasons. However, Matthew-2014 only had a RIPE percentage of 39.8% and Yester-2011 only had a RIPE percentage of 41.3%. These equate to a win expectancy of 5.6 wins and 5.8 wins, respectively – well below .500. With a win percentage that was 19.1 percentage-points higher than its RIPE percentage, Josh-2012 can be classified as the luckiest team ever. There’s a huge lesson to be learned from this table. 5 of the 6 champions of The League appear in the Top 10 on this list of luckiest teams (Frank-2015 and Justin-2010 are actually tied for 10th). Only Jeff-2013 did not have a positive “Win% – RIPE%.” Even for teams that are generally good like Justin-2010 and Frank-2015, which both had a RIPE over 60%, it generally takes some luck in order to win it all in fantasy football.
Rank Team Year Points For
Points Per Game
W L Win % Point Differential
Points vs. League Average
WIPE LIPE RIPE % Win % - RIPE %
1 Josh 2012 1,464.58 104.61 10 4 71.43% 127.52 1.58 66 60 52.38% 19.05% 2 Matthew 2014 1,328.44 94.89 8 6 57.14% 65.94 -45.22 49 74 39.84% 17.31% 3 Schulkins 2013 1,490.88 106.49 10 4 71.43% 72.22 -3.39 69 57 54.76% 16.67% 4 Yester 2011 1,391.58 99.40 8 6 57.14% -52.04 -100.95 52 74 41.27% 15.87% 5 Parks 2012 1,482.06 105.86 9 5 64.29% 111.74 19.06 65 61 51.59% 12.70% 6 Parks 2013 1,472.72 105.19 8 6 57.14% 75.54 -21.55 56 70 44.44% 12.70% 7 Wes 2011 1,688.28 120.59 11 3 78.57% 313.46 195.75 84 42 66.67% 11.90% 8 Nick 2015 1,523.84 108.85 10 4 71.43% 171.04 88.85 75 51 59.52% 11.90% 9 Jeff 2015 1,483.86 105.99 9 5 64.29% 204.28 48.87 67 59 53.17% 11.11%
10 Justin 2010 1,625.74 116.12 10 4 71.43% 247.32 185.17 77 49 61.11% 10.32% 11 Frank 2015 1,515.78 108.27 10 4 71.43% 198.62 80.79 77 49 61.11% 10.32% 12 Nick 2013 1,590.94 113.64 10 4 71.43% 144.66 96.67 78 48 61.90% 9.52% 13 Schulkins 2014 1,482.58 105.90 9 5 64.29% 15.42 -3.21 70 56 55.56% 8.73% 14 Wes 2012 1,424.68 101.76 8 6 57.14% 22.58 -38.32 62 64 49.21% 7.94% 15 Joe 2010 1,374.62 98.19 7 7 50.00% 8.52 -65.95 53 73 42.06% 7.94% 16 Parks 2014 1,415.64 101.12 7 7 50.00% 35.36 -70.15 54 72 42.86% 7.14% 17 Wes 2010 1,560.10 111.44 10 4 71.43% 152.94 119.53 81 45 64.29% 7.14% 18 Frank 2012 1,625.86 116.13 10 4 71.43% 212.00 162.86 82 44 65.08% 6.35% 19 Frank 2014 1,448.20 103.44 7 7 50.00% -8.48 -37.59 56 70 44.44% 5.56% 20 Josh 2015 1,405.04 100.36 8 6 57.14% 9.20 -29.95 65 61 51.59% 5.56% 21 Parks 2010 1,495.76 106.84 9 5 64.29% -18.98 55.19 76 50 60.32% 3.97% 22 Joe 2013 1,506.72 107.62 8 6 57.14% -20.60 12.45 67 59 53.17% 3.97% 23 Egan/Mike 2011 1,389.70 197.21 6 8 42.86% -32.02 -102.83 51 75 40.48% 2.38% 24 Joe 2011 1,519.64 108.55 8 6 57.14% 29.96 27.11 69 57 54.76% 2.38% 25 Wes 2014 1,465.00 104.64 7 7 50.00% 24.42 -20.79 61 65 48.41% 1.59%
*Red = Champion of The League

Go Back to Home Page
Unluckiest Regular Seasons Ever Conversely, none of the unluckiest teams during the regular season went on to win The Monk Trophy. Jeff-2012 was clearly the unluckiest team ever – if that wasn’t obvious by now. That team, which should have been a champion or at least a runner-up, had a -29.4 percentage-point “Win% – RIPE%” difference, which is significantly worse than any other team. Last season, Joe-2015 “should” have won 5 or 6 games. Instead, he ended up going 3-11, the worst record in league history. Three owners have been on the 25 unluckiest regular season teams list 4 times: Jeff, Yester, and Adam. The fact that Adam is ranked 4 times is notable, because he was in The League for 4 seasons total. No wonder he decided to quit; the kid couldn’t catch a break! Matthew and Nick are on the list 3 times each.
Rank Team Year Points For
Points Per Game
W L Win % Point Differential
Points vs. League Average
WIPE LIPE RIPE % Win % - RIPE %
1 Jeff 2012 1,585.98 113.28 5 9 35.71% 6.68 122.98 82 44 65.08% -29.37% 2 Joe 2015 1,369.38 97.81 3 11 21.43% -171.96 -65.61 51 75 40.48% -19.05% 3 Jeff 2014 1,444.72 103.19 4 10 28.57% -99.50 -41.07 57 69 45.24% -16.67% 4 Frank 2013 1,498.90 107.06 5 9 35.71% 9.62 4.63 64 62 50.79% -15.08% 5 Matthew 2012 1,522.92 108.78 6 8 42.86% 55.30 59.92 71 55 56.35% -13.49% 6 Matthew 2010 1,516.96 108.35 7 7 50.00% 63.26 76.39 78 48 61.90% -11.90% 7 Josh 2014 1,686.44 120.46 8 6 57.14% 196.56 200.65 86 40 68.25% -11.11% 8 Parks 2015 1,506.40 107.60 6 8 42.86% -20.34 71.41 67 59 53.17% -10.32% 9 Parks 2011 1,528.84 109.20 6 8 42.86% 97.26 36.31 67 59 53.17% -10.32%
10 Adam 2013 1,459.24 104.23 5 9 35.71% -103.26 -35.03 57 69 45.24% -9.52% 11 Adam 2013 1,459.24 104.23 5 9 35.71% -103.26 -35.03 57 69 45.24% -9.52% 12 Nick 2010 1,520.44 108.60 7 7 50.00% 5.30 79.87 74 52 58.73% -8.73% 13 Yester 2015 1,341.68 95.83 5 9 35.71% -97.94 -93.31 55 71 43.65% -7.94% 14 Nick 2011 1,480.30 105.74 6 8 42.86% -143.78 -12.23 63 63 50.00% -7.14% 15 Matthew 2013 1,477.96 105.57 6 8 42.86% -51.08 -16.31 63 63 50.00% -7.14% 16 Adam 2011 1,405.36 100.38 5 9 35.71% -241.36 -87.17 53 73 42.06% -6.35% 17 Joe 2014 1,392.74 99.48 5 9 35.71% -172.80 -93.05 53 73 42.06% -6.35% 18 Frank 2011 1,455.72 103.98 6 8 42.86% 34.38 -36.81 61 65 48.41% -5.56% 19 Yester 2013 1,447.06 103.36 5 9 35.71% -102.10 -47.21 52 74 41.27% -5.56% 20 Yester 2010 1,275.88 91.13 4 10 28.57% -170.46 -164.69 41 85 32.54% -3.97% 21 Jeff 2010 1,455.92 103.99 7 7 50.00% -3.70 15.35 68 58 53.97% -3.97% 22 Wes 2013 1,429.78 102.13 5 9 35.71% -88.44 -64.49 50 76 39.68% -3.97% 23 Nick 2012 1,504.74 107.48 7 7 50.00% -54.06 41.74 67 59 53.17% -3.17% 24 Jeff 2011 1,449.22 103.52 5 9 35.71% -99.44 -43.31 49 77 38.89% -3.17% 25 Yester 2014 1,580.68 112.91 8 6 57.14% 74.98 94.89 75 51 59.52% -2.38%
*Red = Champion of The League

Go Back to Home Page
Overall Standings in Monk Madness The playoff performance of every team is depicted below. Teams are ranked by Win % in Championship Games first, and Points Per Game second. Frank has the highest points-per-game average in playoff games (140.70), artificially inflated by a 200+ point game in 2015. Interestingly, Schulkins has been in The League for 3 seasons, reached a Top 4 spot into Monk Madness each year, and lost in the semifinal round every time. Nick and Wes have both reached the Championship Game twice and failed to come home with The Monk Trophy each time.
Team
All Monk Madness Games (Semifinals and Championship) All Championship Games Playoff Games
Points For
Points Per Game
W L Win % Championship Appearances
Points For
Points Per Appearance
W L Win %
Frank 3 422.10 140.70 2 1 66.67% 1 122.68 122.68 1 0 100.00% Justin 2 271.90 135.95 2 0 100.00% 1 127.34 127.34 1 0 100.00% Matthew 3 356.50 118.83 2 1 66.67% 1 86.84 86.84 1 0 100.00% Jeff 3 337.32 112.44 2 1 66.67% 1 113.1 113.1 1 0 100.00% Parks 3 330.72 110.24 2 1 66.67% 1 111.42 111.42 1 0 100.00% Yester 5 413.38 82.68 3 2 60.00% 2 210.9 105.45 1 1 50.00% Joe 3 373.66 124.55 1 2 33.33% 1 116.62 116.62 0 1 0.00% Nick 5 569.46 113.89 2 3 40.00% 2 190.9 95.45 0 2 0.00% Wes 5 502.36 100.47 2 3 40.00% 2 180.98 90.49 0 2 0.00% Schulkins 3 297.02 99.01 0 3 0.00% 0 0 0 0 Josh 2 174.68 87.34 0 2 0.00% 0 0 0 0 Adam 0 0.00 0 0 0 0 0 0 Egan 0 0.00 0 0 0 0 0 0 Lil Mike 0 0.00 0 0 0 0 0 0

Go Back to Home Page
THE LEAGUE GAME STATS
Every Regular Season and Monk Madness Game The graph below plots every single game ever played in The League– including the regular season, the playoffs, and consolation games. The games are sorted by winning score. Below each winning team data point (a red dot) is the score of the losing team (the black dot). The farther away the black dot, the larger the blowout. A very small margin of victory is represented when the black dot is essentially on top of the red. The lowest-scoring winner ever scored 69.44 points in the week, when Lil Mike defeated Frank’s pitiful 67.64 points in Week 10 of 2011. The highest-scoring winner ever was Frank’s 202.20-point victory over Jeff’s 86.16 points in the 2015 semifinal round of the playoffs.
0
25
50
75
100
125
150
175
200
225
0 50 100 150 200 250 300 350 400 450 500
Po
ints
Every Regular Season and Playoff Game That Has Been Played from 2010 - 2015: Sorted from Lowest Points Ever by a Winner to Highest Points Ever by a Winner
(In Other Words, This is Not Chronological)
Winner Loser

Go Back to Home Page
Every margin of victory ever is illustrated in the following graph. This again includes the regular season, the playoffs, and the consolation games. Over six seasons and 468 matchups, the average margin of victory has been 23.60 points, represented by the red horizontal axis. The smallest margin of victory ever was 0.06 points in a 73.22-73.16 victory by Parks over Wes in Week 12 of 2013. The largest margin of victory ever was 116.04 points in the 202.20-86.16 playoff victory by Frank over Jeff in 2015.
0
20
40
60
80
100
120
1
13
25
37
49
61
73
85
97
10
9
12
1
13
3
14
5
15
7
16
9
18
1
19
3
20
5
21
7
22
9
24
1
25
3
26
5
27
7
28
9
30
1
31
3
32
5
33
7
34
9
36
1
37
3
38
5
39
7
40
9
42
1
43
3
44
5
45
7
Mar
gin
of
Vic
tory
Every Regular Season and Playoff Game That Has Been Played from 2010 - 2015: Sorted by Closest Game Ever to Biggest Blowout Ever
(Average Margin of Victory = 23.60 Points)

Go Back to Home Page
Finally, the table below provides a distribution of team points and weekly league-average points for regular season games only. Over six seasons and 420 regular season contests, the average team has scored 104.89 points in a game. The median team scored 104.61 points, which means that half of the teams scored above 104.61 points and the other half scored below. In the history of The League, the worst ever score is 52.10 points and the best ever is 183.30 points. The Bottom 25 Percent of teams scored 88.71 points or below, while the Top 25 Percent of teams scored 119.24 points and above. The average amount scored by teams in a given week is 104.89 points. However, in the worst week as a league, all ten teams averaged just 82.84 points. In our best week, we averaged 125.44 points each!
Metric Team Points
Weekly League Average Points
Average 104.89 104.89
Worst Ever 52.10 82.84
Bottom 25 Percent 88.71 99.75
Median 104.61 104.57
Top 25 Percent 119.24 111.40
Best Ever 183.30 125.44

Go Back to Home Page
25 Most Points in Regular Season and Monk Madness Games Below is a list of the 25 most points ever scored in a game, whether regular season or Monk Madness. As is evident, Frank has had some fucking awesome games. Frank appears on the list of 25 a total of 5 times, including 4 in the Top 12. Nick is also ranked 5 times, including three times in a row from 6 to 8. Justin and Parks show up 3 times each.
Rank Year Week Historic Team
Team Score
Unlucky Opponent
Opponent Score
Margin of Victory
1 2015 Semifinal Frank 202.20 Jeff 86.16 116.04 2 2014 13 Frank 183.30 Schulkins 79.60 103.70 3 2014 8 Josh 182.00 Nick 116.86 65.14 4 2010 7 Justin 176.04 Wes 133.04 43.00 5 2011 14 Wes 175.34 Adam 68.62 106.72 6 2013 13 Nick 171.62 Matthew 113.34 58.28 7 2014 12 Nick 169.04 Matthew 124.98 44.06 8 2010 10 Nick 165.02 Parks 111.74 53.28 9 2013 4 Adam 163.54 Yester 133.28 30.26
10 2010 14 Parks 160.82 Matthew 130.76 30.06 11 2015 13 Frank 159.24 Wes 125.52 33.72 12 2013 9 Frank 159.04 Schulkins 104.48 54.56 13 2012 10 Nick 158.24 Matthew 132.02 26.22 14 2010 8 Justin 158.08 Yester 93.02 65.06 15 2011 2 Parks 157.12 Joe 109.12 48.00 16 2014 13 Yester 157.02 Joe 106.62 50.40 17 2011 Semifinal Joe 155.00 Matthew 130.34 24.66 18 2011 2 Frank 153.00 Nick 124.02 28.98 19 2014 14 Joe 152.28 Matthew 96.32 55.96 20 2015 5 Parks 152.00 Schulkins 125.04 26.96 21 2012 12 Wes 151.80 Adam 84.80 67.00 22 2014 14 Nick 151.42 Frank 130.08 21.34 23 2013 9 Jeff 151.14 Wes 96.98 54.16 24 2010 Third Place Nick 150.82 Parks 103.50 47.32 25 2010 5 Justin 150.78 Frank 75.22 75.56

Go Back to Home Page
25 Biggest Blowouts in Regular Season and Monk Madness Games Wes claims 5 of the Top 25 biggest blowouts in the history of The League. Frank has 4 of the largest margins of victory, including #1 and #3. Jeff is also on the historic side of the list 4 times. On the unlucky side, Adam shows ups 5 times over his four seasons. Yester also has been unlucky, appearing on the list 4 times.
Rank Year Week Historic Team
Team Score
Unlucky Opponent
Opponent Score
Margin of Victory
1 2015 Semifinal Frank 202.20 Jeff 86.16 116.04 2 2011 14 Wes 175.34 Adam 68.62 106.72 3 2014 13 Frank 183.30 Schulkins 79.60 103.70 4 2010 11 Jeff 140.32 Parks 63.24 77.08 5 2010 5 Justin 150.78 Frank 75.22 75.56 6 2011 13 Joe 128.06 Adam 52.72 75.34 7 2010 1 Matthew 128.52 Yester 53.46 75.06 8 2013 13 Wes 146.10 Schulkins 77.88 68.22 9 2015 6 Jeff 149.72 Wes 81.60 68.12
10 2011 8 Egan 130.86 Joe 63.84 67.02 11 2012 12 Wes 151.80 Adam 84.80 67.00 12 2013 Consolation Matthew 134.08 Adam 67.92 66.16 13 2011 1 Wes 147.18 Yester 81.16 66.02 14 2013 12 Schulkins 133.62 Adam 68.08 65.54 15 2012 7 Frank 135.66 Nick 70.28 65.38 16 2014 8 Josh 182.00 Nick 116.86 65.14 17 2010 8 Justin 158.08 Yester 93.02 65.06 18 2015 13 Nick 142.86 Josh 77.84 65.02 19 2010 5 Parks 134.14 Matthew 70.96 63.18 20 2014 9 Josh 139.76 Jeff 76.86 62.90 21 2012 8 Frank 139.46 Josh 77.54 61.92 22 2013 4 Parks 148.18 Frank 86.28 61.90 23 2014 14 Jeff 129.00 Wes 67.40 61.60 24 2014 7 Wes 129.06 Parks 68.90 60.16 25 2015 14 Jeff 112.12 Yester 52.38 59.74

Go Back to Home Page
25 Closest Contests in Regular Season and Monk Madness Games The table below reclassifies the “best” games to mean the closest contests ever. Parks’ teams seem to love the close games. He is a part of the three closest games in the history of The League and the closest Championship matchup ever. In fact, Parks is 5-2 in games decided by 2 points or less over the past 6 seasons. Nick is 5-3. The unluckiest team in close contests has been Joe. Joe has not been on the winning side of the Top 25 closest games, but he has been on the losing side 4 times.
Rank Year Week Winning Team
Winning Score
Losing Team
Losing Score
Margin of Victory
1 2013 12 Parks 73.22 Wes 73.16 0.06 2 2012 12 Parks 105.06 Frank 104.82 0.24 3 2015 8 Frank 103.42 Parks 103.14 0.28 4 2015 2 Jeff 114.54 Nick 114.14 0.40 5 2010 7 Nick 97.96 Joe 97.48 0.48 6 2011 11 Yester 74.56 Mike 74.06 0.50 7 2011 4 Egan 119.24 Jeff 118.66 0.58 8 2015 4 Schulkins 76.52 Jeff 75.86 0.66 9 2011 1 Nick 118.20 Joe 117.48 0.72
10 2011 11 Nick 101.70 Frank 100.94 0.76 11 2015 3 Schulkins 104.76 Matthew 103.92 0.84 12 2015 6 Josh 93.54 Joe 92.62 0.92 13 2010 2 Parks 123.06 Jeff 121.96 1.10 14 2011 5 Egan 99.80 Parks 98.64 1.16 15 2013 7 Parks 106.30 Adam 105.12 1.18 16 2012 11 Frank 96.14 Matthew 94.96 1.18 17 2012 Championship Parks 111.42 Wes 110.00 1.42 18 2013 6 Nick 108.78 Adam 107.22 1.56 19 2015 1 Yester 111.02 Josh 109.40 1.62 20 2011 10 Mike 69.44 Frank 67.64 1.80 21 2015 9 Wes 113.30 Joe 111.46 1.84 22 2010 8 Nick 80.00 Jeff 78.10 1.90 23 2014 Consolation Wes 117.42 Nick 115.46 1.96 24 2012 8 Yester 94.84 Nick 92.88 1.96 25 2012 6 Adam 107.18 Yester 105.12 2.06
*Red = Champion of The League

Go Back to Home Page
THE LEAGUE OWNER PROFILE: FRANK Years Active: 2010 – 2015 Notable Team Names: The Frank Kings, Philander Rodman Jr., #frankingthefuckout, Overall Win-Loss Record: 43-41 (51.2%) Overall RIPE: 386-370 (51.1%) Playoff Seasons: 2012, 2015 Championship Seasons: 2015
Year G Points For
Points Per Game
W L Win % Point Differential
Points vs. League Average
WIPE LIPE RIPE % Win % - RIPE %
Total 84 8,894.22 105.88 43 41 51.19% 366.58 83.06 386 370 51.06% +0.13% 2010 14 1,349.76 96.41 5 9 35.71% -79.56 -90.81 46 80 36.51% -0.79% 2011 14 1,455.72 103.98 6 8 42.86% 34.38 -36.81 61 65 48.41% -5.56% 2012 14 1,625.86 116.13 10 4 71.43% 212.00 162.86 82 44 65.08% +6.35% 2013 14 1,498.90 107.06 5 9 35.71% 9.62 4.63 64 62 50.79% -15.08% 2014 14 1,448.20 103.44 7 7 50.00% -8.48 -37.59 56 70 44.44% +5.56% 2015 14 1,515.78 108.27 10 4 71.43% 198.62 80.79 77 49 61.11% +10.32%
*Red = Champion of The League
His Bitch: Schulkins (4-1 record, +162.64 point differential) The Bitch of: Parks (3-5 record, -86.34 point differential)
Opponent G W L Win % Points For
Points Against
Point Differential
Average Points For
Average Points Against
Total 84 43 41 51.19% 8,894.22 8,527.64 366.58 105.88 101.52 Jeff 9 7 2 77.78% 1,089.36 961.92 127.44 121.04 106.88 Joe 10 5 5 50.00% 1,055.24 936.24 119.00 105.52 93.62 Adam 5 5 0 100.00% 574.52 493.40 81.12 114.90 98.68 Wes 9 4 5 44.44% 994.08 927.02 67.06 110.45 103.00 Yester 10 4 6 40.00% 1,055.72 1,086.04 -30.32 105.57 108.60 Nick 10 4 6 40.00% 1,111.14 1,068.42 42.72 111.11 106.84 Matthew 9 4 5 44.44% 862.84 912.64 -49.80 95.87 101.40 Schulkins 5 4 1 80.00% 642.60 479.96 162.64 128.52 95.99 Parks 8 3 5 37.50% 711.76 798.10 -86.34 88.97 99.76 Josh 5 3 2 60.00% 514.50 454.18 60.32 102.90 90.84 Justin 2 0 2 0.00% 133.16 220.76 -87.60 66.58 110.38 Egan 1 0 1 0.00% 81.66 119.52 -37.86 81.66 119.52 Lil' Mike 1 0 1 0.00% 67.64 69.44 -1.80 67.64 69.44

Go Back to Home Page
*Red line above black dashed = Win | black dashed above red = Loss.
0
25
50
75
100
125
150
175
200
Every Regular Season Game Ever Played by: FRANK, 2010-2015
Your Score Opponent Score

Go Back to Home Page
THE LEAGUE OWNER PROFILE: JEFF Years Active: 2010 – 2015 Notable Team Names: Batteri, HOVA, The Pretenders Overall Win-Loss Record: 38-46 (45.2%) Overall RIPE: 397-359 (52.5%) Playoff Seasons: 2013, 2015 Championship Seasons: 2013
Year G Points For
Points Per Game
W L Win % Point Differential
Points vs. League Average
WIPE LIPE RIPE % Win % - RIPE %
Total 84 8,988.22 107.00 38 46 45.24% 71.76 177.06 397 359 52.51% -7.28% 2010 14 1,455.92 103.99 7 7 50.00% -3.70 15.35 68 58 53.97% -3.97% 2011 14 1,449.22 103.52 5 9 35.71% -99.44 -43.31 49 77 38.89% -3.17% 2012 14 1,585.98 113.28 5 9 35.71% 6.68 122.98 82 44 65.08% -29.37% 2013 14 1,568.52 112.04 8 6 57.14% 63.44 74.25 74 52 58.73% -1.59% 2014 14 1,444.72 103.19 4 10 28.57% -99.50 -41.07 57 69 45.24% -16.67% 2015 14 1,483.86 105.99 9 5 64.29% 204.28 48.87 67 59 53.17% 11.11%
*Red = Champion of The League
His Bitch: Yester (8-1 record, +183.50 point differential) The Bitch of: Nick (1-10 record, -113.60 point differential)
Opponent G W L Win % Points For
Points Against
Point Differential
Average Points For
Average Points Against
Total 84 38 46 45.24% 8,988.22 8,916.46 71.76 107.00 106.15 Yester 9 8 1 88.89% 1,003.08 819.58 183.50 111.45 91.06 Adam 8 6 2 75.00% 865.16 753.18 111.98 108.15 94.15 Wes 9 5 4 55.56% 1,026.38 905.26 121.12 114.04 100.58 Joe 8 4 4 50.00% 919.62 843.62 76.00 114.95 105.45 Schulkins 6 4 2 66.67% 635.44 550.38 85.06 105.91 91.73 Parks 10 3 7 30.00% 1,001.58 1,056.58 -55.00 100.16 105.66 Matthew 7 3 4 42.86% 740.14 853.24 -113.10 105.73 121.89 Frank 9 2 7 22.22% 961.92 1,089.36 -127.44 106.88 121.04 Nick 11 1 10 9.09% 1,126.78 1,240.38 -113.60 102.43 112.76 Justin 2 1 1 50.00% 183.20 194.44 -11.24 91.60 97.22 Lil' Mike 1 1 0 100.00% 119.86 107.08 12.78 119.86 107.08 Josh 3 0 3 0.00% 286.40 384.12 -97.72 95.47 128.04 Egan 1 0 1 0.00% 118.66 119.24 -0.58 118.66 119.24

Go Back to Home Page
*Red line above black dashed = Win | black dashed above red = Loss.
0
25
50
75
100
125
150
175
200
Every Regular Season Game Ever Played by: JEFF, 2010-2015
Your Score Opponent Score

Go Back to Home Page
THE LEAGUE OWNER PROFILE: JOE Years Active: 2010 – 2015 Notable Team Names: Big Cheese, STD, The Underdog Overall Win-Loss Record: 37-47 (44.0%) Overall RIPE: 346-410 (45.8%) Playoff Seasons: 2011, 2013 Championship Seasons: N/A
Year G Points For
Points Per Game
W L Win % Point Differential
Points vs. League Average
WIPE LIPE RIPE % Win % - RIPE %
Total 84 8,546.48 101.74 37 47 44.05% -456.00 -264.68 346 410 45.77% -1.72% 2010 14 1,374.62 98.19 7 7 50.00% 8.52 -65.95 53 73 42.06% 7.94% 2011 14 1,519.64 108.55 8 6 57.14% 29.96 27.11 69 57 54.76% 2.38% 2012 14 1,383.38 98.81 6 8 42.86% -129.12 -79.62 53 73 42.06% 0.79% 2013 14 1,506.72 107.62 8 6 57.14% -20.60 12.45 67 59 53.17% 3.97% 2014 14 1,392.74 99.48 5 9 35.71% -172.80 -93.05 53 73 42.06% -6.35% 2015 14 1,369.38 97.81 3 11 21.43% -171.96 -65.61 51 75 40.48% -19.05%
*Red = Champion of The League
His Bitch: Adam (4-3 record, +114.66 point differential) The Bitch of: Josh (1-4 record, -77.24 point differential)
Opponent G W L Win % Points For
Points Against
Point Differential
Average Points For
Average Points Against
Total 84 37 47 44.05% 8,546.48 9,002.48 -456.00 101.74 107.17 Parks 12 6 6 50.00% 1,190.74 1,228.18 -37.44 99.23 102.35 Yester 10 5 5 50.00% 960.34 1,011.74 -51.40 96.03 101.17 Frank 10 5 5 50.00% 936.24 1,055.24 -119.00 93.62 105.52 Jeff 8 4 4 50.00% 843.62 919.62 -76.00 105.45 114.95 Matthew 9 4 5 44.44% 994.82 971.24 23.58 110.54 107.92 Adam 7 4 3 57.14% 782.16 667.50 114.66 111.74 95.36 Wes 8 3 5 37.50% 760.88 832.06 -71.18 95.11 104.01 Nick 9 2 7 22.22% 998.20 1,083.68 -85.48 110.91 120.41 Schulkins 3 2 1 66.67% 330.48 334.36 -3.88 110.16 111.45 Josh 5 1 4 20.00% 488.24 565.48 -77.24 97.65 113.10 Justin 2 1 1 50.00% 196.92 202.52 -5.60 98.46 101.26 Egan 1 0 1 0.00% 63.84 130.86 -67.02 63.84 130.86 Lil' Mike n/a

Go Back to Home Page
*Red line above black dashed = Win | black dashed above red = Loss.
0
25
50
75
100
125
150
175
200
Every Regular Season Game Ever Played by: NICK, 2010-2015
Your Score Opponent Score

Go Back to Home Page
THE LEAGUE OWNER PROFILE: MATTHEW Years Active: 2010 – 2015 Notable Team Names: That guy., The Maker, Swagga Overall Win-Loss Record: 41-43 (48.8%) Overall RIPE: 387-368 (51.3%) Playoff Seasons: 2011, 2014 Championship Seasons: 2014
Year G Points For
Points Per Game
W L Win % Point Differential
Points vs. League Average
WIPE LIPE RIPE % Win % - RIPE %
Total 84 8,770.06 104.41 41 43 48.81% 10.94 59.39 387 368 51.26% -2.45% 2010 14 1,516.96 108.35 7 7 50.00% 63.26 76.39 78 48 61.90% -11.90% 2011 14 1,616.70 115.48 9 5 64.29% 93.58 124.17 81 45 64.29% 0.00% 2012 14 1,522.92 108.78 6 8 42.86% 55.30 59.92 71 55 56.35% -13.49% 2013 14 1,477.96 105.57 6 8 42.86% -51.08 -16.31 63 63 50.00% -7.14% 2014 14 1,328.44 94.89 8 6 57.14% 65.94 -45.22 49 74 39.84% 17.31% 2015 14 1,307.08 93.36 5 9 35.71% -216.06 -139.55 45 83 35.16% 0.56%
*Red = Champion of The League
His Bitch: Adam (4-1 record, +84.90 point differential) The Bitch of: Josh (0-4 record, -131.46 point differential)
Opponent G W L Win % Points For
Points Against
Point Differential
Average Points For
Average Points Against
Total 84 41 43 48.81% 8,858.78 8,866.00 -7.22 105.46 105.55 Nick 12 6 6 50.00% 1,413.50 1,462.26 -48.76 117.79 121.86 Frank 9 5 4 55.56% 912.64 862.84 49.80 101.40 95.87 Joe 9 5 4 55.56% 971.24 994.82 -23.58 107.92 110.54 Wes 9 4 5 44.44% 931.38 975.06 -43.68 103.49 108.34 Yester 10 4 6 40.00% 975.52 934.34 41.18 97.55 93.43 Jeff 7 4 3 57.14% 853.24 740.14 113.10 121.89 105.73 Parks 9 4 5 44.44% 946.64 1,052.06 -105.42 105.18 116.90 Adam 5 4 1 80.00% 508.36 423.46 84.90 101.67 84.69 Schulkins 6 2 4 33.33% 584.96 627.62 -42.66 97.49 104.60 Justin 2 1 1 50.00% 207.08 183.84 23.24 103.54 91.92 Egan 1 1 0 100.00% 112.62 72.00 40.62 112.62 72.00 Lil' Mike 1 1 0 100.00% 117.84 82.34 35.50 117.84 82.34 Josh 4 0 4 0.00% 323.76 455.22 -131.46 80.94 113.81

Go Back to Home Page
*Red line above black dashed = Win | black dashed above red = Loss.
0
25
50
75
100
125
150
175
200
Every Regular Season Game Ever Played by: MATTHEW, 2010-2015
Your Score Opponent Score

Go Back to Home Page
THE LEAGUE OWNER PROFILE: NICK Years Active: 2010 – 2015 Notable Team Names: Jimmy Garoppolo, Jimmy Garappolo, Mike Ditka Overall Win-Loss Record: 47-37 (56.0%) Overall RIPE: 423-333 (56.0%) Playoff Seasons: 2010, 2013, 2015 Championship Seasons: N/A
Year G Points For
Points Per Game
W L Win % Point Differential
Points vs. League Average
WIPE LIPE RIPE % Win % - RIPE %
Total 84 9,137.40 108.78 47 37 55.95% 47.22 326.24 423 333 55.95% 0.00% 2010 14 1,520.44 108.60 7 7 50.00% 5.30 79.87 74 52 58.73% -8.73% 2011 14 1,480.30 105.74 6 8 42.86% -143.78 -12.23 63 63 50.00% -7.14% 2012 14 1,504.74 107.48 7 7 50.00% -54.06 41.74 67 59 53.17% -3.17% 2013 14 1,590.94 113.64 10 4 71.43% 144.66 96.67 78 48 61.90% 9.52% 2014 14 1,517.14 108.37 7 7 50.00% -75.94 31.35 66 60 52.38% -2.38% 2015 14 1,523.84 108.85 10 4 71.43% 171.04 88.85 75 51 59.52% 11.90%
*Red = Champion of The League
His Bitch: Jeff (10-1 record, +113.60 point differential) The Bitch of: Wes (3-6 record, -35.26 point differential)
Opponent G W L Win % Points For
Points Against
Point Differential
Average Points For
Average Points Against
Total 84 47 37 55.95% 9,137.40 9,090.18 47.22 108.78 108.22 Jeff 11 10 1 90.91% 1,240.38 1,126.78 113.60 112.76 102.43 Joe 9 7 2 77.78% 1,083.68 998.20 85.48 120.41 110.91 Parks 10 6 4 60.00% 1,145.68 1,120.24 25.44 114.57 112.02 Matthew 12 6 6 50.00% 1,462.26 1,413.50 48.76 121.86 117.79 Frank 10 6 4 60.00% 1,068.42 1,111.14 -42.72 106.84 111.11 Wes 9 3 6 33.33% 872.14 907.40 -35.26 96.90 100.82 Yester 8 3 5 37.50% 750.58 763.32 -12.74 93.82 95.42 Adam 6 3 3 50.00% 591.14 597.22 -6.08 98.52 99.54 Josh 4 2 2 50.00% 426.66 469.26 -42.60 106.67 117.32 Schulkins 3 1 2 33.33% 273.50 314.52 -41.02 91.17 104.84 Justin 1 0 1 0.00% 121.26 142.30 -21.04 121.26 142.30 Lil' Mike 1 0 1 0.00% 101.70 126.30 -24.60 101.70 126.30 Egan n/a

Go Back to Home Page
*Red line above black dashed = Win | black dashed above red = Loss.
0
25
50
75
100
125
150
175
200
Every Regular Season Game Ever Played by: NICK, 2010-2015
Your Score Opponent Score

Go Back to Home Page
THE LEAGUE OWNER PROFILE: PARKS Years Active: 2010 – 2015 Notable Team Names: 3950 LSD, The Wrench, Slottie Pippen Overall Win-Loss Record: 45-39 (53.6%) Overall RIPE: 385-371 (50.9%) Playoff Seasons: 2010, 2012 Championship Seasons: 2012
Year G Points For
Points Per Game
W L Win % Point Differential
Points vs. League Average
WIPE LIPE RIPE % Win % - RIPE %
Total 84 8,901.42 105.97 45 39 53.57% 280.58 90.26 385 371 50.93% 2.65% 2010 14 1,495.76 106.84 9 5 64.29% -18.98 55.19 76 50 60.32% 3.97% 2011 14 1,528.84 109.20 6 8 42.86% 97.26 36.31 67 59 53.17% -10.32% 2012 14 1,482.06 105.86 9 5 64.29% 111.74 19.06 65 61 51.59% 12.70% 2013 14 1,472.72 105.19 8 6 57.14% 75.54 -21.55 56 70 44.44% 12.70% 2014 14 1,415.64 101.12 7 7 50.00% 35.36 -70.15 54 72 42.86% 7.14% 2015 14 1,506.40 107.60 6 8 42.86% -20.34 71.41 67 59 53.17% -10.32%
*Red = Champion of The League
His Bitch: Frank (5-3 record, +86.34 point differential) The Bitch of: Schulkins (1-4 record, -52.88 point differential)
Opponent G W L Win % Points For
Points Against
Point Differential
Average Points For
Average Points Against
Total 84 45 39 53.57% 8,901.42 8,620.84 280.58 105.97 102.63 Jeff 10 7 3 70.00% 1,056.58 1,001.58 55.00 105.66 100.16 Joe 12 6 6 50.00% 1,228.18 1,190.74 37.44 102.35 99.23 Yester 7 5 2 71.43% 746.42 716.12 30.30 106.63 102.30 Matthew 9 5 4 55.56% 1,052.06 946.64 105.42 116.90 105.18 Frank 8 5 3 62.50% 798.10 711.76 86.34 99.76 88.97 Adam 5 5 0 100.00% 551.98 457.40 94.58 110.40 91.48 Wes 9 4 5 44.44% 879.62 921.34 -41.72 97.74 102.37 Nick 10 4 6 40.00% 1,120.24 1,145.68 -25.44 112.02 114.57 Josh 5 2 3 40.00% 537.08 516.90 20.18 107.42 103.38 Schulkins 5 1 4 20.00% 514.42 567.30 -52.88 102.88 113.46 Lil' Mike 1 1 0 100.00% 117.78 104.60 13.18 117.78 104.60 Justin 2 0 2 0.00% 200.32 240.98 -40.66 100.16 120.49 Egan 1 0 1 0.00% 98.64 99.80 -1.16 98.64 99.80

Go Back to Home Page
*Red line above black dashed = Win | black dashed above red = Loss.
0
25
50
75
100
125
150
175
200
Every Regular Season Game Ever Played by: PARKS, 2010-2015
Your Score Opponent Score

Go Back to Home Page
THE LEAGUE OWNER PROFILE: WES Years Active: 2010 – 2015 Notable Team Names: Wes Arnold ™, Uncle Jesse, MachoManRandySavage Overall Win-Loss Record: 47-37 (56.0%) Overall RIPE: 394-362 (52.1%) Playoff Seasons: 2010, 2011, 2012 Championship Seasons: N/A
Year G Points For
Points Per Game
W L Win % Point Differential
Points vs. League Average
WIPE LIPE RIPE % Win % - RIPE %
Total 84 8,962.72 106.70 47 37 55.95% 272.60 151.56 394 362 52.12% 3.84% 2010 14 1,560.10 111.44 10 4 71.43% 152.94 119.53 81 45 64.29% 7.14% 2011 14 1,688.28 120.59 11 3 78.57% 313.46 195.75 84 42 66.67% 11.90% 2012 14 1,424.68 101.76 8 6 57.14% 22.58 -38.32 62 64 49.21% 7.94% 2013 14 1,429.78 102.13 5 9 35.71% -88.44 -64.49 50 76 39.68% -3.97% 2014 14 1,465.00 104.64 7 7 50.00% 24.42 -20.79 61 65 48.41% 1.59% 2015 14 1,394.88 99.63 6 8 42.86% -152.36 -40.11 56 70 44.44% -1.59%
*Red = Champion of The League
His Bitch: Yester (8-2 record, +104.70 point differential) The Bitch of: Jeff (4-5 record, -121.12 point differential)
Opponent G W L Win % Points For
Points Against
Point Differential
Average Points For
Average Points Against
Total 84 47 37 55.95% 8,962.72 8,690.12 272.60 106.70 103.45 Yester 10 8 2 80.00% 1,094.96 990.26 104.70 109.50 99.03 Nick 9 6 3 66.67% 907.40 872.14 35.26 100.82 96.90 Parks 9 5 4 55.56% 921.34 879.62 41.72 102.37 97.74 Matthew 9 5 4 55.56% 975.06 931.38 43.68 108.34 103.49 Frank 9 5 4 55.56% 927.02 994.08 -67.06 103.00 110.45 Joe 8 5 3 62.50% 832.06 760.88 71.18 104.01 95.11 Adam 8 5 3 62.50% 988.34 775.84 212.50 123.54 96.98 Jeff 9 4 5 44.44% 905.26 1,026.38 -121.12 100.58 114.04 Josh 6 2 4 33.33% 616.06 644.90 -28.84 102.68 107.48 Schulkins 5 1 4 20.00% 565.74 581.94 -16.20 113.15 116.39 Egan 1 1 0 100.00% 96.44 56.66 39.78 96.44 56.66 Justin 1 0 1 0.00% 133.04 176.04 -43.00 133.04 176.04 Lil' Mike n/a

Go Back to Home Page
*Red line above black dashed = Win | black dashed above red = Loss.
0
25
50
75
100
125
150
175
200
Every Regular Season Game Ever Played by: WES, 2010-2015
Your Score Opponent Score

Go Back to Home Page
THE LEAGUE OWNER PROFILE: YESTER Years Active: 2010 – 2015 Notable Team Names: Wayne Campbell, Caesar, Lil lead Pipe Overall Win-Loss Record: 34-50 (40.5%) Overall RIPE: 313-443 (41.4%) Playoff Seasons: 2011, 2014 Championship Seasons: 2011
Year G Points For
Points Per Game
W L Win % Point Differential
Points vs. League Average
WIPE LIPE RIPE % Win % - RIPE %
Total 84 8,358.92 99.51 34 50 40.48% -487.86 -452.24 313 443 41.40% -0.93% 2010 14 1,275.88 91.13 4 10 28.57% -170.46 -164.69 41 85 32.54% -3.97% 2011 14 1,391.58 99.40 8 6 57.14% -52.04 -100.95 52 74 41.27% 15.87% 2012 14 1,322.04 94.43 4 10 28.57% -140.30 -140.96 38 88 30.16% -1.59% 2013 14 1,447.06 103.36 5 9 35.71% -102.10 -47.21 52 74 41.27% -5.56% 2014 14 1,580.68 112.91 8 6 57.14% 74.98 94.89 75 51 59.52% -2.38% 2015 14 1,341.68 95.83 5 9 35.71% -97.94 -93.31 55 71 43.65% -7.94%
*Red = Champion of The League
His Bitch: Frank (6-4 record, +30.32 point differential) The Bitch of: Jeff (1-8 record, -183.50 point differential)
Opponent G W L Win % Points For
Points Against
Point Differential
Average Points For
Average Points Against
Total 84 34 50 40.48% 8,358.92 8,846.78 -487.86 99.51 105.32 Matthew 10 6 4 60.00% 934.34 975.52 -41.18 93.43 97.55 Frank 10 6 4 60.00% 1,086.04 1,055.72 30.32 108.60 105.57 Nick 8 5 3 62.50% 763.32 750.58 12.74 95.42 93.82 Joe 10 5 5 50.00% 1,011.74 960.34 51.40 101.17 96.03 Josh 6 3 3 50.00% 613.10 661.38 -48.28 102.18 110.23 Wes 10 2 8 20.00% 990.26 1,094.96 -104.70 99.03 109.50 Parks 7 2 5 28.57% 716.12 746.42 -30.30 102.30 106.63 Adam 6 2 4 33.33% 661.34 672.82 -11.48 110.22 112.14 Jeff 9 1 8 11.11% 819.58 1,003.08 -183.50 91.06 111.45 Egan 1 1 0 100.00% 124.40 120.62 3.78 124.40 120.62 Lil' Mike 1 1 0 100.00% 74.56 74.06 0.50 74.56 74.06 Schulkins 5 0 5 0.00% 471.10 573.20 -102.10 94.22 114.64 Justin 1 0 1 0.00% 93.02 158.08 -65.06 93.02 158.08

Go Back to Home Page
*Red line above black dashed = Win | black dashed above red = Loss.
0
25
50
75
100
125
150
175
200
Every Regular Season Game Ever Played by: YESTER, 2010-2015
Your Score Opponent Score

Go Back to Home Page
THE LEAGUE OWNER PROFILE: SCHULKINS Years Active: 2013 – 2015 Notable Team Names: Incredible Schulk Overall Win-Loss Record: 27-15 (64.3%) Overall RIPE: 213-165 (56.3%) Playoff Seasons: 2013, 2014, 2015 Championship Seasons: N/A
Year G Points For
Points Per Game
W L Win % Point Differential
Points vs. League Average
WIPE LIPE RIPE % Win % - RIPE %
Total 42 4,482.98 106.74 27 15 64.29% 125.36 67.93 213 165 56.35% 7.94% 2010 2011 2012 2013 14 1,490.88 106.49 10 4 71.43% 72.22 -3.39 69 57 54.76% 16.67% 2014 14 1,482.58 105.90 9 5 64.29% 15.42 -3.21 70 56 55.56% 8.73% 2015 14 1,509.52 107.82 8 6 57.14% 37.72 74.53 74 52 58.73% -1.59%
*Red = Champion of The League
His Bitch: Yester (5-0 record, +102.10 point differential) The Bitch of: Frank (1-4 record, -162.64 point differential)
Opponent G W L Win % Points For
Points Against
Point Differential
Average Points For
Average Points Against
Total 42 27 15 64.29% 4,482.98 4,357.62 125.36 106.74 103.75 Yester 5 5 0 100.00% 573.20 471.10 102.10 114.64 94.22 Wes 5 4 1 80.00% 581.94 565.74 16.20 116.39 113.15 Parks 5 4 1 80.00% 567.30 514.42 52.88 113.46 102.88 Matthew 6 4 2 66.67% 627.62 584.96 42.66 104.60 97.49 Nick 3 2 1 66.67% 314.52 273.50 41.02 104.84 91.17 Jeff 6 2 4 33.33% 550.38 635.44 -85.06 91.73 105.91 Josh 2 2 0 100.00% 234.30 190.46 43.84 117.15 95.23 Adam 2 2 0 100.00% 219.40 148.92 70.48 109.70 74.46 Frank 5 1 4 20.00% 479.96 642.60 -162.64 95.99 128.52 Joe 3 1 2 33.33% 334.36 330.48 3.88 111.45 110.16 Justin n/a Egan n/a Lil' Mike n/a
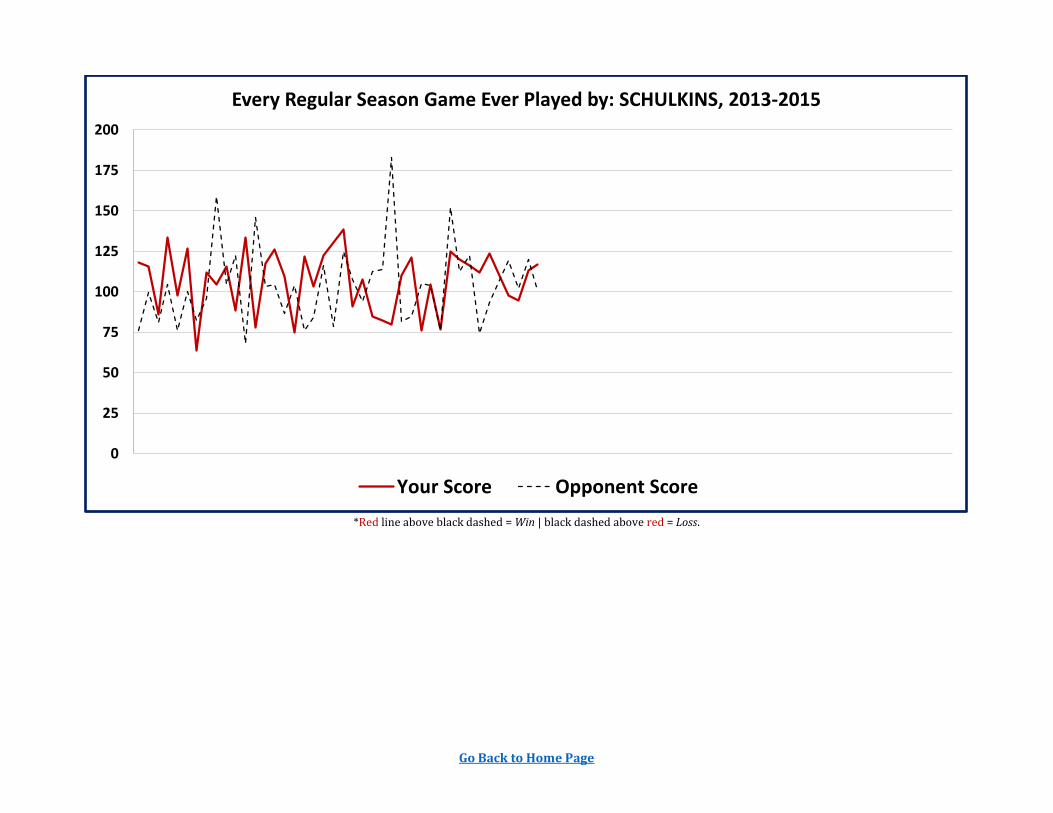
Go Back to Home Page
*Red line above black dashed = Win | black dashed above red = Loss.
0
25
50
75
100
125
150
175
200
Every Regular Season Game Ever Played by: SCHULKINS, 2013-2015
Your Score Opponent Score

Go Back to Home Page
THE LEAGUE OWNER PROFILE: JOSH Years Active: 2012, 2014 – 2015 Notable Team Names: MadTown HashBrown, ILLINIJ24 Overall Win-Loss Record: 26-16 (61.9%) Overall RIPE: 217-161 (57.4%) Playoff Seasons: 2012, 2014 Championship Seasons: N/A
Year G Points For
Points Per Game
W L Win % Point Differential
Points vs. League Average
WIPE LIPE RIPE % Win % - RIPE %
Total 42 4,556.06 108.48 26 16 61.90% 333.28 172.28 217 161 57.41% 4.50% 2010 2011 2012 14 1,464.58 104.61 10 4 71.43% 127.52 1.58 66 60 52.38% 19.05% 2013 2014 14 1,686.44 120.46 8 6 57.14% 196.56 200.65 86 40 68.25% -11.11% 2015 14 1,405.04 100.36 8 6 57.14% 9.20 -29.95 65 61 51.59% 5.56%
*Red = Champion of The League
His Bitch: Matthew (4-0 record, +131.46 point differential) The Bitch of: Schulkins (0-2 record, -43.84 point differential)
Opponent G W L Win % Points For
Points Against
Point Differential
Average Points For
Average Points Against
Total 42 26 16 61.90% 4,556.06 4,222.78 333.28 108.48 100.54 Wes 6 4 2 66.67% 644.90 616.06 28.84 107.48 102.68 Matthew 4 4 0 100.00% 455.22 323.76 131.46 113.81 80.94 Joe 5 4 1 80.00% 565.48 488.24 77.24 113.10 97.65 Yester 6 3 3 50.00% 661.38 613.10 48.28 110.23 102.18 Jeff 3 3 0 100.00% 384.12 286.40 97.72 128.04 95.47 Parks 5 3 2 60.00% 516.90 537.08 -20.18 103.38 107.42 Nick 4 2 2 50.00% 469.26 426.66 42.60 117.32 106.67 Frank 5 2 3 40.00% 454.18 514.50 -60.32 90.84 102.90 Adam 2 1 1 50.00% 214.16 182.68 31.48 107.08 91.34 Schulkins 2 0 2 0.00% 190.46 234.30 -43.84 95.23 117.15 Justin n/a Egan n/a Lil' Mike n/a

Go Back to Home Page
*Red line above black dashed = Win | black dashed above red = Loss.
0
25
50
75
100
125
150
175
200
Every Regular Season Game Ever Played by: JOSH, 2012 & 2014-2015
Your Score Opponent Score

Go Back to Home Page
THE LEAGUE OWNER PROFILE: ADAM Years Active: 2010 – 2013 Notable Team Names: Burn Notice!, Taylor Swift’s Vag Overall Win-Loss Record: 19-37 (33.9%) Overall RIPE: 217-161 (37.7%) Playoff Seasons: N/A Championship Seasons: N/A
Year G Points For
Points Per Game
W L Win % Point Differential
Points vs. League Average
WIPE LIPE RIPE % Win % - RIPE %
Total 56 5,408.92 96.59 19 37 33.93% -761.60 -481.46 190 314 37.70% -3.77% 2010 14 1,230.54 87.90 4 10 28.57% -204.64 -210.03 36 90 28.57% 0.00% 2011 14 1,405.36 100.38 5 9 35.71% -241.36 -87.17 53 73 42.06% -6.35% 2012 14 1,313.78 93.84 5 9 35.71% -212.34 -149.22 44 82 34.92% 0.79% 2013 14 1,459.24 104.23 5 9 35.71% -103.26 -35.03 57 69 45.24% -9.52% 2014 2015
*Red = Champion of The League
His Bitch: Justin & Egan (2-0 record, +21.54 point differential) The Bitch of: Everybody Else (17-37 record, -739.06 point differential)
Opponent G W L Win % Points For
Points Against
Point Differential
Average Points For
Average Points Against
Total 56 19 37 33.93% 5,408.92 6,170.52 -761.60 96.59 110.19 Yester 6 4 2 66.67% 672.82 661.34 11.48 112.14 110.22 Wes 8 3 5 37.50% 775.84 988.34 -212.50 96.98 123.54 Nick 6 3 3 50.00% 597.22 591.14 6.08 99.54 98.52 Joe 7 3 4 42.86% 667.50 782.16 -114.66 95.36 111.74 Jeff 8 2 6 25.00% 753.18 865.16 -111.98 94.15 108.15 Matthew 5 1 4 20.00% 423.46 508.36 -84.90 84.69 101.67 Josh 2 1 1 50.00% 182.68 214.16 -31.48 91.34 107.08 Justin 1 1 0 100.00% 110.42 106.78 3.64 110.42 106.78 Egan 1 1 0 100.00% 126.08 107.18 18.90 126.08 107.18 Parks 5 0 5 0.00% 457.40 551.98 -94.58 91.48 110.40 Frank 5 0 5 0.00% 493.40 574.52 -81.12 98.68 114.90 Schulkins 2 0 2 0.00% 148.92 219.40 -70.48 74.46 109.70 Lil' Mike n/a

Go Back to Home Page
*Red line above black dashed = Win | black dashed above red = Loss.
0
25
50
75
100
125
150
175
200
Every Regular Season Game Ever Played by: ADAM, 2010-2015
Your Score Opponent Score

Go Back to Home Page
THE LEAGUE OWNER PROFILE: JUSTIN Years Active: 2010 Notable Team Names: Al Davis Overall Win-Loss Record: 10-4 (71.4%) Overall RIPE: 77-49 (61.1%) Playoff Seasons: 2010 Championship Seasons: 2010
Year G Points For
Points Per Game
W L Win % Point Differential
Points vs. League Average
WIPE LIPE RIPE % Win % - RIPE %
Total 14 1,625.74 116.12 10 4 71.43% 247.32 185.17 77 49 61.11% 10.32% 2010 14 1,625.74 116.12 10 4 71.43% 247.32 185.17 77 49 61.11% 10.32% 2011 2012 2013 2014 2015
*Red = Champion of The League
His Bitch: Frank (2-0 record, +87.60 point differential) The Bitch of: Adam (0-1 record, -3.64 point differential)
Opponent G W L Win % Points For
Points Against
Point Differential
Average Points For
Average Points Against
Total 14 10 4 71.43% 1,625.74 1,378.42 247.32 116.12 98.46 Parks 2 2 0 100.00% 240.98 200.32 40.66 120.49 100.16 Frank 2 2 0 100.00% 220.76 133.16 87.60 110.38 66.58 Wes 1 1 0 100.00% 176.04 133.04 43.00 176.04 133.04 Yester 1 1 0 100.00% 158.08 93.02 65.06 158.08 93.02 Nick 1 1 0 100.00% 142.30 121.26 21.04 142.30 121.26 Jeff 2 1 1 50.00% 194.44 183.20 11.24 97.22 91.60 Matthew 2 1 1 50.00% 183.84 207.08 -23.24 91.92 103.54 Joe 2 1 1 50.00% 202.52 196.92 5.60 101.26 98.46 Adam 1 0 1 0.00% 106.78 110.42 -3.64 106.78 110.42 Egan n/a Lil' Mike n/a Schulkins n/a Josh n/a

Go Back to Home Page
*Red line above black dashed = Win | black dashed above red = Loss.
0
25
50
75
100
125
150
175
200
Every Regular Season Game Ever Played by: JUSTIN, 2010
Your Score Opponent Score

Go Back to Home Page
THE LEAGUE OWNER PROFILE: EGAN / LIL MIKE Years Active: 2011 Notable Team Names: football and biscuit, The No Getters Overall Win-Loss Record: 6-8 (42.9%) Overall RIPE: 51-75 (40.5%) Playoff Seasons: N/A Championship Seasons: N/A
Year G Points For
Points Per Game
W L Win % Point Differential
Points vs. League Average
WIPE LIPE RIPE % Win % - RIPE %
Total 14 1,389.70 99.26 6 8 42.86% -32.02 -102.83 51 75 40.48% 2.38% 2010 2011 14 1,389.70 99.26 6 8 42.86% -32.02 -102.83 51 75 40.48% 2.38% 2012 2013 2014 2015
*Red = Champion of The League
Their Bitch: Frank (2-0 record, +39.66 point differential) The Bitch of: Matthew (0-2 record, -76.12 point differential)
Opponent G W L Win % Points For
Points Against
Point Differential
Total 14 6 8 42.86% 1389.7 1421.72 -32.02 Frank 2 2 0 100.00% 188.96 149.3 39.66 Nick 1 1 0 100.00% 126.3 101.7 24.6 Jeff 2 1 1 50.00% 226.32 238.52 -12.2 Parks 2 1 1 50.00% 204.4 216.42 -12.02 Joe 1 1 0 100.00% 130.86 63.84 67.02 Adam 1 0 1 0.00% 107.18 126.08 -18.90 Wes 1 0 1 0.00% 56.66 96.44 -39.78 Yester 2 0 2 0.00% 194.68 198.96 -4.28 Matthew 2 0 2 0.00% 154.34 230.46 -76.12 Schulkins n/a Josh n/a Justin n/a


