The Loan Covenant Channel: How Bank Health Transmits to the Real Economy * Gabriel Chodorow-Reich Harvard University and NBER Antonio Falato Federal Reserve Board April 2017 Abstract We document the importance of covenant violations in transmitting bank health to nonfinancial firms using a new supervisory data set of bank loans. More than one-third of loans in our data breach a covenant during the 2008-09 period, providing lenders the opportunity to force a renegotiation of loan terms or to accelerate repayment. We find that lenders in worse health are less likely to grant a waiver and more likely to force a reduction in the loan commitment. Quantitatively, the reduction in credit to borrowers with long-term credit but who violate a covenant accounts for an 11% decline in the volume of loans and commitments outstanding during the 2008-09 crisis, slightly larger than the total contraction in credit during that period. We conclude that the transmission of bank health to nonfinancial firms occurs largely through the loan covenant channel. * Chodorow-Reich: [email protected]; Falato: [email protected]. The views expressed herein are those of the authors and not necessarily those of the Federal Reserve Board of Governors or the Federal Reserve System.
Transcript
The Loan Covenant Channel:
How Bank Health Transmits to the Real Economy∗
Gabriel Chodorow-Reich
Harvard University and NBER
Antonio Falato
Federal Reserve Board
April 2017
Abstract
We document the importance of covenant violations in transmitting bank health to
nonfinancial firms using a new supervisory data set of bank loans. More than one-third
of loans in our data breach a covenant during the 2008-09 period, providing lenders
the opportunity to force a renegotiation of loan terms or to accelerate repayment. We
find that lenders in worse health are less likely to grant a waiver and more likely to
force a reduction in the loan commitment. Quantitatively, the reduction in credit
to borrowers with long-term credit but who violate a covenant accounts for an 11%
decline in the volume of loans and commitments outstanding during the 2008-09 crisis,
slightly larger than the total contraction in credit during that period. We conclude
that the transmission of bank health to nonfinancial firms occurs largely through the
are those of the authors and not necessarily those of the Federal Reserve Board of Governors or the Federal Reserve
System.
1. Introduction
A large literature documents the importance of the health of the banking sector for nonfi-
nancial firm outcomes such as investment and employment.1 Most recently, the 2008-09 period
contained both a financial crisis and the deepest recession in the United States in 60 years. Yet,
at the start of the financial panic in 2008 only 10% of bank loans had remaining maturity of less
than one year. This fact raises a puzzle: why didn’t long-term credit insulate existing borrowers
from the health of their lenders during the panic?
We document the role of loan covenant violations in transmitting the health of the financial
system to outcomes at corporate borrowers. Loan covenants, also known as non-pricing terms,
appear in nearly all commercial loan contracts. They circumscribe the set of actions a borrower
may take (nonfinancial covenants) or specify minimum or maximum thresholds for cash flow or
balance sheet variables (financial covenants). Breaching of a covenant threshold puts a borrower
into technical default and gives the lender the right to accelerate repayment of the loan. Far from
unusual events, roughly one-quarter of corporate loans breach a covenant during a typical year
before the 2008-09 financial crisis and one-third of loans breach a covenant each year during the
financial crisis. Thus, loan covenant violations increase lenders’ bargaining power and provide
them broad opportunity to renegotiate contract terms when their own internal cost of funds
rises. We refer to the transmission of lender health to existing borrowers through the forced
renegotiation of contract terms as the loan covenant channel.
We quantify the covenant channel in the context of the 2008-09 financial crisis using a new
1See e.g. Peek and Rosengren (2000); Lin and Paravisini (2012); Chodorow-Reich (2014); Benmelech et al.(2015) for evidence from the United States and Gan (2007); Amiti and Weinstein (Forthcoming); Bentolila et al.(2016) for evidence in other countries.
1
supervisory data set of syndicated loans. The data contain the identities of borrowers and
lenders and follow individual loans over time, including compliance with covenants. Following
the violation of a covenant, a lender may accelerate repayment, force a renegotiation of the
loan contract, or simply waive or reset the covenant with no further impact on the loan. Our
data track each of these potential outcomes. Importantly, the supervisory data contain vastly
more loan observations per year and more accurately identify covenant violations than do other
existing data sets. Our main sample consists only of loans not due to mature within the year.
Absent changes, these loans should have insulated borrowers from the immediate consequences
of the financial condition of the lenders providing them.
The 2008-09 financial crisis offers a useful laboratory to assess the covenant channel. The
write-downs on assets linked to real estate loans led to an enormous decline in the market
equity of the U.S. financial sector and coincided with a sharp increase in bank funding costs.
Both factors increased the internal cost of funds at lenders. A body of evidence documents the
transmission from the reduction in credit supply at lenders to outcomes at nonfinancial firms
during the crisis (Campello et al., 2010; Duchin et al., 2010; Campello et al., 2011; Chodorow-
Reich, 2014; Duygan-Bump et al., 2015; Siemer, 2016). However, banks varied greatly in their
exposure to the crisis.
Our empirical exercises test whether the outcome of a covenant violation during the 2008-09
crisis depends on the lead lender’s financial health. We measure lender health by combining three
measures constructed in Chodorow-Reich (2014). These measures capture banks’ exposure to
the crisis through counterparty risk, mortgage-related writedowns, and funding stability. Iden-
tification requires that covenant violators of less healthy and healthier lenders have otherwise
2
similar characteristics. We show that borrowers of healthy and less healthy lenders have similar
propensities to violate a covenant, similar overall leverage, and similar supervisory ratings.
We find strong evidence of less healthy lenders using covenant violations to contract credit.
Conditional on breaching a threshold, the likelihood of a reduction in the loan balance rises
by 24 p.p. for borrowers of the least healthy lenders relative to the healthiest lenders and the
average loan commitment falls by 23%. Smaller, more concentrated syndicates and syndicates
with a larger lead lender share exhibit greater sensitivity to lender health in determining the
outcome of a covenant violation, consistent with increased incentive and ability for the lead
lender to organize a response in these syndicate structures.
A number of results further support the causal interpretation of these findings. First, we
find no reduction in credit from unhealthy lenders to borrowers with long-term credit who do
not violate a covenant, suggesting that borrowers of less healthy lenders did not experience a
correlated decline in loan demand. Second, adding borrower and loan-level controls increases
the explanatory power of the regressions but, consistent with ex ante balancing of firms and
borrowers, the point estimates remain extremely stable. Third, the lead lender’s share of the
loan commitment declines after a violation if the lead has poor health, providing “within-loan”
evidence that what shifts is the lead lender’s credit supply function. Fourth, we conduct placebo
exercises in which we reestimate the baseline specification in the non-crisis period of 2006-07. We
do not find any differential treatment of borrowers who breach a covenant in 2006-07 based on
lender health in 2008-09. Fifth, we show robustness to plausible alternative definitions of lender
health including using the health of the pre-crisis lender to address concerns of endogenous
sorting of lenders and borrowers after the crisis started.
3
We next turn to the consequences of the credit contraction for the borrower. If a borrower
whose previous relationship lender contracted credit could easily switch to a new lender, id-
iosyncratic fluctuations in bank health would have little real effect. The concentration of credit
contraction on covenant violators makes such switching difficult because of the difficulty of ob-
taining new credit while in technical default. Indeed, covenant violators of unhealthy lenders
appear unable to substitute at all toward other lenders or toward non-bank credit. Instead, we
show that these borrowers increase the utilization on their existing credit lines, draw down cash
holdings, and reduce investment and employment relative to firms which violate a covenant but
have a healthier lender. These results echo previous literature which has found an adverse effect
of a covenant violation on debt issuance (Roberts and Sufi, 2009a; Nini et al., 2012), investment
(Chava and Roberts, 2008; Nini et al., 2012), and employment (Falato and Liang, 2016), but
with the added twist that the health of the lender crucially affects the consequences for the
borrower.
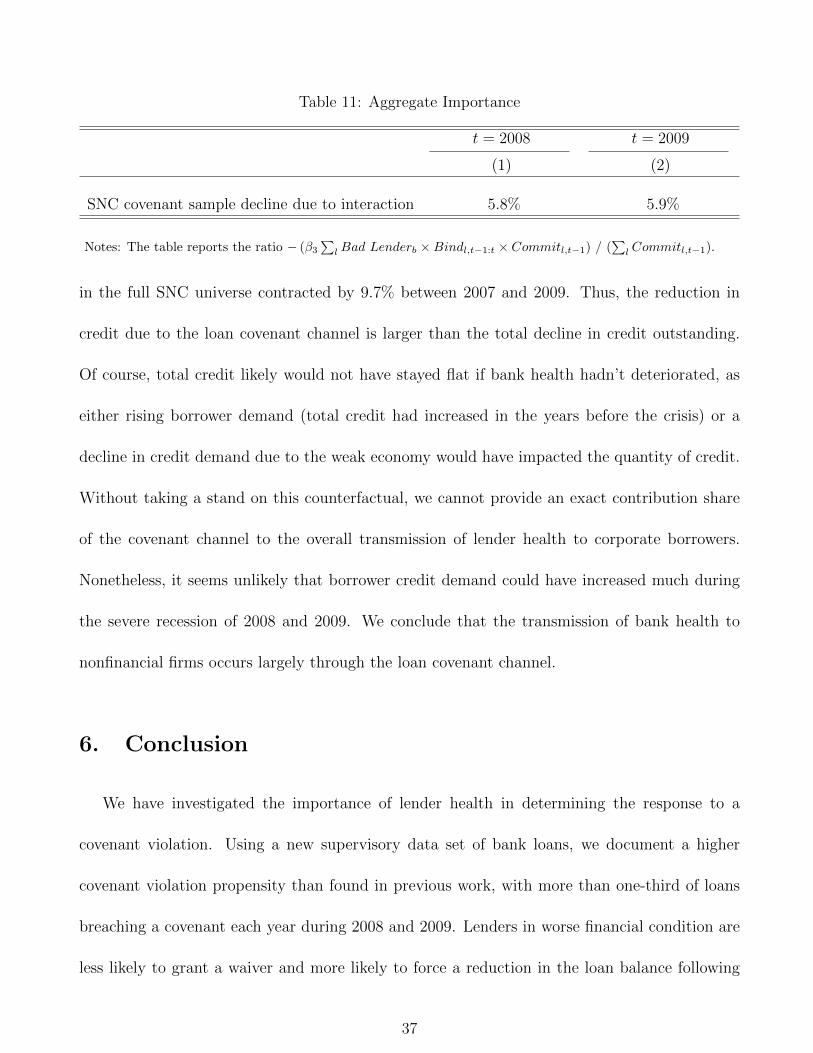
Finally, we perform an aggregation calculation to assess the macroeconomic importance of
the loan covenant channel. We find that total credit and commitments outstanding contracted
by 5.8% in 2008 and 5.9% in 2009 solely as the result of borrowers who started the year with
a long-term loan contract but nonetheless had their borrowing limit lowered by an unhealthy
lender following a covenant violation. This magnitude is economically significant; for example,
it exceeds the contraction in the total stock of credit (including commitments) outstanding
between 2007 and 2009. We conclude that the transmission of bank health to nonfinancial firms
occurs largely through the loan covenant channel.
We discuss related literature next. Section 2 describes the data. Section 3 provides summary
4
statistics and balancing tests and compares our measure of covenant violations to previous work.
Section 4 reports borrower and loan level effects of lender health on the aftermath of a covenant
violation. We perform the aggregation exercise in section 5. Section 6 concludes.
Related literature. A first related literature studies the transmission of bank health to the
real economy and the importance of firm-bank relationships. Bernanke (1983) is a seminal
reference and Chodorow-Reich (2014) overviews more recent papers. As discussed above, the
prevalence of long-term contracts poses a challenge for this literature insofar as they insulate
many borrowers from the health of their lender. We show how covenant violations create a
transmission channel even to borrowers with nominally long-term contracts. Other explanations
include lumpiness or granularity in the economy together with strong effects in exactly the
subset of borrowers needing to refinance or new credit (Almeida et al., 2012; Benmelech et al.,
2015; Siemer, 2016) and precautionary saving by firms anticipating future credit contraction
(Almeida et al., 2004; Bacchetta et al., 2014; Melcangi, 2016; Xiao, 2017). We view these
channels as complementary and our contribution as highlighting the quantitative importance
of the covenant channel. Additionally, since lower quality borrowers are more likely to violate
covenants, the covenant channel offers a novel explanation for why many papers find empirically
that the effects of bank health concentrate on smaller, lower quality borrowers.
A second literature, already cited, documents the negative consequences to the firm of vio-
lating a covenant (Chava and Roberts, 2008; Roberts and Sufi, 2009a; Nini et al., 2012; Falato
and Liang, 2016). Our results suggest that the overall effect reported in these studies may mask
important response heterogeneity based on the health of the lender.
A third related literature concerns the renegotiation of debt contracts and the purpose
5
and consequences of including covenants. The theoretical literature has traditionally viewed
covenants as a means to overcome the agency problem inherent in lending contracts by lim-
iting the possible actions taken by the borrower and shifting control to the lender if the bor-
rower’s financial condition deteriorates (Aghion and Bolton, 1992; Nini et al., 2009; Garleanu
and Zwiebel, 2009; Acharya et al., 2014; Bradley and Roberts, 2015). Yet, covenant violations
occur routinely, and lenders often provide waivers for the violation while taking minimal ad-
ditional action. Our paper complements the borrower-centric view by showing that covenants
also allow lenders to adjust loan terms when lender health deteriorates, consistent with the
symmetric view of incomplete contracting in Hart and Moore (1988).
More broadly, as emphasized by Roberts and Sufi (2009b), Mian and Santos (2011), Denis
and Wang (2014), and Roberts (2015), almost all long-term debt contracts undergo renegotiation
prior to maturity. Roberts and Sufi (2009b), Denis and Wang (2014), and Roberts (2015) find
evidence of borrower characteristics affecting the timing and outcome of such negotiations but
do not consider individual lender health as a determinant. The sharp shift in bargaining power
toward lenders following a covenant violation creates a natural means for lender health to affect
the renegotiation process. The ubiquity of renegotiation even in the absence of a violation
suggests lender health could affect recontracting for an even larger set of borrowers.
Finally, a macroeconomic literature studies the link between banks and the real economy in
dynamic general equilibrium models (Gertler and Kiyotaki, 2010; He and Krishnamurthy, 2013;
Brunnermeier and Sannikov, 2014). These models typically assume one period or continuously
updated contracts. Our results provide some justification for this simplification by showing that
even long-term contracts have de facto much shorter horizons due to loan covenants. These
6
models also have the implication that unhealthy banks will especially want to reduce credit to
riskier borrowers because the value of a marginal dollar of losses rises as the bank moves closer
to its default boundary. Because covenant violators are riskier than the overall population of
firms, through the lens of these models loan covenants allow banks to reduce credit to exactly
those borrowers to whom they most value a reduction in exposure.
2. Data and Main Variable Definitions
We describe the main features of our data and provide additional details in the online
appendix.
2.1. Loan and Covenant Data
SNC. The Shared National Credit Program (SNC) data set is a joint supervisory data set
of the Federal Reserve, FDIC, and Office of the Comptroller of the Currency. Employees of
these institutions may use the data for research purposes. The SNC collects information on all
loans of at least $20 million shared by three or more unaffiliated financial institutions under the
regulatory purview of one of the SNC supervisors. For each loan in the data set, SNC reports
the borrower, loan type, drawn and undrawn balance on December 31st of the reporting year,
and the ownership shares of the syndicate lead lender and all participants including institutions
not regulated by a SNC supervisor.2
Beginning in 2006, SNC began collecting detailed information on non-price terms and
covenant compliance for a subset of loans covering about 1/3 of the loan volume in the SNC
2The official term for the unit of observation in the SNC data set is a credit. A credit may consist of multiplefacilities jointly arranged by the same syndicate and signed on the same date. The corresponding term in DealScanis a package. For simplicity, in the text we use “loan” interchangeably with SNC credit.
7
universe. We refer to loans in this subset as the covenant sample.3 For each loan in the covenant
sample, SNC obtains information on covenants and compliance from loan documentation aug-
mented by supervisory inquiries to the banks when information is missing or incomplete.
Covenant violations. For each loan in the covenant sample, SNC reports whether the loan
remains in compliance throughout the year. If the loan remains compliant, SNC reports whether
it would have been noncompliant but for a covenant waiver or reset granted by the lender. We
consider a covenant to bind in either circumstance. We therefore define the variable Bindt to
equal 1 if a loan breaches any covenant threshold during year t. Following a violation, a lender
may choose to waive or reset the covenant or may force either repayment or restructuring of
the loan. In practice, the resolution of a loan restructuring process can take a few months to
achieve. We therefore use as our main measure the variable Bindt−1:t = max{Bindt−1, Bindt}
which equals 1 if a loan breached a covenant in either the current or previous year.4
Comparison to other data sets. The SNC covenant sample offers important advantages over
previous data sets. Unlike the Thomson Reuters DealScan database which collects information
on newly originated syndicated loans, SNC carefully tracks loans after origination including
subsequent modifications and covenant violations. A number of papers have started from the
DealScan database and hand-collected information on subsequent loan outcomes from public
filings or by matching to Compustat. Relative to these data sets, and crucial to a cross-sectional
study, SNC contains many more observations per year and contains comprehensive information
3SNC parlance also refers to this subset as the “Review sample.”4Loans often contain cross-default provisions by which a covenant breach on one loan triggers technical default
on another. We have experimented with defining Bindt−1:t based on whether any loan to the borrower breaches acovenant with no meaningful changes in our loan-level analysis. Similarly, our results remain quantitatively similarif we use Bindt as our main measure of a violation.
8
on the lender’s response to a violation.5 Third, the SNC data identify a covenant breach even
if it results in a waiver. Such violations may not appear in data sets constructed from public
filings. Fourth, SNC contains a representative share of non-public borrowers, whereas data sets
based on either public filings or matching to Compustat contain publicly-traded borrowers.
2.2. Lender Health Measures
The 2008-09 period offers a useful laboratory for studying the transmission from banks to
corporate borrowers because the origins of the financial distress lay outside the corporate loan
sector. Rather, prominent explanations include the exposure of financial institutions to real
estate markets and toxic assets, counterparty risk and network proximity to failing institutions,
and liability structure and susceptibility to shadow bank runs (see e.g. Ivashina and Scharfstein,
2010; Cornett et al., 2011; Erel et al., 2011; Fahlenbrach et al., 2012; Santos, 2011). Our measures
of lender health, adopted from Chodorow-Reich (2014), reflect each of these forces.
The first measure, originally proposed by Ivashina and Scharfstein (2010), identifies a bank’s
exposure to Lehman Brothers through the fraction of the bank’s syndication portfolio in which
Lehman Brothers had a lead role. This exposure affected banks directly through the syndicated
market as firms with credit lines provided by Lehman Brothers drew down the remainder of
their credit line as a precautionary measure following the Lehman bankruptcy, resulting in a
draining of liquidity from other syndicate members. The second lender health variable measures
a bank’s exposure to private-label mortgage-backed securities through the correlation of its daily
5For example, the data hand-collected from SEC filings by Nini et al. (2009) and extended in Freudenberg etal. (2015) follow roughly 400 originations per year and do not include comprehensive information on the lender’sresponse to a violation. Denis and Wang (2014) and Roberts and Sufi (2009b) collect some of this information butfor subsets of roughly 100 originations per year, while Roberts (2015) collects information on renegotiations overthe life of a loan contract but for a sample of 114 firms. Studies which rely on matching to Compustat (Chava andRoberts, 2008; Falato and Liang, 2016) or scrape SEC filings (Nini et al., 2009, 2012) to identify financial covenantviolations do not have information on the lender’s response to a violation.
9
stock return with the return on the ABX AAA 2006-H1 index in the fourth quarter of 2007.
The ABX AAA 2006-H1 index follows the price of residential mortgage-backed securities issued
during the second half of 2005 and with a AAA rating at issuance. The correlation indicates the
market’s perception of the bank’s exposure to the mortgage crisis. The third measure combines
a variety of balance sheet items: 2007-08 trading revenue as a share of assets, 2007-08 real estate
net charge-offs, and the 2007 ratio of bank deposits to assets, weighted using regression loadings
for predicting loan growth.6
The validity of these measures requires that they have predictive power for bank lending
behavior and that assignment of borrowers and lenders before the crisis be “as good as random”.
Regarding predictive power, Chodorow-Reich (2014) shows that each measure can explain a
substantial part of the cross-section of new lending during the 2008-09 period. The origin of
the 2008-09 crisis outside of the corporate loan sector makes “as good as random” assignment a
priori plausible. Nonetheless, sorting of banks and borrowers might occur. However, Chodorow-
Reich (2014) finds that borrowers of different lenders appear ex ante similar along observable
characteristics such as the employment declines in the borrower’s industry and county. We
report below similar ex ante balancing using variables available only in the SNC data, including
importantly the fraction of loans which breach a covenant and ex ante risk rating, and also show
that balancing holds within the subset of covenant violators. Chodorow-Reich (2014) further
shows balancing holds along unobserved characteristics using a specification with borrower fixed
effects. Finally, financial markets before the crisis, as embodied in spreads on credit default
swaps, did not predict which banks would become most distressed, making it unlikely higher
6We use the version of these measures provided at http://scholar.harvard.edu/files/chodorow-reich/
quality borrowers could have purposefully chosen more stable lenders.
For brevity of presentation, we extract the first principal component of the three measures of
lender health and create a rank-normalized variable Bad Lender as the rank of the first principal
component relative to all lenders divided by the number of lenders. The variable Bad Lender
therefore lies on the unit interval, with the lender in worst health receiving a value of 1. Our
main results are not sensitive to using this measure or one of the three subcomponents.
Syndicated loans such as those in the SNC data include a lead lender and participant lenders.
The lead lender manages the servicing of the loan, provides the largest share of the funds, and
typically cannot sell its share of the loan in the secondary market. Most loan contracts require
the agreement of lenders providing at least 51% of the commitment to accelerate repayment or
modify loan terms following a covenant breach. Because the lead lender retains the largest share
of the loan, plays an organizing role among syndicate members, and as the servicing agent has
responsibility for carrying out any renegotiation, in our main results we assign lender health on
the basis of the lead lender only.7 Effectively, we assume the lead lender is always pivotal in
resolving a covenant violation. Our main results are robust to broader definitions of the health
of the syndicate as we show in section 4.1.3.
3. Summary Statistics and Balancing Tests
Our main sample consists of all term loans and credit lines to nonfinancial borrowers in the
SNC covenant sample with a lead lender in the Chodorow-Reich (2014) data set and which
7Unlike in DealScan where many loans list multiple lead arrangers, the SNC supervisors always identify a singlelead arranger as the servicing agent.
11
start the year with at least one year of maturity remaining.8 The last restriction means that
our empirical exercises focus only on loans which, absent a covenant violation, would have been
insulated from the health of the lender over the course of the year.
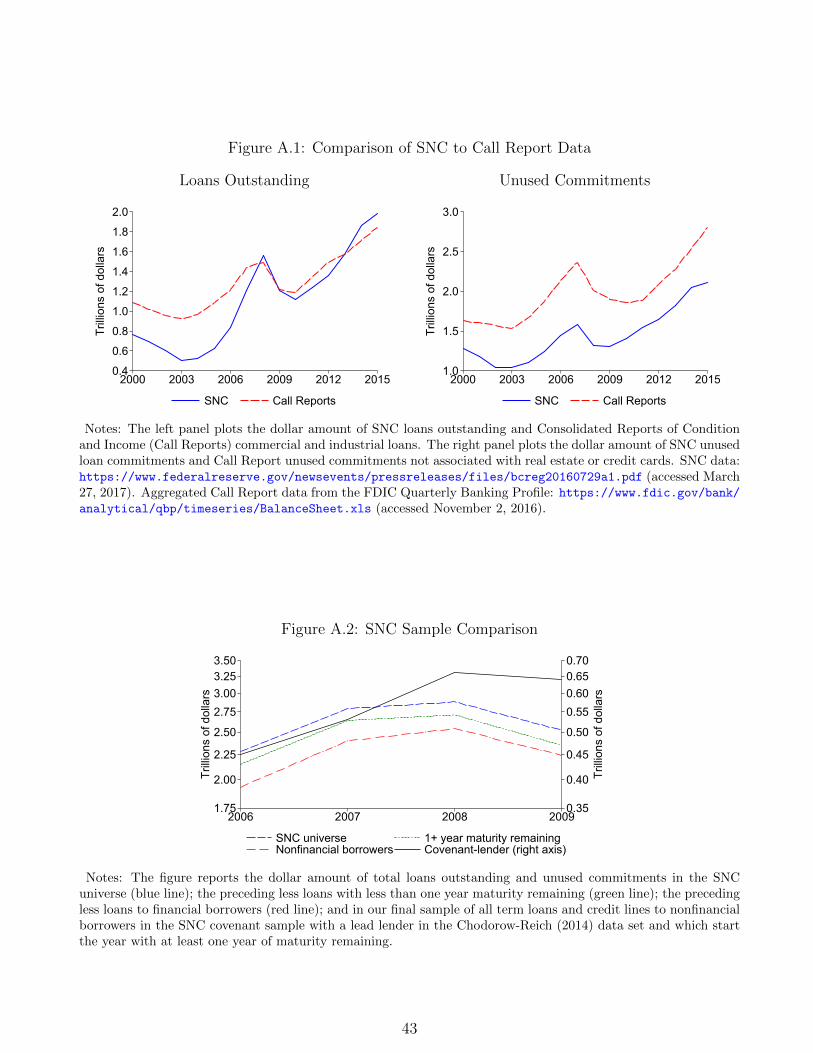
Sample comparison. Syndicated lending accounts for a large share of total lending volume
in the U.S. economy. As shown in figure A.1, the full SNC universe (including all loan types
and loans to financial borrowers) contained $1.2 trillion of loans drawn and $2.79 trillion of
loans drawn and unused commitments outstanding as of the end of 2007. For comparison,
the Consolidated Reports of Condition and Income (Call Reports) contained $1.44 trillion of
commercial and industrial loans drawn and $2.37 trillion of unused commitments not associated
with real estate or credit cards from all U.S. commercial banks on that date.9
Table 1 reports summary statistics for the pre-crisis and crisis periods for the full SNC
universe of term loans and credit lines to nonfinancial borrowers (columns 1 and 4), for the
subset of these loans in the covenant sample (columns 2 and 5), and for those loans in the
covenant sample for which we have a measure of the health of the lead lender (columns 3 and
6). Table 1 and figure A.2 show that the coverage of the SNC covenant sample has increased
over time. During the crisis years of 2008-09, the covenant sample contains about one-third of
the number of loans and loan volume as the full SNC universe, up from roughly one-quarter
8Chodorow-Reich (2014) constructs measures of lender health for the 43 most active lead lenders in the DealScandata prior to the 2008-09 crisis. However, about one-quarter of these lenders are foreign-owned or otherwisenot under the regulatory purview of the SNC supervisors and therefore excluded from the SNC data unless theparticipants include multiple supervised lenders.
9Besides the $20 million threshold and syndication requirement for inclusion in the SNC data, totals in the CallReports and SNC may differ because SNC includes the part of loans provided by non-bank lenders if they are part ofa syndicate covered by SNC, because SNC may include some lending not classified as commercial and industrial inthe Call Reports, and because the residual category for unused commitments in the Call Report data may containnon commercial and industrial loans. While these differences affect the levels, figure A.1 shows that the growthrates of aggregates in the two data sets track each other closely. As an alternative benchmark, since November2012 the Federal Reserve Survey of Terms of Business Lending has reported the fraction made under syndication ofall origination volume of commercial and industrial loans made by commercial banks; averaged across all monthsfrom November 2012 through August 2016, this fraction is 47.5%.
12
before the crisis. Loans in the covenant sample are of similar average size and maturity, exhibit
a similar breakdown between term loans and credit lines, have similar utilization rates, and have
similar propensities to get modified as those in the full universe. While the covenant sample
purports to overweight loans rated below best quality or ”pass,” the composition of borrower
credit quality remains similar to the SNC universe.10 More than 90% of the loan volume in the
covenant sample comes from loans with lead lenders in our lender data set. Loans from these
lenders appear similar to the full covenant sample along all dimensions.
Maturity. The vast majority of bank loans are of long maturity. In both the full SNC data and
the covenant sample, roughly 90% of all loans and commitments outstanding at the end of 2007
had at least 1 year of maturity remaining and more than three-quarters had maturity remaining
of at least 2 years.11 The long maturity of bank debt constricts the channels through which bank
health can transmit to borrower outcomes. As a corollary, imposing the sample restriction of
only including firms with 1+ year maturity remaining in order to focus on seemingly insulated
borrowers has only a small practical effect on our results.
of loans in the SNC covenant sample violate a covenant during a typical year before the 2008-09
10Not shown in the table, the share of credits rated as best (worst) quality or “pass” (“loss”) is about 83%(0.29%) in the SNC universe and about 82% (0.33%) in the covenant sample. The sector composition of loans inthe covenant sample is also similar to the SNC universe and broadly representative of the sectoral composition ofthe U.S. economy – more than one-quarter of loans are to firms in the services sector and roughly one-third areto firms in manufacturing or retail. Loans to bank borrowers (< 0.5%) and loans to non-bank financial borrowers(8%) make up a small share of SNC and our results are robust to not excluding them.
11The maturity of loans in SNC closely resembles the maturity structure of all long-term debt. Of firms inCompustat with positive long-term debt outstanding, the median amount due in less than one year is about 5% ofthe total and the 75th percentile is less than 20%. Across all firms in Compustat, the median firm has long-termdebt of less than 0.2% of assets maturing within a year and the 75th percentile firm has maturing debt of lessthan 2% of assets. These ratios are roughly the same for debt due in each of 2007, 2008, and 2009. The ratios arebased on all firms in the Compustat Annual file with non-negative revenue, assets, investment, or cash, with assetsgreater than each of cash, investment, and property, plant, and equipment, and with assets of at least $10 millionand asset growth of lower than 200%.
13
Table 1: Summary Statistics
Pre-crisis (2006-07) Crisis (2008-09)
Sample: Universe CovenantLender-covenant
Universe CovenantLender-covenant
(1) (2) (3) (4) (5) (6)
Loans of any maturityFraction 1+ year remaining 0.91 0.92 0.92 0.88 0.88 0.89
Notes: The table reports summary statistics for the pre-crisis (2006-07) and crisis (2008-09) periods and for threesamples. Columns with header “Universe” report summary statistics for the universe of credit lines and term loansto nonfinancial borrowers in the full SNC data set. Columns with header “Covenant” report summary statistics forthe subset of these loans in the SNC covenant sample. Columns with header “Lender-covenant” report summarystatistics for our final sample of all credit lines and term loans in the covenant sample to nonfinancial borrowersand where the lead lender is in the Chodorow-Reich (2014) lender health data set. Credit reduced equals 1 if eitherthe loan is terminated before maturity or the loan commitment is reduced. Waiver equals 1 if the lender grantsa covenant waiver or modifies the covenant. New credit equals 1 if the borrower obtains new credit. Bindt andBindt−1:t are indicator variables equal to 1 if a loan breached a covenant in the current or either the current orprevious year, respectively. Total committed is the sum of loans outstanding and unused commitments averagedover the two year period.
14
financial crisis and one-third violate a covenant in each crisis year. This violation frequency
exceeds that reported in previous studies and it is instructive to compare to two prominent
earlier approaches. Dichev and Skinner (2002), Chava and Roberts (2008), and Falato and Liang
(2016) use Compustat to follow current ratio and net worth covenants reported at inception
in DealScan. Dichev and Skinner (2002) report that roughly 30% of loans violate one of these
covenants at some point during the life of the loan. However, this approach mechanically
understates the frequency of total violations because it considers only two types of covenants.12
In an innovative approach, Roberts and Sufi (2009a), Nini et al. (2009), and Nini et al. (2012)
scrape SEC 10-Q and 10-K filings of all publicly-traded firms looking for phrases associated
with violations. Roberts and Sufi (2009a) find just 1% of firms rated A or above report a
violation in a typical year, rising to 9% for B rated borrowers and 18% for borrowers rated
CCC or worse. Nini et al. (2012) use an improved version of the text-scraping algorithm and
find roughly 12% of all loans to publicly-traded firms are in violation during each of 2006 and
2007, or roughly half the frequency in the SNC data. Yet, while their data cover all covenant
types, firms do not need to report violations if they obtain an amendment or waiver before the
end of the reporting period. Indeed, while each year roughly 25% of loans in the SNC covenant
sample violate a covenant during 2006 or 2007, only 9% of loans violate a covenant and do
not receive a waiver.13 Finally, both previous approaches necessarily cover only publicly-traded
12It also contains measurement error because covenant thresholds change after the initial loan contract (Denisand Wang, 2014; Roberts, 2015).
13On the other hand, to the extent the SNC covenant sample overweights lower quality loans, the sample propen-sity may exceed that of the typical loan in the U.S. economy. We can distinguish these possibilities by makinga direct comparison of firm-years appearing in both the Nini et al. (2012, hereafter NSS) data set and the SNCcovenant sample. In the 601 overlapping firm-years covering the period 2006-2008, the violation propensity in SNCis roughly double that in NSS, reflecting 140 firm-years in which SNC identifies either a covenant violation or acovenant waiver while according to the NSS data the firm made no mention of such a violation or waiver in aregulatory filing. (There are 26 firm-years in which NSS identify a violation where SNC does not. These reflectcases where a firm obtained a preemptive waiver, for example in anticipation of missing a filing deadline or taking
15
borrowers. In the SNC data, private borrowers exhibit slightly higher violation propensities
than publicly-traded borrowers.
Balancing. Table 2 assesses the balancing of covariates by lender health. The left panel
includes all loans in our sample, while the right panel restricts to loans which violate a covenant.
Starting with the left panel, borrowers of lenders below and above the median of crisis lender
health had statistically indistinguishable mean assets, leverage, and supervisory risk rating
at the start of the crisis. The balancing along these variables, all drawn from SNC data,
complements the similarities in geography and industry reported in Chodorow-Reich (2014). Of
particular interest here, loans from lenders in good and bad health exhibit similar propensities
to violate a covenant.
The balancing of ex ante characteristics of borrowers and loans which violate a covenant
most directly affects the validity of our analysis below. Comparing the left and right panels,
covenant violators overall tend to be smaller and have ex ante riskier loans and higher pre-crisis
leverage. Crucial to our identification assumption, violators who had borrowed from healthier
and less healthy lenders have nearly identical size and pre-crisis leverage and similar risk ratings.
We cannot reject equality of means for any variable. Together, these results all suggest that
any differential outcome for covenant violators of healthier and unhealthy lenders was due to
the lenders’ response to a covenant violation and not ex ante characteristics of the borrowers.
a one-time charge-off on earnings, where a firm had multiple loans and violated a covenant on a loan not in theSNC sample, and a few cases where we could not identify from the SEC filing why the NSS procedure assigned aviolation.) Since the relative frequency of identified violations is similar in the overlapping sample to the relativefrequencies in the respective full samples, it appears that the higher overall violation propensity in SNC reflectsviolations missed by the NSS public filing procedure. We are grateful to Amir Sufi for providing us with the Niniet al. (2012) data set.
Notes: The table reports selected summary statistics by lender health. “Healthier lenders” are those for whichBad Lender <median and “Less healthy lenders” are those for which Bad Lender >median, where Bad Lenderis the rank of the lead lender’s health normalized to lie on the unit interval, with a value of 1 corresponding to theleast healthy lender.
4. Empirical Results
We present empirical results at the borrower and loan level. First, we use linear probability
models to show how a lender’s response to a covenant violation depends on its own health.
Placebo exercises and a “within borrower” estimator bolster our causal interpretation of the
results. We also show the response is larger for credit lines than term loans and for smaller,
more concentrated syndicates and where the lead has a larger share. Next, we measure the
change in total credit at the loan and borrower level and show that affected borrowers do
not substitute toward other sources of credit. Last, we report evidence of transmission of the
covenant channel to balance sheet and real outcomes such as investment and employment.
17
4.1. Loan-Level Outcomes
We start with linear probability models to explore how loan terms change following a
covenant violation, depending on lender health. Our main outcome variable, Credit reduced,
equals 1 if either the loan is terminated before maturity or the loan commitment is reduced.
The structure of SNC allows us to follow a loan through amendments, modifications, and refi-
nancing in constructing this variable. We consider Credit reduced to be the broadest measure
of whether a loan changes in a way unfavorable to the borrower. As a caveat, we do not observe
in SNC whether the interest rate changes, an issue we return to briefly below.
4.1.1. Non-parametric Evidence
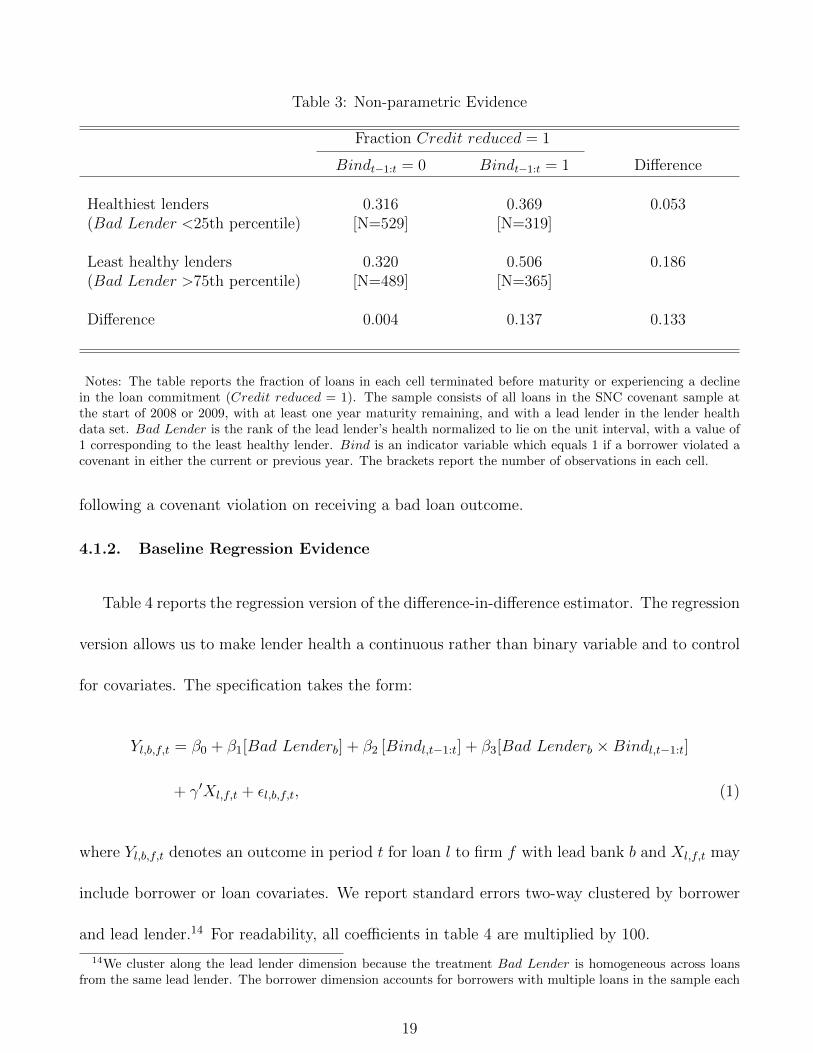
Table 3 shows a non-parametric version of our first main result using the variable Credit reduced
and comparing loans with lenders in the top and bottom quartile of lender health. Roughly
one-third of loans which do not have a covenant violation undergo an unfavorable modification.
This number may reflect renegotiation forced by the lender before a covenant violation occurred,
a mutually agreed reduction in credit limit, or an offsetting decline in the interest rate which
we do not observe. The propensity is similar for borrowers of healthy and less healthy lenders,
suggesting bad lender health by itself does not negatively affect the provision of credit to bor-
rowers who already have a loan. Borrowers who violate a covenant have a higher likelihood of
experiencing a bad loan outcome. For borrowers of healthier lenders, the likelihood rises by 5.3
percentage points. For borrowers of less healthy lenders, the likelihood rises by 18.6 percentage
points. The additional 13.3 percentage points rise in the probability of a bad outcome is the
non-parametric difference-in-difference estimate of the effect of having a lender in bad health
Notes: The table reports the fraction of loans in each cell terminated before maturity or experiencing a declinein the loan commitment (Credit reduced = 1). The sample consists of all loans in the SNC covenant sample atthe start of 2008 or 2009, with at least one year maturity remaining, and with a lead lender in the lender healthdata set. Bad Lender is the rank of the lead lender’s health normalized to lie on the unit interval, with a value of1 corresponding to the least healthy lender. Bind is an indicator variable which equals 1 if a borrower violated acovenant in either the current or previous year. The brackets report the number of observations in each cell.
following a covenant violation on receiving a bad loan outcome.
4.1.2. Baseline Regression Evidence
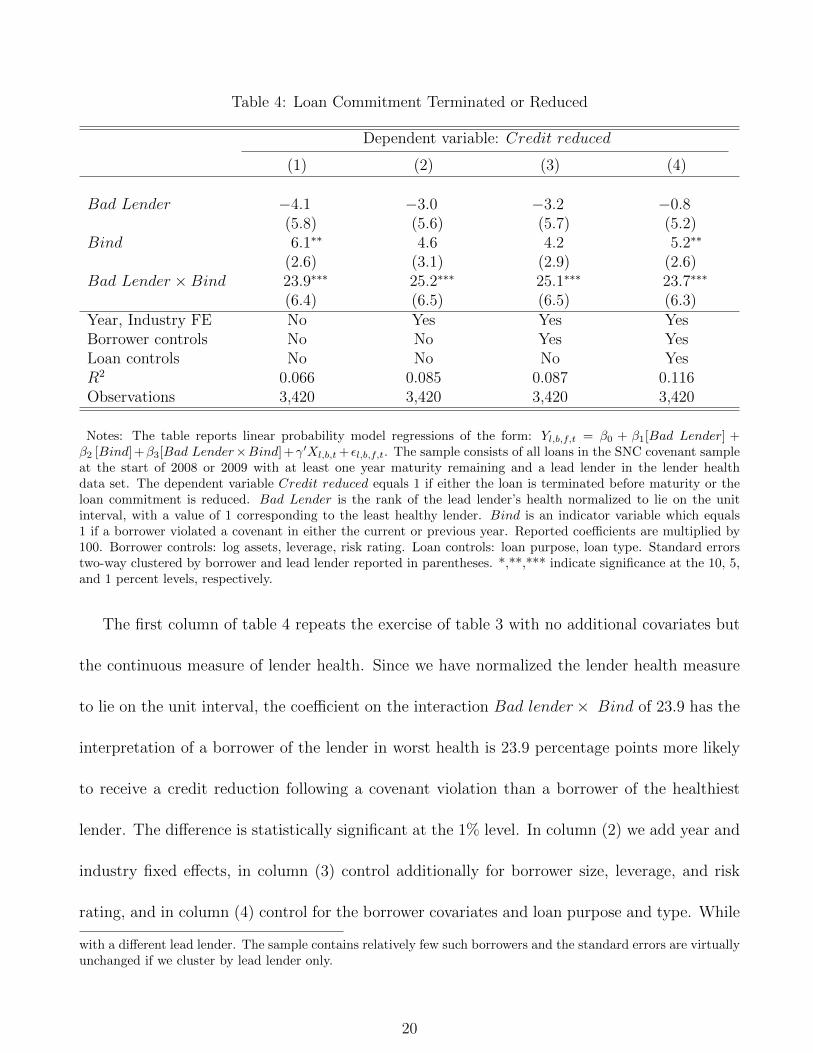
Table 4 reports the regression version of the difference-in-difference estimator. The regression
version allows us to make lender health a continuous rather than binary variable and to control
where Yl,b,f,t denotes an outcome in period t for loan l to firm f with lead bank b and Xl,f,t may
include borrower or loan covariates. We report standard errors two-way clustered by borrower
and lead lender.14 For readability, all coefficients in table 4 are multiplied by 100.
14We cluster along the lead lender dimension because the treatment Bad Lender is homogeneous across loansfrom the same lead lender. The borrower dimension accounts for borrowers with multiple loans in the sample each
19
Table 4: Loan Commitment Terminated or Reduced
Dependent variable: Credit reduced
(1) (2) (3) (4)
Bad Lender −4.1 −3.0 −3.2 −0.8(5.8) (5.6) (5.7) (5.2)
(6.4) (6.5) (6.5) (6.3)Year, Industry FE No Yes Yes YesBorrower controls No No Yes YesLoan controls No No No YesR2 0.066 0.085 0.087 0.116Observations 3,420 3,420 3,420 3,420
Notes: The table reports linear probability model regressions of the form: Yl,b,f,t = β0 + β1[Bad Lender] +β2 [Bind]+β3[Bad Lender×Bind]+γ′Xl,b,t + εl,b,f,t. The sample consists of all loans in the SNC covenant sampleat the start of 2008 or 2009 with at least one year maturity remaining and a lead lender in the lender healthdata set. The dependent variable Credit reduced equals 1 if either the loan is terminated before maturity or theloan commitment is reduced. Bad Lender is the rank of the lead lender’s health normalized to lie on the unitinterval, with a value of 1 corresponding to the least healthy lender. Bind is an indicator variable which equals1 if a borrower violated a covenant in either the current or previous year. Reported coefficients are multiplied by100. Borrower controls: log assets, leverage, risk rating. Loan controls: loan purpose, loan type. Standard errorstwo-way clustered by borrower and lead lender reported in parentheses. *,**,*** indicate significance at the 10, 5,and 1 percent levels, respectively.
The first column of table 4 repeats the exercise of table 3 with no additional covariates but
the continuous measure of lender health. Since we have normalized the lender health measure
to lie on the unit interval, the coefficient on the interaction Bad lender× Bind of 23.9 has the
interpretation of a borrower of the lender in worst health is 23.9 percentage points more likely
to receive a credit reduction following a covenant violation than a borrower of the healthiest
lender. The difference is statistically significant at the 1% level. In column (2) we add year and
industry fixed effects, in column (3) control additionally for borrower size, leverage, and risk
rating, and in column (4) control for the borrower covariates and loan purpose and type. While
with a different lead lender. The sample contains relatively few such borrowers and the standard errors are virtuallyunchanged if we cluster by lead lender only.
20
the explanatory power of the regression rises with the controls, the magnitude and statistical
significance of the interaction coefficient remains quite stable. The stability of the coefficient
reflects the sample balancing in table 2 and is consistent with the identification requirement that
borrowers be “as good as randomly assigned” to lenders. Because the coefficient remains stable,
in the remainder of the paper we report only specifications including the full set of borrower
and (if applicable) loan controls and year and industry fixed effects. As in table 4, we find very
similar quantitative results whether or not we include these control variables.
The small and statistically insignificant estimate of β1, the coefficient on the main effect
for Bad Lender, also merits comment. The near zero (indeed slightly negative) coefficient
indicates that borrowers attached to bad lenders but who did not violate a covenant did not
experience any higher likelihood of having their credit diminished. This result makes sense
if the positive estimate of the interaction term coefficient β3 stems from covenant violations
providing an opportunity for distressed lenders to reduce credit; borrowers who did not breach
a covenant started the year with a loan contract with maturity remaining of at least one year
and the long-term contract insulated them from the health of their lender. If alternatively the
positive estimate of β3 obtains simply because borrowers of more distressed lenders experienced
a correlated decline in loan demand and voluntarily reduced their credit lines, we would have
found both β1 and β3 to be positive.15
Table 5 reports difference-in-difference results for two other binary outcomes, receiving a
15The economic interpretation of the main effect on Bad Lender explains why we include it in the regressionrather than a lender fixed effect. Nonetheless, if we replace the term β1[Bad Lenderb] in equation (1) with a lenderfixed effect αb, we obtain nearly identical estimates of the main effect on Bind β2 and the interaction coefficientβ3. For example, in the specification with full controls, we obtain β2 = 5.2 (s.e.=2.4) and β3 = 23.6 (s.e.=6.1). Wealso find in unreported regressions based on merging the SNC data with loan pricing information in DealScan anincrease in interest costs for covenant violators of unhealthy lenders, a result again inconsistent with a voluntaryreduction in loan amount.
21
Table 5: Waiver and New Credit
Dependent variable: Waiver New credit
(1) (2)
Bad Lender 3.8 3.9(3.3) (2.4)
Bind 75.3∗∗∗ −1.5(1.7) (1.9)
Bad Lender ×Bind −66.5∗∗∗ −8.9∗
(10.7) (4.7)Year, Industry FE Yes YesBorrower, Loan Controls Yes YesR2 0.511 0.224Observations 3,420 3,420
Notes: The table reports linear probability model regressions of the form: Yl,b,f,t = β0 + β1[Bad Lender] +β2 [Bind] + β3[Bad Lender × Bind] + γ′Xl,b,t + εl,b,f,t. The sample is the same as table 4. In column (1) thedependent variable Waiver equals 1 if the lender grants a covenant waiver or modifies the covenant. In column (2)the dependent variable New credit equals 1 if the borrower obtains new credit. Bad Lender is the rank of the leadlender’s health normalized to lie on the unit interval, with a value of 1 corresponding to the least healthy lender.Bind is an indicator variable which equals 1 if a borrower violated a covenant in either the current or previous year.Reported coefficients are multiplied by 100. Borrower controls: log assets, leverage, risk rating. Loan controls:loan purpose, loan type. Standard errors two-way clustered by borrower and lead lender reported in parentheses.*,*** indicate significance at the 10 and 1 percent levels, respectively.
waiver or reset on a covenant violation and having the loan commitment increased. In column
(1), the dependent variableWaiver equals 1 if the lender grants a covenant waiver or modifies the
covenant. Usually such waivers occur only after a violation, but they can also happen without
a violation imminent. Not surprisingly, the probability of receiving a waiver rises sharply if the
loan would otherwise be in technical default. The main effect on Bind indicates that for the
healthiest lender, 75% of violations receive a waiver. The coefficient on the interaction of -67
means that only about 8% of loans from lenders in the worst health receive a waiver.
Column (2) examines whether violating a covenant and having a lender in bad health also
affects the likelihood of a borrower receiving an expansion in credit available. Specifically,
New credit equals 1 if the existing loan commitment increases or the borrower obtains new
22
credit not connected to its existing outstanding loans. Unlike a reduction or canceling of a
credit line, which a lender may have a statutory right to do following a violation, an expansion
of credit constitutes a positive outcome for a borrower. Nonetheless, violating a covenant may
restrict the borrower’s outside option in obtaining financing from a different source and lenders
can exploit their bargaining power against such borrowers by refusing to negotiate a refinancing
or offer additional credit. The regression evidence is consistent with this theory. Breaching a
covenant causes a roughly 9 p.p. lower probability of the borrower obtaining an expanded credit
commitment if the loan came from the least healthy lender.
4.1.3. Robustness and Specification Tests
Table 6 reports robustness to the measure of lender health. As a benchmark, column (1)
reproduces column (4) of table 4 and shows our baseline regression of the effect of lender health
and a covenant violation on the likelihood that a borrower receives a credit reduction. Column
(2) replaces the measure of lender health with the health of the pre-crisis lead lender, defined
using loans outstanding in June 2007.16 Therefore, it uses only information on borrower-lender
matches made before lender health during the crisis became apparent. In practice, the stickiness
of bank-borrower relationships makes lender health in June 2007 highly correlated with lender
health at the start of 2008 or 2009 and we obtain very similar quantitative results using the
June 2007 health variable.
Columns (3)-(6) demonstrate the robustness to including the health of syndicate participants,
in columns (3) and (4) using a commitment share-weighted mean of syndicate health and in
16This date falls a few weeks before the implosion of the two Bear Stearns hedge funds which marked the start ofthe subprime crisis, but at a point when few observers expected significant financial disruption. For example, theFederal Reserve meeting statement from June 28, 2007 acknowledges “ongoing adjustment in the housing sector”but expects the economy to expand “at a moderate pace over coming quarters” and sees the “risk that inflationwill fail to moderate as expected” as the “predominant policy concern.”
Bad Lender ×Bind 23.7∗∗∗ 27.3∗∗∗ 33.0∗∗ 27.2∗∗∗ 21.6∗∗ 19.0∗∗
(6.3) (5.1) (15.3) (9.5) (10.5) (8.6)Impute non-bank using lead n.a. n.a. No Yes No YesYear, Industry FE Yes Yes Yes Yes Yes YesBorrower, Loan Controls Yes Yes Yes Yes Yes YesObservations 3,420 2,844 3,420 3,420 3,420 3,420
Notes: The table reports linear probability model regressions of the form: Yl,b,f,t = β0 + β1[Bad Lender] +β2 [Bind] + β3[Bad Lender × Bind] + γ′Xl,b,t + εl,b,f,t. Column (1) reproduces column (4) of table 4. In column(2) the sample and variable definitions are the same as in column (1) except that the sample excludes loans toborrowers without a loan in SNC as of June 2007 and lender health assignment is based on the lead lender as ofJune 2007. In columns (3)-(6) the sample and variable definitions are the same as in column (1) except that lenderhealth assignment is based on the weighted mean health of banks in the crisis syndicate (column 3), the weightedmean health of the crisis syndicate imputing the health of the lead for non-banks (column 4), the weighted medianhealth of banks in the crisis syndicate (column 5), or the weighted median health of the crisis syndicate imputingthe health of the lead for non-banks (column 6). In all columns, the dependent variable Credit reduced equals 1 ifeither the loan is terminated before maturity or the loan commitment is reduced; Bad Lender is normalized to lieon the unit interval, with a value of 1 corresponding to the least healthy lender; and Bind is an indicator variablewhich equals 1 if a borrower violated a covenant in either the current or previous year. Reported coefficientsare multiplied by 100. Borrower controls: log assets, leverage, risk rating. Loan controls: loan purpose, loantype. Standard errors two-way clustered by borrower and lead lender reported in parentheses. *,**,*** indicatesignificance at the 10, 5, and 1 percent levels, respectively.
columns (5) and (6) using a commitment share-weighted median. The weighted mean is a
natural alternative to the health of the lead. Recalling that the standard loan contract requires
the agreement of lenders providing at least 51% of the commitment to accelerate repayment
or modify loan terms following a covenant breach, the weighted median assigns Bad Lender
based on the health of the marginal lender required to build a coalition to renegotiate the loan.
As a caveat, we lack a measure of the health of non-bank participants such as hedge funds,
24
pension funds, or CLOs. For the average loan, these non-bank participants provide 40% of
the total commitment. However, non-bank participants typically play a relatively passive role
in syndicate management. We therefore assume they either follow the banks in the syndicate
(columns 3 and 5) or follow the direction of the lead (columns 4 and 6) and impute a health
measure for the non-banks accordingly. Using either the weighted mean or weighted median
measure and either assumption for the non-banks yields similar (and statistically significant)
point estimates of the coefficient on Bad Lender × Bind, β3, as the baseline coefficient in
column (1). The larger standard errors for β3 in columns (3)-(6) compared to column (1),
however, accord with our baseline assumption that the lead lender health alone best captures
the health of the pivotal member in resolving a covenant violation.17
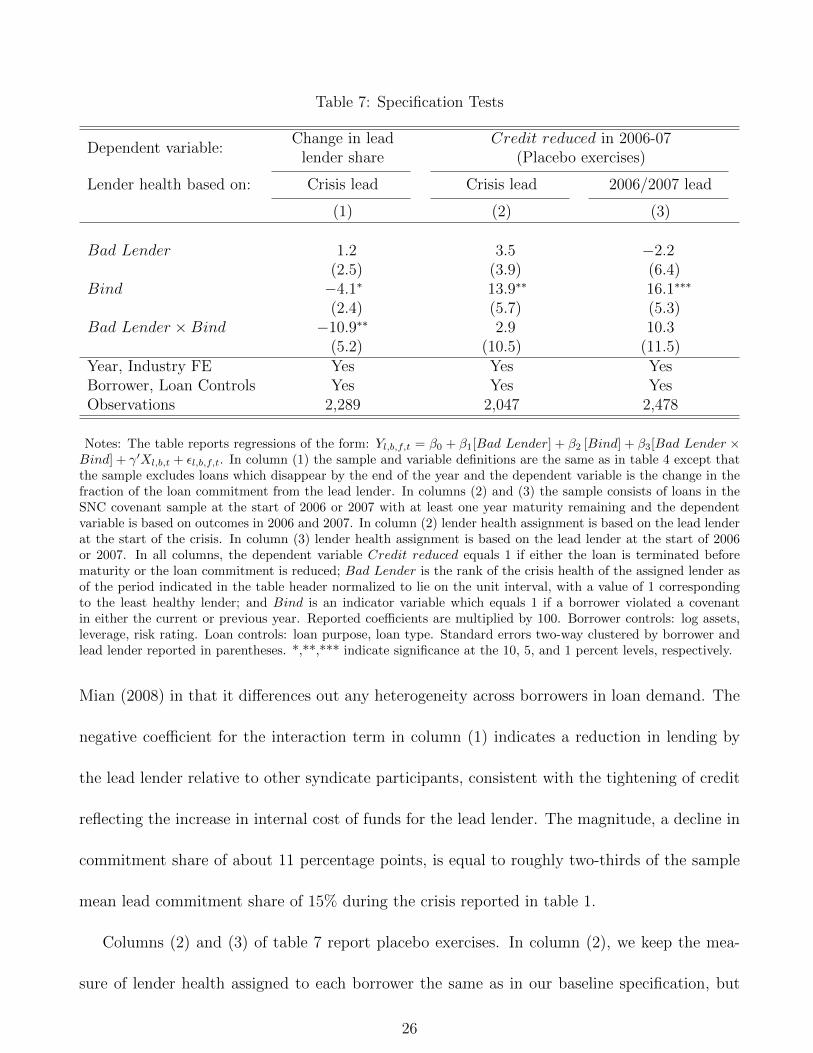
Table 7 reports three additional specification tests which further support a causal interpreta-
tion of our main result. First, in column (1) we estimate the difference-in-difference specification
(1) with the dependent variable Yl,b,f,t the change in the lead lender’s share of the loan commit-
ment. If a decline in its health caused the lead lender to force a tightening of credit provision
following a covenant violation, we should expect the lead lender’s share of the renegotiated
loan to decline on average. If instead the tightening of credit reflected only some unobservable
attribute of the borrower, the lead lender share should remain constant or even increase due
to enhanced agency problems between the lead and the other syndicate members. Notably,
using the change in the lead’s share as the dependent variable in equation (1) is akin to having
bilateral credit to a borrower as the dependent variable but including a borrower-loan fixed
effect. This specification therefore closely resembles the “within estimator” of Khwaja and
17The correlations of the four alternative measures of lender health shown in columns (3)-(6) with the baselinemeasure are 0.48, 0.80, 0.42, and 0.77.
25
Table 7: Specification Tests
Dependent variable:Change in lead Credit reduced in 2006-07
lender share (Placebo exercises)
Lender health based on: Crisis lead Crisis lead 2006/2007 lead
(5.2) (10.5) (11.5)Year, Industry FE Yes Yes YesBorrower, Loan Controls Yes Yes YesObservations 2,289 2,047 2,478
Notes: The table reports regressions of the form: Yl,b,f,t = β0 + β1[Bad Lender] + β2 [Bind] + β3[Bad Lender ×Bind] + γ′Xl,b,t + εl,b,f,t. In column (1) the sample and variable definitions are the same as in table 4 except thatthe sample excludes loans which disappear by the end of the year and the dependent variable is the change in thefraction of the loan commitment from the lead lender. In columns (2) and (3) the sample consists of loans in theSNC covenant sample at the start of 2006 or 2007 with at least one year maturity remaining and the dependentvariable is based on outcomes in 2006 and 2007. In column (2) lender health assignment is based on the lead lenderat the start of the crisis. In column (3) lender health assignment is based on the lead lender at the start of 2006or 2007. In all columns, the dependent variable Credit reduced equals 1 if either the loan is terminated beforematurity or the loan commitment is reduced; Bad Lender is the rank of the crisis health of the assigned lender asof the period indicated in the table header normalized to lie on the unit interval, with a value of 1 correspondingto the least healthy lender; and Bind is an indicator variable which equals 1 if a borrower violated a covenantin either the current or previous year. Reported coefficients are multiplied by 100. Borrower controls: log assets,leverage, risk rating. Loan controls: loan purpose, loan type. Standard errors two-way clustered by borrower andlead lender reported in parentheses. *,**,*** indicate significance at the 10, 5, and 1 percent levels, respectively.
Mian (2008) in that it differences out any heterogeneity across borrowers in loan demand. The
negative coefficient for the interaction term in column (1) indicates a reduction in lending by
the lead lender relative to other syndicate participants, consistent with the tightening of credit
reflecting the increase in internal cost of funds for the lead lender. The magnitude, a decline in
commitment share of about 11 percentage points, is equal to roughly two-thirds of the sample
mean lead commitment share of 15% during the crisis reported in table 1.
Columns (2) and (3) of table 7 report placebo exercises. In column (2), we keep the mea-
sure of lender health assigned to each borrower the same as in our baseline specification, but
26
re-estimate the difference-in-difference regressions from table 4 for the likelihood of a credit
commitment reduction in 2006 and 2007. This exercise asks whether borrowers of lenders in
worse health during the crisis were treated differently before the crisis upon violating a covenant.
In column (3), we keep the measure of lender health the same but reassign borrowers to their
lender as of the start of 2006 or 2007. This exercise asks whether banks in worse health in 2008
and 2009 always treat covenant violators worse, or whether the differential treatment occurs
only during the financial crisis. In neither case can we reject that the differential treatment
occurred only during the crisis. The estimates of the interaction term coefficient β3 are small
in magnitude and statistically indistinguishable from zero. The harsh treatment of covenant
violators by unhealthy banks during the crisis appears to reflect the health of the bank and not
some time-invariant bank or borrower characteristic.18
4.1.4. Heterogeneity
The structure of loan contracts offers predictions for how the intensity of the treatment effect
of having an unhealthy lender and violating a covenant may vary by type of borrower and loan.
Table 8 explores this treatment heterogeneity. The table reports the coefficients β3 and β3,I
18In contrast, we find positive and statistically significant evidence that unconditionally having a covenant bindinglowers credit in the pre-crisis period (β2 > 0 in columns (2) and (3)). Of course, this result does not invalidate theplacebo exercise. We would expect lenders to use covenant violations to restrict credit on some loans even outsidethe crisis. But this outcome should not occur differentially at lenders more impacted by the crisis, exactly as wefind.
27
Table 8: Heterogeneity
Dependent variable: Credit reduced
Interaction variable I: Credit lineHigh lead
shareSmall
syndicateConcentrated
syndicate
(1) (2) (3) (4)
Bad Lender ×Bind 17.4∗∗∗ 14.8∗ 8.4 10.2(4.2) (8.4) (11.7) (9.8)
Notes: The table reports linear probability model regressions of the form: Yl,b,f,t = β0 + β1[Bad Lender] +β2 [Bind]+β3[Bad Lender×Bind]+γ′Xl,b,t +β0,I [I]+β1,I [Bad Lender×I]+β2,I [Bind× I]+β3,I [Bad Lender×Bind × I] + γ′I [Xl,b,t × I] + εl,b,f,t. The sample is the same as table 4. The dependent variable Credit reducedequals 1 if either the loan is terminated before maturity or the loan commitment is reduced. Bad Lender is therank of the lead lender’s health normalized to lie on the unit interval, with a value of 1 corresponding to the leasthealthy lender. Bind is an indicator variable which equals 1 if a borrower violated a covenant in either the currentor previous year. In column (1), I is an indicator variable for whether the loan is a credit line. In column (2), I isan indicator variable for whether the lead lender’s share of the loan commitment is above the sample median. Incolumn (3), I is an indicator variable for whether the number of syndicate members is below the sample median.In column (4), I is an indicator variable for whether the Herfindahl index of loan commitment shares is above thesample median. Reported coefficients are multiplied by 100. Borrower controls: log assets, leverage, risk rating.Loan controls: loan purpose, loan type. Standard errors two-way clustered by borrower and lead lender reportedin parentheses. *,**,*** indicate significance at the 10, 5, and 1 percent levels, respectively.
where I is an indicator variable described in the table header. Thus, β3 is numerically equivalent
to the coefficient from a separate regression including only observations for which variable I takes
a value of 0, while β3+β3,I is numerically equivalent to the coefficient from a separate regression
including only observations for which variable I takes a value of 1. The statistical significance
of β3,I answers whether the data reject the null hypothesis of a homogeneous coefficient on
[Bad Lender ×Bind] in the two subsamples.
The first column of table 8 explores heterogeneity along the dimension of loan type. Because
28
reducing the size of a term loan requires immediate repayment while reducing the limit on a
credit line can impact only the unused portion of the commitment, the latter may have a less
immediately drastic effect on borrowers. If so, lenders may more readily take action when the
loan is a credit line than if it is a term loan. Column (1) shows that this heterogeneity holds
in the data. While unhealthy lenders reduce credit to covenant violators with both term loans
and credit lines, the likelihood of a credit reduction is nearly double if the loan is a credit line
and the difference is statistically significant at the 5% level.
Columns (2)-(4) explore the importance of the syndicate structure. In column (2), the
interaction variable equals 1 if the lead’s share of the total commitment is above the sample
median, in column (3) the interaction variable equals 1 if the number of syndicate members is
below the sample median, and in column (4) the interaction variable equals 1 if the concentration
(herfindahl index) of the lender shares is above the sample median. Smaller, more concentrated,
syndicates and those with a larger lead share are more likely to reduce credit. The larger effect
for loans with a higher lead share is again indicative of the lead lender having a special role in
the syndicate due to its monitoring and organizing responsibilities and responding to greater
incentive to organize and oversee a renegotiation when it provides a larger share of the loan
commitment.19 The results in columns (3) and (4) suggest that smaller, more concentrated
syndicates may be easier to organize.
19Alternatively, since the variableBad Lender reflects the health of the lead lender, the variable may simply betterproxy for the true health of the pivotal syndicate member when the lead provides a larger share of the commitment.While we cannot rule out this possibility, in unreported regressions we also find a statistically significant largertreatment effect for loans with a higher lead share even when we define Bad Lender using the weighted medianlender’s health as described in the previous subsection. Thus, the positive interaction term appears to reflect truedependence on the lead’s share.
29
4.2. Effect on Credit Available and Substitution
We have seen that lenders react differently to covenant violations depending on their own
health. We now examine the effect on total credit available to the borrower.
Whether the health of a borrower’s lender matters to the borrower depends on the ease
with which a borrower can substitute new credit from an alternative lender. Previous litera-
ture has motivated costly switching from asymmetric information between old and new lenders
(Williamson, 1987; Sharpe, 1990; Hachem, 2011; Darmouni, 2016). An even simpler explanation
may apply in the case of covenant violators – lenders will not make new loans to borrowers in
technical default, as cross-default provisions mean that the triggering of a covenant on one loan
puts the borrower in technical default on other loans and uncertain resolution of the violation
deters new lenders from offering credit.
Column (1) of table 9 reports estimates of equation (1) where the dependent variable is the
percent change in the total amount committed and the sample contains only loans which began
the year with remaining maturity greater than one year and remain in existence at the end of
the year. Thus, this column shows the intensive margin change in credit at the loan level. The
interaction coefficient of -13.2 indicates a 13 percentage points intensive margin decline in loan
commitment for loans which trigger a violation and where the lender is in poor health.
In column (2), we add to the sample loans which began the year with maturity greater
than one year but are prematurely terminated and impute a value of 0 for the end of year
commitment on terminated loans. We also add to the end of year commitment any new credit
from syndicates with lead bank b to firm f .20 Thus, column (2) captures the intensive and
20While SNC treats amendments or refinancing as a continuation of the same loan, very large changes in loan
Bad Lender ×Bind −13.2∗∗∗ −22.9∗∗∗ −26.0∗∗∗ −8.8 −4.5∗∗
(3.2) (7.5) (8.9) (9.1) (2.0)Year, Industry FE Yes Yes Yes Yes YesBorrower controls Yes Yes Yes Yes YesLoan controls Yes Yes No No NoFrequency Annual Annual Annual Annual Long-differenceDep. var. source SNC SNC SNC SNC CompustatObservations 2,289 3,420 1,803 1,525 376
Notes: The table reports OLS regressions of the form: Y = β0 + β1[Bad Lender] + β2 [Bind] + β3[Bad Lender ×Bind] + γ′X + ε. In column (1) the sample is the same as table 4 except it excludes loans which disappear bythe end of the year; in column (2) the sample is the same as table 4; in column (3) the sample contains all loansin the SNC universe to a borrower in the table 4 sample and the data are collapsed to the borrower level; incolumn (4) the sample contains all borrowers in the table 4 sample with at least one SNC loan outstanding at theend of the year; and in column (5) the sample contains all borrowers in the table 4 sample which we match toCompustat. Bad Lender is the rank of the lead lender’s health normalized to lie on the unit interval, with a valueof 1 corresponding to the least healthy lender. Bind is an indicator variable which equals 1 if a borrower violated acovenant in either the current or previous year. In column (1) the dependent variable Yl,b,f,t is the percent changein total committed credit associated with loan l. In column (2) the dependent variable Yb,f,t is the percent changein total committed credit on loans from lead lender b to borrower f . In column (3) the dependent variable Yf,t is thepercent change in total committed credit aggregated across all loans to borrower f in the SNC universe. In column(4) the dependent variable Yf,t is the change in total non-SNC debt, defined as total debt less the drawn portionof SNC loans, as a percentage of beginning of period total book assets. In column (5) the dependent variable isthe change from 2007 to 2009 in issuance of long-term debt less reduction in long-term debt as a percentage of2007 total book assets, winsorized at the 1% level. SNC Borrower controls: log assets, leverage, risk rating. Loancontrols: loan purpose, loan type. Standard errors two-way clustered by borrower and lead lender (columns 1 and2) or borrower and worst lead lender (columns 3-5) reported in parentheses. *,**,*** indicate significance at the10, 5, and 1 percent levels, respectively.
extensive margin of credit available from lead bank b to firm f . Including loan terminations
structure or changes to the syndicate may result in the creation of a new loan identifier. Aggregating to the lender-borrower level ensures we do not erroneously impute a loan termination when in fact the lending relationshipcontinued with a different loan identifier. The aggregation includes loans in the full SNC universe which do notappear in the covenant sample.
31
causes the interaction coefficient to rise by about two-thirds in absolute value relative to the
specification including only the intensive margin. Across these two columns and similar to the
results in table 4, we find much smaller coefficients on the main effects for Bad Lender and
Bind, reflecting the insulation of borrowers with long-term loan contracts who do not violate
a covenant from the health of their lender in the case of Bad Lender, and the pervasiveness of
covenant waivers granted by lenders in good health in the case of Bind.
Column (3) aggregates to the borrower level. Here and elsewhere, when we aggregate to the
borrower level, we define both Bind and Bad Lender as the maximum across all loans for firms
with multiple loans in the covenant sample. The dependent variable is the percent change in all
loans to the borrower in the full SNC universe. Analyzing the effect on loan commitment at the
borrower level allows for any substitution margin by borrowers toward lenders already servicing
different loans or the opening of new loans. We find even larger percent declines in credit
available after aggregating to the borrower level. Because the denominator of the dependent
variable in column (3) includes all loan commitments to the borrower and therefore (weakly)
exceeds the denominator in column (2), the larger interaction coefficient in column (3) indicates
that affected borrowers receive less credit from other lenders.21 While this result implies a
complete absence of substitution toward other lenders, it is consistent with the result in column
(2) of table 5 that affected borrowers are less likely to open a new loan, with cross-default
provisions in loan contracts putting borrowers into technical default in their other loans, and
21Recall that the SNC universe contains all loans of at least $20 million shared by three or more unaffiliatedfinancial institutions under the regulatory purview of one of the SNC supervisors. If borrowers substitute loansnot in the SNC universe, then the result in column (3) could overstate the magnitude of the total bank creditdecline. However, we have estimated a similar specification for the number of new loans reported by a borrower inDealScan, which does not condition on the identity of the lender, and also find a reduced likelihood of a new loanreported in DealScan for borrowers of unhealthy lenders who violate a covenant.
32
with the reluctance of lenders to provide new loans to a borrower with an unresolved covenant
violation.
Columns (4) and (5) examine whether borrowers substitute non-bank sources of credit. In
column (4), we use the measure of total debt reported in SNC. This variable has the advantage
that we observe it for all borrowers, including non-public borrowers, but the drawback that a
borrower must appear in SNC at the end of the year for us to observe the debt measure so that
the column (4) sample excludes borrowers whose loans were terminated. To isolate substitution
toward non-SNC debt, we subtract from the total the sum of SNC term loans and the drawn
part of SNC credit lines and compute the difference between the beginning and end of the year
as a percentage of beginning of period total assets. We find no evidence of affected borrowers
substituting toward non-SNC credit; the coefficient on the interaction term Bad Lender×Bind
is statistically insignificant and the point estimate is negative.
In column (5) we study the effect on debt issuance reported in Compustat. While the
restriction to firms which we can match to Compustat reduces the number of observations, it
avoids the censoring problem of borrowers which leave the SNC data.22 In all specifications
using a dependent variable from Compustat we report long-difference regressions of the form:
where Yf,2007−2009 is the change in a variable between 2007 and 2009 associated with firm f which
had loans from bank b. By differencing, we control for any unobserved level differences across
22The merge uses company names and the string matching algorithm SAS SPEDIS. We manually review eachproposed match for accuracy. The online appendix provides additional details on the merge procedure. We winsorizeall Compustat variables at the 1% level.
33
borrowers. The coefficient β3 identifies the effect of violating a covenant sometime between 2007
and 2009 and having a bad lender on the outcome. The interaction term in column (5) indicates
that long-term debt issuance falls for the affected borrowers. Together, the results in columns
(4) and (5) appear inconsistent with any ability to substitute toward non-bank debt for these
borrowers, as technical default prevents the issuance of other debt.23
4.3. Balance Sheet Adjustment and Real Outcomes
We now turn to how borrowers adjust to lower credit. Previous research has found evidence
of both lender health (e.g. Chodorow-Reich, 2014) and covenant violations (Chava and Roberts,
2008; Nini et al., 2012; Falato and Liang, 2016) negatively affecting firm investment and em-
ployment. Here we ask to what extent the interaction of these two variables matters above the
main effects.
We first discuss financial margins of adjustment which substitute for higher credit limits or
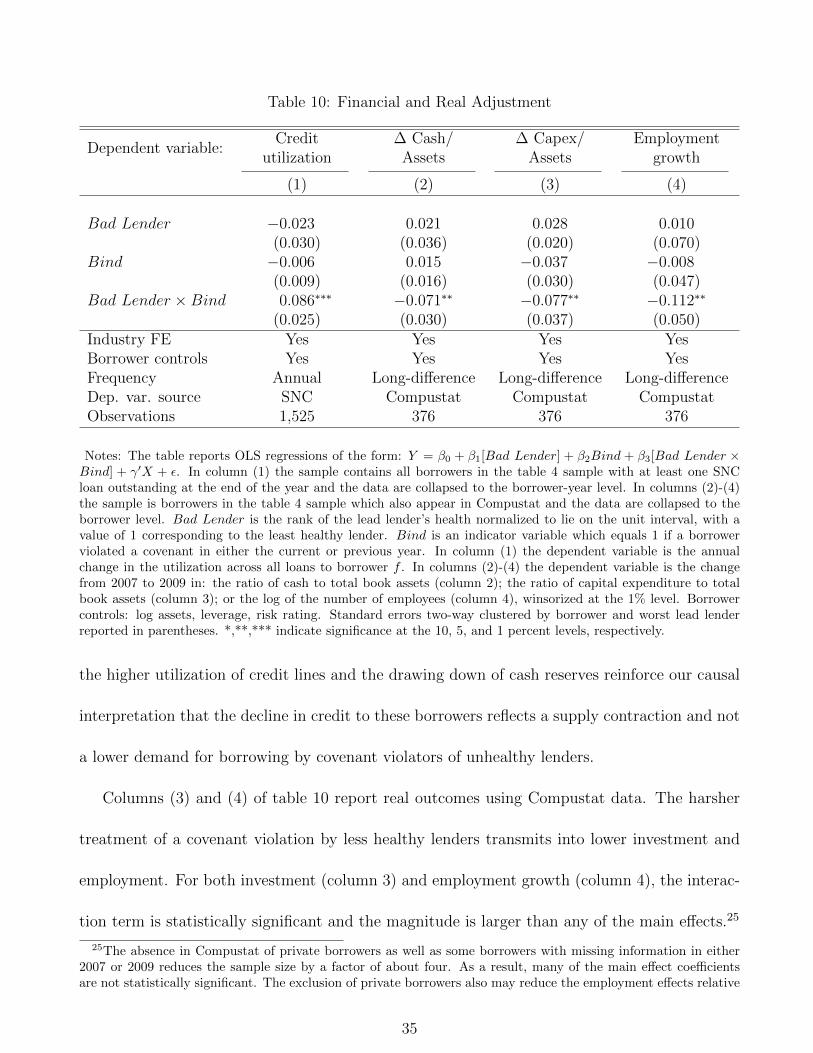
loan balances. Column (1) of table 10 shows using SNC data that the credit line utilization
rate rises for covenant violators of less healthy lenders.24 The coefficient of 0.086 indicates an
increase in utilization of 8.6 percentage points relative to a baseline utilization rate of 62%
during the crisis reported in table 1. Column (2) shows using Compustat data and the long-
difference specification (3) that firms also adjust by drawing down cash reserves. Together,
23We have also investigated new issuance of public debt using the Mergent FISD database and again find anegative and statistically significant coefficient on new debt issuance for firms which violate a covenant and have alender in bad health.
24Because borrowers with multiple credit lines may substitute across lines, we aggregate all credit lines to theborrower level and compute the change in utilization for borrowers with at least one loan outstanding at thebeginning and end of the year. Higher utilization can result either from a draw down of the unused portion of thecredit line or a reduction in the credit limit. The evidence in table 9 suggests at least part of the higher utilizationreflects the reduction in credit limits by unhealthy lenders. We do not interpret this mechanical effect as innocuousfor the borrower, however, as firms value the flexibility and insurance aspects of having unused credit commitments.Otherwise, they would never open credit lines.
Notes: The table reports OLS regressions of the form: Y = β0 + β1[Bad Lender] + β2Bind + β3[Bad Lender ×Bind] + γ′X + ε. In column (1) the sample contains all borrowers in the table 4 sample with at least one SNCloan outstanding at the end of the year and the data are collapsed to the borrower-year level. In columns (2)-(4)the sample is borrowers in the table 4 sample which also appear in Compustat and the data are collapsed to theborrower level. Bad Lender is the rank of the lead lender’s health normalized to lie on the unit interval, with avalue of 1 corresponding to the least healthy lender. Bind is an indicator variable which equals 1 if a borrowerviolated a covenant in either the current or previous year. In column (1) the dependent variable is the annualchange in the utilization across all loans to borrower f . In columns (2)-(4) the dependent variable is the changefrom 2007 to 2009 in: the ratio of cash to total book assets (column 2); the ratio of capital expenditure to totalbook assets (column 3); or the log of the number of employees (column 4), winsorized at the 1% level. Borrowercontrols: log assets, leverage, risk rating. Standard errors two-way clustered by borrower and worst lead lenderreported in parentheses. *,**,*** indicate significance at the 10, 5, and 1 percent levels, respectively.
the higher utilization of credit lines and the drawing down of cash reserves reinforce our causal
interpretation that the decline in credit to these borrowers reflects a supply contraction and not
a lower demand for borrowing by covenant violators of unhealthy lenders.
Columns (3) and (4) of table 10 report real outcomes using Compustat data. The harsher
treatment of a covenant violation by less healthy lenders transmits into lower investment and
employment. For both investment (column 3) and employment growth (column 4), the interac-
tion term is statistically significant and the magnitude is larger than any of the main effects.25
25The absence in Compustat of private borrowers as well as some borrowers with missing information in either2007 or 2009 reduces the sample size by a factor of about four. As a result, many of the main effect coefficientsare not statistically significant. The exclusion of private borrowers also may reduce the employment effects relative
35
5. Aggregation
The previous section showed that unhealthy lenders squeeze borrowers who trigger a covenant
violation and that this interaction matters to loan and borrower-level outcomes. We now quan-
tify the total decline in the stock of credit, including commitments, during the crisis mechanically
attributable to the loan covenant channel.
This calculation takes the following steps. Column (2) of table 9 reported an interaction
coefficient of β3 = −22.9 for the intensive and extensive margin percent change in loan volume
for loans from unhealthy lenders and which violate a covenant. Using this coefficient, the
in-sample fitted decline in lending volume (including unused commitments) due to unhealthy
lenders squeezing violators is:
Fitted decline = − (0.01× β3)×∑l
Bad Lenderb ×Bindl,t−1:t × Commitl,t−1, (4)
where Commitl,t−1 is the loan commitment at the end of the previous year. The contribution
to total credit growth in the SNC covenant sample is this sum divided by total initial credit
committed and is reported in table 11. At the end of 2008, 5.8% of the dollar commitments
outstanding as of the end of 2007 had disappeared due to unhealthy lenders contracting credit
on loans which violated covenants. The corresponding decline in 2009 is 5.9%. Therefore, by
the end of 2009 the loan covenant channel accounted for an 11.4% decline in the stock of credit
outstanding relative to 2007.
For comparison, the total stock of credit outstanding (including new loans and commitments)
to Chodorow-Reich (2014), who found the effects of lender health on employment were largest for small borrowersand borrowers without access to public debt markets.
36
Table 11: Aggregate Importance
t = 2008 t = 2009
(1) (2)
SNC covenant sample decline due to interaction 5.8% 5.9%
Notes: The table reports the ratio − (β3∑
lBad Lenderb ×Bindl,t−1:t × Commitl,t−1) / (∑
l Commitl,t−1).
in the full SNC universe contracted by 9.7% between 2007 and 2009. Thus, the reduction in
credit due to the loan covenant channel is larger than the total decline in credit outstanding.
Of course, total credit likely would not have stayed flat if bank health hadn’t deteriorated, as
either rising borrower demand (total credit had increased in the years before the crisis) or a
decline in credit demand due to the weak economy would have impacted the quantity of credit.
Without taking a stand on this counterfactual, we cannot provide an exact contribution share
of the covenant channel to the overall transmission of lender health to corporate borrowers.
Nonetheless, it seems unlikely that borrower credit demand could have increased much during
the severe recession of 2008 and 2009. We conclude that the transmission of bank health to
nonfinancial firms occurs largely through the loan covenant channel.
6. Conclusion
We have investigated the importance of lender health in determining the response to a
covenant violation. Using a new supervisory data set of bank loans, we document a higher
covenant violation propensity than found in previous work, with more than one-third of loans
breaching a covenant each year during 2008 and 2009. Lenders in worse financial condition are
less likely to grant a waiver and more likely to force a reduction in the loan balance following
37
a violation. Quantitatively, the reduction in credit to borrowers with long-term credit but
who violate a covenant accounts for an 11% decline in the volume of loans and commitments
outstanding between 2007 and 2009.
Our results have implications not explored in this paper. We highlight three. First, when
writing loan contracts ex ante, do lenders and borrowers internalize the effective option to
shorten maturity which covenants offer? Our results suggest they should. However, a body of
research finds that managers may be overconfident in their outlook for their firm (Malmendier
and Tate, 2015), in which case they may underestimate the likelihood of breaching a financial
covenant. Second, our evidence comes from a particularly acute crisis period. While such
episodes merit special attention due to their macroeconomic importance, the pervasiveness of
covenant violations in non-crisis periods means that this channel may also matter in more
tranquil times. Third, because on average lower quality and smaller firms violate covenants, the
importance of this channel suggests credit tightening may affect the allocation as well as the
quantity of credit. Future research could take up these questions.
38
References
Acharya, Viral, Heitor Almeida, Filippo Ippolito, and Ander Perez, “Credit lines as monitored
liquidity insurance: Theory and evidence,” Journal of Financial Economics, 2014, 112 (3),
287 – 319.
Aghion, Philippe and Patrick Bolton, “An Incomplete Contracts Approach to Financial Con-
tracting,” The Review of Economic Studies, 1992, 59 (3), 473–494.
Almeida, Heitor, Murillo Campello, and Michael S. Weisbach, “The Cash Flow Sensitivity of
Cash,” The Journal of Finance, 2004, 59 (4), 1777–1804.
, , Bruno Laranjeira, and Scott Weisbenner, “Corporate Debt Maturity and the Real Effects
of the 2007 Credit Crisis,” Critical Finance Review, 2012, 1 (1), 3–58.
Amiti, Mary and David Weinstein, “How Much Do Idiosyncratic Bank Shocks Affect Invest-
ment? Evidence from Matched Bank-Firm Loan Data,” Journal of Political Economy, Forth-
coming.
Bacchetta, Philippe, Kenza Benhima, and Celine Poilly, “Corporate Cash and Employment,”
2014.
Benmelech, Efraim, Nittai Bergman, and Amit Seru, “Financing Labor,” 2015. NBER Working
Paper 17144.
Bentolila, Samuel, Marcel Jansen, and Gabriel Jimenez, “When Credit Dries Up: Job Losses in
the Great Recession,” 2016.
Bernanke, Ben, “Nonmonetary Effects of the Financial Crisis in the Propagation of the Great
Depression,” American Economic Review, 1983, 73 (3), 257–276.
Bradley, Michael and Michael R. Roberts, “The Structure and Pricing of Corporate Debt
Covenants,” Quarterly Journal of Finance, 2015, 05 (02), 1550001.
Brunnermeier, Markus and Yuliy Sannikov, “A Macroeconomic Model with a Financial Sector,”
American Economic Review, 2014, 104 (2), 379–421.
Campello, Murillo, Erasmo Giambona, John R. Graham, and Campbell R. Harvey, “Liquid-
ity Management and Corporate Investment During a Financial Crisis,” Review of Financial
Studies, 2011, 24 (6), 1944–1979.
39
, John R. Graham, and Campbell R. Harvey, “The real effects of financial constraints: Evi-
dence from a financial crisis,” Journal of Financial Economics, 2010, 97 (3), 470 – 487. The
2007-8 financial crisis: Lessons from corporate finance.
Chava, Sudheer and Michael Roberts, “How Does Financing Impact Investment? The Role of
Debt Covenants,” Journal of Finance, 2008, 63, 2085–2121.
Chodorow-Reich, Gabriel, “The Employment Effects of Credit Market Disruptions: Firm-level
Evidence from the 2008-9 Financial Crisis,” The Quarterly Journal of Economics, 2014, 129
(1), 1–59.
Cornett, Marcia, Jamie McNutt, Philip Strahan, and Hassan Tehranian, “Liquidity risk man-
agement and credit supply in the financial crisis,” Journal of Financial Economics, 2011, 101
(2), 297–312.
Darmouni, Olivier, “Estimating Informational Frictions in Sticky Relationships,” 2016.
Denis, David J. and Jing Wang, “Debt covenant renegotiations and creditor control rights,”
Journal of Financial Economics, 2014, 113 (3), 348 – 367.
Dichev, Ilia D. and Douglas J. Skinner, “LargeSample Evidence on the Debt Covenant Hypoth-
esis,” Journal of Accounting Research, 2002, 40 (4), 1091–1123.
Duchin, Ran, Oguzhan Ozbas, and Berk A. Sensoy, “Costly external finance, corporate invest-
ment, and the subprime mortgage credit crisis,” Journal of Financial Economics, 2010, 97
(3), 418 – 435.
Duygan-Bump, Burcu, Alexey Levkov, and Judit Montoriol-Garriga, “Financing constraints
and unemployment: Evidence from the Great Recession,” Journal of Monetary Economics,
2015, 75, 89 – 105.
Erel, Isil, Taylor Nadauld, and Rene Stulz, “Why Did U.S. Banks Invest in Highly-rated Secu-
ritization Tranches?,” 2011. NBER Working Paper 17269.
Fahlenbrach, Rudiger, Robert Prilmeier, and Rene Stulz, “This Time is the Same: Using Bank
Performance in 1998 to Explain Bank Performance During the Recent Financial Crisis,”
Journal of Finance, 2012, 67 (6), 2139–2185.
Falato, Antonio and Nellie Liang, “Do Creditor Rights Increase Employment Risk? Evidence
from Loan Covenants,” The Journal of Finance, 2016, pp. n/a–n/a.
40
Freudenberg, Felix, Bjorn Imbierowicz, Anthony Saunders, and Sascha Steffen, “Covenant Vio-
lations and Dynamic Loan Contracting,” 2015.
Gan, Jie, “The Real Effects of Asset Market Bubbles: Loan- and Firm-Level Evidence of a
Lending Channel,” The Review of Financial Studies, 2007, 20 (6), 1941–1973.
Garleanu, Nicolae and Jeffrey Zwiebel, “Design and Renegotiation of Debt Covenants,” Review
of Financial Studies, 2009, 22 (2), 749–781.
Gertler, Mark and Nobuhiro Kiyotaki, “Chapter 11 - Financial Intermediation and Credit Policy
in Business Cycle Analysis,” in Benjamin M. Friedman and Michael Woodford, eds., Handbook
of Monetary Economics, Vol. 3, Elsevier, 2010, pp. 547 – 599.
Hachem, Kinda, “Relationship lending and the transmission of monetary policy,” Journal of
Monetary Economics, 2011, 58 (68), 590 – 600.
Hart, Oliver and John Moore, “Incomplete Contracts and Renegotiation,” Econometrica, 1988,
56 (4), 755–785.
He, Zhiguo and Arvind Krishnamurthy, “Intermediary Asset Pricing,” American Economic
Review, 2013, 103 (2), 732–70.
Ivashina, Victoria and David Scharfstein, “Bank Lending During the Financial Crisis of 2008,”
Journal of Financial Economics, 2010, 97 (3), 319–338.
Khwaja, Asim Ijaz and Atif Mian, “Tracing the Impact of Bank Liquidity Shocks: Evidence
from an Emerging Market,” American Economic Review, 2008, 98 (4), 1413–1442.
Lin, Huidan and Daniel Paravisini, “The Effect of Financing Constraints on Risk,” Review of
Finance, 2012, 17 (1), 229–259.
Malmendier, Ulrike and Geoffrey Tate, “Behavioral CEOs: The Role of Managerial Overconfi-
dence,” Journal of Economic Perspectives, November 2015, 29 (4), 37–60.
Melcangi, Davide, “Firms’ Precautionary Savings and Employment During a Credit Crisis,”
2016.
Mian, Atif and Joao Santos, “Liquidity Risk and Maturity Management Over the Credit Cycle,”
2011.
41
Nini, Greg, David C. Smith, and Amir Sufi, “Creditor control rights and firm investment policy,”
Journal of Financial Economics, 2009, 92 (3), 400 – 420.
, , and , “Creditor Control Rights, Corporate Governance, and Firm Value,” Review of
Financial Studies, 2012, 25 (6), 1713–1761.
Peek, Joe and Eric Rosengren, “Collateral Damage: Effects of the Japanese Bank Crisis on Real
Activity in the United States,” American Economic Review, 2000, 90 (1), 30–45.
Roberts, Michael R., “The role of dynamic renegotiation and asymmetric information in financial
and Amir Sufi, “Control Rights and Capital Structure: An Empirical Investigation,” The
Journal of Finance, 2009, 64 (4), 1657–1695.
and , “Renegotiation of financial contracts: Evidence from private credit agreements,”
Journal of Financial Economics, 2009, 93 (2), 159 – 184.
Santos, Joao, “Bank Corporate Loan Pricing Following the Subprime Crisis,” Review of Finan-
cial Studies, 2011, 24 (6), 1916–1943.
Sharpe, Steven, “Asymmetric Information, Bank Lending and Implicit Contracts: A Stylized
Model of Customer Relationships,” The Journal of Finance, 1990, 45 (4), 1069–1087.
Siemer, Michael, “Employment Effects of Financial Constraints During the Great Recession,”
2016.
Williamson, Stephen, “Costly Monitoring, Loan Contracts, and Equilibrium Credit Rationing,”
The Quarterly Journal of Economics, 1987, 102 (1), 135–146.
Xiao, Jasmine, “Corporate Debt Structure, Precautionary Savings, and Investment Dynamics,”
2017.
42
Figure A.1: Comparison of SNC to Call Report Data
Loans Outstanding
0.4
0.6
0.8
1.0
1.2
1.4
1.6
1.8
2.0
Trill
ions
of d
olla
rs
2000 2003 2006 2009 2012 2015
SNC Call Reports
Unused Commitments
1.0
1.5
2.0
2.5
3.0
Trill
ions
of d
olla
rs
2000 2003 2006 2009 2012 2015
SNC Call Reports
Notes: The left panel plots the dollar amount of SNC loans outstanding and Consolidated Reports of Conditionand Income (Call Reports) commercial and industrial loans. The right panel plots the dollar amount of SNC unusedloan commitments and Call Report unused commitments not associated with real estate or credit cards. SNC data:https://www.federalreserve.gov/newsevents/pressreleases/files/bcreg20160729a1.pdf (accessed March27, 2017). Aggregated Call Report data from the FDIC Quarterly Banking Profile: https://www.fdic.gov/bank/analytical/qbp/timeseries/BalanceSheet.xls (accessed November 2, 2016).
Figure A.2: SNC Sample Comparison
0.35
0.40
0.45
0.50
0.550.600.650.70
Trill
ions
of d
olla
rs
1.75
2.00
2.25
2.50
2.753.003.253.50
Trill
ions
of d
olla
rs
2006 2007 2008 2009
SNC universe 1+ year maturity remainingNonfinancial borrowers Covenant-lender (right axis)
Notes: The figure reports the dollar amount of total loans outstanding and unused commitments in the SNCuniverse (blue line); the preceding less loans with less than one year maturity remaining (green line); the precedingless loans to financial borrowers (red line); and in our final sample of all term loans and credit lines to nonfinancialborrowers in the SNC covenant sample with a lead lender in the Chodorow-Reich (2014) data set and which startthe year with at least one year of maturity remaining.