The University of Georgia Center for Agribusiness and Economic Development College of Agricultural and Environmental Sciences The Local Food Impact: What if Georgians Ate Georgia Produce? Prepared by: Sharon P. Kane, Kent Wolfe, Marcia Jones, and John McKissick Center Report: CR-10-03 May 2010 CAED gratefully acknowledges the sponsors of this study, including Georgia Organics, University of Georgia, College of Agricultural and Environmental Sciences, Office of Environmental Sciences, Centers for Disease Control & Prevention, National Center for Environmental Health/Agency for Toxic Substances & Disease Registry, and Center of Innovation for Agribusiness.
Transcript
The University of Georgia
Center for Agribusiness and Economic Development
College of Agricultural and Environmental Sciences
The Local Food Impact: What if Georgians Ate Georgia Produce?
Prepared by:
Sharon P. Kane, Kent Wolfe, Marcia Jones, and John McKissick Center Report: CR-10-03
May 2010
CAED gratefully acknowledges the sponsors of this study, including Georgia Organics, University of Georgia, College of Agricultural and Environmental Sciences, Office of Environmental Sciences,
Centers for Disease Control & Prevention, National Center for Environmental Health/Agency for Toxic Substances & Disease Registry, and Center of Innovation for Agribusiness.
ii
Table of Contents Index of Tables and Figures ............................................................................................................................................... ii Executive Summary ........................................................................................................................................................... 1 Background and Overview ................................................................................................................................................. 3 Brief Overview of Previous Studies ................................................................................................................................... 3 Data and Methodology ....................................................................................................................................................... 6
Principles of Economic Impact Analysis ...................................................................................................................... 6 Georgia’s Agricultural Industry by the Numbers ............................................................................................................... 7
2007 Census of Agriculture ........................................................................................................................................... 7 Georgia Farm Gate Value Report .................................................................................................................................. 8 Ag Snapshots ................................................................................................................................................................. 9
Developing Scenarios to Examine Impact ....................................................................................................................... 12 Scenario One ............................................................................................................................................................... 15 Scenario Two ............................................................................................................................................................... 16 Scenario Three ............................................................................................................................................................. 17
Using the Georgia Farm Gate Value Report for Assessing the Impact of Locally Grown .............................................. 18 Farm Gate Value Scenario .......................................................................................................................................... 19 Additional $10 Per Week Scenario ............................................................................................................................. 20
Summary of Findings ....................................................................................................................................................... 20 Considerations and Future Research ................................................................................................................................ 22 References ........................................................................................................................................................................ 24 Index of Tables and Figures Table 1. Selected Findings from 2007 Census of Agriculture, Georgia ............................................................................ 8 Table 2. Comparison of Georgia and US Per Capita Fruit and Vegetable Consumption, 2007 ...................................... 11 Table 3. Fresh Consumption as Share of Total Consumption for Commodities with State Shortages, 2007 ................. 12 Table 4. Profile of Direct Sales in Comparison with Total Ag Products Sold, Georgia and U.S., 2007 ........................ 15 Table 5. Economic Impact of Direct Sales from Vegetable and Melon Farms, Georgia 2007 ....................................... 16 Table 6. Economic Impact of Direct Sales from Fruit and Nut Farms, Georgia 2007 .................................................... 16 Table 7. Potential Economic Impact of Direct Sales from Vegetable and Melon Farms at U.S. Average per Farm, Georgia 2007 ................................................................................................................................................................... 16 Table 8. Potential Economic Impact of Direct Sales from Fruit and Nut Farms at U.S. Average per Farm, Georgia 2007 ......................................................................................................................................................................................... 17 Table 9. Potential Economic Impact of Direct Sales from Vegetable and Melon Farms at U.S. Direct Sales Rate, Georgia 2007 ................................................................................................................................................................... 17 Table 10. Potential Economic Impact of Direct Sales from Fruit and Nut Farms at U.S. Direct Sales Rate, Georgia 2007 ................................................................................................................................................................................. 17 Table 11. Estimates of Final Demand for Local Purchases, Georgia 2007 ..................................................................... 19 Table 12. Potential Economic Impact of 5% Increase in Local Direct Sales from Vegetable, Melons, Fruit and Nuts, Georgia 2007 ................................................................................................................................................................... 20 Table 13. Summary of Total Economic Impact from Each Scenario .............................................................................. 21 Table 14. Agricultural Census Total Farm and Direct Sales, 2002 and 2007, All States and U.S. ................................. 26 Table 15. Value of Direct Sales ($1,000), Comparison of Georgia to Southern States and U.S. Average, 2007 ........... 27 Figure 1. Georgia Farm Gate Value Report, by Sector, 2007 ........................................................................................... 8 Figure 2. Trends in Direct Sales As Compared to Total Farm Sales: Georgia, Value of Sales ...................................... 14 Figure 3. Producer and Full Retail Value* of Potential Local Sales of Vegetables, Melons, Fruit, and Nuts ................ 19 Figure 4. Why Consumers Love to Buy Directly from Farmers, USDA ........................................................................ 22 Figure 5. Georgia Organics Planting Calendar ................................................................................................................ 28 Figure 6. Georgia Organics Annual Harvest Calendar .................................................................................................... 29
1
Executive Summary The following study, The Local Food Impact: What if Georgians Ate Georgia Produce?, conducted by the
University of Georgia, College of Agricultural and Environmental Sciences, Center for Agribusiness and
Economic Development (CAED), explores the potential impact of Georgia consumers purchasing more locally
grown food products, defined as grown and sold within the state. The topic is a popular one in recent years for
many reasons, including additional interest from consumers and new information about the many benefits from
purchasing and consuming local food products. Yet there exists few measurable details about what these
purchases can mean to the Georgia economy. Some highlights from the study include:
• The most recent Agricultural Census (2007) identified nearly 48,000 farms in Georgia, a decrease of 3%
from 2005. In contrast, the total dollar value of the agricultural products sold on Georgia farms increased
45% over the same period. Georgia’s Farm Gate Value Report for 2007 reported a direct farm gate value
of $11.6 billion for food and fiber production, which resulted in a total economic impact to the state of
over $58 billion. This impact comes from a diverse array of commodities, of which vegetables, fruits,
and nuts comprise approximately $1.1 billion of direct farm gate value, $2.85 billion in overall economic
impact, and accounted for more than 25,000 jobs in 2007.
• Closing the gap between what Georgia produces and local consumers eat can provide a valuable source of
additional direct or local sales and the resulting economic effects. If Georgians produced all of the fruits
and vegetables that they consumed, it could provide a way to close this utilization gap (the difference
between state-wide production and consumption) of over $780 million per year. Even if this level can’t
be achieved, simply closing the gap in one commodity–lettuce, for example–could mean an additional
$83.6 million of direct revenue to local producers.
• One component of local food sales is direct-to-consumer marketing by farmers or producers. In 2007
Georgia vegetable and melon farms sold over $5 million dollars worth of products directly to consumers
by methods such as Community Supported Agriculture (CSA), farmer’s markets, roadside stands, or pick-
your-own. Similarly, Georgia fruit and nut farms sold in excess of $2 million in products directly to
2
consumers. Considering all linkages within the economy (multiplier effects), these direct sales of over $7
million involved a total of 132 jobs, $4.5 million in labor income, $6.4 million in value added , and $14.4
million in output in the Georgia economy.
• If Georgia vegetable, melon, fruit, and nut farms increased their direct-to-consumer sales per farm to the
same average dollar value per farm as reported nationally, the result would be an increase from $7 million
in direct sales to over $13 million. This increase of direct sales, when including linkages throughout the
economy, would contribute 232 jobs, $7.4 million in labor income, $10.7 million in value added, and
$23.6 million in output to the Georgia economy.
• Another scenario analyzed the impact on the state’s economy if Georgia farmers overall increased their
proportion of direct-to-consumer vegetable, melon, fruit, and nut sales to the level found nationally,
resulting in an increase from $7 million in direct sales to over $14 million. In this scenario, the overall
contribution–including multiplier effects–would be 228 jobs, $8.1 million in labor income, $11.5 million
in value added, and $25.8 million in output.
• Using the Center for Agribusiness and Economic Development’s Farm Gate Value Report as the basis, an
additional scenario estimates the economic changes that would occur with every 5% increase in consumer
local purchases as a direct sale from the farmer/producer. Considering linkages throughout the economy,
the total effect to the Georgia economy for each 5% of consumer purchases captured locally is
approximately 345 jobs, $13.6 million in income, $19.2 million in value added, and $43.7 million in
output.
• From a broader perspective, if each of the approximately 3.7 million households in the State devoted $10
per week of their total food dollars to purchasing Georgia grown products–from any source, not just
directly from producers–it could provide over $1.9 billion food dollars reinvested back into the state.
This simulation allows an exploration of what a relatively small change in consumer behavior and budget
can mean to the state’s economy as a whole.
3
Background and Overview
The goal of this study – assessing the potential economic impact of consumers purchasing more locally grown
food products – has become a popular one in recent years with the increase in interest and information about the
benefits that may be attributed to purchasing and consuming local, fresh food products. Since economies can’t be
examined in a controlled laboratory setting as in some scientific disciplines, economic studies are conducted using
analytic, observational, or mathematical techniques requiring some assumptions to be made, both explicitly and
implicitly. One of the first issues to address in studying locally grown food products is that “locally grown” is a
term that may be defined in numerous ways. For example, one study refers to the “common metric” of being
grown within 100 miles of one’s home (Matthew 2008), as does the New Oxford American Dictionary in their
definition of locavore as the 2007 word of the year (Thilmany, Bond et al. 2008). On the other hand, an
Economic Research Service (ERS) economist refers to multiple definitions depending on the questions being
asked, with one defined as within 400 miles of home or within a particular state. The ERS economist suggests
further definitions that depend on the “bundle” of characteristics that one would prefer to group together –
perhaps support of small and mid-size farms, sustainability, or involving interaction between farmers and
consumers (Hand 2009). As mentioned in a recent study on local food systems, the ERS found that, in general,
there is not agreement on the definition of local food (Martinez, Hand et al. 2010). In the case of this study, our
definition of “locally grown” is “grown in Georgia”1. In performing this analysis, researchers will create a
number of scenarios assuming that purchases of locally grown products could change and what additional
economic activity might result. In every case, researchers will operate under the assumption that sufficient
capacity to meet any increased production already exists in the state.
Brief Overview of Previous Studies
Several states, regions, and localities throughout the U.S. have conducted comparable studies with a wide
range of methodologies, data usage, and outcomes. Ohio State University conducted a similar study (Sharp,
Webb et al. 2009) in which they analyzed (among other things) select characteristics of the Knox County, Ohio
1 This definition was determined in collaboration with study organizers as best fitting with the goals and limitations inherent in the analysis. See Giovannucci, D., E. Barham, et al. (2010). "Defining and Marketing "Local" Foods: Geographical Indications for US Products." Journal of World Intellectual Property 13(2): 94-120. for a recent discussion of defining local and what it can mean to small producers.
4
food and farming system, including potential opportunities and impacts of increasing local food production and
consumption. Researchers found demonstrable impact, looking at multiple possibilities using input/output
analysis for quantifying the economic effects on the county and the economic contribution of anticipated new
agricultural sales resulting from increasing specialty crop sales, retail food sales, and recruiting additional food
processing businesses to the area.
Researchers at Michigan Land Use Institute and Michigan State University in Eat Fresh and Grow Jobs,
Michigan (Cantrell, Conner et al. 2006), explored the potential for changes in how local fruit and vegetable
producers market their products as a way to “improve the profitability of the state’s valuable farmland, grow job
opportunities across the economy, and improve public health.” (p. 2). Their study found that switching to more
sales in fresh markets could result in additional jobs and revenue for the state economy. Hawaii viewed the
problem from the perspective of “food self-sufficiency.” Researchers (Leung and Loke 2008) examined impacts
from doubling the present local consumption of selected crops, achieving 100% self-sufficiency of selected food
products, and replacing 10% of imported foods with local. Utilizing input/output analysis, they found the impact
for each possibility to be “non-trivial.”
Virginia Cooperative Extension, Virginia Tech, and Virginia State University (Benson and Bendfelt 2007)
took on a similar task when they created a scenario estimating how certain localities would be impacted if
households spent $10 per week of their food dollars on local produce or farm-based Virginia products. Their
study found that the $10 change per household could result in an additional $555 million food dollars per year
reinvested in the local community. Other states, regions, and localities have also taken this approach.
The Leopold Center for Sustainable Agriculture has conducted several studies on the topic in recent years,
each from a slightly different vantage point. One of the earlier studies (Swenson 2006) viewed potential
economic impacts resulting from increased fruit and vegetable production along with increased direct and grocery
sales to consumers. This impact assessment applied four scenarios with variations on the assumptions for each
scenario. Details included the net impact and showed substantial economic development potential by substituting
Iowa products for those currently imported. Several of the scenarios explored methods of distribution that
included a range of products being direct marketed to consumers through a producer-owned network. Later work
5
along a similar vein (Swenson 2010a) determined that a producer-owned direct network requires more evidence
before consideration as a feasible method of distribution. Swenson also evaluated the regional impact that could
occur if producers in the region increased their fruit and vegetable production to meet local or regional demand
for those products. Again adopting the scenario approach, Swenson found that additional employment and labor
incomes could result. A broader work (Swenson 2010b) looked at potential economic values that might accrue to
producers and the regional economy if six Midwest states increased their production of 28 types of fresh fruits
and vegetables for local/regional consumption. In this case, all scenarios assumed that 50 percent of the local fruit
and vegetable products would be sold using the earlier mentioned producer-owned direct marketing outlets.2
Researchers in Vermont and Massachusetts (Timmons, Wang et al. 2008) use data from their states as
examples to outline a method of estimating local food capacity. Their method involves a comparison between
statewide figures and U.S. figures to arrive at a “local food maximum” or the potential for local food to meet local
needs (a maximum of 100% possible). They performed the analysis for each U.S. state using 2002 data, with the
estimation for Georgia at 39.3%. In addition, they applied another technique comparing pounds of food produced
to pounds of food consumed. Those researchers performed similar analysis on 2007 data (Timmons and Wang
2010) exploring limitations of Ag Census data and examining variations in direct sales between states in the U.S.
using regression analysis. They found that Georgia’s actual direct sales figures are below the predicted values in
the model, suggesting that there is additional potential for increasing direct sales of farm products to consumers.
Georgia Organics and Emory University sponsored a Georgia-based data compilation that highlighted
available data for the Atlanta Metro Region counties and the state as a whole (Meter 2008). Key among the
findings in this research is that approximately 80% of food purchased by Georgians is from outside of the state.
The research found that of the $20 billion in food purchased, an estimated $16 billion is produced outside of
Georgia. Though not specifically an economic impact study, this study presents a comprehensive summary of the
existing statistics on farm and food economies critical to Georgia.
In this analysis, researchers will also adopt a scenario methodology. However, because of the unique nature
of the Georgia food/agriculture economy, this study will not exactly replicate any of the described studies.
2 Other publications from the Leopold Center for Sustainable Agriculture can be found at their website, many exploring local food and related questions. (http://www.leopold.iastate.edu.)
6
Data and Methodology
The findings in this study are based on data from several sources, including the United States Census of
Agriculture (2007), the UGA Center for Agribusiness and Economic Development (CAED) Farm Gate Value
Report, and data from the Minnesota Implan Group, Inc. economic analysis model (see Principles of Economic
Impact Analysis section for details).
Principles of Economic Impact Analysis
Economic impacts result from a multiplier effect that begins with input expenditures stimulating business to
business spending, personal income, employment, and tax revenue. Economic impacts can be estimated using
input-output models (in this case, IMPLAN from the Minnesota Implan Group, Inc.) that separate the economy
into various industrial sectors such as agriculture, construction, manufacturing, trade, and services. The input-
output model then calculates how a change in one industry changes output, income, and employment in other
industries. These changes, or impacts, are expressed in terms of direct and indirect effects. Impacts are interpreted
as the contribution of the enterprise to the total economy. Direct effects represent the initial impact on the
economy of the operations of a specific business enterprise, such as a farming operation. Indirect effects are
changes in other industries caused by the direct effects and include changes in household spending generated by
direct effects. Thus, the total economic impact is the sum of direct and indirect effects. Input-output analysis can
interpret the effects of an enterprise in a number of ways including output (sales), labor income (employee
compensation and proprietary income), employment (jobs), and tax revenue (Olson and Lindall 2004)
IMPLAN models include a regional purchase coefficient (RPC) for each impact variable that represents
percentage of demand that is satisfied by production within an impact area (which we are calling local, in this
case). Demand for inputs not satisfied within the impact area represent leakages that have no indirect impacts in
the impact area. Enterprises vary in their multiplier effects due to differing expenditure levels, RPC’s, and sectors
in which their expenditures are directed. Impact analysis involves quantification of spending levels and proper
allocation to impacted sectors.
Output impacts are a measure of economic activity that results from enterprise expenditures in a specific
industrial sector. Output is equivalent to sales, and this multiplier indicates how initial economic activity in one
7
sector leads to sales in other sectors. Labor income impacts for employees and proprietors measure purchasing
power that is created due to the output impacts. This impact provides the best measure of how standards of living
might be affected for residents in the impact area.
An enterprise involves a specified number of employees that is determined by the technology of the
enterprise. Employment multipliers indicate the effect on employment resulting from the enterprise initiating
economic activity. IMPLAN indirect employment includes both full-time and part-time jobs without any
distinction. Jobs calculated within an IMPLAN industrial sector are not limited to whole numbers and fractional
amounts represent additional hours worked without an additional employee. With no measure of hours involved
in employment impacts, IMPLAN summations for industrial sectors which include fractional employment
represent both jobs and job equivalents. Since employment may result from some employees working additional
hours in existing jobs, instead of terming indirect employment impacts as “creating” jobs, a more accurate term is
“involving” jobs or job equivalents.
Georgia’s Agricultural Industry by the Numbers
In order to put the study into proper perspective, we will look at how Georgia’s agricultural industry is
described in the Census of Agriculture and CAED publications Farm Gate Value Report and Ag Snapshots.
These resources provide not only descriptive information, but also lay the groundwork for our analysis of locally
grown in Georgia.
2007 Census of Agriculture
The United States Department of Agriculture (USDA), National Agricultural Statistics Service (NASS)
conducts a Census of Agriculture (“Ag Census”) every five years, with the most recent one in 2007. In the
Georgia State Profile (NASS-USDA 2007), the Ag Census found that 47,846 farms were identified, a decrease of
3 percent from the 49,311 identified in 2002. Similarly, the farmland decreased 6 percent from 10.7 million acres
to 10.2 million acres and average size of farm decreased 3 percent from 218 acres to 212 acres. In contrast, the
8
market value of agricultural products sold on those farms increased 45% from $4.9 billion to $7.1 billion, with an
increase of 49% in the average per farm from $99,608 to $148,662 (see Table 1 for summary).3
Table 1. Selected Findings from 2007 Census of Agriculture, Georgia
2007 2002 % Change Number of Farms 47,846 49,311 -3 Land in Farms 10,150,539 acres 10,744,239 acres -6 Average Size of Farm 212 acres 218 acres -3 Market Value of Products Sold $7.112 billion $4.911 billion +45 Avg. Per Farm Market Value Sold $148,662 $99,608 +49 Source: United States Department of Agriculture, National Agricultural Statistics Service, 2007 Census of Agriculture, State Profile, Georgia. Accessed 03/22/10 http://www.agcensus.usda.gov/Publications/2007/Online_Highlights/County_Profiles/Georgia/cp99013.pdf.
Georgia Farm Gate Value Report
Another informative source of Georgia Agricultural data is the Farm Gate Value Report (FGVR), published
annually by the CAED. Figure 1 highlights the total farm gate value summarized by sector for 2007. The chart
shows that the poultry sector comprises nearly half of all the production value, with the remaining sectors
demonstrating the rich diversity of Georgia’s agricultural commodities.
Figure 1. Georgia Farm Gate Value Report, by Sector, 2007
Source: University of Georgia, Center for Agribusiness and Economic Development, 2007 Farm Gate Value Report.
3 These trends are fairly similar throughout the United States for the time period in question. View the Economics Fact Sheet for the U.S. from the 2007 Ag Census at http://www.agcensus.usda.gov/Publications/2007/Online_Highlights/Fact_Sheets/economics.pdf for more details.
9
Ag Snapshots
According to Ag Snapshots (CAED, 2008) for 2007, Georgia’s total farm gate value was $11.6 billion, with
food and fiber production and directly related processing generating a total economic impact of $58.5 billion and
creating more than 389 thousand jobs in 2007. Though the combined categories of vegetables, fruits, and nuts
comprised only about 9% of total farm gate value, it amounted to over $1.1 billion of production, made up $2.85
billion of the total economic impact, and accounted for more than 25 thousand jobs. The diverse and fast
growing sectors in Georgia agriculture include pecans, blueberries, peaches, onions, watermelons, and peppers.
Commodity Analysis
As a starting point for assessing the impact of locally grown produce, we begin with an analysis of specific
Georgia commodities, considering the amount of current annual production (2007) and how that production
compares to consumption.4 From the data, we construct an approximation of what production would be if
Georgians consumed the U.S. per capita average, calculated in both weight and dollar values (see Table 2 for
details), and then a “utilization gap” or estimate of the production if Georgia produced all that it consumed based
on the calculations (in pounds and in dollars). The end result is an approximation of what the potential “state
shortage” (consumption > production) or “state surplus” (production > consumption) could be based on these
consumption and production values. If there is a “state shortage” for a particular commodity, it indicates that
Georgia may not be producing enough of that commodity to meet statewide consumption, as based on national
consumption patterns. Although the figures provide only an approximation or outer bound, it gives an idea of
what commodities are produced within the state but not at levels high enough to meet the entire annual
consumption of Georgians.
The application of utilization gap calculations enables an exploration of the potential of these particular
commodities as a source for additional direct or local sales and resulting revenue for producers and the overall
economy of Georgia. For example, if all of the lettuce consumed by Georgians were produced and sold in the
4 Estimated consumption was used because no specific figures exist for statewide consumption in Georgia at this level of detail. Because of this data limitation, we use per capita U.S. consumption and Georgia’s population figures instead.
10
state, it could mean an additional $83.6 million of direct revenue or sales to producers in closing this gap5. If all
of the carrots consumed by Georgians were produced and sold within the State, there could be an additional $12.8
million in direct revenue or sales. The net utilization gap (sum of positive and negative) for all of the
commodities considered could add up to over $780 million if Georgia produced all that it consumed.
Table 3 highlights the commodities with shortages as developed in Table 2, the applicable per capita fresh
consumption and total consumption, and the resulting proportion of production consumed as fresh. Only four of
the commodities with shortages show a 100% fresh consumption proportion – lettuce, okra, pumpkins, and sweet
potatoes, while other commodities show fresh proportions ranging from 21.7% (tomatoes) to 78.7%
(strawberries). Analyzing the proportion of fresh consumption gives a further idea of the commodities that might
have potential for more local consumption, since a fresh product might be assumed to be more readily purchased
directly from the producer, and could result in greater direct-to-consumer sales.
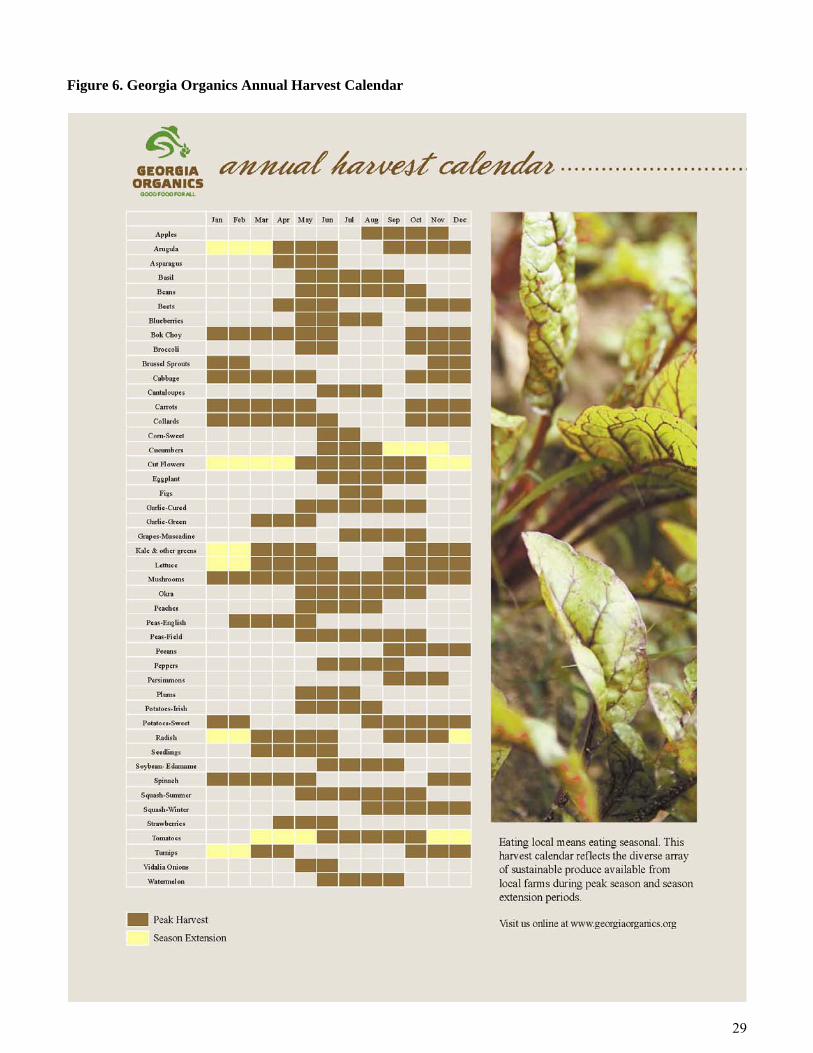
Given the information in Tables 2 and 3, we have included the Georgia Organics Planting and Harvesting
Calendars in the Appendix of this report, demonstrating how various commodities are planted and harvested
throughout the year in Georgia. In addressing increased local direct purchases, the information in these calendars
can prove quite valuable. For example, regarding carrots as mentioned above, the Annual Harvest Calendar
shows that this vegetable is available from local farms in the 8 month peak season. Similarly, lettuce is available
for purchase from local producers for a total of 10 months, including peak and season extension periods.
5 Recall that this analysis assumes that sufficient production capacity exists to meet any suggested increases. The analysis presents a simplified view of production and consumption to highlight possible areas of potential, and does not rule out any particular commodity or commodity group as a local/direct sales opportunity.
1 Source: 2010 Georgia County Guide, Center for Agribusiness and Economic Development, February 2010. 2 Source: 2007 Georgia Farm Gate Value Report, Center for Agribusiness and Economic Development, May 2008. 3 Data for fruit and vegetable consumption taken from USDA ERS Food Availability (Per Capita) Data System. 4 Value = Per capita consumption (Column 3) multiplied by Georgia population (9,523,297). 5
Utilization Gap = Farm Gate Production - Georgia Equivalent Consumption. 6 2007 Georgia Farm Gate Value Report, Center for Agribusiness and Economic Development, May 2008. 7 Dollar Value of Utilization Gap = Utilization Gap multiplied by Average price /lb. 8 All types including muscadines. 9 Head and Romaine. 11
Table 2. Comparison of Georgia and US Per Capita Fruit and Vegetable Consumption, 2007
Estimated 2007 Georgia Population (9,523,297) 1
2007 Farm Gate Production (lbs) 2
2007 Per Capita US Consumption
(lbs) 3
GA Equivalent Consumption
(lbs) 4Utilization Gap (lbs) 5
Average Price/lb 6
Dollar Value of Utilization Gap 7
State Shortage (Consumption > Production) or State Surplus (Production >
Consumption)Apples 1,561,707 49.85 474,781,558 (473,219,851.2) $0.48 -$228,021,292 State ShortageBroccoli 6,333,136 8.44 80,420,366 (74,087,229.5) $0.63 -$46,921,542 State ShortageCarrots 39,563,050 10.54 100,421,568 (60,858,518.9) $0.21 -$12,759,165 State ShortageChile Peppers 9,187,181 6.09 58,005,140 (48,817,959.0) $0.61 -$29,584,579 State ShortageGrapes 8 9,996,408 21.27 202,536,412 (192,540,004.6) $0.98 -$189,183,300 State ShortageGreen/English Peas 526,450 2.97 28,312,897 (27,786,447.0) $0.40 -$11,208,793 State ShortageLettuce 9 244,950 29.95 285,192,674 (284,947,724.1) $0.29 -$83,557,875 State ShortageOkra 1,045,802 0.46 4,374,100 (3,328,298.7) $0.71 -$2,360,743 State ShortagePeaches 61,904,576 9.17 87,368,825 (25,464,249.8) $0.73 -$18,580,462 State ShortagePotatoes 12,905,750 124.71 1,187,662,840 (1,174,757,090.2) $0.33 -$387,669,840 State ShortagePumpkin 14,244,500 5.28 50,306,833 (36,062,333.5) $0.25 -$9,026,976 State ShortageSpinach 9,979,750 2.77 26,415,575 (16,435,824.8) $0.16 -$2,607,290 State ShortageStrawberries 3,812,038 7.96 75,819,622 (72,007,584.9) $1.34 -$96,684,715 State ShortageSweet potatoes 8,220,800 5.07 48,248,712 (40,027,911.7) $0.50 -$20,021,497 State ShortageTomatoes 145,966,145 88.54 843,239,014 (697,272,869.2) $0.34 -$237,215,022 State ShortageBell Peppers 237,426,082 9.37 89,264,946 148,161,135.7 $0.42 $62,485,335 State SurplusBlackberries 2,256,375 0.10 906,321 1,350,053.6 $2.93 $3,949,485 State SurplusBlueberries 18,328,983 0.97 9,255,944 9,073,038.7 $2.45 $22,187,672 State SurplusCabbage 300,805,125 8.93 85,067,391 215,737,733.8 $0.13 $28,771,813 State SurplusCantaloupe 129,944,455 9.59 91,313,196 38,631,258.8 $0.18 $7,077,499 State SurplusCollard Greens 66,374,450 0.49 4,631,247 61,743,202.9 $0.31 $19,252,443 State SurplusCucumbers 266,872,426 9.88 94,107,268 172,765,158.0 $0.32 $55,897,408 State SurplusEggplant 46,996,818 0.84 8,017,190 38,979,628.2 $0.25 $9,832,591 State SurplusKale 10,214,750 0.34 3,210,887 7,003,863.4 $0.29 $2,049,002 State SurplusLima Beans 6,562,800 0.41 3,879,182 2,683,618.5 $0.54 $1,445,322 State SurplusMustard Greens 35,082,750 0.40 3,809,075 31,273,675.3 $0.31 $9,642,761 State SurplusOnions 348,286,860 20.96 199,566,723 148,720,137.3 $0.47 $70,196,152 State SurplusPecans 128,007,137 0.44 4,222,370 123,784,767.1 $1.00 $124,260,732 State SurplusSnap beans 93,923,008 7.68 73,164,375 20,758,632.8 $0.31 $6,503,423 State SurplusSquash 76,614,325 4.15 39,527,582 37,086,743.1 $0.34 $12,777,330 State SurplusSweet corn 449,334,153 25.18 239,772,696 209,561,456.8 $0.21 $43,739,717 State SurplusTurnip greens 74,386,500 0.39 3,703,718 70,682,781.7 $0.31 $21,918,599 State SurplusWatermelon 1,245,225,500 14.42 137,353,533 1,107,871,966.5 $0.08 $93,065,966 State Surplus
-$780,349,838Net Value of Utilization Gap
12
Table 3. Fresh Consumption as Share of Total Consumption for Commodities with State Shortages, 2007
Source: USDA ERS Food Availability (Per Capita) Data System for 2007. *Data on fresh consumption were not available for Chile Peppers and English Peas.
Developing Scenarios to Examine Impact
In addressing the question of the impact of locally grown produce in Georgia, it is important to note that the
emphasis of this portion of the analysis is on examining impacts that take place utilizing the local distribution and
marketing system, not a typical retail food chain which may or may not include truly local fruit and vegetable
purchases. The examination is not to minimize the importance of the retail food chain and its distributional
efficiencies and impact, but to point out that local sales present opportunities for economic impact and to begin to
measure those impacts.
We will use information from the 2007 Ag Census as the starting point for quantifying the local food economic
impact by analyzing direct-to-consumer sales, which constitutes a measurable portion of local sales. In the survey
questionnaire to producers, producers are asked about the market value of agricultural products that are sold
“directly to individuals for human consumption”.6 Figure 2 demonstrates the trends in these direct-to-consumer
sales in Georgia between 1997 and 2002, showing the magnitude of direct sales in comparison to total farm sales.
6 This is defined by the National Agricultural Statistics Service (NASS) as representing agricultural products produced and sold directly to individuals for human consumption from roadside stands, farmer’s markets, pick-your-own sites, etc. This figure excludes the non-edible products but includes livestock sales. It also excludes sales of agricultural products by vertically integrated operations through their own processing and marketing operations. See Appendix B of Ag Census Report Form.
13
Between 1997 and 2002, total farm sales declined but direct sales showed an increase. Direct sales to consumers
have increased faster than total agricultural sales, increasing by 64% and 37% respectively from 1997 to 2007
based on agricultural census data. That trend is consistent with the national picture where the corresponding
numbers are 105% and 48% due mainly to large increases in direct sales in the Far West and Rocky Mountain
states as reported in a recent USDA study (Diamond and Soto 2009). The authors suggested that the trend is
attributable to the fact that an increasing number of farmers are using direct-to-consumer sales as a means to
increase their share of consumer food expenditures. Other researchers have identified additional factors
contributing to the trend, including the rise in consumer concerns about food safety and the source and freshness of
food, the growth in farmers’ markets (where producers can command higher prices as compared to sales to
supermarkets or brokers), and the increasing popularity of pick-your-own operations. Other findings at the national
level based on 2007 Ag Census data (Timmons and Wang 2010) show that direct sales to consumers in the U.S.
increased 59% between 1997 and 2007 (in constant 2007 dollars).
Since the agricultural products referenced in the Ag Census are being sold directly to individuals for
consumption and the data is readily available in summary form, we will use these figures as a beginning
approximation of local direct sales as defined in this study. Other researchers have suggested that the data from the
Ag Census represents the best available in measuring consumption of local food, one stating that “No other data
source provides greater accuracy or insight about consumption of local food.” (Timmons and Wang 2010)7. In
addition, the Ag Census provides delineation of these sales by different types of farms, which enables us to separate
the direct sales figures by those classified as “vegetable and melon farms” and “fruit and nut farms,” also consistent
with the goals of the study8.
7 See the appendices of this report for tables featuring data on direct sales from all U.S. states and comparison of Georgia to other southern states. 8 The classification scheme is by North American Industry Classification System (NAICS). Details about this classification scheme may be found online at http://www.census.gov/eos/www/naics/.
nu
th
fi
a
am
th
The data fr
umber of farm
he average dir
gures, the fol
• Scenar
million
• Scenar
Georg
per far
• Scenar
Georg
of tota
Findings re
total of $7.9
mounts to an
he U.S. averag
Figure 2
rom the Ag C
ms with any s
rect sales per
llowing scena
rio One: Econ
n) farm sales
rio Two: Pote
gia in 2007 if
rm as reporte
rio Three: Pot
gia in 2007 if
al sales as rep
eveal that the
million in pro
average of $1
ge $18,669 an
2. Trends in
Census used fo
ales, and the
farm and the
arios are deve
nomic impact
in Georgia as
ential econom
the existing f
d in the 2007
tential econom
the existing f
ported in the 2
ere were 670 G
oducts directl
15,426 for veg
nd $20,038, re
Direct Sales
or these scena
total dollar va
portion of tot
loped:
t of the direct
s reported in
mic impact of t
farms raised th
Ag Census.
mic impact of
farms raised th
2007Ag Censu
Georgia farm
y to individua
getable/melon
espectively.
As Compare
arios include
alue of each t
tal sales for b
sales from ve
2007 Ag Cen
the direct sale
he amount of
f the direct sa
he amount of
us.
s classified as
als for human
n farms and $
The market v
ed to Total F
the total num
type of sales.
both the U.S. a
egetable/melo
nsus.
es from veget
f direct sales p
ales from vege
f direct sales p
s vegetable/m
n consumption
$7.910 for fru
value of agricu
Farm Sales: G
mber of farms
From this in
and Georgia.
on ($5.2 milli
table/melon a
per year to the
etable/melon
per year to the
melon and frui
n in 2007 (see
uit/nut farms.
ultural produc
Georgia, Val
with direct sa
nformation is
Based on the
ion) and fruit/
and fruit/nut f
e U.S average
and fruit/nut
e U.S average
it/nut farms w
e Table 4). T
Similar num
cts sold was $
lue of Sales
14
ales, total
calculated
ese
/nut ($2.7
farms in
e amount
farms in
e percent
which sold
This
mbers for
$467.6
15
million for vegetable/melon farms and $191.4 million for fruit/nut farms. The direct sales portion of agricultural
sales at these farms represented 1.11% for the vegetable/melon farms, compared to the U.S. average of 2.24%.
With respect to fruit/nut farms, the Georgia direct sales portion represented 1.38% of all agricultural products sold
in comparison to 1.87% at the national level.
Table 4. Profile of Direct Sales in Comparison with Total Ag Products Sold, Georgia and U.S., 2007
Georgia Farms United States Farms Vegetable and
Melon Fruit and Nuts Vegetable and Melon Fruit and Nuts
Number of Farms with Direct Sales 337 335 17,961 17,161Market Value of Direct Sales $5,198,532 $2,649,714 $335,311,000 $343,878,000Average Per Farm $15,426 $7,910 $18,669 $20,038Market Value of Ag. Products Sold $467,641,379 $191,421,337 $14,975,322,000 $18,351,629,000Direct % of Total 1.11% 1.38% 2.24% 1.87%Source: 2007 U.S. Census of Agriculture, National Agricultural Statistics Services, U.S. Department of Agriculture. Calculations by authors.
Scenario One
In scenario one, we examine the direct sales figures exactly as reported9 by analyzing the economic impact
resulting in employment, labor income, value added, and output. Tables 5 and 6 present highlights from the
analysis for the two separate farm classification groups. The $5.2 million in sales from the vegetable and melon
farms directly results in 37 jobs with $1.6 million in income and $1.7 million in value added to the Georgia
economy. Considering multiplier effects, which includes both indirect and induced effects, the overall value in the
economy is 76 jobs, $3.0 million in income, $4.2 million in value added, and $9.7 million in output. The $2.7
million in sales from the fruit and nut farms directly contributes 36 jobs with $764,867 in income and $1.0 million
in value added to the Georgia economy. Considering complete multiplier effects, the overall economic importance
of direct sales amounts to 56 jobs, $1.5 million in income, $2.2 million in value added, and $4.7 million in
output/sales.
9 Though this is presented as a “scenario,” it is simply an analysis of the direct sales as reported in the Ag Census to assist in putting the following numbers into perspective.
16
Table 5. Economic Impact of Direct Sales from Vegetable and Melon Farms, Georgia 2007
Impact Type Employment Labor Income Value Added Output Direct Effect 37.0 $1,565,513 $1,678,329 $5,198,532Indirect Effect 21.0 $762,792 $1,295,867 $2,314,282Induced Effect 17.7 $680,807 $1,266,706 $2,150,450Total Effect 75.7 $3,009,111 $4,240,902 $9,663,264Source: Based on data from 2007 U.S. Census of Agriculture, National Agricultural Statistics Services, U.S. Department of Agriculture. Calculations by authors using Minnesota IMPLAN Group, Inc., IMPLAN System ( data and software), 1725 Tower Drive west, Suite 140, Stillwater, MN 55082, www.implan.com, 1997.
Table 6. Economic Impact of Direct Sales from Fruit and Nut Farms, Georgia 2007
Impact Type Employment Labor Income Value Added Output Direct Effect 36.0 $764,867 $1,020,845 $2,649,714Indirect Effect 10.9 $379,882 $562,172 $1,006,359Induced Effect 8.7 $334,413 $622,032 $1,055,898Total Effect 55.5 $1,479,162 $2,205,049 $4,711,972Source: Based on data from 2007 U.S. Census of Agriculture, National Agricultural Statistics Services, U.S. Department of Agriculture. Calculations by authors using Minnesota IMPLAN Group, Inc., IMPLAN System ( data and software), 1725 Tower Drive west, Suite 140, Stillwater, MN 55082, www.implan.com, 1997.
Scenario Two
In this scenario, we estimate the economic impact if Georgia farms with direct sales increased the level to the
U.S. national average10. In this case, it would be a change from $15,426 per farm to $18,669 (+$3,243) for
vegetable/melon farms and from $7,910 to $20,038 (+ 12,128) for fruit/nut farms, an increase of 21% and 153%
respectively. Tables 7 and 8 show the resulting impact from this change for each classification group. This would
result in direct sales in vegetable/melon farms increasing to a total of $6.3 million in output/sales and a total effect
(including multiplier effects) of $11.7 million and fruit/nut farms increasing to a total of $6.7 million in output/sales
and a total effect (including multiplier effects) of $11.9 million.11
Table 7. Potential Economic Impact of Direct Sales from Vegetable and Melon Farms at U.S. Average per Farm, Georgia 2007
Impact Type Employment Labor Income Value Added Output Direct Effect 44.8 $1,894,624 $2,031,157 $6,291,398Indirect Effect 25.4 $923,150 $1,568,292 $2,800,802Induced Effect 21.5 $823,930 $1,533,000 $2,602,531Total Effect 91.6 $3,641,704 $5,132,450 $11,694,732Source: Based on data from 2007 U.S. Census of Agriculture, National Agricultural Statistics Services, U.S. Department of Agriculture. Calculations by authors using Minnesota IMPLAN Group, Inc., IMPLAN System ( data and software), 1725 Tower Drive west, Suite 140, Stillwater, MN 55082, www.implan.com, 1997. 10 A similar change in overall impact could occur with other types of changes. For example, if a greater number of farms sold the same average amount, there would still be an increase in the economic impact. 11 This analysis does not estimate the potential loss of impact to other industries, such as retail food sales, because a consumer might substitute a directly sold product for one sold at retail.
17
Table 8. Potential Economic Impact of Direct Sales from Fruit and Nut Farms at U.S. Average per Farm, Georgia 2007
Impact Type Employment Labor Income Value Added Output Direct Effect 91.1 $1,937,732 $2,586,231 $6,712,845Indirect Effect 27.6 $962,401 $1,424,220 $2,549,533Induced Effect 22.0 $847,209 $1,575,869 $2,675,036Total Effect 140.7 $3,747,342 $5,586,320 $11,937,413Source: Based on data from 2007 U.S. Census of Agriculture, National Agricultural Statistics Services, U.S. Department of Agriculture. Calculations by authors using Minnesota IMPLAN Group, Inc., IMPLAN System ( data and software), 1725 Tower Drive west, Suite 140, Stillwater, MN 55082, www.implan.com, 1997.
Scenario Three
In the third scenario proposed, we estimate the impact if Georgia farms with direct sales increased to the same
proportion of agricultural products sold as the U.S. average. In this case, it would be a change from 1.1% of all
sales to 2.24% for vegetable/melon farms and from 1.38% to 1.87% for fruit/nut farms. In order to estimate this
scenario, we apply the U.S. percentages to the respective Georgia sales figure. Tables 9 and 10 show the effects of
these changes for each classification group. This would result in direct sales in vegetable/melon farms increasing to
a total of $10.5 million in output/sales and a total effect (including multiplier effects) of $19.5 million and fruit/nut
farms increasing to a total of $3.6 million in output/sales and a total effect (including multiplier effects) of $6.4
million.
Table 9. Potential Economic Impact of Direct Sales from Vegetable and Melon Farms at U.S. Direct Sales Rate, Georgia 2007
Impact Type Employment Labor Income Value Added Output Direct Effect 74.6 $3,153,264 $3,380,500 $10,470,913Indirect Effect 42.2 $1,536,418 $2,610,143 $4,661,439Induced Effect 35.7 $1,371,285 $2,551,408 $4,331,449Total Effect 152.5 $6,060,967 $8,542,050 $19,463,800Source: Based on data from 2007 U.S. Census of Agriculture, National Agricultural Statistics Services, U.S. Department of Agriculture. Calculations by authors using Minnesota IMPLAN Group, Inc., IMPLAN System ( data and software), 1725 Tower Drive west, Suite 140, Stillwater, MN 55082, www.implan.com, 1997.
Table 10. Potential Economic Impact of Direct Sales from Fruit and Nut Farms at U.S. Direct Sales Rate, Georgia 2007
Impact Type Employment Labor Income Value Added Output Direct Effect 48.7 $1,035,398 $1,381,914 $3,586,907Indirect Effect 14.7 $514,245 $761,010 $1,362,304Induced Effect 11.8 $452,693 $842,042 $1,429,365Total Effect 75.2 $2,002,336 $2,984,966 $6,378,576Source: Based on data from 2007 U.S. Census of Agriculture, National Agricultural Statistics Services, U.S. Department of Agriculture. Calculations by authors using Minnesota IMPLAN Group, Inc., IMPLAN System ( data and software), 1725 Tower Drive west, Suite 140, Stillwater, MN 55082, www.implan.com, 1997.
18
Using the Georgia Farm Gate Value Report for Assessing the Impact of Locally Grown
Each year, the University of Georgia’s Center for Agribusiness and Economic Development publishes the
Georgia Farm Gate Value Report (FGVR), a compilation of survey results from Georgia Cooperative Extension
county agents and commodity specialists. The purpose of the publication is to provide annual county-level
information for the value of all food and fiber commodities grown in the state of Georgia (Boatright and McKissick
2008). This unique source of agricultural data provides estimates different from other available resources, so it is
likely that the Farm Gate Value report numbers will not match those from other sources.12
Given that there are the expected differences in the Ag Census and FGVR for 2007, we utilize the FGVR
numbers as the starting point in additional scenarios to estimate the potential economic impact of local foods. The
data is then analyzed applying proportions from the IMPLAN model to subtract the value of intermediate products
(used as input into another product), which by definition would not represent a final, direct sale to a consumer.13
This calculation represents an estimate of the final demand for the product, or sales for final use by the purchaser.
To further refine the estimate, IMPLAN provides proportions of local (recall that by definition, this means the State
of Georgia) final demand by households, government, inventories, and exports. In the case of fruit, melons,
vegetables, and nuts, final demand is primarily split (on average) between households (73%) and exports (25%),
with the small fraction left going to state and local governments (1%) and for inventories (1%). Since neither
exports nor inventories represent a local purchase, we will examine only the fraction of the value that represents
final demand by households and state government.
The resulting estimate of final demand for vegetables, melons, fruit, and nuts includes all methods of sales –
from direct to consumer to wholesale to retail – therefore a scenario is developed to estimate the potential of
capturing a particular portion of these sales as direct to consumers. For purposes of this analysis, we will estimate
what capturing 5% of this total final demand as directly sold means to the Georgia economy. Because of the linear
nature of the IMPLAN model, this may be further generalized as an interpretation of what each 5% increment of
increased direct sales might mean to the economy and the potential retail value of these figures. See Table 11 for 12 See “A Comparison of Agricultural Data Sources,” page ii of the Georgia Farm Gate Value Report for more details on these comparisons. Each year’s report is available online at http://www.caed.uga.edu/publications/annual.html. 13 The proportion of production value used for intermediate demand is derived from the IMPLAN database in order to obtain an estimate of final demand as follows. Total Production Value minus Intermediate Demand Value = Final Demand Value. Further calculations are made to determine what portion of that is sold to meet household and other final demand. Exports are excluded from this estimate because an export would not constitute a local sale.
th
an
T
GTCR*TIMpoprmsoRe
F
*Fpr
F
T
A
in
hese calculatio
nd retail value
Table 11. Esti
Georgia Farm otal Estimate
Capture 5% FoRetail Value o
This figure also iMPLAN model uolice protection, roducers for dire
margin provided boftware), 1725 Teport 2007.
igure 3. Prod
Full retail value wroducers for dire
Farm Gate Va
he scenario is
• The po
2007 f
includ
sales.
As mentioned
nterpretation o
ons using 200
es.
imates of Fin
Gate Value ed Sales to Hoor Local Salesf 5%** includes a smalluser manual, theand sanitation.
ect sales might faby the IMPLAN
Tower Drive wes
ducer and Fu
would include cect sales might fa
lue Scenario
s best describ
otential econo
for every 5%
es the corresp
above, becau
of what each
07 figures for
nal Demand f
ouseholds* s - Producer V
proportion (~1%se purchases can**Full retail val
all somewhere bmodel. Calculatt, Suite 140, Stil
ull Retail Va
osts for wholesaall somewhere b
ed as follows
omic impact o
increase in co
ponding empl
use of the line
5% incremen
P
Georgia and
for Local Pur
V
Value
%) shown in the n be both educatlue would includetween “producetions by authors llwater, MN 550
lue* of Poten
ale, transportatioetween “produce
s:
of the direct s
onsumer local
loyment, inco
ar nature of th
nt of consume
$23,542,898
Producer Value
Figure 3 for
rchases, Geo
Vegetable and $894$463
2333
model to be soldion and non-edude costs for whoer prices” and fuusing Minnesot
082, www.implan
ntial Local S
on, and other coser value” and fu
sales from veg
l purchases as
ome, value ad
he IMPLAN
er local direct
$
Full
a representati
orgia 2007
Melon F4,853,190,673,489,183,674,862,074d to State and Lo
ucation related, inlesale, transportaull retail. The esta IMPLAN Gron.com, 1997 and
ales of Veget
sts to bring produll retail.
getable/melon
s a direct sale
ded, and outp
model, this m
t sales might m
34,400,903
Retail Value
ion of the ran
2007 Fruit and Nut
$241,603,6$7,184,4
359,2538,8
ocal Governmenncluding K-12 aation, etc. Actuastimate of full reoup, Inc., IMPLAd UGA/CAED G
tables, Melon
uct to market. A
n and fruit/nu
e from the pro
put potential r
may be further
mean to the e
nge between p
ts T601 $1,13472 $4724 $229 $3
nts. According toand public univeral prices receivetail value is base
AN System ( dataGeorgia Farm Ga
ns, Fruit, and
Actual prices rece
ut farms in Ge
oducer. This a
resulting from
r generalized
conomy. Tab
19
producer
Total 36,456,79170,857,96123,542,89834,400,903o the rsities,
ed by ed on the a and ate Value
d Nuts
eived by
eorgia in
analysis
m those
as an
ble 12
20
outlines the potential economic impact from each 5% of consumer local direct sales resulting from this scenario.
The $23.5 million in sales from the farms directly results in 169.6 jobs with $7.1 million in income and $7.7 million
in value added to the Georgia economy. Considering multiplier effects, which includes both indirect and induced
effects, the overall value in the economy is 344.6 jobs, $13.6 million in income, $19.2 million in value added, and
$43.7 million in output.
Table 12. Potential Economic Impact of 5% Increase in Local Direct Sales from Vegetable, Melons, Fruit and Nuts, Georgia 2007
Impact Type Employment Labor Income Value Added Output Direct Effect 169.6 $7,087,268 $7,652,913 $23,542,898Indirect Effect 94.8 $3,446,306 $5,845,239 $10,438,985Induced Effect 80.2 $3,080,045 $5,730,705 $9,728,842Total Effect 344.6 $13,613,619 $19,228,860 $43,710,724Source: Based on data from 2007 U.S. Census of Agriculture, National Agricultural Statistics Services, U.S. Department of Agriculture and Farm Gate Value Report, Center for Agribusiness and Economic Development, University of Georgia. Calculations by authors using Minnesota IMPLAN Group, Inc., IMPLAN System ( data and software), 1725 Tower Drive west, Suite 140, Stillwater, MN 55082, www.implan.com, 1997.
Additional $10 Per Week Scenario
As you may recall, we referred to a study conducted in Virginia (Benson and Bendfelt 2007) that quantified the
impact of each household in the state spending an additional $10 per week of their total food dollars on fresh local
produce and farm-based Virginia products, regardless of where the sale takes place (i.e. not just those that are
direct-to-consumer, but also at other venues like grocery stores that may sell local products). This simulation
allows an exploration of what a relatively small change in consumer behavior and budget can mean to the
community. A similar analysis for the State of Georgia shows that if each of over 3.7 million households in
Georgia (2007 IMPLAN data) devoted $10 per week of their total food dollars–purchased from any source–to
locally grown products, it could mean over $1.94 billion food dollars reinvested back into the State.
Summary of Findings
This study has provided an analysis of the potential economic impact of various scenarios describing how a
change in local produce sales in Georgia might affect output, labor income, and value added. These views provide
a framework for considering the direct impact of additional local produce purchases within the State and a
benchmark for measuring how incremental changes might increase the economic importance of these sales. The
2007 Ag Census reported over $7 million in direct sales from vegetable/melon and fruit/nut farms. The first
21
scenario looked at these direct sales, which made an overall contribution to the economy of 132 jobs, $4.5 million
in labor income, $6.4 million in value added, and $14.4 million in output.
In the next scenario, researchers analyzed the impact if Georgia farmers increased their average direct sales of
fresh produce to the level found nationally. This scenario could result in an overall contribution of 232 jobs, $7.4
million in labor income, $10.7 million in value added, and $23.6 million in output. A similar scenario in which
Georgia vegetable, melon, fruit, and nut farms increased the proportion of their direct fresh produce sales to the
national average level could result in an overall contribution of 228 jobs, $8.1 million in labor income, $11.5
million in value added, and $25.8 million in output.
Using the Center for Agribusiness and Economic Development’s Farm Gate Value Report as the basis, an
additional scenario estimated the economic changes that would occur with every 5% of consumer local purchases
as a direct sale from the farmer/producer. Considering multiplier effects, the overall contribution for each 5% of
local sales captured is approximately 345 jobs, $13.6 million in income, $19.2 million in value added, and $43.7
million in output. Recall that the methodology makes this result applicable for every 5% increment of consumer
local purchases that might occur. Lastly, similar to a Virginia study, researchers found that if each of the
approximately 3.7 million households in the State devoted $10 per week of their total food dollars to locally grown
food products – from any source, not just direct from producers – there could be over $1.9 billion food dollars
reinvested back into the state. The following table summarizes the total impacts for each scenario14:
Table 13. Summary of Total Economic Impact from Each Scenario
TOTAL ECONOMIC IMPACT (Number) (Million)
Description Employment Labor Income
Value Added Output
Scenario 1: 2007 Ag Census Report 132 $4.5 $6.4 $14.4 Scenario 2: Increase to U.S. Avg. Sales per Farm 232 $7.4 $10.7 $23.6 Scenario 3: Increase to U.S. Proportion of Direct Sales 228 $8.1 $11.5 $25.8 Scenario 4: Capture 5% of Purchases as Direct Sales* 345 $13.6 $19.2 $43.7 *Because of the linear nature of the IMPLAN model, this would essentially translate to a figure for each 5% of consumer local purchases as direct sales as calculated under scenario four. Source: Based on data from 2007 U.S. Census of Agriculture, National Agricultural Statistics Services, U.S. Department of Agriculture and Farm Gate Value Report, Center for Agribusiness and Economic Development, University of Georgia. Calculations by authors using Minnesota IMPLAN Group, Inc., IMPLAN System ( data and software), 1725 Tower Drive west, Suite 140, Stillwater, MN 55082, www.implan.com, 1997.
14 No calculation was made for the total economic impact of households increasing local purchases by $10 per week because there is not enough information about those simulated purchases beyond the direct potential. Therefore, this category is not included in the table, which is a summary of total economic impacts of the other scenarios.
22
Considerations and Future Research
In light of the findings from this investigation, there are multiple aspects to consider in the pursuit of selling
more local produce in Georgia. One consideration is to explore what motivates a consumer to buy directly from a
producer or farmer. Some researchers have suggested that different customer groups value the attributes of local
produce in diverse manners (Bond, Thilmany et al. 2008; Thilmany, Bond et al. 2008). In an earlier study, the
same authors (Bond, Thilmany et al. 2006) developed some useful generalizations for direct purchasers of local
produce, finding that they have similar preferences to other consumers in terms of quality, but value convenience,
presentation and competitive prices somewhat differently. They suggest consideration of these differences in
marketing depending on whether the goal is to increase patronage by existing customers or to gain new customers.
In increasing patronage of current customers, they respond to differentiation of local produce – emphasizing
production practice (i.e. organic) or other quality attributes – meeting the needs of these customers for “superior,
nutritionally enhanced produce that is pest free and locally grown.” Gaining new customers, those who might not
typically purchase through direct channels, might require promotion that emphasizes safety attributes, attractive
packaging and displays, and even semi-processed produce products to capitalize on the convenience needs of this
group.
A USDA study found some of the reasons “Why Consumers Love to Buy Directly from Farmers” (Tropp,
Ragland et al. 2008) as summarized in the following table:
Figure 4. Why Consumers Love to Buy Directly from Farmers, USDA
23
Some have examined the characteristics of those who purchase their produce direct through farmers markets
(Zepeda 2009), again making the delineation between those who already shop there and those who might represent
a new customer. Zepeda found that those who already shop farmers markets do so because of greater concerns
about freshness, nutrition, the environment, farmers, and personal health. Factors such as the enjoyment and
frequency of cooking, more than one adult in the household, and being religious increased the likelihood of that
person becoming a farmer’s market customer.
(Sharma and Strohbehn 2006) looked at another method of direct sales that may not be as frequently considered
– restaurants or other foodservice outlets. Their analysis considered not only the costs to restaurants of buying
local, but whether patrons would be willing to purchase local menu items at a slight price premium. Their findings
suggest that they would be willing, and that producers can help foodservice operations promote the use of local
food ingredients. Chefs of small gourmet, independently-owned restaurants are more likely to purchase local foods,
with the largest obstacle to these purchases being a lack of information (Curtis and Cowee 2009).
Knowing that information is critical in marketing to consumers or to foodservice outlets, the CAED interactive
website known as MarketMaker (www.marketmaker.uga.edu) and the Georgia Organics Directory
(www.georgiaorganics.org) are two resources that can help to overcome informational hurdles in selling or
purchasing local food products. In addition to these existing resources, there needs to be more research regarding
purchases of local food in Georgia, including direct-to-consumer and through other methods. Future research
efforts might include conducting an analysis similar to this study on other types of farm products, such as meat
products or other likely direct-to-consumer products. In addition, because this methodology required the use of
secondary data collected for other purposes, it would be meaningful to gather primary information about Georgia
local or direct food sales. These primary research efforts might include surveys of farmers markets or other
foodservice outlets, such as restaurants or institutions such as schools and colleges. A literature-review-based study
of local food systems (Martinez, Hand et al. 2010) found several obstacles for market entry or expanding local food
sales, including: constraints on capacity for small farmers and lack of distribution systems to move local products
into mainstream sales outlets; inadequate research, education, and training in local food marketing; and limited
knowledge of important regulations, such as food safety requirements. Future research efforts should be designed
to tackle these barriers and/or promote awareness of existing resources to help alleviate them.
24
References
Benson, M. and E. Bendfelt (2007). Annual Community Food Dollars Generated if Each Household in Virginia Spent $10/Week of Their Total Food Dollars on Fresh Local Produce and Farm-based Virginia Products. Virginia Cooperative Extension Bulletin, Virginia Cooperative Extension, Virginia Tech, and Virginia State University.
Boatright, S. R. and J. C. McKissick (2008). 2007 Georgia Farm Gate Value Report, The University of Georgia, Center for Agribusiness and Economic Development. AR-08-01.
Bond, C. A., D. Thilmany, et al. (2008). "Understanding Consumer Interest in Product and Process-Based Attributes for Fresh Produce." Agribusiness 24(2): 231-252.
Bond, J. K., D. Thilmany, et al. (2006). Direct Marketing of Fresh Produce: Understanding Consumer Purchasing Decisions. Choices: The Magazine of Food, Farm, and Resource Issues, American Agricultural Economics Association. 21: 229-235.
Cantrell, P., D. Conner, et al. (2006). Eat Fresh and Grow Jobs, Michigan, Michigan Land Use Institute, Michigan State University.
Curtis, K. R. and M. W. Cowee (2009). "Direct Marketing Local Food to Chefs: Chef Preferences and Perceived Obstacles." Journal of Food Distribution Research 40(Number 2).
Diamond, A. and R. Soto (2009). Facts on Direct-to-Consumer Food Marketing: Incorporating Data from the 2007 Census of Agriculture, AMS-USDA, Marketing Services Division.
Giovannucci, D., E. Barham, et al. (2010). "Defining and Marketing "Local" Foods: Geographical Indications for US Products." Journal of World Intellectual Property 13(2): 94-120.
Hand, M. (2009). "Describing Local Food Systems and Evaluating Market Performance." Economic Research Service, Farm Foundation, Local Food Systems: Emerging Research and Policy Issues Retrieved April 7, 2010, from http://live.blueskybroadcast.com/bsb/client/CL_DEFAULT.asp?Client=300868&PCAT=1433&CAT=1433
Leung, P. and M. Loke (2008). Economic Impacts of Increasing Hawai'i's Food Self-Sufficiency. Economic Issues, Cooperative Extension Service, College of Tropical Agriculture and Human Resources, University of Hawai'i at Manoa.
Martinez, S., M. Hand, et al. (2010). Local Food Systems: Concepts, Impacts, and Issues, United States Department of Agriculture, Economic Research Service.
Matthew, M. (2008). "The local industrial complex? Questioning the link between local foods and energy use." Agriculture and Human Values 25(2): 193-196.
Meter, K. (2008). Atlanta Metro Region & The State of Georgia Farm & Food Economies: Highlights of a data compilation. Crossroads Resource Center, Tools for Community Self-determination. Minneapolis, MN.
NASS-USDA (2007). 2007 Census of Agriculture, Georgia State Profile. N. A. S. Service. Washington, D.C., United States Department of Agriculture.
Olson, D. and S. Lindall (2004). IMPLAN Professional Software, Analysis, and Data Guide. 1725 Tower Drive west, Suite 140, Stillwater, MN 55082, www.implan.com, Minnesota IMPLAN Group, Inc.
Sharma, A. and C. Strohbehn (2006). Local Food Connections, Economic Impact of Use in Restaurants. Iowa State University, University Extension, Extension Bulletin. D. Nelson, Leopold Center for Sustainable Agriculture.
Sharp, J. S., M. D. Webb, et al. (2009). Planting the Seeds of Sustainable Economic Development: Knox County's Local Food System, Social Responsibility Initiative Topical Report, Department of Human and Community Resource Development, The Ohio State University. 09-04.
Swenson, D. (2006). The Economic Impacts of Increased Fruit and Vegetable Production and Consumption in Iowa: Phase II. R. Pirog, A. Tagtow and M. Adams, Regional Food Systems Working Group, Leopold Center for Sustainable Agriculture.
Swenson, D. (2010a). The Economic Impact of Fruit and Vegetable Production in Southwest Iowa Considering Local and Nearby Metropolitan Markets. R. Pirog and M. Adams, Leopold Center for Sustainable Agriculture.
Swenson, D. (2010b). Selected Measures of the Economic Values of Increased Fruit and Vegetable Production and Consumption in the Upper Midwest. M. Adams and R. Pirog, Leopold Center for Sustainable Agriculture.
25
Thilmany, D., C. A. Bond, et al. (2008). "Going Local: Exploring Consumer Behavior and Motivations for Direct Food Purchases." American Journal of Agricultural Economics 90(5): 1303-1309.
Timmons, D. and Q. Wang (2010). "Direct Food Sales in the United States: Evidence from State and County-Level Data." Journal of Sustainable Agriculture 34(2): 229-240.
Timmons, D., Q. Wang, et al. (2008). "Local Foods: Estimating Capacity." Journal of Extension [On-line] 46(5), Article 5FEA7, Available at http://www.joe.org/joe/2008october/a7.php).
Tropp, D., E. Ragland, et al. (2008). Supply Chain Basics: The Dynamics of Change in the U.S. Food Marketing Environment. AMS-USDA.
Zepeda, L. (2009). "Which little piggy goes to market? Characteristics of US farmers' market shoppers." International Journal of Consumer Studies 33(3): 250-257.
26
Appendices
Table 14. Agricultural Census Total Farm and Direct Sales, 2002 and 2007, All States and U.S.
Total Farm Sales ($1,000) Direct Sales ($1,000) (All Categories) Direct % of Total
Total for Southern States $132,025 10.9% $89,026 100%
United States $1,211,270 $812,204 National
Average $24,225
Southern State Average $14,669
Southern State Average as % National Average
60.6%
Southern States as % of US total 10.9%
Source: Based on data from 2007 U.S. Census of Agriculture, National Agricultural Statistics Services, U.S. Department of Agriculture; calculations by authors.
The Center for Agribusiness & Economic Development
The Center for Agribusiness and Economic Development is a unit of the College of Agricultural and Environmental Sciences of the University of Georgia, combining the missions of research and extension. The Center has among its objectives:
To provide feasibility and other short term studies for current or potential Georgia agribusiness firms and/or emerging food and fiber industries.
To provide agricultural, natural resource, and demographic data for private and public decision makers.
To find out more, visit our Web site at: http://www.caed.uga.edu
Or contact:
John McKissick, Director Center for Agribusiness and Economic Development
Lumpkin House The University of Georgia
Athens, Georgia 30602-7509 Phone (706)542-1861
The University of Georgia and Fort Valley State University, and the U.S. Department of Agriculture and counties of the state cooperating. The Cooperative Extension Service offers educational programs, assistance and materials to all people without regard to race, color, national origin, age, sex or disability.
An equal opportunity/affirmative action organization committed to a diverse work force. Report Number: CR-10-03 May 2010
Issued in furtherance of Cooperation Extension Acts of May 8 and June 30, 1914, the University of Georgia College of Agricultural and Environmental Sciences, and the U.S. Department of Agriculture cooperating.