Page 1
Int.J.Curr.Microbiol.App.Sci (2019) 8(7): 11-22
11
Original Research Article https://doi.org/10.20546/ijcmas.2019.807.003
The Microbiology Quality Analysis of the Waters of Riuapa River and Its
Impact on the Environment
Soukotta Elna*, Oszaer Robert, Bokiraya Latuamury
Magister Program of Forest Management, Faculty of Agriculture,
Pattimura University, Indonesia
*Corresponding author
A B S T R A C T
Introduction
Water is a basic need that cannot be separated
from human needs. The increasing number of
residents with their various activities also
affects the amount and quality of clean water.
The problem that arises is the process of using
and removing water from the daily activities
of the community, which become waste water
that is, without prior processing, directly
discharged/ disposed off into the river and its
environment.
The WaeRiuapa watershed is one of the
watersheds in the West Seram (SBB) district
and plays an important role in meeting the
needs of the community in various sectors,
from drinking water to irrigation purposes.
But as an open streaming water ecosystem, the
Riuapa River receives external input starting
from upstream to downstream. These are in
the form of domestic waste, industrial residual
waste, and natural disasters such as erosion
and landslides. This can reduce the quality of
International Journal of Current Microbiology and Applied Sciences ISSN: 2319-7706 Volume 8 Number 07 (2019) Journal homepage: http://www.ijcmas.com
The Waeriuapa is the main river in the Wae Riuapa watershed which is widely used for
agricultural irrigation, fishery cultivation ponds and domestic needs such as bathing and
washing. As a flowing open-water ecosystem, the Riuapa river receives external disposals
starting from upstream to downstream in the form of domestic waste, industrial waste,
agricultural waste and from natural disasters such as erosion and landslides. The study
conducted was to identify water quality by measuring the level of water pollution both in
the river stream and on the river banks, specifically its microbiology quality. The results of
the RALF analysis indicates the influence of the station location and season towards the
levels of Total Coliform and E. coli bacteria in the river water and water wells that exceed
the threshold of quality standards affecting the health of the surrounding environment.
Changes in land cover on the WaeRiuapa watershed also influences the debit fluctuations
in rainwater and dilution of pollutants, thereby reducing the river water quality with a total
Coliform level of during wet season an average of 937.6 amount/ 100ml, during the dry
season an average of 2,222.7 amount/ 100ml (BM Total Coliform: 3,000 amount/ 100ml),
and E. coli at an average rainfall of 35.53amount/ 100ml, during dry season an average of
20.67 amount/ 100ml (BM E. coli: <1 amount / 100ml).
K e y w o r d s
Waeriuapa, Water
quality, Pollution,
Environmental
impact
Accepted:
04 June 2019
Available Online:
10 July 2019
Article Info
Page 2
Int.J.Curr.Microbiol.App.Sci (2019) 8(7): 11-22
12
the river water, affect aquatic biota, and bring
widely harm to human life.
The water quality of the river is a qualitative
condition that is measured based on certain
parameters and through certain methods
according to the applicable laws and
regulations. The quality of the river water can
be determined through physical, chemical and
biological parameters that describe the water
quality (Asdak, 2010). The indicator used to
measure the biological / microbiological
quality of the water is in the form of E. coli
bacteria and Total Coliform.
The water quality analysis is done by
measuring the microbiological parameters of
the Riuapa river and its impact to the
environment through looking at changes in
Wae Riuapa watershed's land cover which is
the main objective of this study. It is expected
that the results of this study can be taken into
consideration and as input for the management
of the Wae Riuapa watershed in an
environmentally friendly development effort
and formulating policies towards pollution
control, and efforts to maintain and preserve
the water quality of the Wae Riuapa
watershed.
Materials and Methods
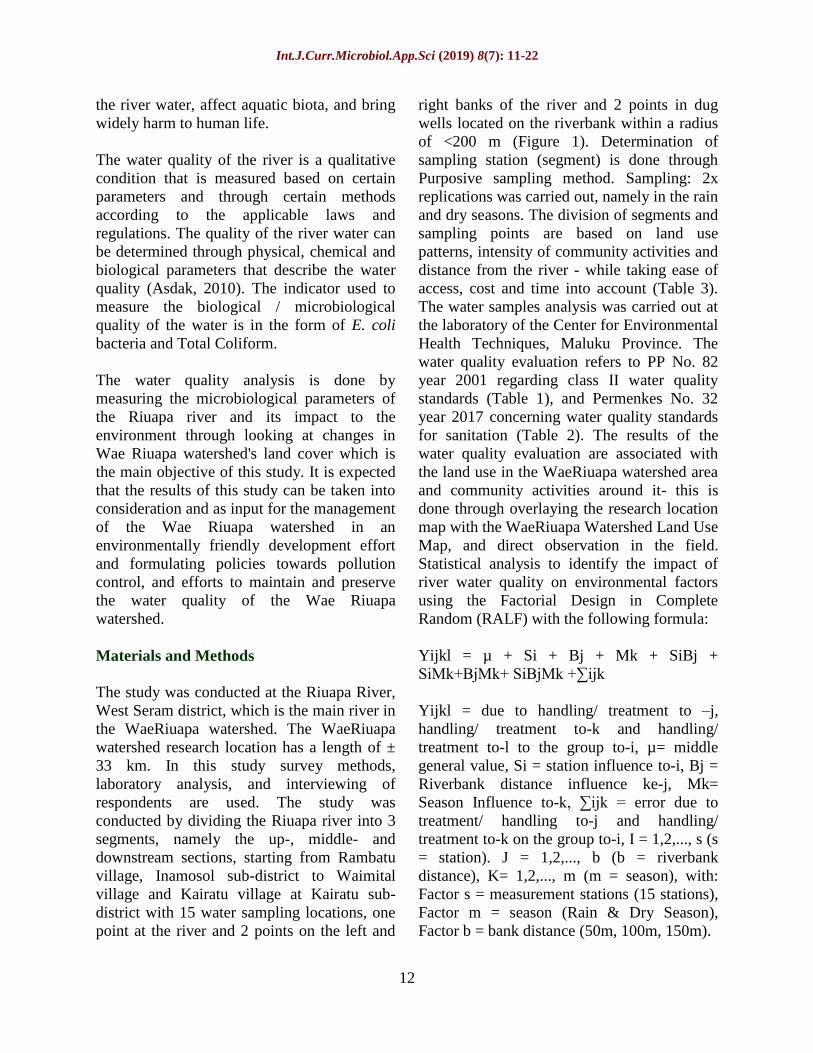
The study was conducted at the Riuapa River,
West Seram district, which is the main river in
the WaeRiuapa watershed. The WaeRiuapa
watershed research location has a length of ±
33 km. In this study survey methods,
laboratory analysis, and interviewing of
respondents are used. The study was
conducted by dividing the Riuapa river into 3
segments, namely the up-, middle- and
downstream sections, starting from Rambatu
village, Inamosol sub-district to Waimital
village and Kairatu village at Kairatu sub-
district with 15 water sampling locations, one
point at the river and 2 points on the left and
right banks of the river and 2 points in dug
wells located on the riverbank within a radius
of <200 m (Figure 1). Determination of
sampling station (segment) is done through
Purposive sampling method. Sampling: 2x
replications was carried out, namely in the rain
and dry seasons. The division of segments and
sampling points are based on land use
patterns, intensity of community activities and
distance from the river - while taking ease of
access, cost and time into account (Table 3).
The water samples analysis was carried out at
the laboratory of the Center for Environmental
Health Techniques, Maluku Province. The
water quality evaluation refers to PP No. 82
year 2001 regarding class II water quality
standards (Table 1), and Permenkes No. 32
year 2017 concerning water quality standards
for sanitation (Table 2). The results of the
water quality evaluation are associated with
the land use in the WaeRiuapa watershed area
and community activities around it- this is
done through overlaying the research location
map with the WaeRiuapa Watershed Land Use
Map, and direct observation in the field.
Statistical analysis to identify the impact of
river water quality on environmental factors
using the Factorial Design in Complete
Random (RALF) with the following formula:
Yijkl = µ + Si + Bj + Mk + SiBj +
SiMk+BjMk+ SiBjMk +∑ijk
Yijkl = due to handling/ treatment to –j,
handling/ treatment to-k and handling/
treatment to-l to the group to-i, µ= middle
general value, Si = station influence to-i, Bj =
Riverbank distance influence ke-j, Mk=
Season Influence to-k, ∑ijk = error due to
treatment/ handling to-j and handling/
treatment to-k on the group to-i, I = 1,2,..., s (s
= station). J = 1,2,..., b (b = riverbank
distance), K= 1,2,..., m (m = season), with:
Factor s = measurement stations (15 stations),
Factor m = season (Rain & Dry Season),
Factor b = bank distance (50m, 100m, 150m).
Page 3
Int.J.Curr.Microbiol.App.Sci (2019) 8(7): 11-22
13
In addition, secondary data in the form of
climate data from the WaeRiuapa watershed
were obtained from the BMKG
StaklimKairatu and the hydrological data of
the DAS WaeRiuapa from the Balai Sungai,
Maluku Province.
Results and Discussion
The results of the microbiological quality
measurements of the Riuapa river water are
presented in Table 4.
Total coliform
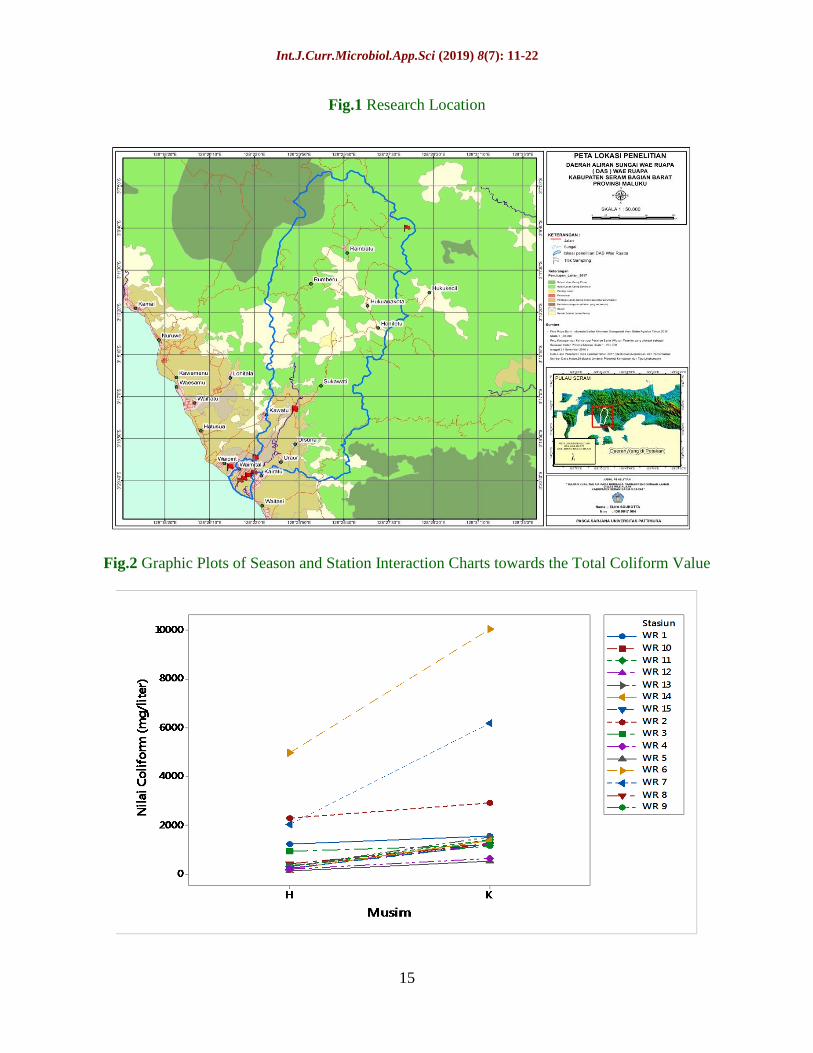
The results of the total coliform analysis
between the wet seasaon and dry season varies
at all sampling points (Figure 2). The analysis
of total coliform in the wet seasaon ranged
from 126 counts/ 100ml - 5000 counts/ 100ml
and the average total coliform during the wet
seasaon was 937.6 counts/ 100ml.The highest
coliform count level during the wet seasaon
(5000 counts/ 100ml) is found at the sampling
location- WR.6, and the lowest coliform count
level (126 counts / 100ml) is found at the WR
5 sampling point. While the analysis of total
coliform in the dry season ranged from 528
counts/ 100ml - 10000 counts/ 100ml with an
average total coliform level of 2222.7 counts/
100ml. The highest total coliform level in the
dry season (10000 counts/ 100ml) was found
at the WR. 6 sampling location, and the lowest
total coliform level in the dry season (528
counts/ 100ml) was found at the WR. 5
sampling point location. Increased levels of
total coliform at WR.6 location is due to
livestock activities around the rice fields -
their manure has the potential to pollute the
existing irrigation environment next to it, there
are residential areas located at the top (RT Km
9) which mostly use water from the irrigation
canal/ channel for bathing and washing.
However, it is possible that the irrigation canal
is also used as a place to defecate, especially
by children who like to play or bathe in this
place. While the WR.5 location is also the
location of the Animal Husbandry Department
UPTD - SBB District.In this place freshwater
fish ponds are developed where its final waste
is discharged into the Riuapa river and not at
the WR.6 irrigation channel location. Chapra's
(1997) research in Rijal (2013) state that the
coliform bacteria group was one of the
indicators indicating the presence of domestic
waste contaminants in the waters.
Based on class II quality standards PP No. 82
year 2001, the total coliform required is 5000
counts/ 100 ml. The analysis results of the
total coliform during the wet seasaon tends to
be below the quality standard, except for the
WR.6 sampling location (5000 counts/ 100
ml). While for the dry season, total coliform
analysis on the side of WR.6 (10000 counts/
100ml) and WR.7 (6200 counts/ 100 ml) are
above the quality standard threshold while
most sampling points of the coliform content
are below the quality standard threshold as
presented in Table 5 and Figure 2.
Fecal Coliform
The results of Fecal Coliform analysis for the
type of Escherichia coli (E. coli) bacteria
varies between the wet and dry seasons
(Figure 3). The E. coli content is highest in the
wet season and is found in a row at WR.8
station (46 counts/ 100ml), WR.14 (43 counts/
100ml), WR.12 (43 counts/ 100ml) and WR.2
(41 counts/ 100ml) with an average E. coli
level: wet season of 35.53 counts/ 100ml.
While for the dry season the highest E. coli
levels were found at WR.13 stations (29
counts/ 100ml) and WR 14 (28 counts/ 100ml)
with an average of E. coli for the dry season
an amount of 20.67 counts/ 100ml. While on
the other hand the lowest level of E. coli in the
wet season is found at WR.4 station (32
counts/ 100ml), and in the dry season the
lowest E. coli levels are found at WR.11 and
WR.5 stations with the same level that is equal
Page 4
Int.J.Curr.Microbiol.App.Sci (2019) 8(7): 11-22
14
to 15 counts/ 100ml. Based on the comparison
results with the quality standard it shows that
at all stations the E. coli level has exceeded
the maximum threshold both based on class II
quality standards PP No. 82 year 2001 (<1
number / 100ml) and PMK No. 32 year 2017
(free of E. coli) as presented in Figure 4.
Fecal Coliform is part of the total coliform
that is able to ferment lactose at a temperature
of 44.5˚C. About 97% of the total content of
Coliform bacteria. Human feces are Fecal
Coliform, which mainly consists of
Escherichia (E. coli) and several Klebsiella
species. These fecal coliform bacteria are
found also in animal feces (Effendi, 2003).
Escherichia coli is one of the harmless total
coliforms found in human feces. The abundant
presence of E. coli in waters illustrates that the
waters are contaminated by human waste,
which may be accompanied by pathogenic
bacteria contamination. Escherichia coli as
one the coli example, that in certain
circumstances can defeat the body's defense
mechanism, it can stay in the bladder
(cystitis), pelvis (pyelitis), kidney and liver.
These bacteria can also cause diarrhea,
septimia, peritonistis, meningitis and other
infections (Suriwiria, 2003).
Human feces can produce pathogenic bacteria
in the form of Escherichia coli, Shigella sp.,
Vibrio cholerae, Campylobacter jejuni and
Salmonella, and all are members of fecal
coliform. These bacteria can cause diarrhea in
humans. While Escherichia coli if consumed
continuously will in the long term have an
impact on ones’ health - where diseases will
occur such as inflammation of the intestine,
diarrhea, infections of the urinary tract and
bile ducts (Prayitno, 2009).
The incidence of diarrhea increased at the
peak of the wet season. However, in the dry
season the incidence of diarrhea persists
because river water is still being used by the
community even though some needs are met
by using water wells. The dominant
environmental factor that causes the outbreak
of diarrhea, is namely the lack of inadequate
clean water facilities and the disposal of feces
and waste into the river, resulting in
contamination of the fecal coliform bacteria in
river water and causing diarrhea outbreaks.
The results of the factorial analysis on the
water quality microbiological parameters are
the values of total Coliform and E. coli using
two analysis factors, namely the influence of
Station and Season, for each of the Total
Coliform and E. coli variables is presented in
Table 5 and Table 6.
Based on the graphics the season and station
interactions towards total coliform values
showed that for the wet season the total
coliform levels at all stations were low and has
experienced an increase in the dry season. A
very significant increase was seen at WR.6
and WR.15 stations with a very large
difference in value compared to other stations.
From the graph it is clear to see that the E. coli
value is higher in the wet season when
compared to the E. coli value in the dry season
at all stations with a significant decrease,
specifically at WR.8 station. The distribution
of E. coli levels at all stations is quite different
in the wet season compared to the dry season
which is almost the same value.
The quality of the microbiological properties
in the Riuapa river water, which includes the
total coliform and E. coli, shows a significant
difference between the wet season and the dry
season. The analysis of the real difference test
showed that the microbiological parameters,
namely Total Coliform and E. coli overall
water samples, had significant differences at
all stations between the wet season and dry
season.
Page 5
Int.J.Curr.Microbiol.App.Sci (2019) 8(7): 11-22
15
Fig.1 Research Location
Fig.2 Graphic Plots of Season and Station Interaction Charts towards the Total Coliform Value
Page 6
Int.J.Curr.Microbiol.App.Sci (2019) 8(7): 11-22
16
Fig.3 Graphic Plot of Season & Station Interaction toward the E. coli value
Fig.4 Land Coverage Map of the Wae Riuapa Watershed in 2009 and 2018
Source: 2018 BPKH Satellite Image Interpretation Results - Region IX of Maluku, 2009 and 2018
Fig.5 Land Coverage Change of the WaeRiuapa watershed - Graphic Year 2009
Page 7
Int.J.Curr.Microbiol.App.Sci (2019) 8(7): 11-22
17
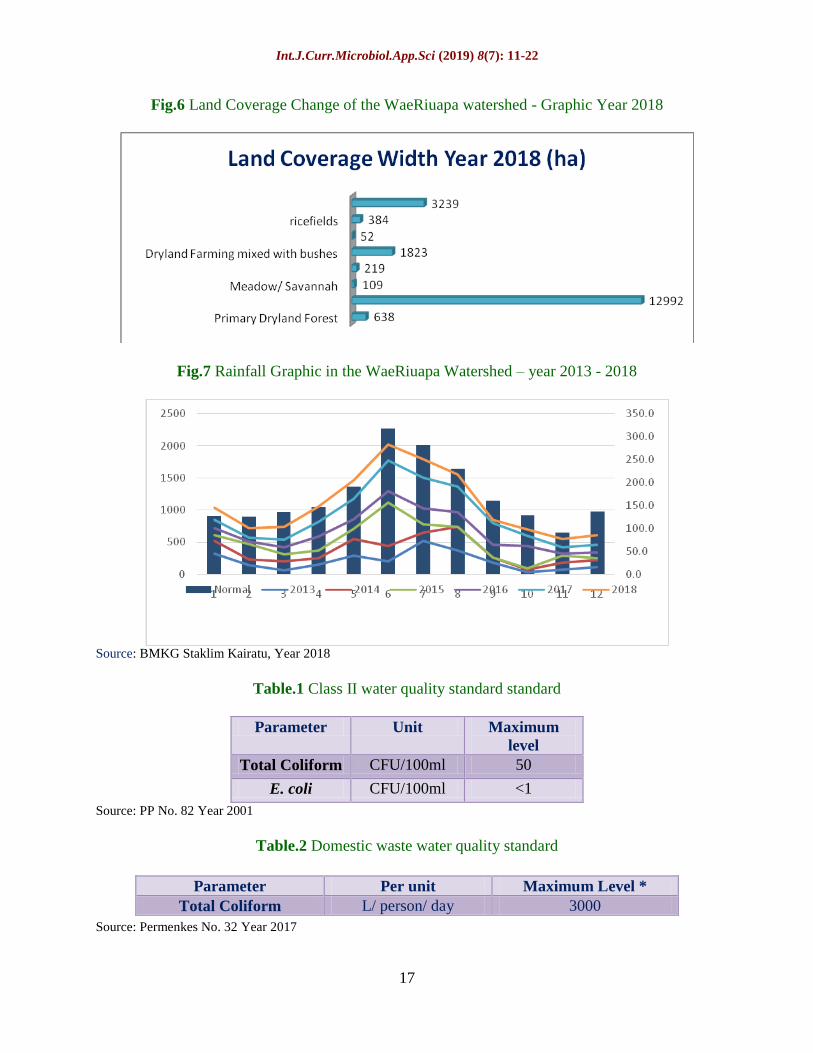
Fig.6 Land Coverage Change of the WaeRiuapa watershed - Graphic Year 2018
Fig.7 Rainfall Graphic in the WaeRiuapa Watershed – year 2013 - 2018
Source: BMKG Staklim Kairatu, Year 2018
Table.1 Class II water quality standard standard
Parameter Unit Maximum
level
Total Coliform CFU/100ml 50
E. coli CFU/100ml <1
Source: PP No. 82 Year 2001
Table.2 Domestic waste water quality standard
Source: Permenkes No. 32 Year 2017
Parameter Per unit Maximum Level *
Total Coliform L/ person/ day 3000
Page 8
Int.J.Curr.Microbiol.App.Sci (2019) 8(7): 11-22
18
Table.3 Water Sampling Location at the WaeRiuapa River Basin, West Seram District
Location Code Sampling Location Coordinates
WR.1 Upstream Wai Riuapa 1 S 030 17’ 19,70” - E 128
0 23’ 41,88”
WR.2 UpstreamWae Riuapa 2 S 030 17’ 21,07” - E 128
0 23’ 41,62”
WR.3 Dam Area S 030 17’ 32,7” - E 128
0 23’ 37,0”
WR.4 Dig Wells at Seledri (Celery)
Plantation
S 030 17’ 36,9” - E 128
0 23’ 31,1”
WR.5 Fish Cultivation Area S 030 17’ 38,56” - E 128
0 23’ 25,56”
WR.6 White Building Irrigation II S 030 19’ 35,8” - E 128
0 22’ 09,3”
WR.7 White Building Irrigation I S 030 19’ 35,8” - E 128
0 22’ 09,6”
WR.8 Irrigation Channel - Center 1 S 030 19’ 36,04” - E 128
0 22’ 08,91”
WR.9 Wai Riuapa - Center 1 S 030 19’ 41” - E 128
0 22’ 25”
WR.10 Irrigation Channel - Center 2 S 030 20’ 05,6” - E 128
0 20’ 57,7”
WR.11 Wai Riuapa - downstream 1 S 030 20’ 21” - E 128
0 21’ 41”
WR.12 Wai Riuapa - downstream 2 S 030 20’ 23,85” - E 128
0 21’ 51,44 ”
WR.13 Wai Riuapa - downstream 3 S 030 20’ 25,14” - E 128
0 21’ 52,00”
WR.14 Dig Wells atFam. Bp.
Sukirman
S 030 20’ 26,6” - E 128
0 21’ 41,3”
WR.15 Irrigation Channel -
downstream
S 030 20’ 28,6” - E 128
0 21’ 42,4”
Table.4 Microbiology water quality measurement results of the Riuapa River
Para
meter
Pe
r
U
nit
Met
hod
Standard Measurement Result
Micro
biolog
y
PP.
82/0
1
PMK
.32/1
7
Seas
on
W
R
1
W
R
2
W
R
3
W
R
4
W
R
5
W
R6
WR
7
W
R
8
W
R
9
W
R1
0
W
R
11
W
R1
2
W
R1
3
W
R1
4
W
R1
5
Total
Colifo
rm
Co
un
t/1
00
ml
Dou
ble
tube
s
50
CF
U/
3000 Wet 1
2
1
0
23
00
95
5
19
0
12
6
50
00
200
0
42
7
32
1
29
1
31
1
21
8
29
9
18
7
21
9
100
ml
ltr/pe
rs./da
y
Dry 1
5
6
6
29
00
11
76
61
9
52
8
10
00
0
620
0
12
29
11
56
12
82
13
88
12
18
15
28
13
55
11
95
E.
coli
Co
un
t/1
00
ml
Dou
ble
tube
s
<1
CF
U/
Not
prese
nt
Wet 3
5
41 33 32 29 29 34 46 35 29 31 43 42 43 31
100
ml
Dry 2
4
22 18 19 15 19 16 21 26 17 15 24 29 28 17
Source: The microbiological characteristic quality analysis in the WaeRiuapa watershed, year 2018
Page 9
Int.J.Curr.Microbiol.App.Sci (2019) 8(7): 11-22
19
Table 5. Variance Analysis of Coliform Value
Source DF SS MS F P
Station14 613,072,329 43790,881 139783,91 0,000
Season1 74,387,388 74387388 237450,34 0,000
Station*Season14 81031134 5787938 18475,55 0,000
Error 150 46991 313
Total 179 768537842
S = 17,6996 R-Sq = 99,99% R-Sq(adj) = 99,99%
Table6. Variance Analysis of E.Coli Value
Source DF SS MS F P
Station 14 613072329 43790881 139783,91 0,000
Season 1 74387388 74387388 237450,34 0,000
Station*Season 14 81031134 5787938 18475,55 0,000
Error 150 46991 313
Total 179 768537842
S = 17,6996 R-Sq = 99,99% R-Sq(adj) = 99,99%
The comparison results of the Total Coliform
and E. coli variables values with class II
quality standards showed that the value of E.
coli exceeded the standard of quality so the
quality of the microbiology of the waters of
the Riuapa river did not meet the standards.
The microbiology quality of the well water
(Total Coliform) is based on the results of a
comparison with the quality standards, as per
the Minister of Health Regulation No. 32 of
2017, was found below the standard quality
threshold of 3000 l/ person/ day with content
ranging from 190 l/ pers. / day and 619 l/
pers./ day at the celery plantation wells and
187 l/ pers./ day and 1.355l / person/ day at
the Fam. Sukirman 's water-well. These
results indicate that micro-biologically, it is
not advisable nor recommended to use this
source for drinking water due to the presence
of Total Coliform content in the water-well
even though it is still below the quality
standard threshold.
The results of the microbiological well-water
quality (E. coli) comparison are based on the
quality standards of Permenkes No. 32 year
2017, is above the required standard
threshold, meaning it is free of E. coli, both
types of well water already contain E. coli
making it not suitable as and for drinking
water.Significantly the levels of pollutants in
the water are influenced by season and station
location, and significant changes starting
upstream to downstream are found. During
the rainy season, pollutant levels increased at
stations in the middle and downstream
segments of the Riuapariver. In this segment
Page 10
Int.J.Curr.Microbiol.App.Sci (2019) 8(7): 11-22
20
there is human activity and is an area of
agriculture (rice fields) and dominant
settlements that contribute a lot of waste
disposal into nature. In general, based on PP
82 the water quality of the Riuapa river has an
impact on the environment.
In year 2001 regarding class II water quality
standards (for river water) and Permenkes 32
year 2017 (for well-water) it is proven that the
levels of pollutant parameters in the river
water and well-water are still quite high and
will in the run affect the population’s health
who consumed them.
The variables of Total Coliform and E. coli
are indicators of healthy drinking water. The
number of these organic compounds can be
related to community activities that take place
along and around the watershed. Based on
observations, at stations that have high levels
of E. coli and total coliform, there are indeed
organic and inorganic wastes household
waste. Statements of some of the residents
who live and interact in the vicinity of the
downstream irrigation, they experienced
itching when exposed to or using the water
from the channel and during the wet season
the people of Waimital village were often
experiencing vomiting & diarrhea illnesses
This indicates that there is considerable
pollution in the downstream irrigation channel
due to community waste production which is
directly discharged into the canal. Based on
observations of several rice fields, tofu
industries (home industries), lodging,
residents' houses and food stalls directly
adjacent to waterways, it turns out that they
dispose their waste directly into the canal.
This is thought to be one of the causes of
itching and diarrhea/ vomiting sickness in the
community.
Changes in land cover over the Wae Riuapa
watershed affect the amount and water debit
of the Riuapa river. The results showed that
the water debit and the water level of the
Riuapa river were also affected in August
2018 the water level of the Riuapa river was
very high with a water flow reaching
0,1.06.13 m/ sec then gradually decreasing
until December where the Riuapa river is
03.01.48 m/ sec with a water level only
reaching the range between 25 cm (in the
upstream area) and the water debit 01.39.06 m
/ sec with a water level reaching 35 cm
downstream. This indicates that the increase
in the debit of the river water has an impact
on the dilution and dissolution of the ions
contained in the soil. This can be seen in the
test parameters' value where in the wet
season, the content of Total Coliform and E.
coli increases at several points, as follows:
WR.6 (Total Coliform 5000 jml/100ml),
WR.8 (E. coli 46 jml/100ml), WR.12 (E. coli
43jml/100ml), and WR 14 (E. coli
43jml/100ml) while in the dry season the
Total Coliform levels increased at WR.6
(10,000ml / 100ml) stations representing the
upstream segment (WR.6), Middle segment
(WR.8) and downstream segments of the
Riuapa river (WR.12 and WR.14).
This is in line with the results of Suryo et al.,
(2014), stating that the factors influencing the
water quality are due to human activities and
nature processes, because the upstream to
downstream segments show a dominant
change in land use, which in turn increases
the level of pollution and pollutant content
that varies according to the type of land use
implemented.
The land cover change map of the WaeRiuapa
watershed (Picture 4) shows that land cover
changes have occurred over the past 10 years.
Some types of land use have increased widely
in 2018 including secondary dry-land forests,
settlements, dry land agriculture mixed with
shrubs, rice fields and shrubs whereas for
meadow areas and open land there has been a
widespread decline in 2018 (Figure 5 and 6).
Page 11
Int.J.Curr.Microbiol.App.Sci (2019) 8(7): 11-22
21
The change in the land coverage rate at the
WaeRiuapa watershed is shown on the
Figures 5 and 6.
Changes in land cover over the WaeRiuapa
watershed also affect rainfall fluctuations and
river water debit. Based on the rainfall
graphics over the last six years in the
WaeRiuapa watershed shows that the amount
of rainfall is in the normal range with a
steadily increasing rainfall from year to year
nearing the normal limit. More specifically in
2018, rainfall in January, April and May has
exceed the normal limit and in August the
amount of rainfall is close to normal. While
the amount of rainfall in December is below
the amount of normal rainfall as shown in
Figure 7.
In conclusion, the results of the water
microbiology quality analysis are above the
threshold of good quality standards based on
class II PP water quality standards no. 82 year
2001 (for river water) and Minister of Health
Regulation No. 32 of 2017 (for well-water)
this shows that the level of pollutant
parameters in the river water and well-water
are still quite high, namely E. coli average in
the wet season is 35.53 counts/ 100ml, during
the dry season an average of 20.67 counts/
100ml. (BM E. coli: <1 account/ 100ml) and
Total Coliform average in the wet season is
937.6 counts/ 100ml, and during the dry
season an amount an average of 2222.7
counts/ 100ml (bm Total Coliform: 3,000
counts/ 100ml), an amount like this will affect
the population's health through consumption.
Changes in land cover resulted in an increase
in the river water debit affecting the process
of dilution and dissolution of ions contained
in the soil, this can be seen in the value of the
test parameters where the content of Total
Coliform variable increased 5,000 counts/
100ml to 10,000 counts/ 100ml specifically at
WR.6 stations in and during the wet and dry
seasons.
*Notes: E. colixJumlah/ 100ml = counts/
colony/ number of - not sure which one to use.
In this case the word “counts” has been used.
References
Asdak, C. 2010. Hidrologi dan Pengelolaan
Daerah Aliran Sungai. Hydrology and
Management of Watersheds Gajahmada
University Press. Yogyakarta.
Effendy, H. 2003. Telaah Kualitas Air bagi
Pengelolaan Sumber Daya dan
Lingkungan Perairan. Penerbit kanasius.
Yogyakarta. A Water Quality Review
for the Resources and Marine
Environment Management. Publisher
Kanasius, Yogyakarta.
Muhammad Rijal, 2013. Kualitas Air Sungai
Arbes Ambon Berdasarkan Nilai
Koliform Fecal. Program Studi
Pendidikan Biologi.IAIN AMBON.
“Arbes” River Water Quality Ambon -
Based on Coliform Fecal Value.
Biology Education Study Program,
IAIN AMBON
Republik Indonesia. 2001. Peraturan
Pemerintah Nomor 82 Tahun 2001
tentang Pengelolaan Kualitas Air dan
Pengendalian Pencemaran Air. Jakarta:
Sekretariat Negara. Government
Regulation Number 82 year 2001
Regarding the Water Quality and Water
Pollution Control Management.
Jakarta: State Secretariat.
Republik Indonesia. 2017. Peraturan Menteri
Kesehatan Nomor 32 Tahun 2017
tentang Standar Baku Mutu Lingkungan
dan Persyaratan Kesehatan Air
Keperluan Sanitasi, Kolam Renang,
Solus per Aqua. Minister of Health
Regulation Number 32 Year 2017
regarding
Suriawiria.U, 2003, Mikrobiologi Air dan
Dasar-Dasar Pengolahan Buangan
Secara Biologis, PT. ALUMNI,
Bandung. Water Microbiology and
Basics of Biological Waste
Page 12
Int.J.Curr.Microbiol.App.Sci (2019) 8(7): 11-22
22
Management, PT. ALUMNI, Bandung.
Suryo Ari W, Winardi Dwi Nugraha, Endro
Sutrisno. 2014. Analisis Kualitas Air
Sungai Bringin Kota Semarang Dengan
Metode Nsf – Ika (Studi Kasus Sungai
Bringin). Kajian Kualitas Air. 2014.
How to cite this article:
Soukotta Elna, Oszaer Robert, Bokiraya Latuamury. 2019. The Microbiology Quality Analysis
of the Waters of Riuapa River and Its Impact on the Environment.
Int.J.Curr.Microbiol.App.Sci. 8(07): 11-22. doi: https://doi.org/10.20546/ijcmas.2019.807.003