The MIS 11 – MIS 1 analogy, southern European vegetation,atmospheric methane and the “early anthropogenic hypothesis”
P. C. Tzedakis
Earth and Biosphere Institute, School of Geography, University of Leeds, Leeds, LS2 9JT, UK
Department of Environment, University of the Aegean, 81100 Mytilene, Greece
present address: Department of Geography, University College London, London WC1E 6BT, UK
Received: 30 April 2009 – Published in Clim. Past Discuss.: 13 May 2009Revised: 28 February 2010 – Accepted: 3 March 2010 – Published: 17 March 2010
Abstract. Marine Isotope Stage (MIS) 11 has been consid-ered a potential analogue for the Holocene and its future evo-lution. However, a dichotomy has emerged over the precisechronological alignment of the two intervals, with one so-lution favouring a synchronization of the precession signaland another of the obliquity signal. The two schemes leadto different implications over the natural length of the cur-rent interglacial and the underlying causes of the evolutionof greenhouse gas concentrations. Here, the close couplingobserved between changes in southern European tree pop-ulations and atmospheric methane concentrations in previ-ous interglacials is used to evaluate the natural vs. anthro-pogenic contribution to Holocene methane emissions and as-sess the two alignment schemes. Comparison of the vegeta-tion trends in MIS 1 and MIS 11 favours a precessional align-ment, which would suggest that the Holocene is nearing theend of its natural course. This, combined with the divergencebetween methane concentrations and temperate tree popula-tions after 5 kyr BP, provides some support for the notion thatthe Holocene methane trend may be anomalous compared toprevious interglacials. In contrast, comparison of MIS 1 withMIS 19, which may represent a closer astronomical analoguethan MIS 11, leads to substantially different conclusions onthe projected natural duration of the current interglacial andthe extent of the anthropogenic contribution to the Holocenemethane budget. As answers vary with the choice of ana-logue, resolution of these issues using past interglacials re-mains elusive.
Part of the scientific rationale for pursuing studies of MIS11 is that it may be important as a potential analogue forpresent and future natural climate changes. Comparing Juneinsolation variations of the last 3 million years, Loutre andBerger (2000, 2003) found that the interval 405–340 thou-sand years before present (kyr BP) represented the clos-est most recent astronomical analogue for the target period5 kyr BP–60 thousand years after present (kyr AP). This sim-ilarity is a function of the modulating effect of the 400 kyreccentricity cycle on climatic precession: low eccentricityvalues today and∼400 kyr BP lead to low-amplitude preces-sional changes and subdued insolation variations (Loutre andBerger, 2000, 2003). Although the phasing of precessionand obliquity changes in MIS 11 and 1 is not identical, theintervals 405–340 kyr BP and 5 kyr BP–60 kyr AP show thehighest linear correlation in terms of the insolation signal ofrecent interglacials with similar values of atmospheric CO2concentrations (Loutre and Berger, 2000, 2003).
While the astronomical analogy between MIS 1 and MIS11 has been incorporated in mainstream literature, there is adistinct difference between the two intervals: the Holocenecontains one insolation peak so far, while the MIS 11 in-terval of full interglacial conditions (Substage 11c of themarine isotopic stratigraphy) extends over two insolationpeaks. Thus an interesting situation has arisen with regardto the precise alignment of the two intervals. Loutre andBerger (2000, 2003) synchronized the two intervals by us-ing the precessional variations in summer insolation at 65◦ N,so that today corresponded to∼398 kyr BP. The choice ofthe synchronization parameter was guided by the canoni-cal view that changes in global ice volume are correlated
Published by Copernicus Publications on behalf of the European Geosciences Union.
Astronomical Age (kyr BP) Astronomical Age (kyr BP)
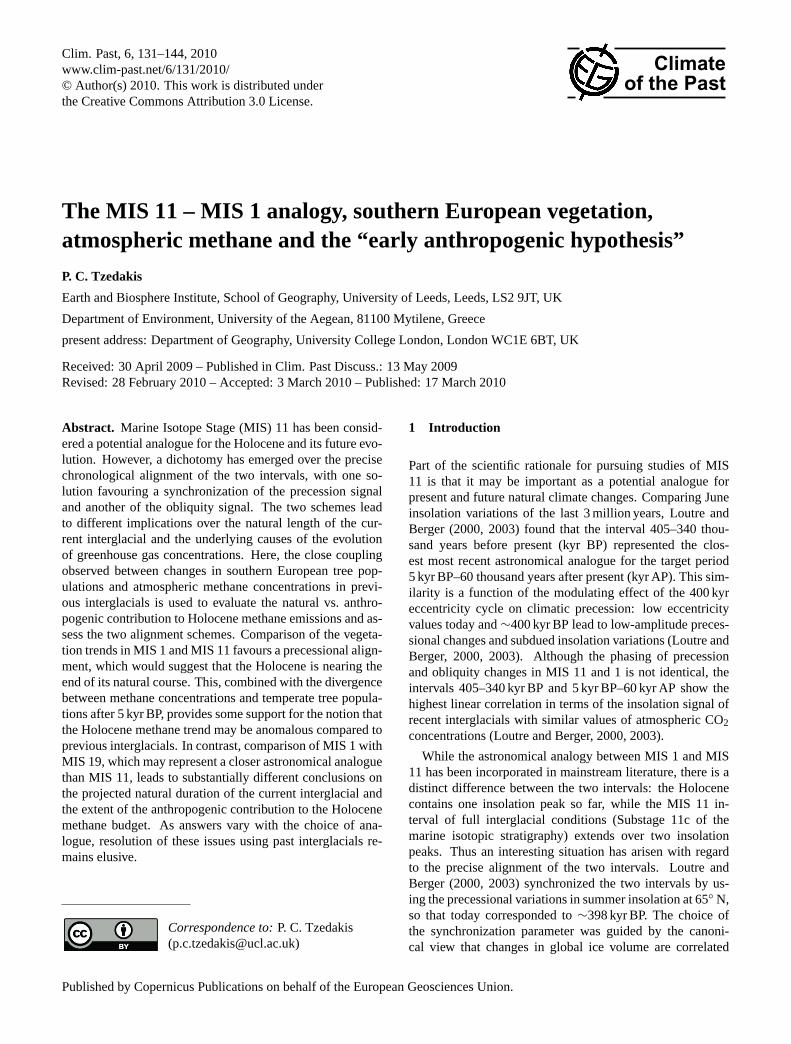
Fig. 1. Comparison of two alignment schemes between the past and future 50 kyr (red) and a 100-kyr interval encompassing MIS 11 (black)(after Masson-Delmotte et al., 2006). Left panel shows synchronization of the precession signal and right panel synchronization of theobliquity signal and also of Terminations I and V in the deuterium record of the EPICA Dome C (EDC) ice core, Antarctica.(a) precessionindex, plotted on an inverse vertical axis (Berger and Loutre, 1991);(b) obliquity (Berger and Loutre, 1991);(c) δ18Obenthic record fromthe LR04 stack (Lisiecki and Raymo, 2005), plotted on its own timescale;(d) Deuterium (δD) composition of ice in EDC ice core (EPICACommunity Members, 2004). Ages in parentheses denote thousand years after present (kyr AP). TI and TV denote Terminations I and V,respectively. The EPICA data in this figure are plotted on the EDC2 timescale used in the EPICA Community Members (2004) paper wherethe alignment was originally made. In other figures, EPICA data are shown on the more recent EDC3 timescale (Jouzel et al., 2007).
with variations in summer insolation received at high north-ern latitudes (e.g. Crucifix and Berger, 2006). In contrast,the EPICA Community Members (2004) aligned Termina-tions I and V in theδD record of the Dome C ice core inAntarctica, which instead suggested that today should corre-spond to∼407 kyr BP. In essence, this alignment representsa synchronization of the obliquity signal instead of preces-sion, which according to Masson-Delmotte et al. (2006) maybe more appropriate, because of the role of obliquity changesin triggering deglaciation especially during intervals of weakprecessional variations, as is the case for MIS 11 and 1. The
two schemes (Fig. 1) lead to very different conclusions aboutthe length of the current interglacial, in the absence of an-thropogenic forcing. With the end of MIS 11 full interglacialconditions and the start of ice accumulation estimated to haveoccurred at∼395 kyr BP (de Abreu et al., 2005; Ruddiman2005a, 2007), the precessional alignment would suggest thatthe Holocene is nearing its end, while the obliquity align-ment would suggest it has another 12 000 years to run itscourse. The two schemes also have different implications onthe underlying causes on the evolution of CO2 and CH4 con-centrations during the Holocene.
More specifically, the concentrations of these gases showearly Holocene peaks followed by declines, but the down-ward trend was reversed after 8 kyr BP and 5 kyr BP for CO2and CH4, respectively. In the “early anthropogenic hypothe-sis”, Ruddiman (2003) proposed that humans began modify-ing greenhouse gas concentrations thousands of years beforethe industrial era, with forest clearance and intensificationof rice agriculture leading to the increases in atmosphericCO2 and CH4 levels, respectively. By drawing analogieswith natural trends in the previous three interglacials, Rud-diman (2003, 2007) estimated that the magnitude of the lateHolocene anomalies (the observed increase plus the valuethat would have been expected from a naturally decreas-ing trend) prior to the start of the industrial era was∼35–40 ppmv for CO2 and ∼230–250 ppbv for CH4. The ele-vated greenhouse gas concentrations countered the naturalcooling trend and prevented global climate from slipping intoa glacial transition.
The “early anthropogenic hypothesis” has come undersubstantial criticism, especially regarding the extent to whichhuman activities can account for the Holocene greenhousegas trends. Using a carbon cycle climate model, Joos etal. (2004) showed that a 40 ppmv increase in CO2 levels overthe past 8 kyr would require a carbon emission of 700 Gt anda decrease in atmosphericδ13C of 0.6‰. They pointed outthat this was incompatible with the ice coreδ13C record,which shows a 0.25‰ decrease (Indermuhle et al., 1999),and exceeded any possible emissions from deforestation.Historical cumulative carbon losses due to deforestation havebeen estimated to be 180–200 Gt (de Fries et al., 1999), ofwhich 120 Gt have been attributed to post-1850 land-usechanges (Houghton, 1999). This leaves 60–80 Gt for pre-industrial carbon losses, which would account for a CO2rise of only 4–6 ppmv. Joos et al. (2004) suggested that arange of mechanisms (changes in ocean chemistry, sea sur-face temperatures, terrestrial carbon uptake and release andcoral reef build-up) contributed to the 20 ppmv CO2 rise inthe Holocene (note that that this does not incorporate an ad-ditional 15–20 ppmv calculated by Ruddiman (2003, 2007)as the actual anomaly). Although Ruddiman (2007) arguedthat the extent of pre-industrial carbon losses due to defor-estation had been underestimated and proposed a figure of120–137 GtC, he concluded that this would again accountfor only a small fraction (∼9 ppmv) of the total anomaly re-quired. Ruddiman (2007) suggested that most likely sourcefor the remaining 26–31 ppmv was an anomalously warmocean, but conceded that this remained the largest uncertaintyof the “early anthropogenic hypothesis”.
With regard to methane, Schmidt et al. (2004) suggestedthat the mid-to-late Holocene increase in CH4 reflectednatural emissions from boreal wetlands and river deltas,thus making any large anthropogenic component unneces-sary. In response, Ruddiman (2005b, 2007) pointed out thatalthough boreal wetlands were still expanding during thelate Holocene (Smith et al., 2004), net emissions declined
because of reduced summer temperatures and a trend to-wards drier bog types (MacDonald et al., 2006). This issupported by recent ice core analyses, which show that theinterpolar gradient declined in the late Holocene, indicatinglow-latitude methane sources (Brook et al., 2008). As forthe possible contribution from river deltas, Ruddiman (2007)suggested that this may also reflect anthropogenic influences,with forest clearance leading to erosion and increased sed-iment loads in rivers, and contributing to an expansion ofriver delta systems. In addition, a compilation of archaeolog-ical sites in rice-growing areas of China, suggests a ten-foldincrease in new sites between 6 and 5 kyr BP (Ruddiman etal., 2008). Further refinement of the anthropogenic hypoth-esis for the Holocene CH4 increase, now recognizes that inaddition to early rice farming and irrigation, biomass burn-ing, releases from livestock and human waste, and climatefeedbacks also contributed to the CH4 anomaly (Ruddiman,2007).
One question that has consistently arisen in this debateis if the Holocene increases in greenhouse gases are natu-ral, then why are they not observed in earlier interglacials(e.g. Ruddiman, 2003, 2007)? Broecker and Stocker (2006)proposed that a likely explanation is the dampening of pre-cessional variations by the small orbital eccentricity duringthe Holocene compared to the previous three interglacials.Thus, while more extreme changes in precession produced“short” interglacials in the last three climatic cycles, thesechanges are too weak to lead to glacial inception today. Sincethe last three interglacials are imperfect orbital analogues,MIS 11 has emerged as a more appropriate testbed for the“early anthropogenic hypothesis”.
By extension, this meant that the alignment of MIS 11and MIS 1 became a central issue in this debate. Rud-diman (2005a, 2007) aligned the two intervals by usingthe precessional variations, so that today corresponded to∼398 kyr BP, following Loutre and Berger (2000, 2003), andconcluded that in the absence of Holocene anthropogenic in-terference, ice caps and small ice sheets would have startedforming in northern polar regions. In contrast, Broecker andStocker (2006) aligned the two Terminations (and by exten-sion the obliquity signal), as in EPICA Community Mem-bers (2004), and suggested that the early part of MIS 11 wassimilar to the Holocene. Given that the subdued precessionalchange at∼419 kyr BP (Fig. 1) did not lead to glacial in-ception and CO2 levels remained above 270 ppmv for 28 kyr,they proposed that the Holocene will also be a long inter-glacial and concluded that the rise in greenhouse gases wasnatural and not anthropogenic.
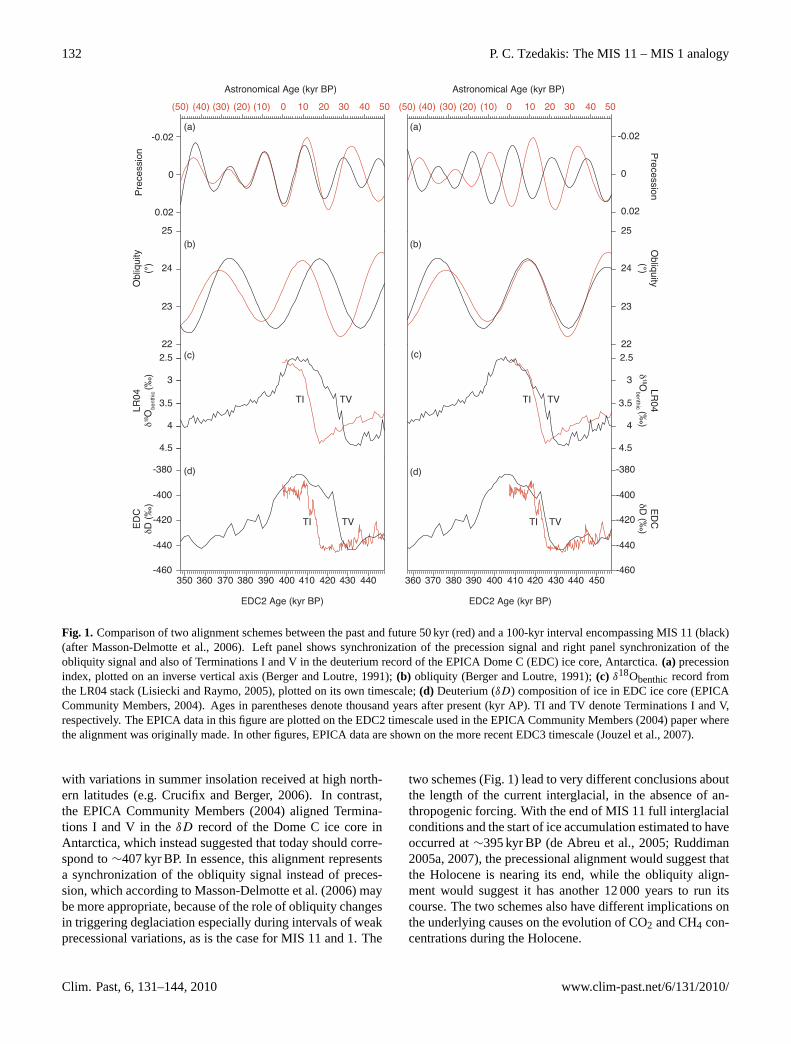
With regard to the atmospheric methane record, the pre-cessional alignment (Fig. 2, left panel) suggests that thefirst MIS 11 peak and subsequent decline in CH4 (∼425–415 kyr BP), does not have a Holocene equivalent. Instead,it is the second CH4 peak (∼412–400 kyr BP) that corre-sponds to the Holocene part, showing an early increase fol-lowed by a monotonic decline, which, in turn, implies that
Astronomical Age (kyr BP) Astronomical Age (kyr BP)
ED
CδD
(‰
)P
rece
ssio
nE
DC
CH
4 (
ppbv
)E
DC
δD (‰
)O
bliquity(°)
ED
CC
H4 (ppbv)
Precession
Obl
iqui
ty(°
)
Fig. 2. Comparison of two alignment schemes between the past and future 50 kyr (red) and a 100-kyr interval encompassing MIS 11(black). Left panel shows synchronization of the precession signal and right panel synchronization of Terminations I and V in the EDCδD record, on the EDC3 timescale. Note that the alignment of the two Terminations no longer leads to a synchronization of the obliquitysignal. (a) precession index, plotted on an inverse vertical axis (Berger and Loutre, 1991);(b) obliquity (Berger and Loutre, 1991);(c) δD
composition of ice in the EDC ice core, Antarctica (Jouzel et al., 2007);(d) atmospheric methane (CH4) concentration from the EDC icecore (Loulergue et al., 2008). Ages in parentheses denote thousand years after present (kyr AP).
the Holocene CH4 evolution did not follow a natural trend. Incontrast, the alignment of the two Terminations (Fig. 2, rightpanel) implies that the early MIS 11 peak is equivalent to theearly MIS 1 peak (including the Lateglacial Interstadial andYounger Dryas). Both interglacials then show a downwardtrend and then an upward trend in CH4 concentrations, theanalogy suggesting natural causes and leading to a refutationof the “early anthropogenic hypothesis”. The problem, how-ever, with such comparisons of CH4 (and also CO2) trends isthat it is difficult to evaluate the different alignment schemesand simultaneously assess whether the Holocene evolution ofgreenhouse gas concentrations is natural or anthropogenic,in other words, to solve two different problems at the sametime.
In view of this limitation, independent tests assume a par-ticular significance. The rationale is that if two periods areanalogous, the aligned portions of a record should evolve ina similar way. This would then allow an assessment of theperformance of different synchronizations. Alternatively, ifsynchronization is not an issue, the extent to which Holocenetrends appear anomalous compared to those of other inter-glacials can be evaluated. Antarctic temperatures have al-ready been compared (e.g. Masson-Delmotte et al., 2006),but if according to Ruddiman (2007) anthropogenic green-house gas emissions countered the natural Holocene coolingtrend, then Antarctic temperatures may not be sufficientlyindependent to address the issue. Here, I argue that south-ern European vegetation changes may provide an alternative
approach to evaluate the alignment schemes and offer someinsights into the debate over the natural evolution (or other-wise) of Holocene atmospheric methane concentrations.
Before undertaking such comparisons, the choice of theoptimal parameters for the synchronization schemes needsto be discussed. It is worth noting that comparison of Figs. 1and 2 reveals a discrepancy in the Termination/obliquityalignment. As stated earlier, the alignment of Termina-tions I and V of the EDCδD record by EPICA Commu-nity Members (2004), using the EDC2 ice core chronol-ogy, corresponded to a synchronization of the obliquity sig-nal (Masson-Delmotte et al., 2006). However, the higher-resolution EDCδD record (Jouzel et al., 2007) as well asthe atmospheric greenhouse gas records (Luthi et al., 2008;Loulergue et al., 2008) use the revised EDC3 chronology(Parrenin et al., 2007). In EDC3, the mid-point of the MIS12/11 transition is∼4 kyr earlier compared to EDC2 (but ageuncertainties in that part of the record are in the order of 4–6 kyr). This means that an alignment of the two Termina-tions on the EDC3 timescale (with today corresponding to411 kyr BP), no longer leads to synchronization of the obliq-uity signal, and is therefore more difficult to justify in termsof the physical mechanism leading to deglaciation (Crucifixand Berger, 2006). However, extension of the Dome FujiAntarctic ice core back to 470 kyr BP, using a chronologybased on orbital tuning of the O2/N2 ratio of trapped air tolocal insolation (Kawamura et al., 2007), provides an age forTermination V that is closer to EDC2 than to EDC3 (Kawa-mura et al., 2008). Thus instead of aligning Termination Ito Termination V, the obliquity signal may be more appro-priate for the synchronization of the two intervals, not onlybecause ice core timescales may evolve compared to astro-nomical timescales, but also because the choice of proxy mayalso influence the synchronization. For example, if the ben-thic δ18O record (where Terminations are originally defined)were used to align Terminations I and V, a slightly differ-ent solution would emerge (see Fig. 1c and d, right panel).Finally, from a more philosophical point of view it may beargued that since the designation of potential analogues forthe Holocene has an astronomical basis, then the alignmentof intervals should rely on astronomical parameters associ-ated with specific physical mechanisms leading to ice vol-ume changes. Therefore, here a precessional alignment ofMIS 1 and MIS 11 (following Loutre and Berger, 2000, 2003;and Ruddiman, 2005a, 2007) is compared with an obliquityalignment (following Masson-Delmotte et al., 2006).
2 Atmospheric methane and southern Europeanvegetation
A recent comparison of pollen records from marine andterrestrial sequences in southern Europe has revealed astrong coherence between changes in tree populations andatmospheric methane concentrations over the last 800 kyr
(Tzedakis et al., 2009). More specifically, analysis of corre-lation between methane and tree pollen records from the Por-tuguese margin and Greece showed strong coherency valuesin the short eccentricity, obliquity and climatic precessionbands, but also at shorter, millennial-scale periodicities, atthe 95% significance level. Variations in the continental hy-drological balance provide a link for the observed patterns,leading to concomitant changes in southern European vegeta-tion and low-latitude wetland methane production (althoughadditional contributions to the methane budget from extra-tropical sources are not excluded). The close coupling be-tween low- and mid-latitude hydrological changes is thoughtto reflect shifts in the mean latitudinal position of the In-tertropical Convergence Zone (ITCZ) (Tzedakis et al., 2009).This affects (i) the location and magnitude of the rainy sea-son in the tropics and subtropics, including monsoonal sys-tems; and (ii) the extent to which southern Europe is domi-nated by subtropical or mid/high-latitude influences. Whilethe amplitude of glacial-interglacial variability exceeds thatof intra-interglacial variability, hydrological changes occur-ring during the course of an interglacial, have a prominentinfluence on both methane concentrations and southern Eu-ropean vegetation (see Tzedakis et al., 2009 and referencestherein).
More specifically, during boreal summer insolation max-ima at the onset of interglacials, the maximum northwarddisplacement of the ITCZ leads to an amplification of the hy-drological cycle in northern low latitudes and an increase inwetland extent and CH4 emissions. During the course of aninterglacial, the northernmost position of the ITCZ graduallyshifts south in response to decreasing summer insolation andNorthern Hemisphere cooling. This leads to weakened In-dian, East Asian and African summer monsoons and a reduc-tion in northern low-latitude wetland extent and atmosphericmethane concentrations.
With respect to vegetation, it is important to appreciatethat the apparent subdued nature of changes in summary treepollen curves during the course of an interglacial, concealsimportant shifts in vegetation composition. The term “in-terglacial vegetation succession” has been used to describethe sequential expansion of different vegetation communi-ties, with certain species tending to appear early and oth-ers later during the course of an interglacial (e.g. Tzedakis,2007). In southern Portugal, pollen diagrams show a pre-temperate (late glacial) phase of open woodland (with ju-niper, pine, birch, deciduous oak); the onset of the inter-glacial is characterized by early expansion of mediterraneansclerophylls and deciduous oaks; this is followed by a de-crease of mediterranean sclerophylls and an expansion of de-ciduous trees; the final part of the interglacial is character-ized by late successional trees (conifers) and heathland (Eri-caceae), and an increase in herbs. These vegetation changescan also be viewed within the context of shifts in the meanlatitudinal position of the ITCZ. In the early part of an inter-glacial, the maximum northward displacement of the ITCZ
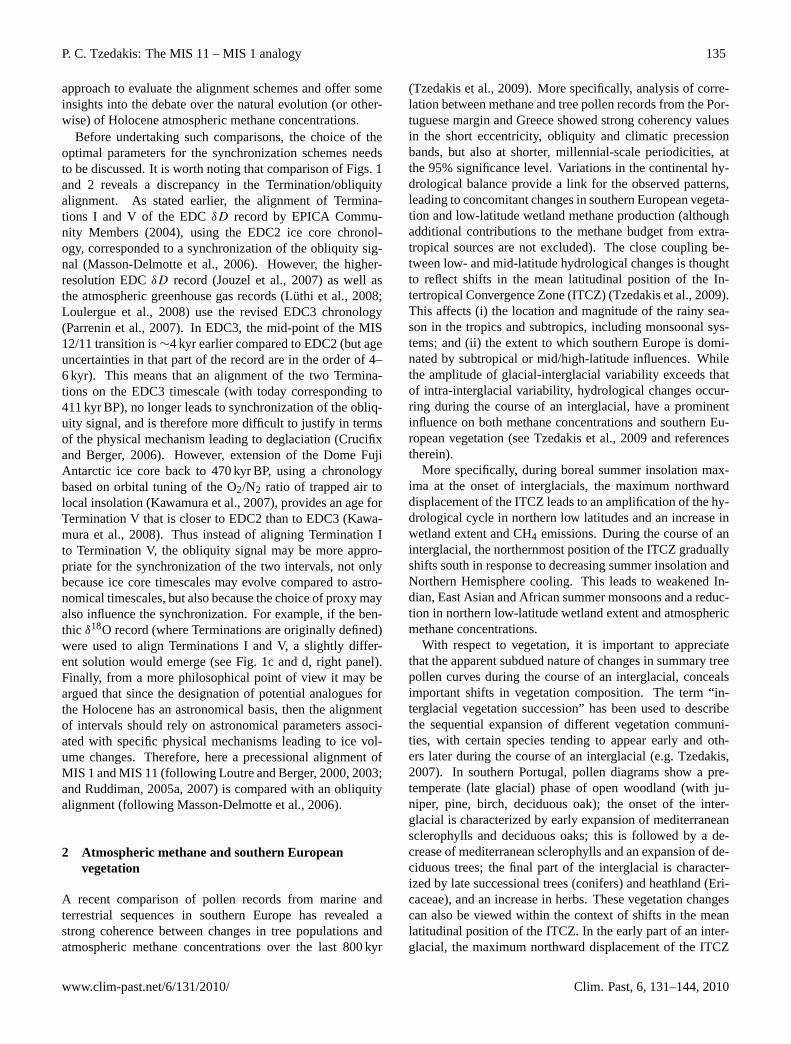
Fig. 3. Comparison of Holocene trends with those of the last four interglacials.(a) 21 June insolation 65◦ N (Berger and Loutre, 1991);(b) heathland (Ericaceae) pollen percentages in Portugal;(c) temperate tree (Eurosiberian and mediterranean taxa) pollen percentages inPortugal;(d) atmospheric CH4 concentration from the EDC ice core (Loulergue et al., 2008), plotted on the EDC3 timescale. The pollenrecords used are from deep-sea cores on the Portuguese margin: MD01-2443 for MIS 7e, 9e, 11c (Tzedakis et al., 2004, 2009; Roucoux etal., 2006); MD95-2042 for MIS 5e (Sanchez Goni et al., 1999; Shackleton et al., 2002); and SU8118 for the last 20 kyr (Turon et al., 2003)(see text for details of age models). Note that the Ericaceae curves are not intended to show any similarity to the methane record, but are usedhere to denote that the expansion of heathland is a consistent feature of the later part of the interglacial succession when summer insolationis reduced.
in summer brings southern Europe well under the influenceof the zone of subtropical descent, leading to more extremesummer aridity and accentuated seasonality of precipitationcompared to present, and to the expansion of mediterraneanand sub-mediterranean vegetation communities. In the east-ern Mediterranean, summer aridity is enhanced by the ef-fects of an intensified summer Indian monsoon on the Rossbywave circulation. As the northernmost position of the ITCZgradually shifts south during the course of an interglacial,the seasonal impact of subtropical subsidence in southernEurope is reduced and mid-latitude influences become moredominant. This leads to increased annual moisture availabil-ity and reduced temperatures and, in turn, to the expansionof late-successional trees and heathlands.
In contrast to CO2, with its direct effects on photosyn-thetic rates and water-use efficiency of plants as well as itsclimatic effects, the direct influence of atmospheric methaneon vegetation is limited. Instead, atmospheric methane con-centrations and southern European vegetation are linked viashifts in the mean latitudinal position of the ITCZ and theirimpact on low- and mid-latitude hydrological changes. It is
precisely because of the fact that methane is not directly in-volved in forcing vegetation changes, that a comparison be-tween the two records is sufficiently independent to evaluatethe natural vs. anthropogenic origin of the Holocene methaneevolution.
3 Pollen records
Figure 3 shows the temperate (Eurosiberian and mediter-ranean) tree taxa and Ericaceae (heathland) curves frompollen sequences from deep-sea cores on the SW Portuguesemargin, along with the 65◦ N June insolation and CH4records for the last four interglacials and the Holocene. ThePortuguese margin, where the combined effects of majorriver systems and a narrow continental shelf lead to the rapiddelivery of terrestrial material, including pollen, to the deep-sea environment, has in recent years emerged as a criti-cal area for linking marine and terrestrial records. Aeolianpollen transport is limited by the direction of the prevail-ing offshore winds and pollen is mainly transported to the
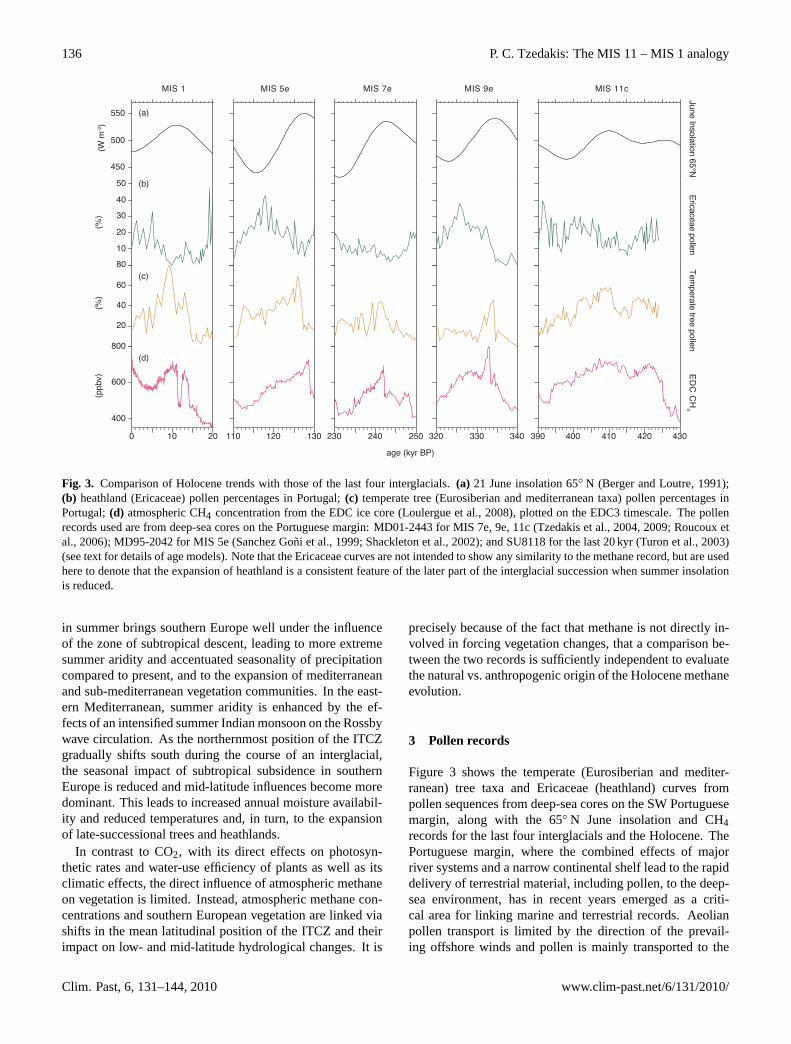
abyssal site by the outflow of the Tagus river. Comparison ofmodern marine and terrestrial samples along western Iberiahas shown that the marine pollen assemblages provide an in-tegrated picture of the regional vegetation of the adjacentcontinent (Naughton et al., 2007). One of the main ad-vantages of this approach is that the combination of pollenand palaeoceanographic proxy analyses from the same sam-ple set allows an in situ assessment of relative leads andlags and the use of the marine timescale for dating landevents. The pollen records for MIS 11c, MIS 9e and 7eused here are from deep-sea core MD01-2443 (37◦52.85′ N,10◦10.57′ W; water depth 2925 m) west of Lisbon (Tzedakiset al., 2004, 2009; de Abreu et al., 2005; Roucoux et al.,2006). The age model of MD01-2443 has been developedby aligning itsδ18Obenthicrecord to the AntarcticδD ice corerecord (Tzedakis et al., 2004, 2009), following Shackletonet al. (2000). This provides a detailed chronological controland allows comparisons with records of atmospheric green-house gases preserved in ice cores. This is because both thepollen and CH4 records form independent stratigraphic time-series with different phase relationships to theδ18ObenthicandδD records that are used in the tuning procedure. Thepollen record of MIS 5e is from deep-sea core MD95-2042(37◦48′ N, 10◦10′ W; water depth 3146 m) (Sanchez Goni etal., 1999), near the location of MD01-2443. The sequenceis supported by detailed benthic and planktonicδ18O strati-graphies and a chronology based on inferred sea-level still-stands correlated with radiometrically-dated marine coral ter-races (Shackleton et al., 2002). It is worth noting that a newage model based on correlations with an Italian speleothemrecord suggests an earlier onset of the Last Interglacial (Drys-dale et al., 2009), which would bring the pollen and methanepeaks closer together. Finally, the MIS 2/1 record is fromthe SU8118 marine sequence (37◦46′ N, 10◦11′ N; waterdepth 3135 m) in the same area, supported by a detailedchronology based on 22 calibrated14C dates (Bard et al.,2000). The SU8118 pollen record can be compared withthe most detailed Lateglacial/Holocene Portuguese pollen se-quence from Charco da Candieira (40◦20′30′′ N, 7◦34′35′′ W,1409 m a.s.l.), supported by 26 calibrated14C dates (van derKnaap and van Leeuwen, 1995, 1997). Charco da Candieirais a small lake of glacial origin located in a valley in the high-est central part of the Serra da Estrella mountain range. An-nual precipitation at that site is∼3000 mm and mean tem-perature of the coldest and warmest months is∼2.4◦C and17◦C, respectively (van der Knaap and van Leeuwen, 1995).The comparison (Fig. 4) suggests that the marine SU8118pollen sequence provides an accurate representation of themajor vegetation trends in temperate trees and Ericaceae asrecorded at the land site of Charco da Candieira.
Figure 3 draws attention to the overall similarity be-tween trends in temperate tree populations and atmosphericmethane concentrations during MIS 5e, 7e, 9e and 11c. Thissimilarity is further supported by consideration of the suc-cession in vegetation communities during the course of an
0
25
50
75
100
SU8118Temperate tree pollen (%)
0 5 10 15 20
0
25
50
SU8118Ericaceae pollen (%)
0
25
50
75
100
Charco da CandieiraTemperate tree pollen (%)
0
25
50Charco da CandieiraEricaceae pollen (%)
Age (kyr BP)
Fig. 4. Comparison of Lateglacial/Holocene changes in temperatetree (Eurosiberian and mediterranean taxa) (orange) and heathland(Ericaceae) (green) pollen percentages in deep-sea core SU8118 onthe SW Portuguese margin (Turon et al., 2003) and at Charco daCandieira in the Serra da Estrella mountain range in Portugal (vander Knaap and van Leeuwen, 1995, 1997), plotted on their respec-tive timescales. Note that the record from Charco da Candieira cov-ers only the last∼15 kyr.
interglacial, as discussed in the previous section: early ex-pansion of mediterranean sclerophylls and deciduous oaks,followed by expansion of heathland. However, before un-dertaking comparisons with the current interglacial, the ex-tent to which Holocene vegetation changes reflect natu-ral trends needs to be assessed. Van der Knaap and vanLeeuwen (1995), infer human impacts on vegetation atCharco da Candieira through most of the Holocene. Us-ing a profound understanding of local ecology and detailedpollen taxonomy, van der Knaap and van Leeuwen (1995) de-tect evidence of human activity at lower altitudes as early as∼9.6 kyr BP and in the mountains and the valley sometimearound 8.5–8 kyr BP (dates are in calendar years). Small-scale deforestation and grazing increased after∼6.5 kyr BPand intensified after∼5 kyr BP, while large-scale deforesta-tion is inferred to have started after∼3.4 kyr BP. The largestvegetation disturbance took place in the last millennium,which led to complete deforestation and soil erosion. Thevegetation today consists of heavily grazed and burnt heath-lands, shrublands and grasslands and also pine plantations(van der Knaap and van Leeuwen, 1995). It would appear,therefore, that Holocene pollen record is heavily overprintedwith human impacts on vegetation, which would largely in-validate comparisons with natural vegetation changes of ear-lier interglacials.
However, the attribution of some of the vegetation changesto human activities may be questioned. For example, the ear-liest evidence of extra-regional human impact∼9.6 kyr BPis based on the presence of long-distance pollen of olive
trees from lower altitudes, but expansion of mediterraneansclerophylls is a consistent feature of the early parts of allpre-Holocene interglacials in southern Europe (e.g. Magriand Tzedakis, 2000; Tzedakis, 2007). The changes around8.5–8 kyr BP, characterized by small declines in oak and in-creases in pine values could alternatively reflect the impactof climatic oscillations that are known to have occurred dur-ing this interval (e.g. Rohling and Palike, 2005). The step-wise decreases in tree populations at 6.5, 5 and 3.4 kyr BPare mainly a function of Ericaceae (heathland) expansion.Examination of the record of earlier interglacials (Fig. 3b)shows that expansion of Ericaceae is a consistent featureof the later part of the interglacial succession in this area.Moreover, recent work in the Portuguese margin (Margariet al., 2007) has revealed a clear precessional pattern withEricaceae expanding during periods when perihelion occursin NH winter, under lower temperature and reduced aridityregimes. The comparison with earlier interglacials, suggeststhat the degree to which anthropogenic practices mask natu-ral vegetation trends during the Holocene, prior to 1 kyr BP,may have been overestimated. This is echoed in a recentstatistical analysis of the dating of pollen zone boundariesof 492 sites from Europe (Gajewski et al., 2006). Thisshowed that major vegetation transitions were synchronousacross the continent and also synchronous with those iden-tified by a similar analysis in North American pollen dia-grams. Moreover, these transitions appeared to be coevalwith major environmental changes in North Atlantic marinerecords and Greenland ice cores. The close correspondencesuggests that major vegetation changes in the Holocene wereforced by large-scale reorganizations of atmospheric circu-lation (Gajewski et al., 2006). This does not mean that an-thropogenic impacts on vegetation can be discounted, but itmay suggest that humans took advantage of these climatechanges, especially in the more vulnerable ecosystems wheretree populations are nearer their tolerance limits.
4 Vegetation trends and interglacial comparisons
If we entertain the premise that Holocene pollen changes un-til 1 kyr BP primarily reflect natural vegetation trends, thoughthey may have been abetted by anthropogenic practices, thenthe following observations can be made. Examination ofthe Holocene methane and temperate tree pollen records re-veals opposing trends after 5 kyr BP, to an extent that is notobserved in the previous four interglacials (Fig. 3). Evenif natural vegetation trends are masked by anthropogenicchanges, it is difficult to imagine an increase in temper-ate tree populations when NH summer insolation is de-clining (e.g. Tzedakis, 2007). Indeed examination of pre-Holocene interglacial vegetation successions, argues againstsuch possibility. Given the strong coherence between trendsin tree populations in southern Europe and atmosphericmethane concentrations during previous interglacials, the
late Holocene divergence is striking. This decoupling maysuggest a predominantly extratropical methane source, suchas a contribution from boreal wetlands (e.g. Schmidt et al.,2004), but recent work on the interpolar methane gradient in-dicates a low-latitude origin (Brook et al., 2008). It is possi-ble that the southward ITCZ displacement during the courseof the Holocene transported moisture from one hemisphereto the other, leading to an increase in Southern Hemisphere(SH) low-latitude wetland methane sources (Brook et al.,2008; Burns, 2008). However, the question remains why thesame pattern is not observed during earlier interglacials. Themore accentuated precessional changes in the last three in-terglacials should have led to more extreme interhemisphericmoisture transfers, but a late-interglacial increase in methaneconcentrations is not observed. This would imply that bar-ring other methane sources, the late Holocene methane trendmay be anomalous compared to previous interglacials.
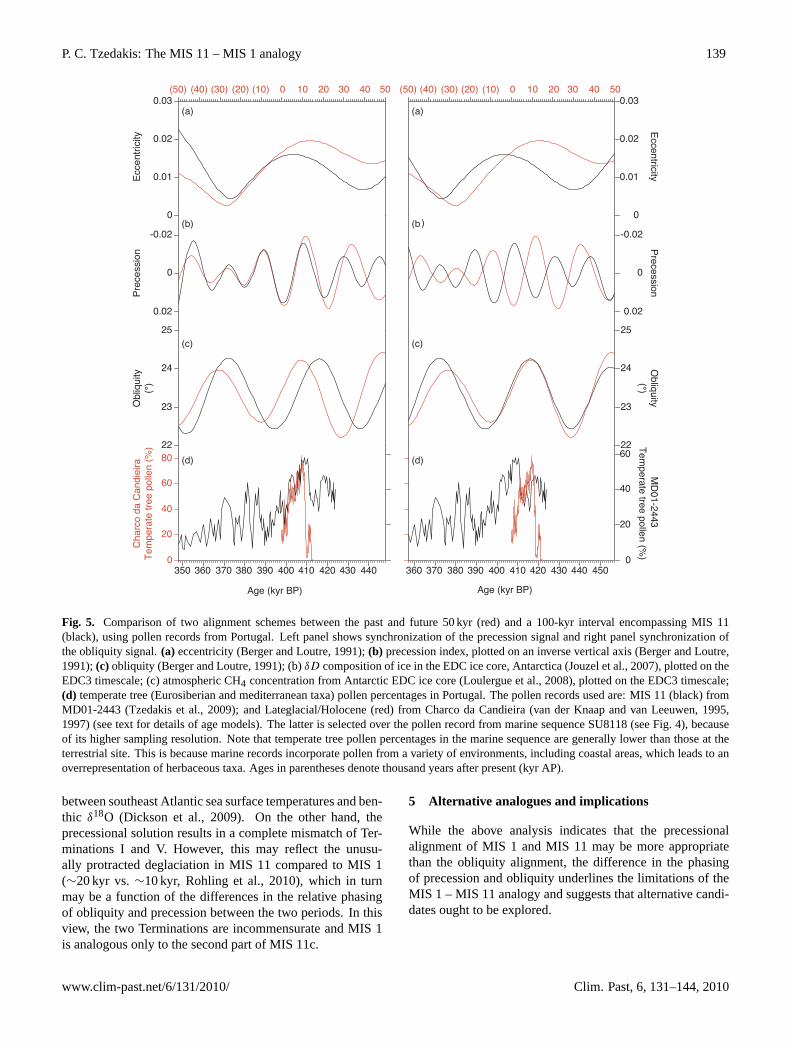
With respect to the alignment of MIS1 and MIS 11, a com-parison of the vegetation trends of the two interglacials mayprovide an independent assessment of the different synchro-nization schemes. While neither alignment is excellent, theprecessional alignment (Fig. 5, left panel) can be argued togive more parallel changes in vegetation between MIS 11and the elapsed portion of the Holocene. By comparison,the obliquity alignment (Fig. 5, right panel) leads to a greaterdivergence between the two curves: after the early MIS 11peak, the pollen record shows a second expansion of treepopulations (∼410 kyr BP), while the Holocene record showsa monotonic decline in tree populations. A similar outcomeemerges if the records are plotted on the EDC2 timescale(not shown here). This comparison provides support for theprecessional alignment of MIS 11 and MIS 1 of Loutre andBerger (2000, 2003) and Ruddiman (2005a, 2007). By exten-sion, it implies that in the absence of anthropogenic forcing,the Holocene should be nearing the end of its natural course.
The choice of a precessional over an obliquity alignmentof the two periods more closely reflects the notion that thesearch for Holocene analogues is underpinned by the modu-lating effect of the 400-kyr eccentricity cycle on precession.Thus, synchronization schemes are not completely uncon-strained, but are governed by the timing of minima in the am-plitude of eccentricity variations, which would suggest thatan alignment of the eccentricity signal should not be signifi-cantly violated. Although it is impossible to match preciselythe phases of precession, obliquity and eccentricity from twodifferent periods (e.g. Crucifix and Berger, 2006), the obliq-uity synchronization leads to a substantial divergence in thealignment of the eccentricity variations between the two pe-riods (Fig. 5a, right panel), so that instead of the minimain eccentricity values at∼372 kyr BP and 27 kyr AP beingmatched they are 9 kyr apart. This divergence in the eccen-tricity signal is further exacerbated by an alignment of thetwo Terminations (on the EDC3 timescale) (Broecker andStocker, 2006) or of an alternative synchronization of theintervals preceding the two deglaciations, using the phasing
Fig. 5. Comparison of two alignment schemes between the past and future 50 kyr (red) and a 100-kyr interval encompassing MIS 11(black), using pollen records from Portugal. Left panel shows synchronization of the precession signal and right panel synchronization ofthe obliquity signal.(a) eccentricity (Berger and Loutre, 1991);(b) precession index, plotted on an inverse vertical axis (Berger and Loutre,1991);(c) obliquity (Berger and Loutre, 1991); (b)δD composition of ice in the EDC ice core, Antarctica (Jouzel et al., 2007), plotted on theEDC3 timescale; (c) atmospheric CH4 concentration from Antarctic EDC ice core (Loulergue et al., 2008), plotted on the EDC3 timescale;(d) temperate tree (Eurosiberian and mediterranean taxa) pollen percentages in Portugal. The pollen records used are: MIS 11 (black) fromMD01-2443 (Tzedakis et al., 2009); and Lateglacial/Holocene (red) from Charco da Candieira (van der Knaap and van Leeuwen, 1995,1997) (see text for details of age models). The latter is selected over the pollen record from marine sequence SU8118 (see Fig. 4), becauseof its higher sampling resolution. Note that temperate tree pollen percentages in the marine sequence are generally lower than those at theterrestrial site. This is because marine records incorporate pollen from a variety of environments, including coastal areas, which leads to anoverrepresentation of herbaceous taxa. Ages in parentheses denote thousand years after present (kyr AP).
between southeast Atlantic sea surface temperatures and ben-thic δ18O (Dickson et al., 2009). On the other hand, theprecessional solution results in a complete mismatch of Ter-minations I and V. However, this may reflect the unusu-ally protracted deglaciation in MIS 11 compared to MIS 1(∼20 kyr vs.∼10 kyr, Rohling et al., 2010), which in turnmay be a function of the differences in the relative phasingof obliquity and precession between the two periods. In thisview, the two Terminations are incommensurate and MIS 1is analogous only to the second part of MIS 11c.
5 Alternative analogues and implications
While the above analysis indicates that the precessionalalignment of MIS 1 and MIS 11 may be more appropriatethan the obliquity alignment, the difference in the phasingof precession and obliquity underlines the limitations of theMIS 1 – MIS 11 analogy and suggests that alternative candi-dates ought to be explored.
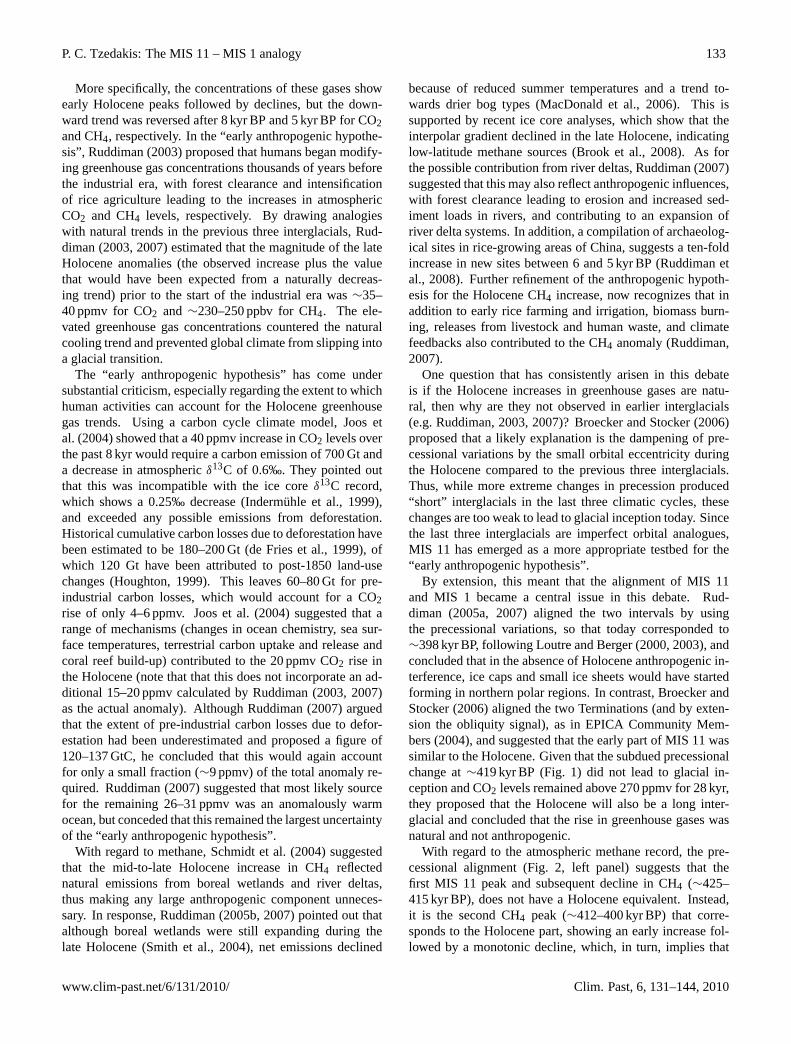
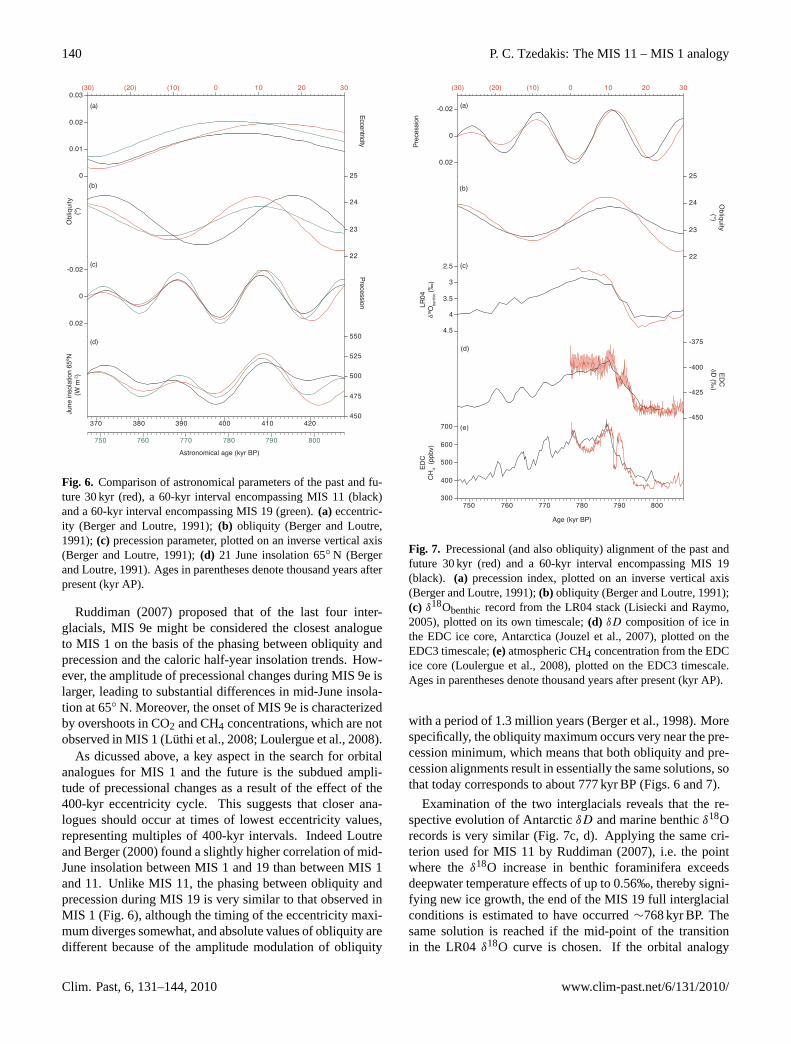
Fig. 6. Comparison of astronomical parameters of the past and fu-ture 30 kyr (red), a 60-kyr interval encompassing MIS 11 (black)and a 60-kyr interval encompassing MIS 19 (green).(a) eccentric-ity (Berger and Loutre, 1991);(b) obliquity (Berger and Loutre,1991);(c) precession parameter, plotted on an inverse vertical axis(Berger and Loutre, 1991);(d) 21 June insolation 65◦ N (Bergerand Loutre, 1991). Ages in parentheses denote thousand years afterpresent (kyr AP).
Ruddiman (2007) proposed that of the last four inter-glacials, MIS 9e might be considered the closest analogueto MIS 1 on the basis of the phasing between obliquity andprecession and the caloric half-year insolation trends. How-ever, the amplitude of precessional changes during MIS 9e islarger, leading to substantial differences in mid-June insola-tion at 65◦ N. Moreover, the onset of MIS 9e is characterizedby overshoots in CO2 and CH4 concentrations, which are notobserved in MIS 1 (Luthi et al., 2008; Loulergue et al., 2008).
As dicussed above, a key aspect in the search for orbitalanalogues for MIS 1 and the future is the subdued ampli-tude of precessional changes as a result of the effect of the400-kyr eccentricity cycle. This suggests that closer ana-logues should occur at times of lowest eccentricity values,representing multiples of 400-kyr intervals. Indeed Loutreand Berger (2000) found a slightly higher correlation of mid-June insolation between MIS 1 and 19 than between MIS 1and 11. Unlike MIS 11, the phasing between obliquity andprecession during MIS 19 is very similar to that observed inMIS 1 (Fig. 6), although the timing of the eccentricity maxi-mum diverges somewhat, and absolute values of obliquity aredifferent because of the amplitude modulation of obliquity
-0.02
0
0.02
(30) (20) (10) 0 10 20 30
(a)
22
23
24
25
(b)
(e)
750 760 770 780 790 800300
400
500
600
700
Age (kyr BP)
-450
-425
-400
-375(d)
2.5
3
3.5
4
4.5
(c)
ED
CC
H4
(pp
bv)
Pre
cess
ion
LR04
δ18 O
bent
hic (‰
)
ED
CδD
(‰)
Obliquity
(°)
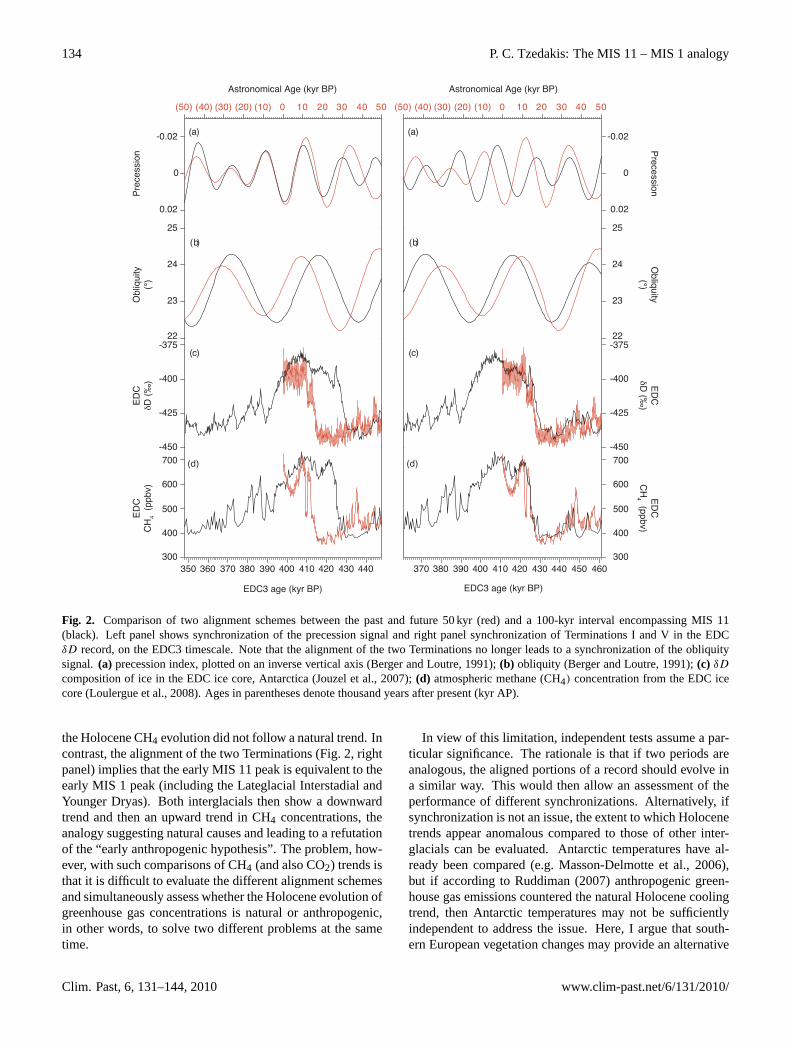
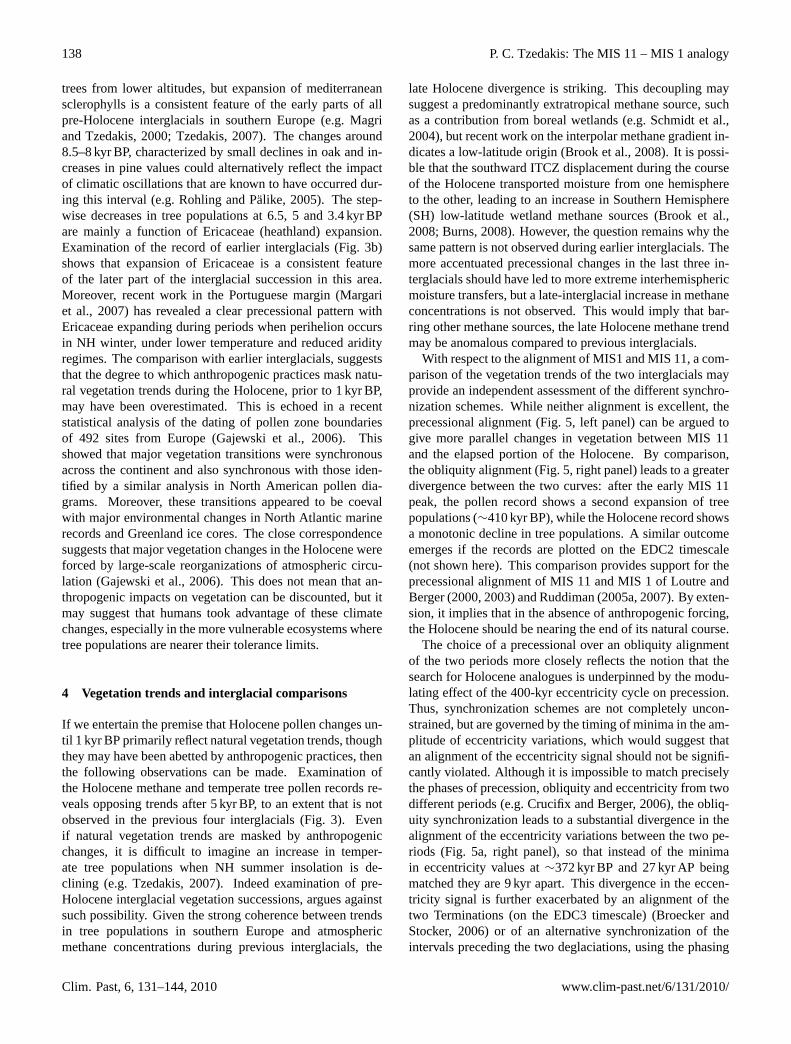
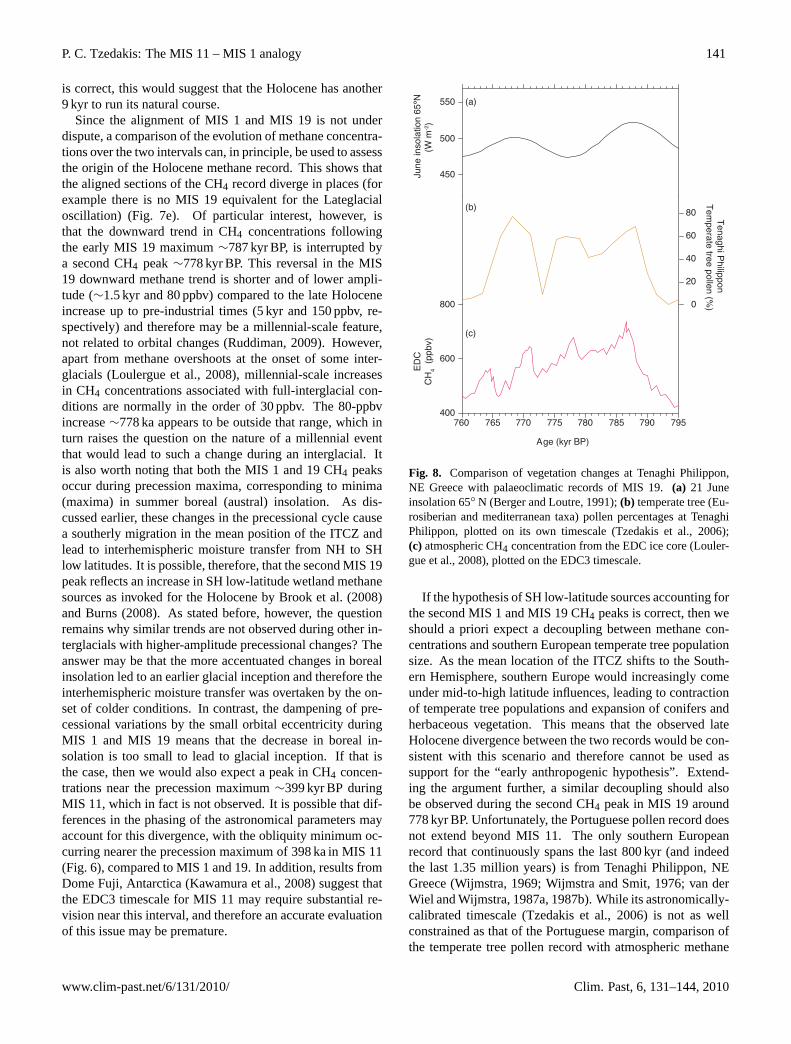
Fig. 7. Precessional (and also obliquity) alignment of the past andfuture 30 kyr (red) and a 60-kyr interval encompassing MIS 19(black). (a) precession index, plotted on an inverse vertical axis(Berger and Loutre, 1991);(b) obliquity (Berger and Loutre, 1991);(c) δ18Obenthic record from the LR04 stack (Lisiecki and Raymo,2005), plotted on its own timescale;(d) δD composition of ice inthe EDC ice core, Antarctica (Jouzel et al., 2007), plotted on theEDC3 timescale;(e)atmospheric CH4 concentration from the EDCice core (Loulergue et al., 2008), plotted on the EDC3 timescale.Ages in parentheses denote thousand years after present (kyr AP).
with a period of 1.3 million years (Berger et al., 1998). Morespecifically, the obliquity maximum occurs very near the pre-cession minimum, which means that both obliquity and pre-cession alignments result in essentially the same solutions, sothat today corresponds to about 777 kyr BP (Figs. 6 and 7).
Examination of the two interglacials reveals that the re-spective evolution of AntarcticδD and marine benthicδ18Orecords is very similar (Fig. 7c, d). Applying the same cri-terion used for MIS 11 by Ruddiman (2007), i.e. the pointwhere theδ18O increase in benthic foraminifera exceedsdeepwater temperature effects of up to 0.56‰, thereby signi-fying new ice growth, the end of the MIS 19 full interglacialconditions is estimated to have occurred∼768 kyr BP. Thesame solution is reached if the mid-point of the transitionin the LR04δ18O curve is chosen. If the orbital analogy
is correct, this would suggest that the Holocene has another9 kyr to run its natural course.
Since the alignment of MIS 1 and MIS 19 is not underdispute, a comparison of the evolution of methane concentra-tions over the two intervals can, in principle, be used to assessthe origin of the Holocene methane record. This shows thatthe aligned sections of the CH4 record diverge in places (forexample there is no MIS 19 equivalent for the Lateglacialoscillation) (Fig. 7e). Of particular interest, however, isthat the downward trend in CH4 concentrations followingthe early MIS 19 maximum∼787 kyr BP, is interrupted bya second CH4 peak∼778 kyr BP. This reversal in the MIS19 downward methane trend is shorter and of lower ampli-tude (∼1.5 kyr and 80 ppbv) compared to the late Holoceneincrease up to pre-industrial times (5 kyr and 150 ppbv, re-spectively) and therefore may be a millennial-scale feature,not related to orbital changes (Ruddiman, 2009). However,apart from methane overshoots at the onset of some inter-glacials (Loulergue et al., 2008), millennial-scale increasesin CH4 concentrations associated with full-interglacial con-ditions are normally in the order of 30 ppbv. The 80-ppbvincrease∼778 ka appears to be outside that range, which inturn raises the question on the nature of a millennial eventthat would lead to such a change during an interglacial. Itis also worth noting that both the MIS 1 and 19 CH4 peaksoccur during precession maxima, corresponding to minima(maxima) in summer boreal (austral) insolation. As dis-cussed earlier, these changes in the precessional cycle causea southerly migration in the mean position of the ITCZ andlead to interhemispheric moisture transfer from NH to SHlow latitudes. It is possible, therefore, that the second MIS 19peak reflects an increase in SH low-latitude wetland methanesources as invoked for the Holocene by Brook et al. (2008)and Burns (2008). As stated before, however, the questionremains why similar trends are not observed during other in-terglacials with higher-amplitude precessional changes? Theanswer may be that the more accentuated changes in borealinsolation led to an earlier glacial inception and therefore theinterhemispheric moisture transfer was overtaken by the on-set of colder conditions. In contrast, the dampening of pre-cessional variations by the small orbital eccentricity duringMIS 1 and MIS 19 means that the decrease in boreal in-solation is too small to lead to glacial inception. If that isthe case, then we would also expect a peak in CH4 concen-trations near the precession maximum∼399 kyr BP duringMIS 11, which in fact is not observed. It is possible that dif-ferences in the phasing of the astronomical parameters mayaccount for this divergence, with the obliquity minimum oc-curring nearer the precession maximum of 398 ka in MIS 11(Fig. 6), compared to MIS 1 and 19. In addition, results fromDome Fuji, Antarctica (Kawamura et al., 2008) suggest thatthe EDC3 timescale for MIS 11 may require substantial re-vision near this interval, and therefore an accurate evaluationof this issue may be premature.
400
600
800
(c)
760 765 770 775 780 785 790 795
Age (kyr BP)
0
20
40
60
80(b)
450
500
550 (a)
June
inso
latio
n 65
ºN(W
m-2)
Tenaghi P
hilippon T
emperate tree pollen (%
)
ED
CC
H4
(pp
bv)
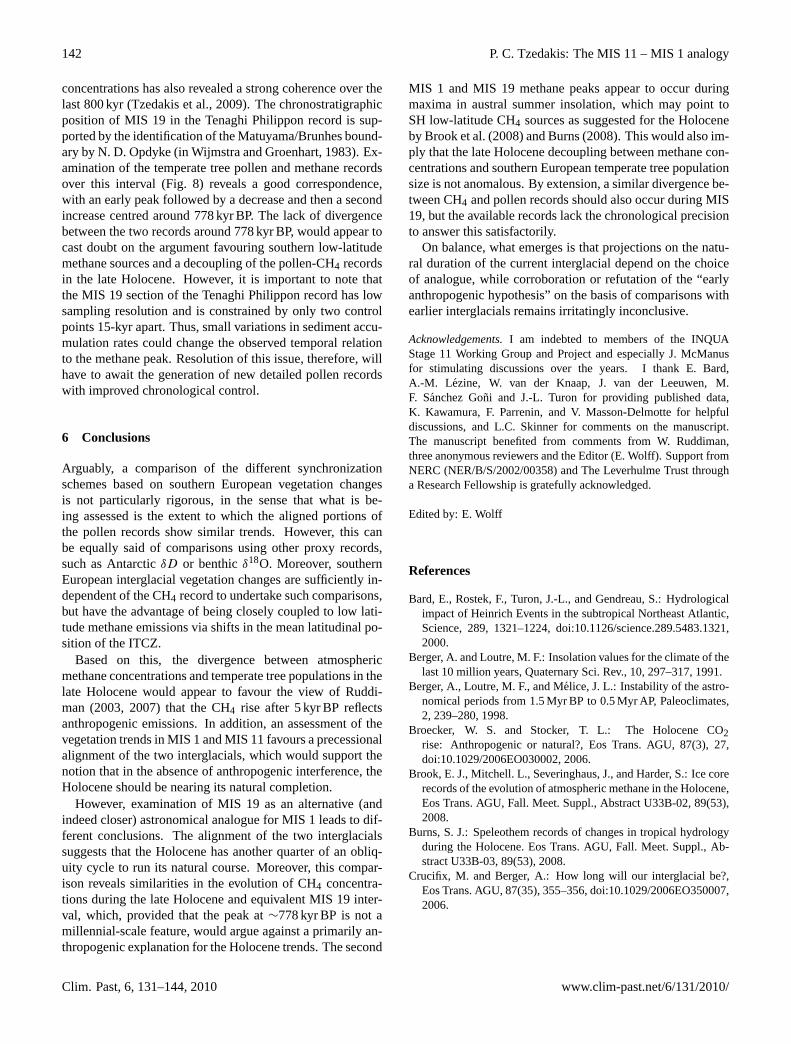
Fig. 8. Comparison of vegetation changes at Tenaghi Philippon,NE Greece with palaeoclimatic records of MIS 19.(a) 21 Juneinsolation 65◦ N (Berger and Loutre, 1991);(b) temperate tree (Eu-rosiberian and mediterranean taxa) pollen percentages at TenaghiPhilippon, plotted on its own timescale (Tzedakis et al., 2006);(c) atmospheric CH4 concentration from the EDC ice core (Louler-gue et al., 2008), plotted on the EDC3 timescale.
If the hypothesis of SH low-latitude sources accounting forthe second MIS 1 and MIS 19 CH4 peaks is correct, then weshould a priori expect a decoupling between methane con-centrations and southern European temperate tree populationsize. As the mean location of the ITCZ shifts to the South-ern Hemisphere, southern Europe would increasingly comeunder mid-to-high latitude influences, leading to contractionof temperate tree populations and expansion of conifers andherbaceous vegetation. This means that the observed lateHolocene divergence between the two records would be con-sistent with this scenario and therefore cannot be used assupport for the “early anthropogenic hypothesis”. Extend-ing the argument further, a similar decoupling should alsobe observed during the second CH4 peak in MIS 19 around778 kyr BP. Unfortunately, the Portuguese pollen record doesnot extend beyond MIS 11. The only southern Europeanrecord that continuously spans the last 800 kyr (and indeedthe last 1.35 million years) is from Tenaghi Philippon, NEGreece (Wijmstra, 1969; Wijmstra and Smit, 1976; van derWiel and Wijmstra, 1987a, 1987b). While its astronomically-calibrated timescale (Tzedakis et al., 2006) is not as wellconstrained as that of the Portuguese margin, comparison ofthe temperate tree pollen record with atmospheric methane
concentrations has also revealed a strong coherence over thelast 800 kyr (Tzedakis et al., 2009). The chronostratigraphicposition of MIS 19 in the Tenaghi Philippon record is sup-ported by the identification of the Matuyama/Brunhes bound-ary by N. D. Opdyke (in Wijmstra and Groenhart, 1983). Ex-amination of the temperate tree pollen and methane recordsover this interval (Fig. 8) reveals a good correspondence,with an early peak followed by a decrease and then a secondincrease centred around 778 kyr BP. The lack of divergencebetween the two records around 778 kyr BP, would appear tocast doubt on the argument favouring southern low-latitudemethane sources and a decoupling of the pollen-CH4 recordsin the late Holocene. However, it is important to note thatthe MIS 19 section of the Tenaghi Philippon record has lowsampling resolution and is constrained by only two controlpoints 15-kyr apart. Thus, small variations in sediment accu-mulation rates could change the observed temporal relationto the methane peak. Resolution of this issue, therefore, willhave to await the generation of new detailed pollen recordswith improved chronological control.
6 Conclusions
Arguably, a comparison of the different synchronizationschemes based on southern European vegetation changesis not particularly rigorous, in the sense that what is be-ing assessed is the extent to which the aligned portions ofthe pollen records show similar trends. However, this canbe equally said of comparisons using other proxy records,such as AntarcticδD or benthicδ18O. Moreover, southernEuropean interglacial vegetation changes are sufficiently in-dependent of the CH4 record to undertake such comparisons,but have the advantage of being closely coupled to low lati-tude methane emissions via shifts in the mean latitudinal po-sition of the ITCZ.
Based on this, the divergence between atmosphericmethane concentrations and temperate tree populations in thelate Holocene would appear to favour the view of Ruddi-man (2003, 2007) that the CH4 rise after 5 kyr BP reflectsanthropogenic emissions. In addition, an assessment of thevegetation trends in MIS 1 and MIS 11 favours a precessionalalignment of the two interglacials, which would support thenotion that in the absence of anthropogenic interference, theHolocene should be nearing its natural completion.
However, examination of MIS 19 as an alternative (andindeed closer) astronomical analogue for MIS 1 leads to dif-ferent conclusions. The alignment of the two interglacialssuggests that the Holocene has another quarter of an obliq-uity cycle to run its natural course. Moreover, this compar-ison reveals similarities in the evolution of CH4 concentra-tions during the late Holocene and equivalent MIS 19 inter-val, which, provided that the peak at∼778 kyr BP is not amillennial-scale feature, would argue against a primarily an-thropogenic explanation for the Holocene trends. The second
MIS 1 and MIS 19 methane peaks appear to occur duringmaxima in austral summer insolation, which may point toSH low-latitude CH4 sources as suggested for the Holoceneby Brook et al. (2008) and Burns (2008). This would also im-ply that the late Holocene decoupling between methane con-centrations and southern European temperate tree populationsize is not anomalous. By extension, a similar divergence be-tween CH4 and pollen records should also occur during MIS19, but the available records lack the chronological precisionto answer this satisfactorily.
On balance, what emerges is that projections on the natu-ral duration of the current interglacial depend on the choiceof analogue, while corroboration or refutation of the “earlyanthropogenic hypothesis” on the basis of comparisons withearlier interglacials remains irritatingly inconclusive.
Acknowledgements.I am indebted to members of the INQUAStage 11 Working Group and Project and especially J. McManusfor stimulating discussions over the years. I thank E. Bard,A.-M. Lezine, W. van der Knaap, J. van der Leeuwen, M.F. Sanchez Goni and J.-L. Turon for providing published data,K. Kawamura, F. Parrenin, and V. Masson-Delmotte for helpfuldiscussions, and L.C. Skinner for comments on the manuscript.The manuscript benefited from comments from W. Ruddiman,three anonymous reviewers and the Editor (E. Wolff). Support fromNERC (NER/B/S/2002/00358) and The Leverhulme Trust througha Research Fellowship is gratefully acknowledged.
Edited by: E. Wolff
References
Bard, E., Rostek, F., Turon, J.-L., and Gendreau, S.: Hydrologicalimpact of Heinrich Events in the subtropical Northeast Atlantic,Science, 289, 1321–1224, doi:10.1126/science.289.5483.1321,2000.
Berger, A. and Loutre, M. F.: Insolation values for the climate of thelast 10 million years, Quaternary Sci. Rev., 10, 297–317, 1991.
Berger, A., Loutre, M. F., and Melice, J. L.: Instability of the astro-nomical periods from 1.5 Myr BP to 0.5 Myr AP, Paleoclimates,2, 239–280, 1998.
Broecker, W. S. and Stocker, T. L.: The Holocene CO2rise: Anthropogenic or natural?, Eos Trans. AGU, 87(3), 27,doi:10.1029/2006EO030002, 2006.
Brook, E. J., Mitchell. L., Severinghaus, J., and Harder, S.: Ice corerecords of the evolution of atmospheric methane in the Holocene,Eos Trans. AGU, Fall. Meet. Suppl., Abstract U33B-02, 89(53),2008.
Burns, S. J.: Speleothem records of changes in tropical hydrologyduring the Holocene. Eos Trans. AGU, Fall. Meet. Suppl., Ab-stract U33B-03, 89(53), 2008.
Crucifix, M. and Berger, A.: How long will our interglacial be?,Eos Trans. AGU, 87(35), 355–356, doi:10.1029/2006EO350007,2006.
de Abreu, L., Abrantes, F. F., Shackleton, N. J., Tzedakis, P. C.,McManus, J. F., Oppo, D. W., and Hall, M. A.: Ocean climatevariability in the eastern North Atlantic during interglacial ma-rine isotope stage 11: A partial analogue to the Holocene? Pale-oceanography, 20, PA3009, doi:10.1029/2004PA001091, 2005.
DeFries, R. S., Field, C. B., Fung, I., Collatz, G. J., and Bounana,L.: Combining satellite data and biogeochemical models to es-timate global effects of human-induced land cover change oncarbon emissions and primary productivity, Global Biogeochem.Cy., 13, 803–815, 1999.
Dickson, A. J., Beer, C. J., Dempsey, C., Maslin, M. A., Bendle, J.A., McClymont, E. L., and Pancost, R. D.: Oceanic forcing of theMarine isotope Stage 11 interglacial, Nat. Geosci., 2, 428–433,doi:10.1038/NGEO527, 2009.
Drysdale, R. N., Hellstrom, J. C., Zanchetta, G., Fallick, A.E., Sanchez Goni, M. F., Couchoud, I., McDonald, J., Maas,R., Lohmann, G., and Isola, I.: Evidence for obliquityforcing of glacial Termination II, Science, 325, 1527–1531,doi:10.1126/science.110371, 2009.
EPICA community members: Eight glacial cycles from an Antarc-tic ice core, Nature, 429, 623–628, doi:10.1038/nature02599,2004.
Gajewski, K., Viayu, A. E., Sawada, M., Atkinson, D. E., and Fines,P.: Synchronicity in climate and vegetation transitions betweenEurope and North America during the Holocene, Clim. Change,78, 341–361, 2006.
Houghton, R. A.: The annual net flux of carbon to the atmospherefrom changes in land use 1850–1990, Tellus, Ser. B, 51, 298–313, 1999.
Indermuhle, A., , Stocker, T. F., Joos, F., Fischer H., Smith H. J.,Wahlen, M., Deck, B., Mastroianni, D., Tschumi, J., Blunier, T.,Meyer, R., and Stauffer, B.: Holocene carbon-cycle dynamicsbased on CO2 trapped in ice at Taylor Dome, Antarctica, Nature,398, 121–126, 1999.
Joos, F., Gerber, S., Prentice, I. C., Otto-Bliesner, B. L.,and Valdes, P. J.: Transient simulations of Holocene atmo-spheric carbon dioxide and terrestrial carbon since the LastGlacial Maximum, Global Biogeochem. Cy., 18, GB2002,doi:10.1029/2003GB002156, 2004.
Jouzel, J., Masson-Demotte, V., Cattani, O., Dreyfus, G., Falourd,S., Hoffmann, G., Minster, B., Nouet, J., Barnola, J. M., Chap-pellaz, J., Fischer, H., Gallet, J. C., Johnsen, S., Leuenberger, M.,Loulergue, L., Luethis, D., Oerter, H., Parrenin, F., Raisbeck, G.,Raynaud., D., Schilt, A., Schwander, J., Selmo, E., Souchez, R.,Spahni, R., Stauffer, B., Steffensen, J. P., Stenni, B., Stocker, T.F., Tison, J. L., Werner, M., and Wolff, E. W.: Orbital and mil-lennial Antarctic climate variability over the past 800 000 years,Science, 317, 793–796,doi: 10.1126/science.1141038, 2007.
Kawamura, K., Parrenin, F., Lisiecki, L., Uemura, R., Vimeux,F., Severinghaus, J. P., Hutterli, M. A., Nakazawa, T., Aoki,S., Jouzel, J., Raymo, M. E., Matsumoto, K., Nakata, H., Mo-toyama, H., Fujita, S., Goto-Azuma, K., Fujii, Y., and Watan-abe, O.: Northern Hemisphere forcing of climatic cycles inAntarctica over the past 360 000 years, Nature, 448, 912–916,doi:10.1038/nature06015, 2007.
Kawamura, K., Lisiecki, L., Raymo, M. E., Severinghaus, J. P.,Matsushima, H., Aoki, S., and Nakazawa, T.: Precession pac-ing of 100-ky climatic cycles over the last 470 ky, Geophys. Res.Abstracts, 10, EGU2008-A-10602, 2008.
Lisiecki, L. E. and Raymo, M. E.: A Pliocene-Pleistocene stack of57 globally distributed benthicδ18O records, Paleoceanography,20, PA1003, doi:10.1029/2004PA001071, 2005.
Loulergue, L., Schilt, A., Spahni, R., Masson-Delmotte, V., Blu-nier, T., Lemieux, B., Barnola, J. M., Raynaud, D., Stocker, T.F., and Chappellaz, J.: Orbital and millennial-scale features ofatmospheric CH4 over the past 800 000 years. Nature, 435, 383–386, doi:10.10138/nature06950, 2008.
Loutre M. F. and Berger A.: Future climatic changes: are we enter-ing an exceptionally long interglacial?, Clim. Change, 46, 61–90,2000.
Loutre M. F. and Berger A.: Marine Isotope Stage 11 as an analoguefor the present interglacial, Global Planet. Change, 36, 209–217,2003.
Luthi, D., Le Floch, M., Bereiter, B., Blunier, T., Barnola, J. M.,Siegenthaler, U., Raynaud, D., Jouzel, J., Fischer, H., Kawamura,K., and Stocker, T. F.: High-resolution carbon dioxide concentra-tion record 650 000–800 000 years before present, Nature, 453,379–382, 2008.
MacDonald, G. M., Beilman, D. W., Kremenetski, V., Sheng, Y.,Smith, L. C., and Velichko, A. A.: Rapid early developmentof circumarctic peatlands and atmospheric CH4 and CO2 vari-ations, Science, 314, 285–288, doi:10.1126/science.1121722,2006.
Magri, D. and Tzedakis, P. C.: Orbital signatures and long-termvegetation patterns in the Mediterranean, Quatern. Int., 73–74,69–78, 2000.
Margari, V., Tzedakis, P. C., Shackleton, N. J., and Vautravers, M.:Vegetation response in SW Iberia to abrupt climate change dur-ing MIS 6: direct land-sea comparisons, Quatern. Int., 167–168,267–268, 2007.
Masson-Delmotte, V., Dreyfus, G., Braconnot, P., Johnsen, S.,Jouzel, J., Kageyama, M., Landais, A., Loutre, M.-F., Nouet,J., Parrenin, F., Raynaud, D., Stenni, B., and Tuenter, E.: Pasttemperature reconstructions from deep ice cores: relevance forfuture climate change, Clim. Past, 2, 145–165, 2006,http://www.clim-past.net/2/145/2006/.
Naughton, F., Sanchez Goni, M. F., Desprat, S., Turon, J.-L.,Duprat, J., Malaize, B., Joli, C., Cortijo, E., Drago, T., andFreitas, M. C.: Present-day and past (last 25000 years) marinepollen signal off western Iberia, Mar. Micropaleontol., 62, 91–114, 2007.
Parrenin, F., Barnola, J.-M., Beer, J., Blunier, T., Castellano, E.,Chappellaz, J., Dreyfus, G., Fischer, H., Fujita, S., Jouzel, J.,Kawamura, K., Lemieux-Dudon, B., Loulergue, L., Masson-Delmotte, V., Narcisi, B., Petit, J.-R., Raisbeck, G., Raynaud,D., Ruth, U., Schwander, J., Severi, M., Spahni, R., Steffensen,J. P., Svensson, A., Udisti, R., Waelbroeck, C., and Wolff, E.:The EDC3 chronology for the EPICA Dome C ice core, Clim.Past, 3, 485–497, 2007,http://www.clim-past.net/3/485/2007/.
Rohling, E. J. and Palike, H.: Centennial-scale climate cooling witha sudden cold event around 8200 years ago, Nature, 434, 975–979, 2005.
Rohling, E. J., Braun, K., Grant, K., Kucera, M., Roberts, A. P., Sid-dall, M., and Trommer, G.: Comparison between Holocene andMarine Isotope Stage-11 sea-level histories, Earth Planet. Sci.Lett., 291, 97–105, 2010.
Roucoux, K. H., Tzedakis, P. C., de Abreu, L., and Shackleton, N.J.: Climate and vegetation changes 180000 to 345000 years agorecorded in a deep-sea core off Portugal, Earth Planet. Sci. Lett.,249, 307–325, 2006.
Ruddiman, W. F.: The anthropogenic greenhouse era began thou-sands of years ago, Clim. Change, 61, 261–293, 2003.
Ruddiman, W. F.: Cold climate during the closest stage 11 analog torecent millennia, Quaternary. Sci. Rev., 24, 1111–1121, 2005a.
Ruddiman, W. F.: Comment on “A note on the relationshipbetween ice core methane concentrations and insolation” byG. A. Schmidt et al., Geophys. Res. Lett., 32, L15703,doi:10.1029/2005GL022599, 2005b.
Ruddiman, W. F.: The early anthropogenic hypothesis:Challenges and responses, Rev. Geophys., 45, RG4001,doi:10.1029/2006RG000207, 2007.
Ruddiman, W. F., Guo, Z., Zhou, X., Wu, H., and Yu, Y.: Early ricefarming and anomalous methane trends, Quaternay Sci. Rev., 27,1291–1295, 2008.
Ruddiman, W. F.: Interactive comment on “The MIS 11 – MIS1 analogy, southern European vegetation, atmospheric methaneand the early “ anthropogenic hypothesis” by P. C. Tzedakis,Clim. Past Discuss., 5, C309–C310, 2009.
Sanchez Goni, M. F., Eynaud, F., Turon, J.-L., and Shackleton,N. J.: High resolution palynological record off the Iberian mar-gin: direct land-sea correlation for the Last Interglacial complex,Earth Planet. Sci. Lett., 171, 123–137, 1999.
Schmidt, G. A., Schindell, D. T., and Harder, S.: A note on the rela-tionship between ice core methane concentrations and insolation,Geophys. Res. Lett., 31, L23206, doi:10.1029/2004GL021083,2004.
Shackleton, N. J., Hall, M. A., and Vincent, E.: Phase relationshipsbetween millennial scale events 64000 to 24000 years ago, Pale-oceanography, 15, 565–569, 2000.
Shackleton, N. J., Chapman, M., Sanchez-Goni, M. F., Pailler, D.,and Lancelot, Y.: The Classic Marine Isotope Substage 5e, Qua-ternat Res., 58, 14–16, 2002.
Smith, L. C., MacDonald, G. M., Velichko, A. A., Beilman,D. W., Borisova, O. K., Frey, K. E., Krementski, K. V., andSheng, Y.: Siberian peatlands a net carbon sink and globalmethane source since the early Holocene, Science, 303, 353–356, doi:10.1126/science.1090553, 2004.
Turon, J.-L., Lezine, A.-M., and Denefle, M.: Land–sea correla-tions for the last deglaciation inferred from a pollen and dinocystrecord from the Portuguese margin, Quaternary Res., 59, 88–96,2003.
Tzedakis, P. C.: Seven ambiguities in the Mediterranean palaeoen-vironmental narrative, Quaternay Sci. Rev., 26, 2042–2066,2007.
Tzedakis, P. C., Roucoux, K. H., de Abreu, L., and Shackle-ton, N. J.: The duration of forest stages in southern Europeand interglacial climate variability, Science, 306, 2231–2235,doi:10.1126/science.1102398, 2004.
Tzedakis, P. C., Hooghiemstra, H., and Palike, H.: The last 1.35million years at Tenaghi Philippon: revised chronostratigraphyand long-term vegetation trends, Quaternary Sci. Rev., 25, 3416–3430, 2006.
Tzedakis, P. C., Palike, H., Roucoux, K. H., and de Abreu, L.: At-mospheric methane, southern European vegetation and low-midlatitude links on orbital and millennial timescales, Earth Planet.Sci. Lett., 277, 307–317, 2009.
van der Knaap, W. O. and van Leeuwen, J. F. N.: Holocenevegetation succession and degradation as responses to climaticchange and human activity in the Serra de Estrela, Portugal, Rev.Palaeobot. Palyno., 89, 153–211, 1995.
van der Knaap, W. O. and van Leeuwen, J. F. N.: Late Glacial andearly Holocene vegetation succession, altitudinal zonation, andclimatic change in the Serra da Estrela, Portugal, Rev. Palaeobot.Palyno., 97, 239–285, 1997.
van der Wiel, A. M. and Wijmstra, T. A.: Palynology of the lowerpart (78-120 m) of the core Tenaghi Philippon II, Middle Pleis-tocene of Macedonia, Greece, Rev. Palaeobot. Palyno., 52, 73–88, 1987a.
van der Wiel, A. M, and Wijmstra, T. A.: Palynology of 112.8–197.8 m interval of the core Tenaghi Philippon III, Middle Pleis-tocene of Macedonia, Rev. Palaeobot. Palyno., 52, 89–117,1987b.
Wijmstra, T. A.: Palynology of the first 30 metres of a 120 m deepsection in northern Greece, Acta Bot. Neerl., 18, 511–527, 1969.
Wijmstra, T. A. and Smit, A.: Palynology of the middle part (30–78 metres) of the 120 m deep section in northern Greece (Mace-donia), Acta Bot. Neerl., 25, 297–312, 1976.
Wijmstra, T. A. and Groenhart, M. C.: Record of 700,00 years veg-etational history in Eastern Macedonia (Greece), Revista de laAcademia Colombiana Ciencias Exactas, Fısicas y Naturales, 15,87–98, 1983.