50
The Most Important Policy Conversation This Year: TAXES Ecumenical Advocacy Days 2013
| Date post: | 25-May-2018 |
| Category: |
Documents |
| Upload: | nguyentruc |
| View: | 213 times |
| Download: | 0 times |
The Most Important Policy Conversation This Year:
TAXES
Ecumenical Advocacy Days 2013

Meet Our Panel
Ellen Nissenbaum, Center on Budget and Policy Priorities
Edie Rasell, United Church of Christ
Gideon Bragin, Office of Senator Sherrod Brown
Center on Budget and Policy Priorities
cbpp.org
ECUMENICAL ADVOCACY DAYS
TAX WORKSHOP
Ellen Nissenbaum, SVP, Gov’t Affairs
www.cbpp.org
April 7, 2013

Center on Budget and Policy Priorities
cbpp.org
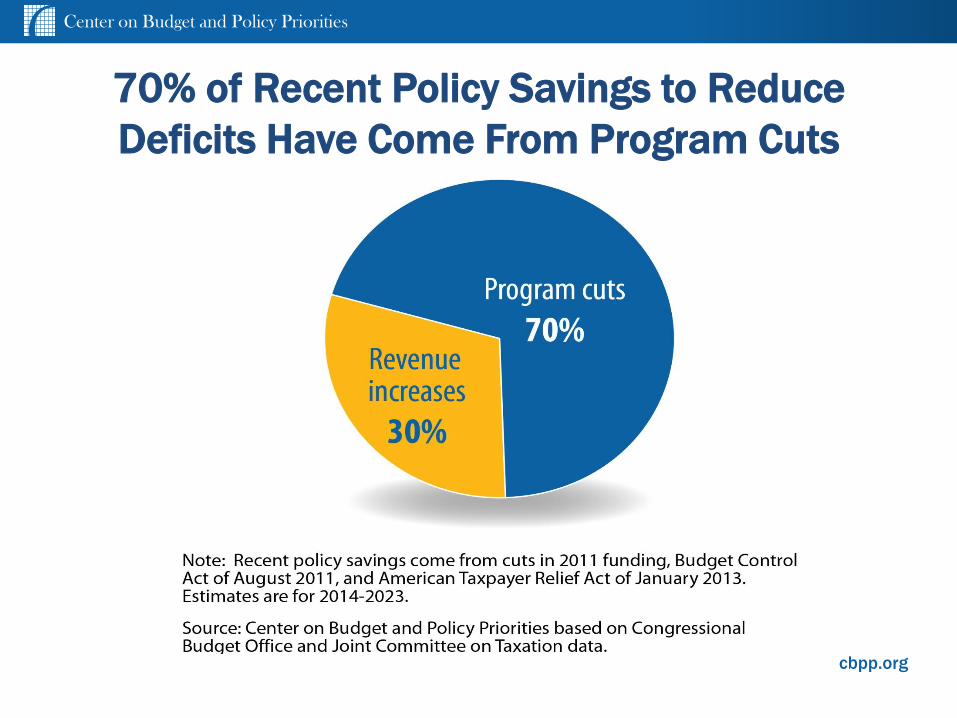
Deficit Reduction Achieved So Far
$2.75 trillion in deficit reduction enacted since 2010 (not including sequestration cuts) – for the years 2014-2023
$1.6 trillion in spending largely from discretionary
$0.7 trillion in revenues
$0.45 trillion in interest
$1.5 trillion more deficit reduction would stabilize the debt over coming decade ($1.3 trillion in policy changes, and $0.2 trillion in interest)
Center on Budget and Policy Priorities
cbpp.org
70% of Recent Policy Savings to Reduce
Deficits Have Come From Program Cuts

Center on Budget and Policy Priorities
cbpp.org
Non-defense Discretionary Funding (% of GDP, 1976-2022) “Roadmap for disinvestment”
Source: Center on Budget and Policy Priorities based on Office of Management and Budget and Congressional
Budget Office data.

Center on Budget and Policy Priorities
cbpp.org

Center on Budget and Policy Priorities
cbpp.org
Number of U.S. Households Living Below World Bank Measure of Serious Poverty in
Developing Nations:
Living on Less Than $2 a Day, Per Person
Cash Income Cash Income plus SNAP
1996 636,000 households with 1.4 million children
475,000 households with 975,000 children
Start of 2011 1.46 million households with 2.8 million children
800,000 households with 1.4 million children
4/9/201
3
Source: Shaefer and Edin, “Extreme Poverty in the United States,”
1996 to 2011. 8

Center on Budget and Policy Priorities
cbpp.org
Making The Case For Revenues
• Demographics coupled with rising health care costs
• Need for more investments/jobs
• Need to replace the entire sequester,
• Need to get our deficit under control – without increasing poverty or income inequality.
Center on Budget and Policy Priorities
cbpp.org
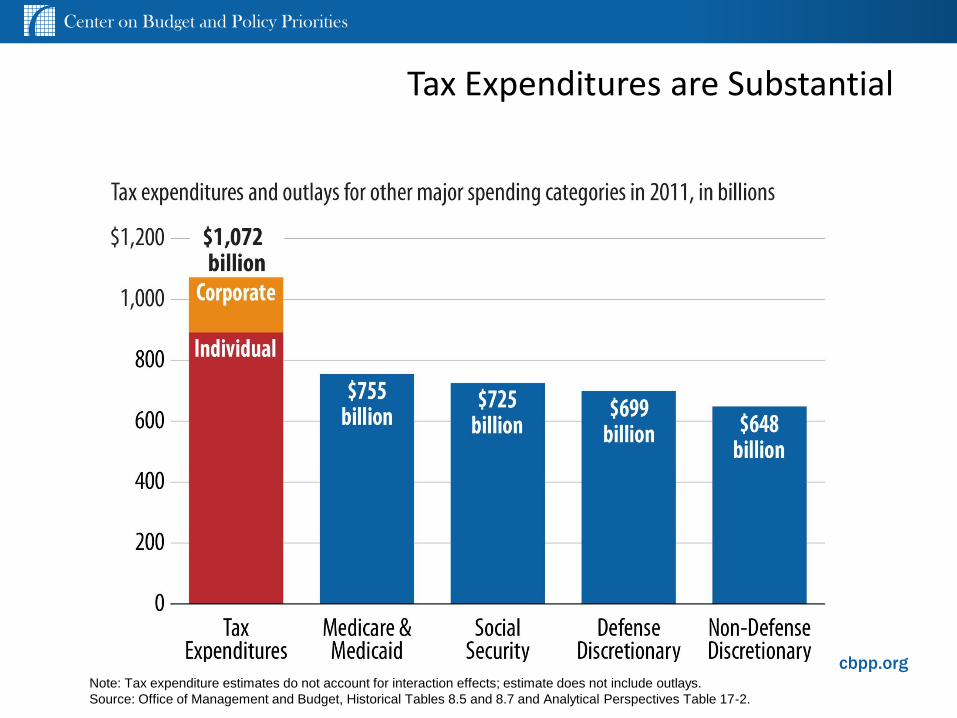
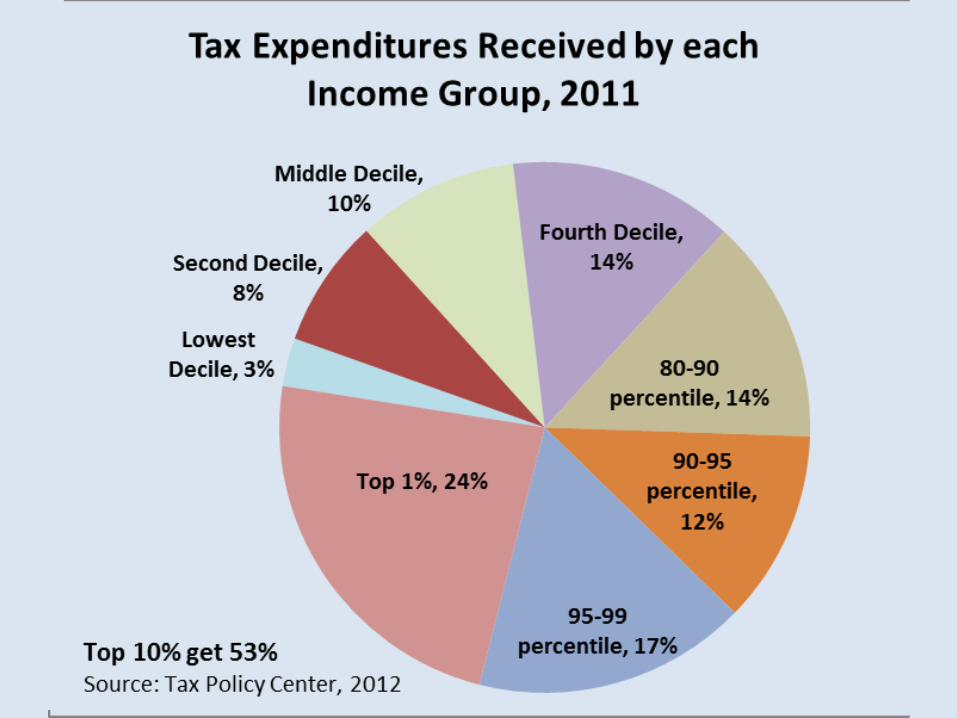
Tax Expenditures are Substantial
Note: Tax expenditure estimates do not account for interaction effects; estimate does not include outlays.
Source: Office of Management and Budget, Historical Tables 8.5 and 8.7 and Analytical Perspectives Table 17-2.
Center on Budget and Policy Priorities
cbpp.org
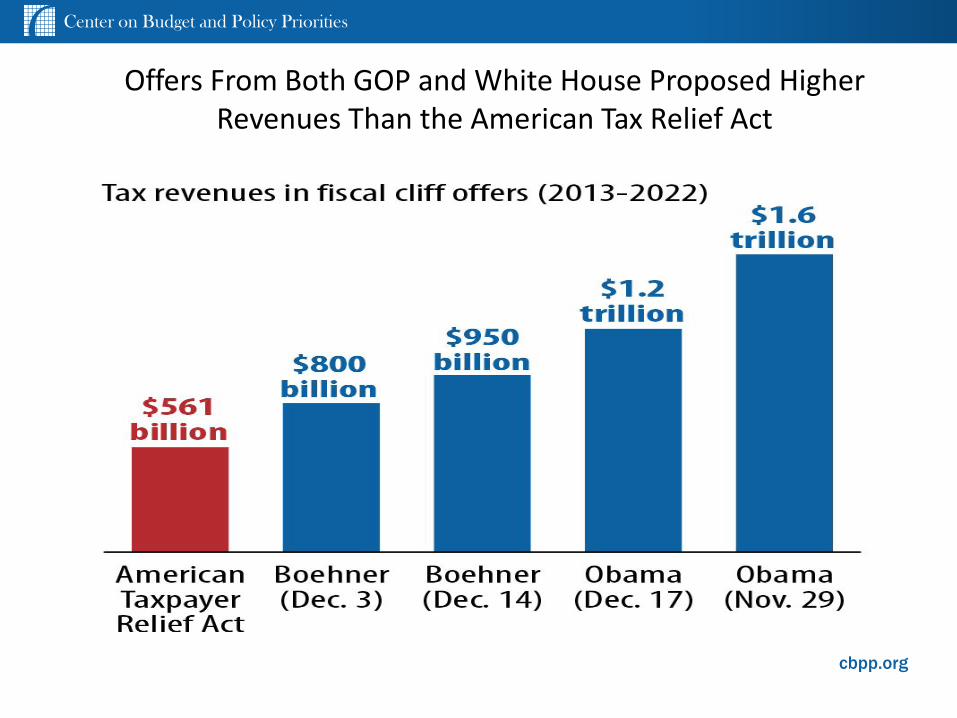
Offers From Both GOP and White House Proposed Higher Revenues Than the American Tax Relief Act

Center on Budget and Policy Priorities
cbpp.org
The EITC Improves Low-Income Children’s Health
and School Performance
• Newborns are more likely experience improvements in a number of
birth indicators, such as reductions in low weight births and
premature birth.
• Additional income from the EITC and CTC leads to significant
increases in students’ test scores
• Test score improvements are even larger for more disadvantaged
children
12

Center on Budget and Policy Priorities
cbpp.org
13

Center on Budget and Policy Priorities
cbpp.org
EITC was the single biggest factor in boosting
employment among single mothers
14

Center on Budget and Policy Priorities
cbpp.org
REFUNDABLE TAX CREDITS:
Threats and Opportunities
• These credits lift more children out of poverty than any other
program and help support millions of low-income working families.
• Improvements made in ARRA (2009) were extended only five years
in the December “fiscal cliff deal.” Make the improvements
permanent in tax reform.
• Possible threat: proposals to cut the credits and provide less to
these families (e.g. scaling back refundability)
• Tax Committees’ deliberations now
15

Center on Budget and Policy Priorities
cbpp.org
Refundable federal credits lift millions of families
out of poverty
16

Center on Budget and Policy Priorities
cbpp.org
Core Principles for Deficit Reduction
• Any further budget/deficit deals should reflect that about 70% of the deficit reduction to date has come from spending cuts.
• Accordingly, any further deficit reduction—including cancellation of sequestration—must include significant new revenues
• Don’t increase poverty or income inequality
• No further cuts in non-defense discretionary funding
• Don’t shift costs to states, especially in Medicaid
• Must address need for jobs and stronger economic growth

Taxes 101 Much of what you need to know about taxes to be
an excellent advocate for tax reform
Ecumenical Advocacy Days 2013
Edie Rasell
Minister for Economic Justice, United Church of Christ [email protected]
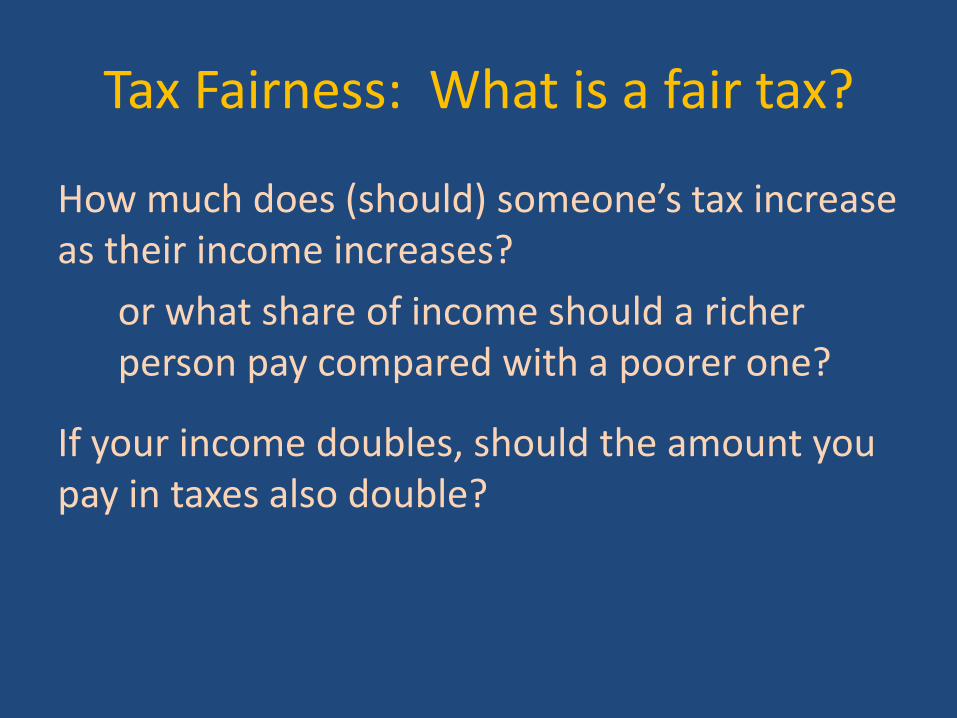
Tax Fairness: What is a fair tax?
How much does (should) someone’s tax increase as their income increases?
or what share of income should a richer person pay compared with a poorer one?
If your income doubles, should the amount you pay in taxes also double?

Progressive Taxes
A progressive tax: the share of income someone pays in tax rises as their income rises.
Income = $1000, tax is $100 (10%)
Income = $2,000, tax is not $200 (10%)
but $220 (11%)

Why are Progressive Taxes Fair?
• People with more money who can afford to pay more tax should do so. Poorer people cannot afford to pay more.
• People are able to make money due to their own efforts but, most of all, due to the efforts of others. – Social stock of knowledge: education, health care, the
technological innovations made and paid for by others, roads, communications tools, etc.
– Richer people have benefited and need to pay back to society.
• Paul: “a fair balance between your present abundance and their need” and “the one who had much did not have too much, and the one who had little did not have too little” (2 Corinthians 8:13-15)
See Unjust Deserts by Gar Alperovitz and Lew Daly

Of all our taxes which is the most progressive?

Which of the following is the most progressive tax?
• Federal income tax
• State income tax
• Sales tax
• Payroll tax
– Social Security: 6.2% paid by employers and employees on wages and salaries up to $113,700
– Medicare: 1.45% paid on all wages and salaries by employers/employees


Who Doesn’t Pay Federal Income Taxes?
• 47% paid no federal income tax in 2011.
• Of those, nearly two-thirds paid payroll taxes.
• So just 1/3 of 47%, some 17% of households, paid no federal taxes (although they probably paid state and/or local taxes.
• Of these 17%:
– 10 % were elderly
– 7% were non-elderly with income below $20,000
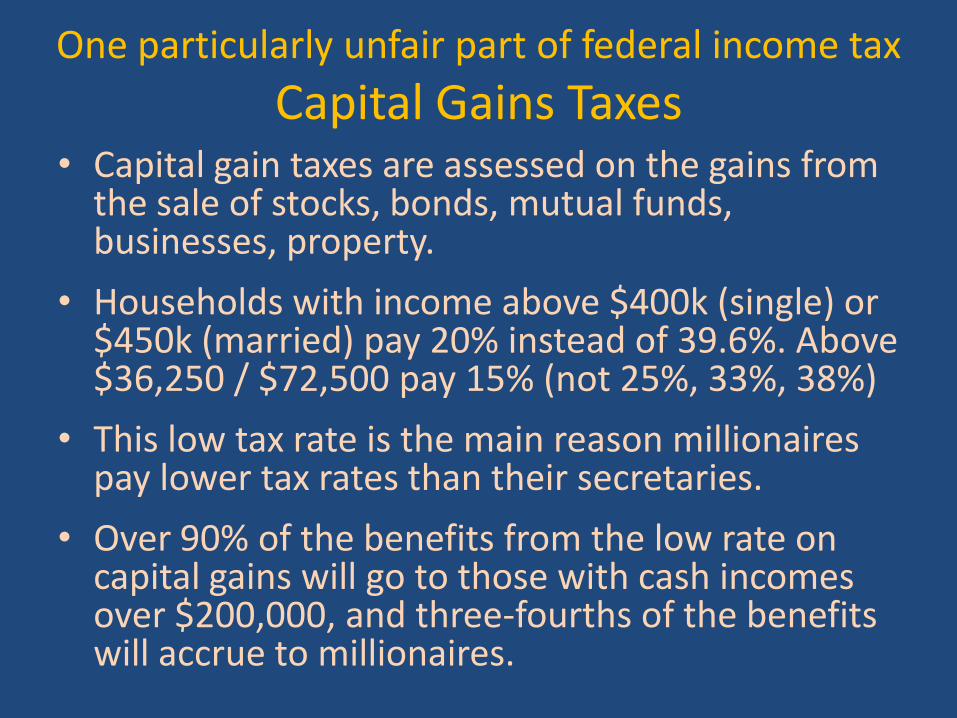
One particularly unfair part of federal income tax
Capital Gains Taxes • Capital gain taxes are assessed on the gains from
the sale of stocks, bonds, mutual funds, businesses, property.
• Households with income above $400k (single) or $450k (married) pay 20% instead of 39.6%. Above $36,250 / $72,500 pay 15% (not 25%, 33%, 38%)
• This low tax rate is the main reason millionaires pay lower tax rates than their secretaries.
• Over 90% of the benefits from the low rate on capital gains will go to those with cash incomes over $200,000, and three-fourths of the benefits will accrue to millionaires.
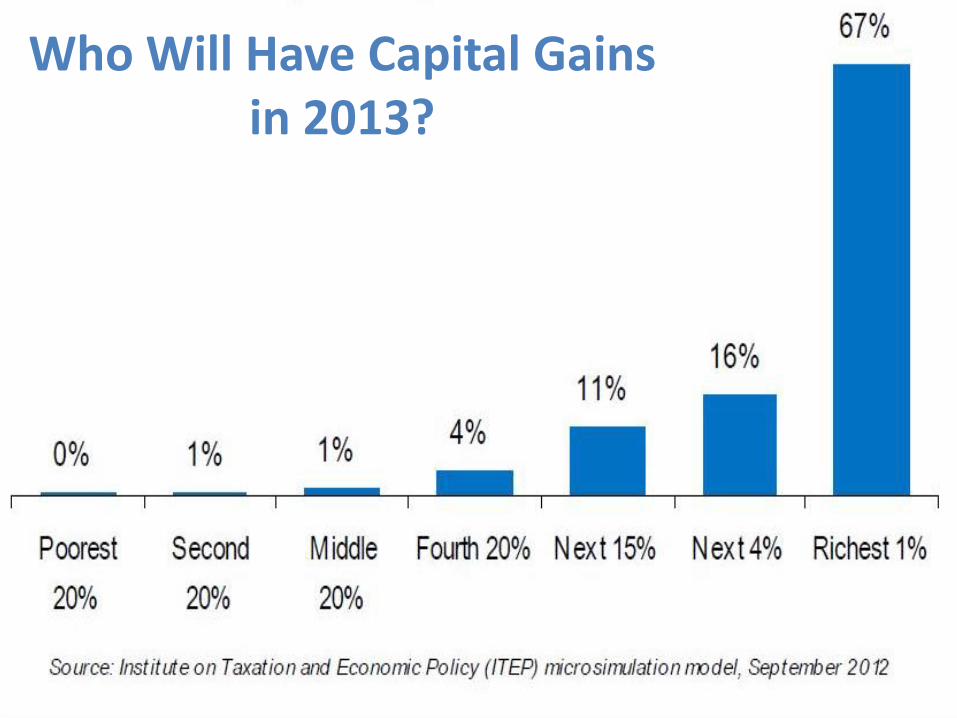
Who Will Have Capital Gains in 2013? Who Will Have Capital Gains in 2013?


State & Local Taxes, 2010
Source: Citizens for Tax Justice

State & Local Taxes
• Rely less on progressive personal income taxes. The income tax rate is often fairly “flat” with little difference between the rates for rich and poor
• Rely heavily on sales taxes (same % for everyone) that are assessed on goods (physical objects) not services like haircuts, tickets to events, health care, education, legal and financial services, etc.
• Wealthier households buy more services and save more money so pay less sales tax than poorer ones.
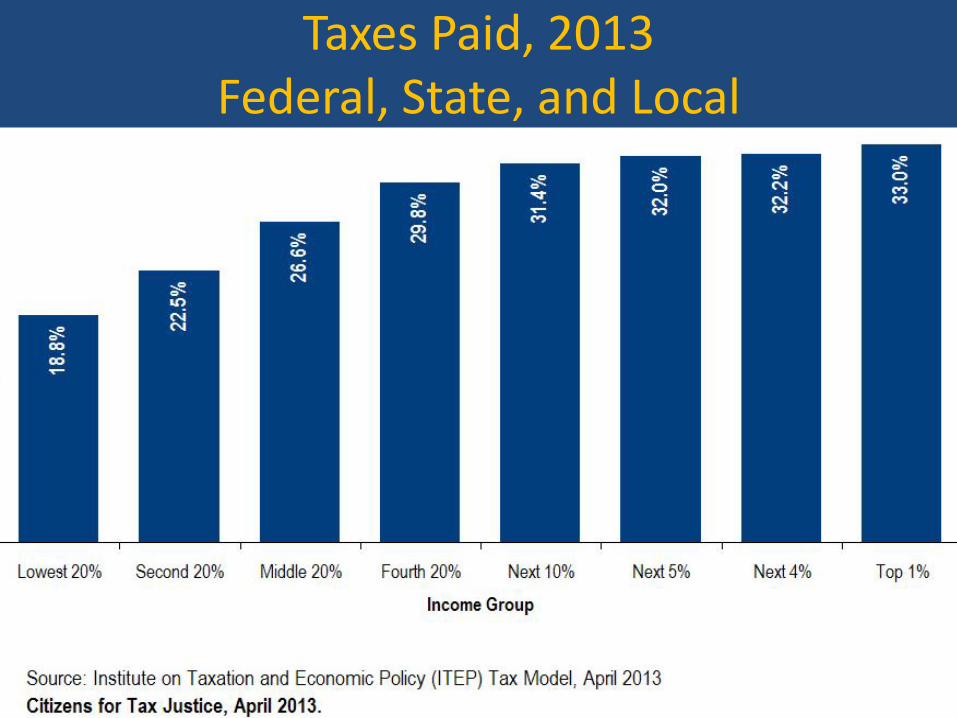
Taxes Paid, 2013 Federal, State, and Local
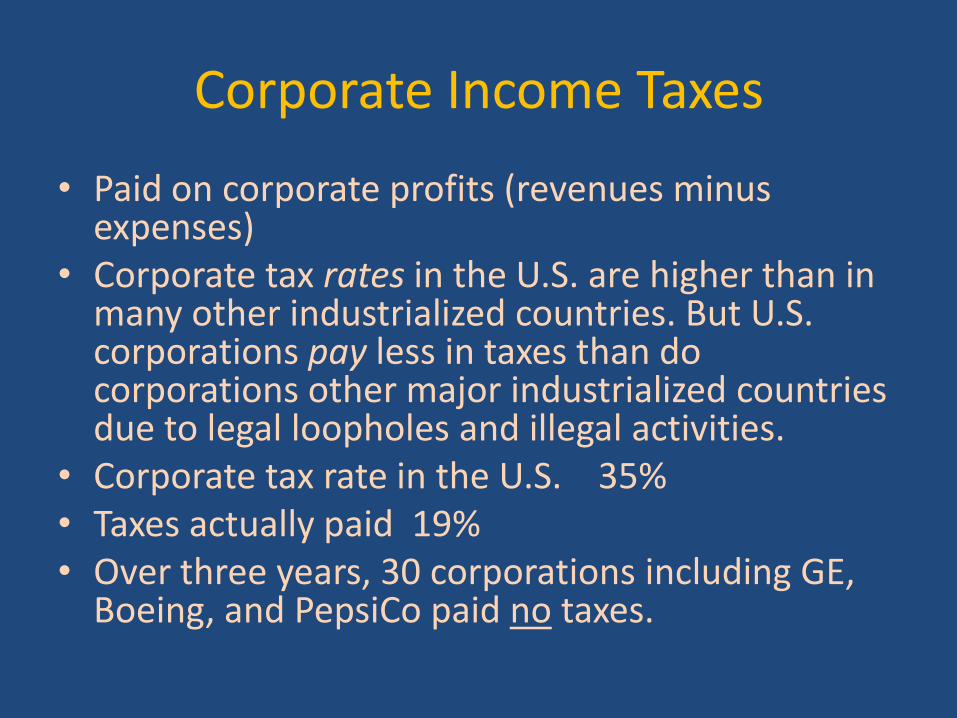
Corporate Income Taxes
• Paid on corporate profits (revenues minus expenses)
• Corporate tax rates in the U.S. are higher than in many other industrialized countries. But U.S. corporations pay less in taxes than do corporations other major industrialized countries due to legal loopholes and illegal activities.
• Corporate tax rate in the U.S. 35% • Taxes actually paid 19% • Over three years, 30 corporations including GE,
Boeing, and PepsiCo paid no taxes.


How Corporations Pay No or Few Taxes
Many loopholes, legal and illegal.
• Shift profits to low-tax foreign jurisdictions (tax havens)
83 of the 100 largest publicly-traded U.S. corporations have subsidiaries in tax havens. ExxonMobil (32), Citigroup (427)
• U.S. taxes profits earned abroad only after they are brought back to the U.S. So corporations have a financial incentive to build plants and create jobs in other countries, or to make their business appear to take place abroad.
• Estimates of taxes lost: $100 billion per year or more.
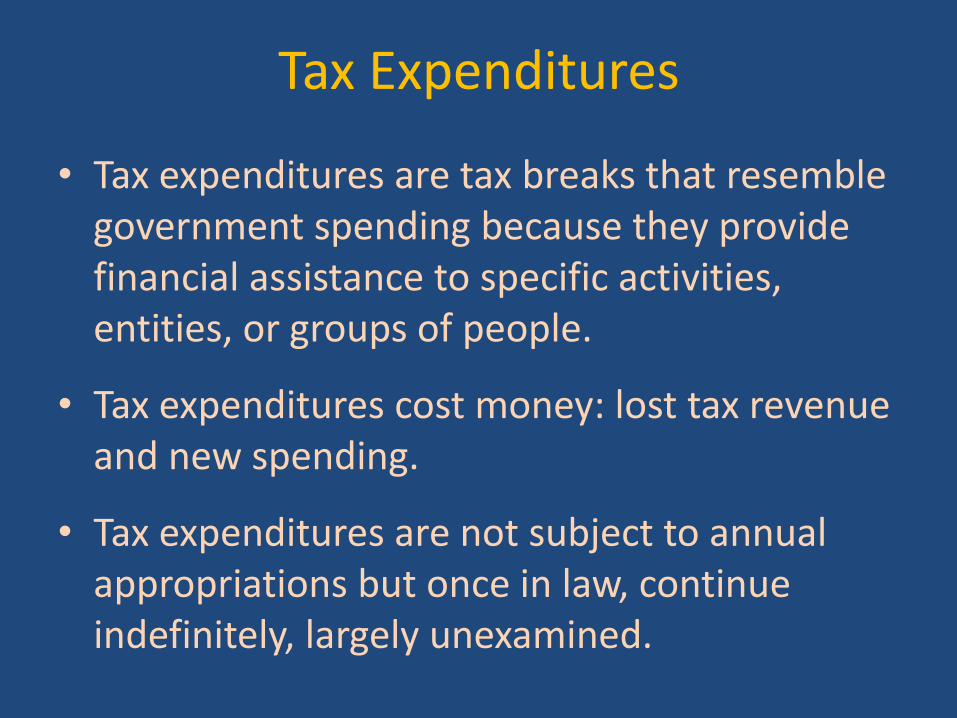
Tax Expenditures
• Tax expenditures are tax breaks that resemble government spending because they provide financial assistance to specific activities, entities, or groups of people.
• Tax expenditures cost money: lost tax revenue and new spending.
• Tax expenditures are not subject to annual appropriations but once in law, continue indefinitely, largely unexamined.

Top 6 Examples of Tax Expenditures and Cost in 2013
• Exclusion of employer contributions for health insurance premiums $180 billion
• Mortgage interest deduction $101 billion
• Deductions for contributions to retirement plans $73 billion
• Capital gains tax reduction $62 billion
• Deduction of state and local taxes $46 billion
• Accelerated depreciation for machinery and equipment $33 billion
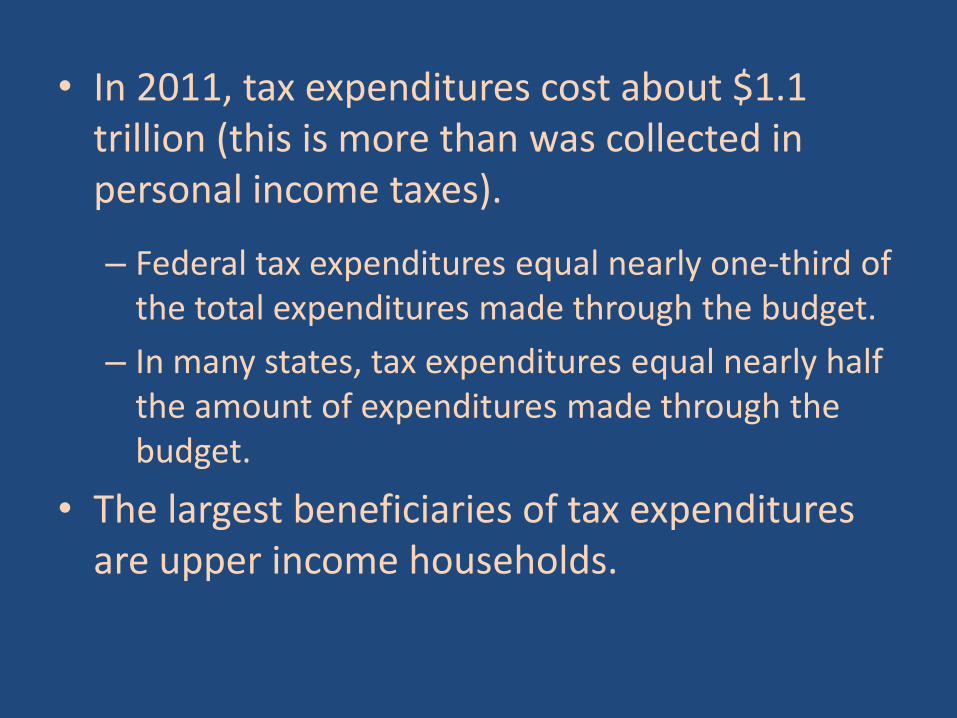
• In 2011, tax expenditures cost about $1.1 trillion (this is more than was collected in personal income taxes).
– Federal tax expenditures equal nearly one-third of the total expenditures made through the budget.
– In many states, tax expenditures equal nearly half the amount of expenditures made through the budget.
• The largest beneficiaries of tax expenditures are upper income households.

Overview of Tax Reform
Gideon Bragin, Office of Senator Sherrod Brown


Employer Provided Health Benefits and Deduction for Self-Employed
46%
35%
19%
0%
5%
10%
15%
20%
25%
30%
35%
40%
45%
50%
Below $100K $100K - $200K $200K & Up
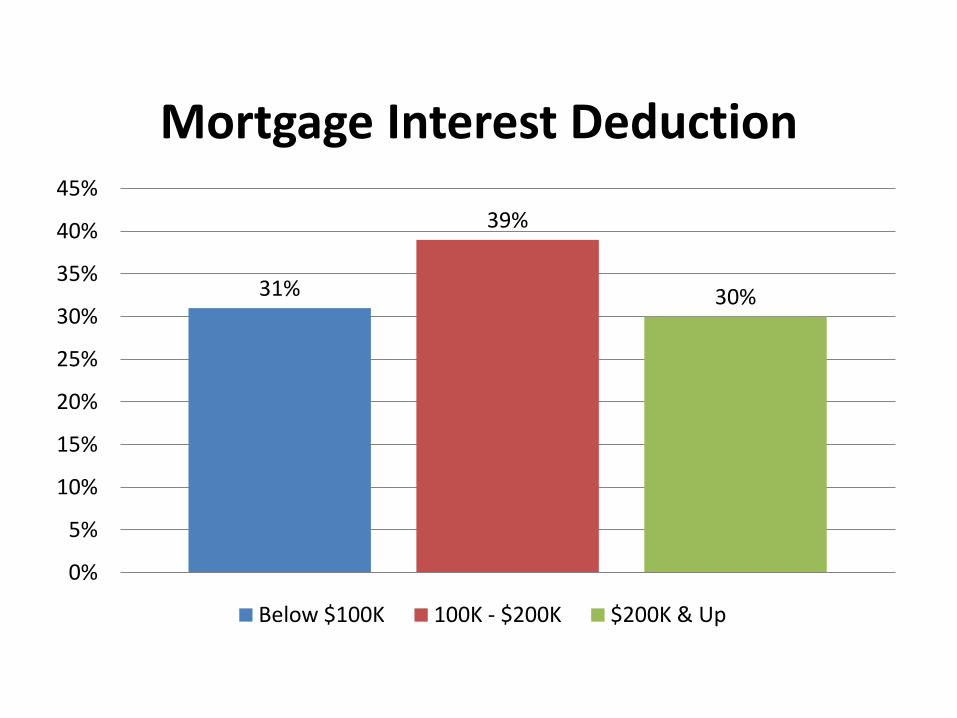
Mortgage Interest Deduction
31%
39%
30%
0%
5%
10%
15%
20%
25%
30%
35%
40%
45%
Below $100K 100K - $200K $200K & Up

State and Local Income, Sales, and Personal Property Tax Deductions
19%
31%
50%
0%
10%
20%
30%
40%
50%
60%
Below $100K $100K - $200K $200K & Up

Charitable Contributions Deduction
19%
26%
55%
0%
10%
20%
30%
40%
50%
60%
Below $100K $100K - $200K $200K & Up
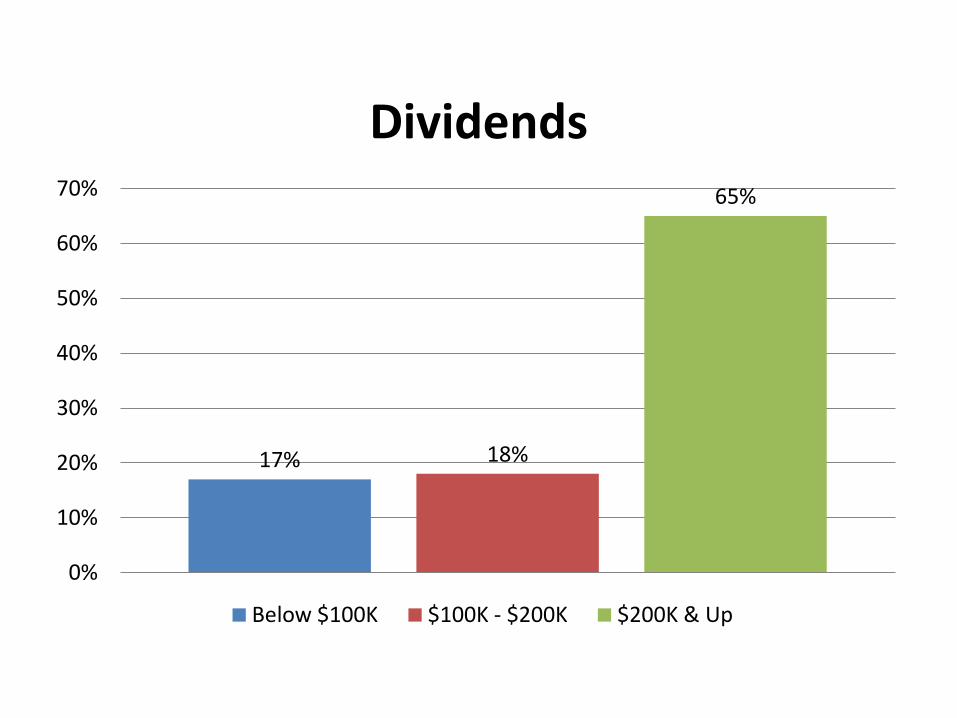
Dividends
17% 18%
65%
0%
10%
20%
30%
40%
50%
60%
70%
Below $100K $100K - $200K $200K & Up
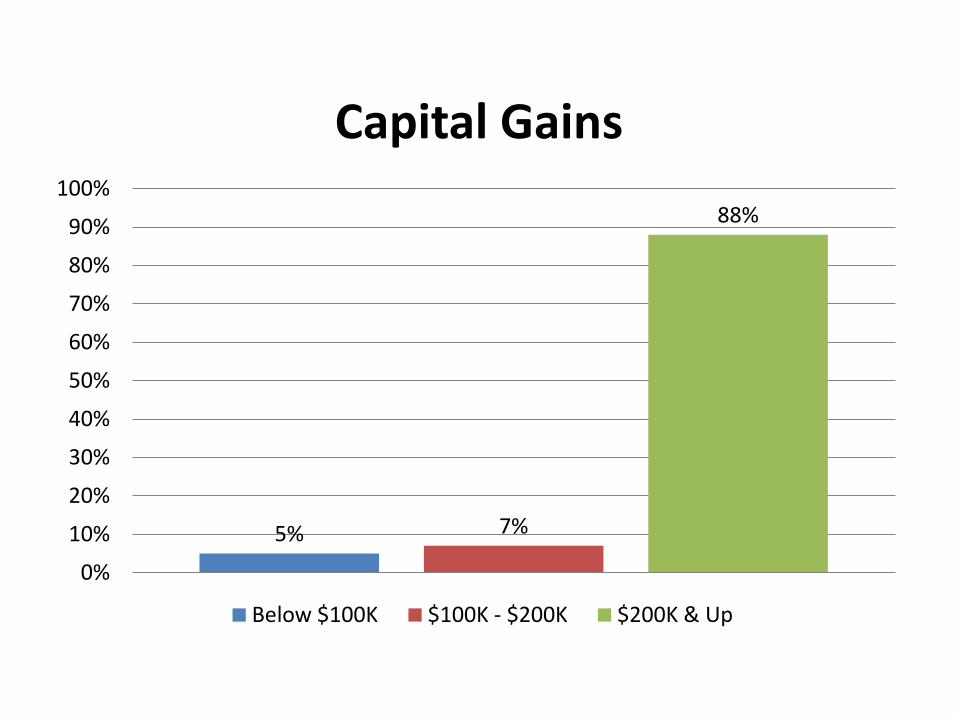
Capital Gains
5% 7%
88%
0%
10%
20%
30%
40%
50%
60%
70%
80%
90%
100%
Below $100K $100K - $200K $200K & Up
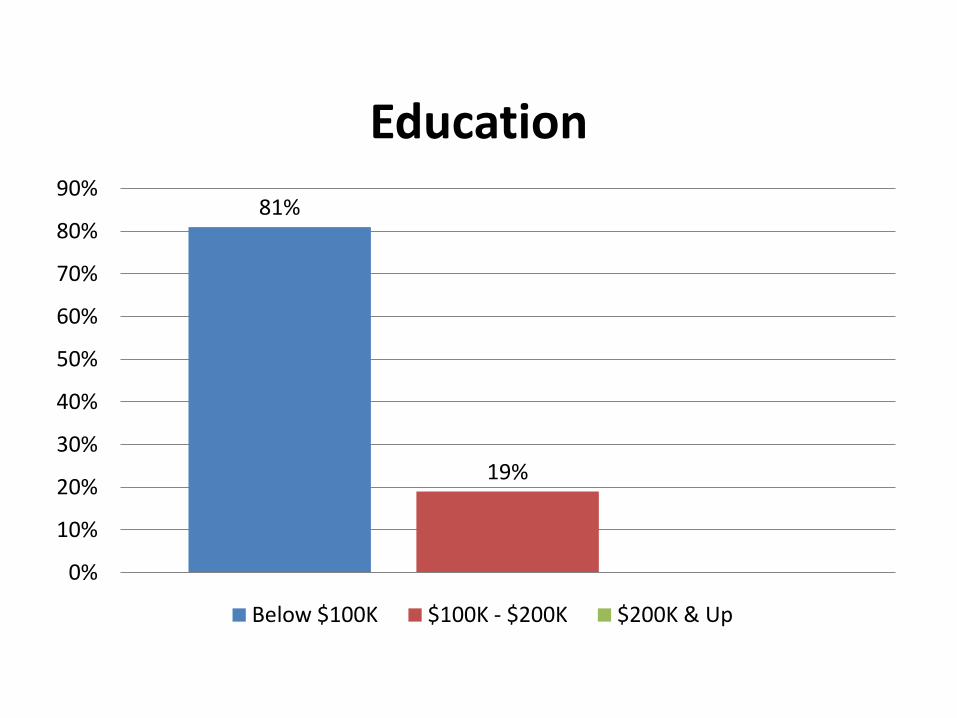
Education
81%
19%
0%
10%
20%
30%
40%
50%
60%
70%
80%
90%
Below $100K $100K - $200K $200K & Up

Child Tax Credit
90%
10%
0%
10%
20%
30%
40%
50%
60%
70%
80%
90%
100%
Below $100K $100K - $200K $200K & Up

Earned Income Tax Credit
100%
0%
20%
40%
60%
80%
100%
120%
Below $100K $100K - $200K $200K & Up

Goals for Tax Reform
Increase Progressivity of the Code
1. Eliminate or Reform Regressive Expenditures 2. Make the ‘09 Enhancements Permanent and
Expand Refundable Credits
Raise Revenue to Reduce the Deficit and Protect the Safety Net
1. Raise Taxes on Passive Income 2. Look at Business Loopholes for Revenue


