26
The Most Taxing The Most Taxing Questions or We Questions or We Depreciate You Depreciate You ©2004 Dr. B. C. Paul ©2004 Dr. B. C. Paul
| Date post: | 27-Dec-2015 |
| Category: |
Documents |
| Upload: | jennifer-lloyd |
| View: | 215 times |
| Download: | 1 times |

The Most Taxing The Most Taxing Questions or We Questions or We Depreciate YouDepreciate You©2004 Dr. B. C. Paul©2004 Dr. B. C. Paul

Conventions on Conventions on Spreading CostSpreading Cost
We already met Depreciation with We already met Depreciation with Earnest and Crader MiningEarnest and Crader Mining Method was called “Straight Line”Method was called “Straight Line” Starts with a “Cost Basis” what the asset Starts with a “Cost Basis” what the asset
originally costoriginally cost Trucks cost $700,000 and lasted 7 yearsTrucks cost $700,000 and lasted 7 years
Calculation isCalculation is $700,000/7 = $100,000$700,000/7 = $100,000 Cost Basis/ Life = Annual DepreciationCost Basis/ Life = Annual Depreciation
Plot ThickensPlot Thickens
Some assets may have a salvage value Some assets may have a salvage value at discardat discard
Straight Line is actuallyStraight Line is actually (Cost Basis – Salvage)/ Life = Depreciation(Cost Basis – Salvage)/ Life = Depreciation Example before treated the salvage value as Example before treated the salvage value as
00 This assumption is common for tax calculationsThis assumption is common for tax calculations
Problem of Real BehaviorProblem of Real Behavior
Auto illustrationAuto illustration Typical new car in $24,000 rangeTypical new car in $24,000 range Drops in value about $4,000 when drives off Drops in value about $4,000 when drives off
lotlot Drops in value rapidly at first (at age 5 or 6 it Drops in value rapidly at first (at age 5 or 6 it
may be only worth $4,000 or $5,000)may be only worth $4,000 or $5,000) Loss of market value slows downLoss of market value slows down
At 10 years may be worth $2,500At 10 years may be worth $2,500

The Gap ProblemThe Gap Problem
Most people buy cars on creditMost people buy cars on credit Auto pay-off may be linear with simple interestAuto pay-off may be linear with simple interest Will be slow at first with compound interest loanWill be slow at first with compound interest loan
Market value of car is dropping faster than your Market value of car is dropping faster than your debtdebt What happens if you get hit by a semi pulling off car What happens if you get hit by a semi pulling off car
lot and have a vehicle worth $20,000, but you owe lot and have a vehicle worth $20,000, but you owe $24,000$24,000
Insurance pays you what vehicle is worth and Insurance pays you what vehicle is worth and leaves you holding bag with the loanleaves you holding bag with the loan Gaps of $10,000 are not uncommon (insurance often uses Gaps of $10,000 are not uncommon (insurance often uses
low value estimates on wholesale used car market while low value estimates on wholesale used car market while you bought the car retail)you bought the car retail)

SolutionsSolutions
Some insurance offers replacement cost Some insurance offers replacement cost for first few yearsfor first few years But only if accident is your fault and covered But only if accident is your fault and covered
under comprehensiveunder comprehensive If other guys fault his insurance still try low If other guys fault his insurance still try low
wholesale market valuewholesale market value
Gap InsuranceGap Insurance Difference between market and loanDifference between market and loan

Back to DepreciationBack to Depreciation
Gap problem can occur for tax purposes if Gap problem can occur for tax purposes if government forces you to spread out cost in a government forces you to spread out cost in a manner that does not reflect loss of valuemanner that does not reflect loss of value
Need for method that depreciates fast at first Need for method that depreciates fast at first and then slows downand then slows down
Two methods commonly meet requirementTwo methods commonly meet requirement Sum of Years DigitsSum of Years Digits Declining BalanceDeclining Balance

Sum of Years DigitsSum of Years Digits
(Basis – Salvage) * Factor(Basis – Salvage) * Factor Factor = (N – t + 1)/(SOYD)Factor = (N – t + 1)/(SOYD)
N= number years depreciable lifeN= number years depreciable life t = the current year for example depreciation in year t = the current year for example depreciation in year
three would have t = 3three would have t = 3 SOYD = Sum of Years DigitsSOYD = Sum of Years Digits
If life is 5 years thenIf life is 5 years then SOYD = 5 + 4 + 3 + 2 + 1 = 15SOYD = 5 + 4 + 3 + 2 + 1 = 15
There is a formula to save you undignified countingThere is a formula to save you undignified counting N * (N+1)/2 = SOYDN * (N+1)/2 = SOYD

ApplicationApplication
If Earnest Depreciated his truck by SOYDIf Earnest Depreciated his truck by SOYD Basis = $700,000 (assume no salvage)Basis = $700,000 (assume no salvage) Factor 1 =(7 – 1 + 1)/ ((7/2)*(7+1)) = 0.25Factor 1 =(7 – 1 + 1)/ ((7/2)*(7+1)) = 0.25 Depreciation Year 1 = $700,000*0.25= $175,000Depreciation Year 1 = $700,000*0.25= $175,000 Year 2 6/28*$700,000 = $150,000Year 2 6/28*$700,000 = $150,000 Year 3 5/28*$700,000 = $125,000Year 3 5/28*$700,000 = $125,000 Year 4 4/28*$700,000 = $100,000Year 4 4/28*$700,000 = $100,000 Year 5 3/28*$700,000 = $75,000Year 5 3/28*$700,000 = $75,000 Year 6 2/28*$700,000 = $50,000Year 6 2/28*$700,000 = $50,000 Year 7 1/28*$700,000 = $25,000Year 7 1/28*$700,000 = $25,000

Declining Balance Declining Balance MethodsMethods
Need one more term – Book ValueNeed one more term – Book Value Book Value = (Cost Basis – Salvage – Depreciation Book Value = (Cost Basis – Salvage – Depreciation
Taken to Date)Taken to Date) Annual Depreciation = Book Value * Dbalance Annual Depreciation = Book Value * Dbalance
factorfactor Dbalance factor = (% rate)/(100*N) where N is Dbalance factor = (% rate)/(100*N) where N is
the life of the itemthe life of the item Percentage rate is any ratio of initial depreciation to Percentage rate is any ratio of initial depreciation to
straight line that is desiredstraight line that is desired Ie the system has infinite adaptationsIe the system has infinite adaptations In practice 150% and 200% are historical conventionsIn practice 150% and 200% are historical conventions
Lets Do Earnest’s Truck Lets Do Earnest’s Truck with 150% Declining with 150% Declining BalanceBalance
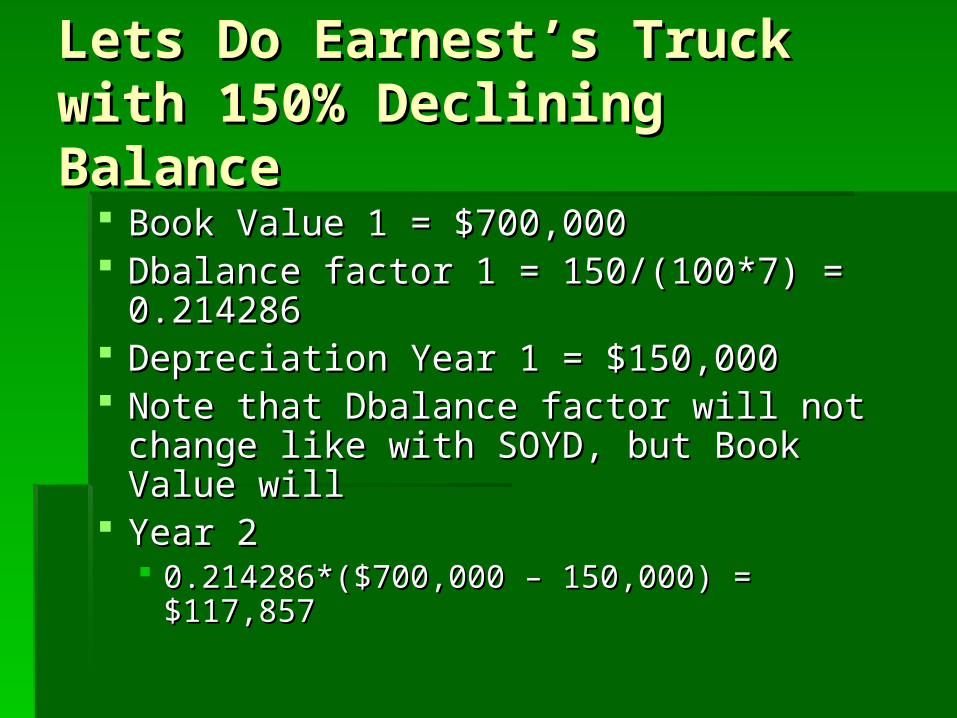
Book Value 1 = $700,000Book Value 1 = $700,000 Dbalance factor 1 = 150/(100*7) = Dbalance factor 1 = 150/(100*7) =
0.2142860.214286 Depreciation Year 1 = $150,000Depreciation Year 1 = $150,000 Note that Dbalance factor will not change Note that Dbalance factor will not change
like with SOYD, but Book Value willlike with SOYD, but Book Value will Year 2Year 2
0.214286*($700,000 – 150,000) = $117,8570.214286*($700,000 – 150,000) = $117,857

ContinuingContinuing
Year 3 0.212486*(700,000 – 267854)=$92,602Year 3 0.212486*(700,000 – 267854)=$92,602 Year 4 0.212486*(700,000 – 360,459) = $72,759Year 4 0.212486*(700,000 – 360,459) = $72,759 Year 5 0.212486*(700,000 – 433,218) = $57,168Year 5 0.212486*(700,000 – 433,218) = $57,168 Year 6 0.212486*(700,000 – 490,386) = $44,917Year 6 0.212486*(700,000 – 490,386) = $44,917 Year 7 0.212486*(700,000 – 535,303) = $35,292Year 7 0.212486*(700,000 – 535,303) = $35,292 Year 8 0.212486*(700,000 – 570,595) = $27,730Year 8 0.212486*(700,000 – 570,595) = $27,730 Year 9 0.212486*(700,000 – 598,324) = $21,788Year 9 0.212486*(700,000 – 598,324) = $21,788 Wait a Cotton Picken Minute Here - The truck was Wait a Cotton Picken Minute Here - The truck was
dead at 7 years – how long does this depreciation go dead at 7 years – how long does this depreciation go onon
Answer – Till you are dead too (forever)Answer – Till you are dead too (forever)

Houston- We have a Houston- We have a problemproblem
Declining balance methods start out fine, Declining balance methods start out fine, but going on forever makes no sensebut going on forever makes no sense
Solution – Do a straight line calculation in Solution – Do a straight line calculation in parallel with the declining balance parallel with the declining balance calculation and switch when straight line calculation and switch when straight line is moreis more

ImplementationImplementation
Year 1 SL = Book Value/ Remaining LifeYear 1 SL = Book Value/ Remaining Life $700,000/ 7 = $100,000$700,000/ 7 = $100,000 Declining Balance says $150,000Declining Balance says $150,000 $150,000 > $100,000 – select declining balance$150,000 > $100,000 – select declining balance
Year 2 SL = $550,000/ 6 = $91,667Year 2 SL = $550,000/ 6 = $91,667 Declining Balance says $117,857Declining Balance says $117,857 $117,857 > $91,667 – select declining balance$117,857 > $91,667 – select declining balance
Year 3 SL = $432,143/ 5 = $86,439Year 3 SL = $432,143/ 5 = $86,439 Declining Balance says $92,602Declining Balance says $92,602 $92,602 > $86,439 – select declining balance$92,602 > $86,439 – select declining balance

Implementation Implementation ContinuedContinued
Year 4 SL $339,541/4 = $84,885Year 4 SL $339,541/4 = $84,885 Declining Balance says $72,759Declining Balance says $72,759 $84,885 > $72,759 - switch to SL for rest of $84,885 > $72,759 - switch to SL for rest of
depreciationdepreciation
ThusThus Year 5 is $84,885Year 5 is $84,885 Year 6 is $84,885Year 6 is $84,885 Year 7 is $84,885Year 7 is $84,885 Depreciation is doneDepreciation is done
Things to NoteThings to Note
Depreciation is funny moneyDepreciation is funny money Money really moves like the cash flowMoney really moves like the cash flow
Why do people use funny money?Why do people use funny money? Accountants realized long ago that reporting profits and losses Accountants realized long ago that reporting profits and losses
based on when big purchases occurred put earning all over based on when big purchases occurred put earning all over the map – didn’t reflect how businesses asset position had the map – didn’t reflect how businesses asset position had changedchanged
Depreciation allowed accounted earnings and losses to show Depreciation allowed accounted earnings and losses to show how the companies performance changed its asset positionhow the companies performance changed its asset position
Why don’t we use them on cash flowsWhy don’t we use them on cash flows We are valuing the earnings and investment of a project not We are valuing the earnings and investment of a project not
trying to put a value on the company every yeartrying to put a value on the company every year We do things different because what we are trying to We do things different because what we are trying to
do is differentdo is different

The Funny Money The Funny Money ProblemProblem
Everyone understands why we need to depreciate long Everyone understands why we need to depreciate long lived assetslived assets Getting people to agree on how to do it is another matterGetting people to agree on how to do it is another matter We have shown you 3 ways – and haven’t yet talked about We have shown you 3 ways – and haven’t yet talked about
how we know how long the asset will lasthow we know how long the asset will last Everyone and his dog has a different way of calculating Everyone and his dog has a different way of calculating
profitsprofits SEC says how to do it for business reportingSEC says how to do it for business reporting Enron, MCI, Tyco, and Arthur – Anderson do it any way that Enron, MCI, Tyco, and Arthur – Anderson do it any way that
looks goodlooks good Feds say how to do it for their taxesFeds say how to do it for their taxes States say how to do it for theirsStates say how to do it for theirs
Idea that companies have 5 sets of books is not Idea that companies have 5 sets of books is not unusualunusual

How do the Feds Do it?How do the Feds Do it?
1971 U.S. Treasury Dept collected data 1971 U.S. Treasury Dept collected data on equipment lives – plotted the midpoint on equipment lives – plotted the midpoint of the distribution and called it the Asset of the distribution and called it the Asset Depreciation Range (ADR)Depreciation Range (ADR) This created standard lives for PropertyThis created standard lives for Property
Reagan RevolutionReagan Revolution Economy in stagflation / World poised for Economy in stagflation / World poised for
Nuclear annihilation with cold warNuclear annihilation with cold war

Reagan’s SolutionReagan’s Solution
Grow the economy out of stagnation and Grow the economy out of stagnation and bury the Soviets with military spendingbury the Soviets with military spending Key pin was stimulating investment and Key pin was stimulating investment and
activityactivity He stimulated investment with tax credits He stimulated investment with tax credits
and an accelerated depreciation systemand an accelerated depreciation system He used artificially short depreciation livesHe used artificially short depreciation lives Called Modified Accelerated Cost Recovery Called Modified Accelerated Cost Recovery
System (MACRS)System (MACRS)
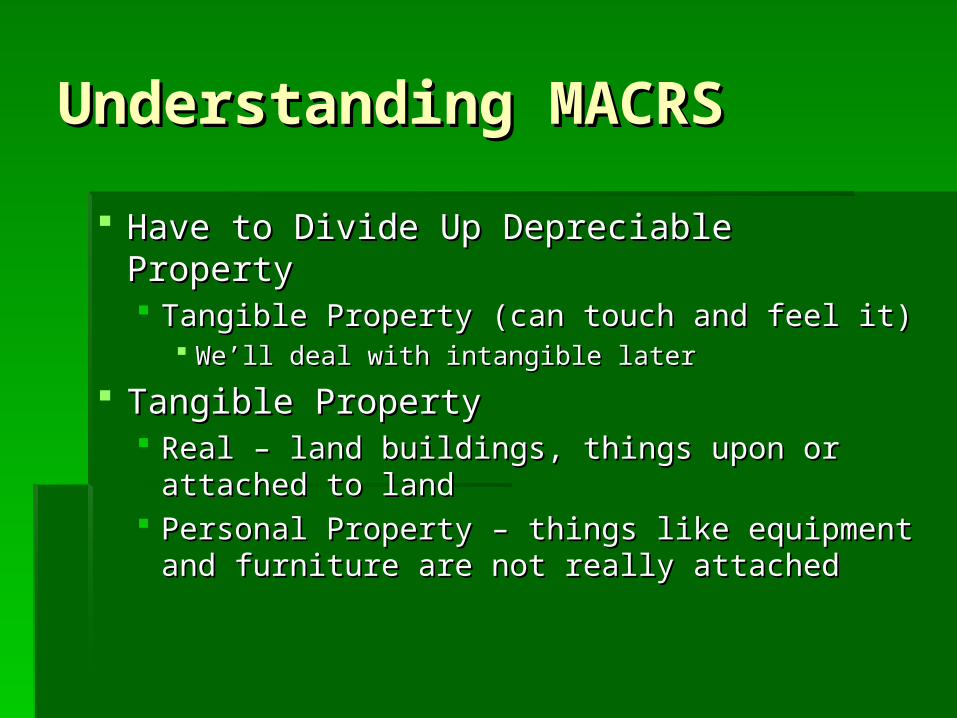
Understanding MACRSUnderstanding MACRS
Have to Divide Up Depreciable PropertyHave to Divide Up Depreciable Property Tangible Property (can touch and feel it)Tangible Property (can touch and feel it)
We’ll deal with intangible laterWe’ll deal with intangible later
Tangible PropertyTangible Property Real – land buildings, things upon or Real – land buildings, things upon or
attached to landattached to land Personal Property – things like equipment Personal Property – things like equipment
and furniture are not really attachedand furniture are not really attached
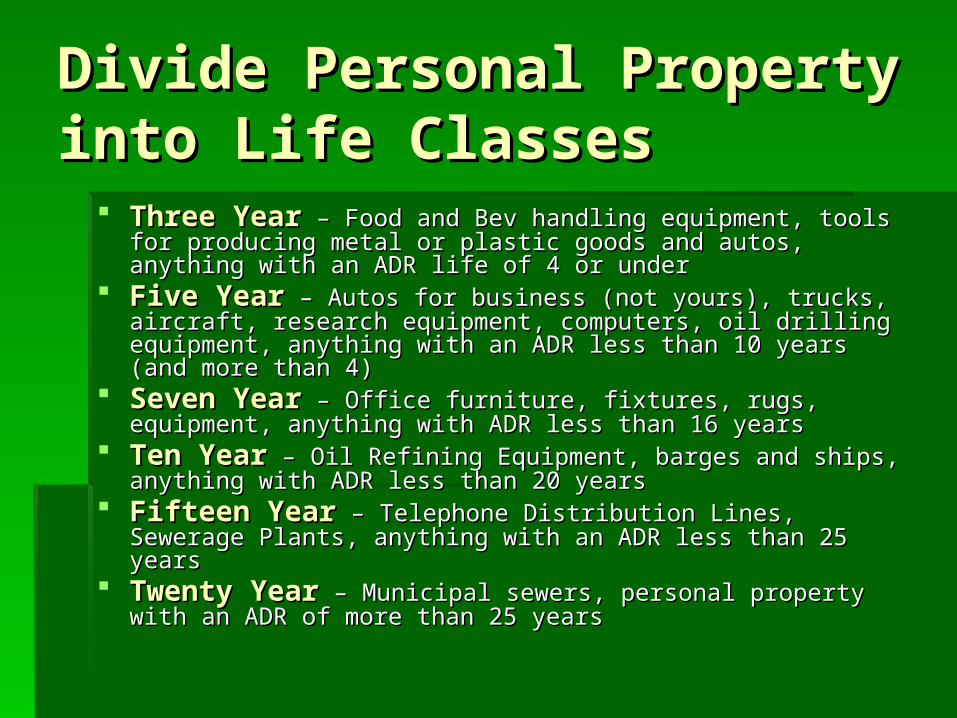
Divide Personal Property Divide Personal Property into Life Classesinto Life Classes
Three YearThree Year – Food and Bev handling equipment, tools for – Food and Bev handling equipment, tools for producing metal or plastic goods and autos, anything with an ADR producing metal or plastic goods and autos, anything with an ADR life of 4 or underlife of 4 or under
Five YearFive Year – Autos for business (not yours), trucks, aircraft, – Autos for business (not yours), trucks, aircraft, research equipment, computers, oil drilling equipment, anything research equipment, computers, oil drilling equipment, anything with an ADR less than 10 years (and more than 4)with an ADR less than 10 years (and more than 4)
Seven YearSeven Year – Office furniture, fixtures, rugs, equipment, – Office furniture, fixtures, rugs, equipment, anything with ADR less than 16 yearsanything with ADR less than 16 years
Ten YearTen Year – Oil Refining Equipment, barges and ships, anything – Oil Refining Equipment, barges and ships, anything with ADR less than 20 yearswith ADR less than 20 years
Fifteen YearFifteen Year – Telephone Distribution Lines, Sewerage Plants, – Telephone Distribution Lines, Sewerage Plants, anything with an ADR less than 25 yearsanything with an ADR less than 25 years
Twenty YearTwenty Year – Municipal sewers, personal property with an – Municipal sewers, personal property with an ADR of more than 25 yearsADR of more than 25 years
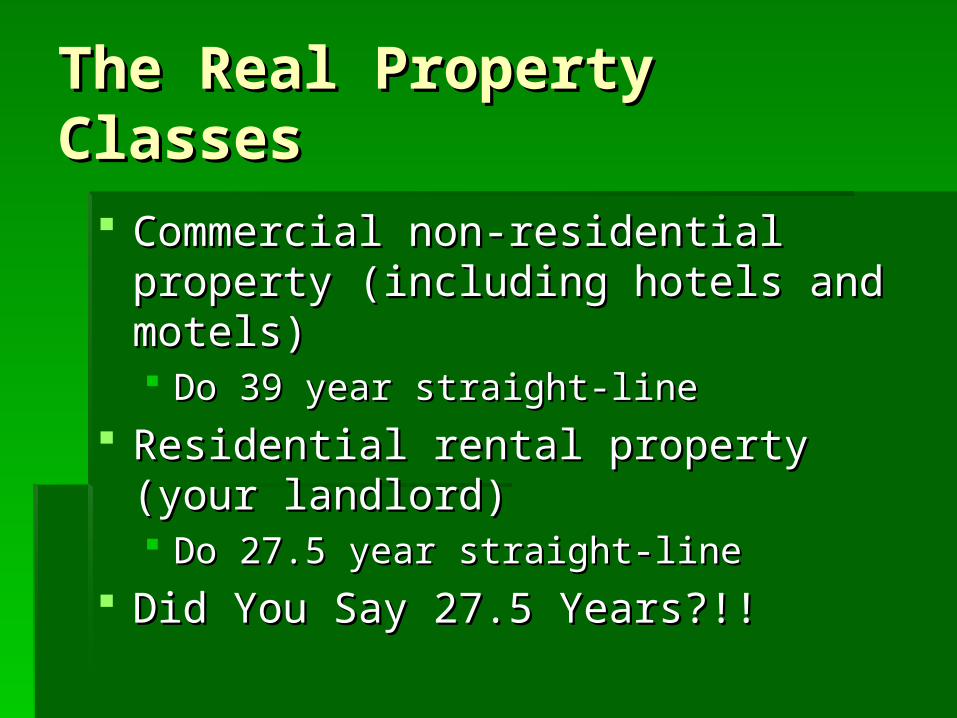
The Real Property The Real Property ClassesClasses
Commercial non-residential property Commercial non-residential property (including hotels and motels)(including hotels and motels) Do 39 year straight-lineDo 39 year straight-line
Residential rental property (your landlord)Residential rental property (your landlord) Do 27.5 year straight-lineDo 27.5 year straight-line
Did You Say 27.5 Years?!!Did You Say 27.5 Years?!!

Time Line ConventionsTime Line Conventions
With cash flows remember we accumulated With cash flows remember we accumulated events and put them at one point in timeevents and put them at one point in time Commonly we put all money events for a Commonly we put all money events for a
compounding period at the end of the periodcompounding period at the end of the period Government also uses a convention about Government also uses a convention about
where to put expenses for depreciation where to put expenses for depreciation purposespurposes Use the “Mid Year Convention” – ie the years Use the “Mid Year Convention” – ie the years
purchases are treated as occurring exactly at the purchases are treated as occurring exactly at the middle of the yearmiddle of the year Thus on 3 year property you get half a year in year 1, full Thus on 3 year property you get half a year in year 1, full
years in 2 and 3, and a half in year 4years in 2 and 3, and a half in year 4 There are also some rules that allow some property There are also some rules that allow some property
(usually 7 year and under to be set by Mid-Quarter (usually 7 year and under to be set by Mid-Quarter Convention) Convention)

The Problem of Unwieldy The Problem of Unwieldy MathMath
3, 5, 7, and 10 year property is 3, 5, 7, and 10 year property is depreciated by 200% declining balance depreciated by 200% declining balance converting to straight lineconverting to straight line
15, and 20 year property is 150% 15, and 20 year property is 150% declining balance converting to straight declining balance converting to straight lineline
Real Property is Straight LineReal Property is Straight Line Try that with Mid-Year and Mid-Quarter Try that with Mid-Year and Mid-Quarter
ConventionsConventions

The IRS SolutionThe IRS Solution
IRS considered a $100 investment for IRS considered a $100 investment for each type of property using mid-year, each type of property using mid-year, and 4 mid-quarter conventions where and 4 mid-quarter conventions where applicableapplicable Calculated depreciation each yearCalculated depreciation each year
This just happens to be the % This just happens to be the % depreciation allowable each yeardepreciation allowable each year They then publish the numbers in a table They then publish the numbers in a table
and spare you the need to understand how and spare you the need to understand how they got themthey got them

ExampleExample
Consider depreciation on a new carpet put in an office Consider depreciation on a new carpet put in an office buildingbuilding
Carpeting cost $10,000Carpeting cost $10,000 Its 7 year PropertyIts 7 year Property The table saysThe table says
Year 1 14.29%*$10,000 = $1,429Year 1 14.29%*$10,000 = $1,429 Year 2 24.49%*$10,000 = $2,449Year 2 24.49%*$10,000 = $2,449 Year 3 17.49%*$10,000 = $1,749Year 3 17.49%*$10,000 = $1,749 Year 4 12.49%*$10,000 = $1,249Year 4 12.49%*$10,000 = $1,249 Year 5 8.93%*$10,000 = $893Year 5 8.93%*$10,000 = $893 Year 6 8.93%*$10,000 = $893Year 6 8.93%*$10,000 = $893 Year 7 8.93%*$10,000 = $893Year 7 8.93%*$10,000 = $893 Year 8 4.46%*$10,000 = $446Year 8 4.46%*$10,000 = $446


