71
The net EROI for solar PV: a case study for Spain Des HOUCHES March 7th. 2016 Pedro A. Prieto

The net EROI for solar PV: a case study for Spain
Des HOUCHESMarch 7th. 2016Pedro A. Prieto

Why Spain?
The author's ownexperience indesign, developmentconsulting, contracting andconstructing over30 MW
And plenty of availabledata from the industry

Why Spain?
Because it has areasonable, stable and balanced electric network, a good managementand the country worksalmost like andelectric island

Why Spain?
● The best irradiation in Europe.

Why Spain?● Very accurate generation and installed power data per month and per region

Why Spain?
● The best and most accurate official data on generation and installed base.
● Massive and stable deployment ( ~ 4 GW).
● Three complete years of monitoring (2009-2011)

Why Spain?
Plenty of accurate information on all types of energy and economic costs of all types of installations
The Case Study is a restrospective analysis,basically with facts, rather than the usual prospective analysis with assumptions
Why Spain?
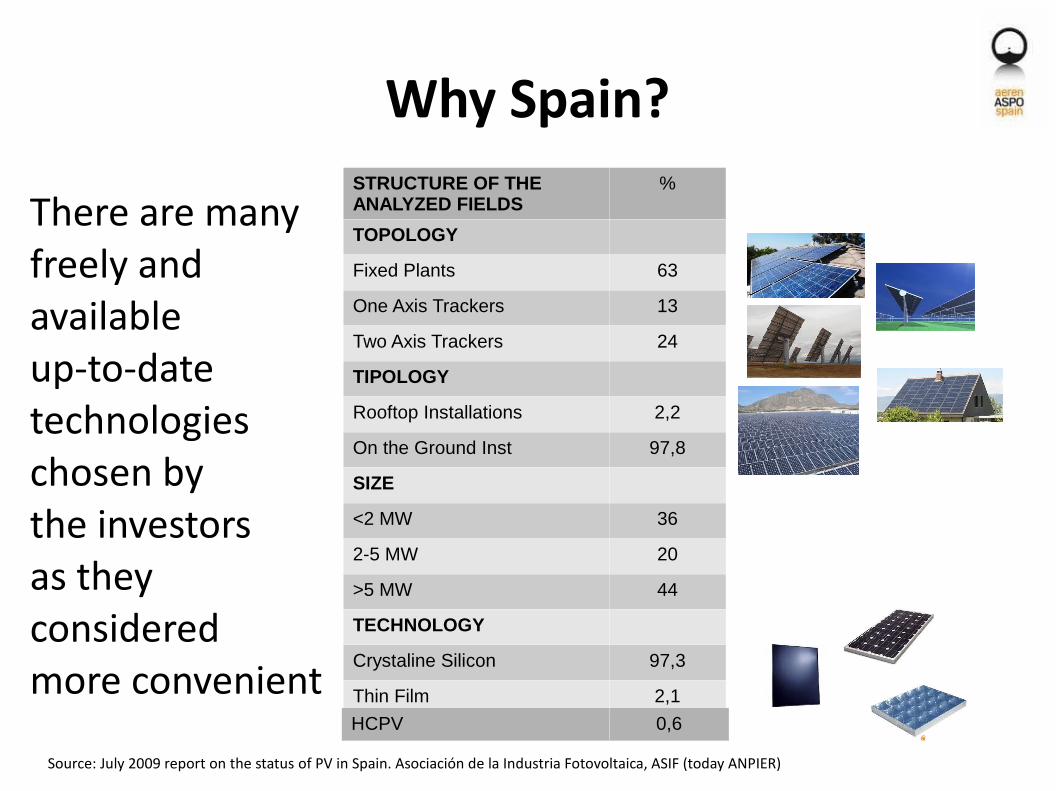
There are many freely and available up-to-date technologieschosen bythe investorsas they consideredmore convenient
STRUCTURE OF THE ANALYZED FIELDS
%
TOPOLOGY
Fixed Plants 63
One Axis Trackers 13
Two Axis Trackers 24
TIPOLOGY
Rooftop Installations 2,2
On the Ground Inst 97,8
SIZE
<2 MW 36
2-5 MW 20
>5 MW 44
TECHNOLOGY
Crystaline Silicon 97,3
Thin Film 2,1
HCPV 0,6
Source: July 2009 report on the status of PV in Spain. Asociación de la Industria Fotovoltaica, ASIF (today ANPIER)
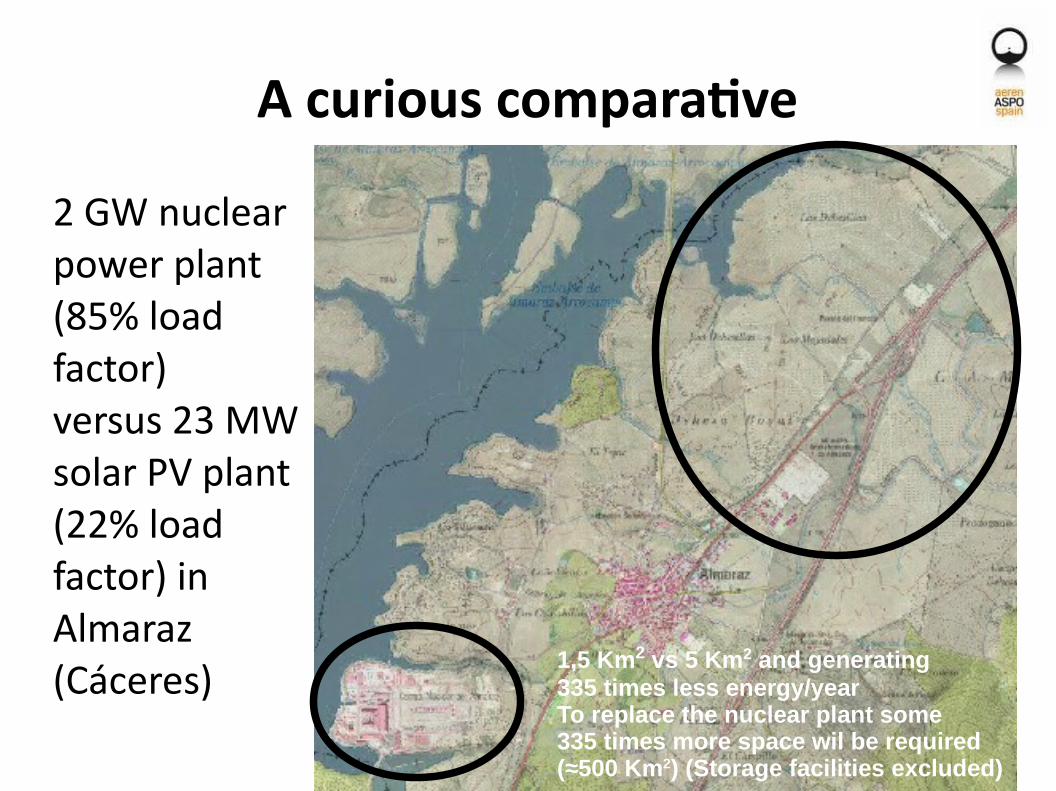
A curious comparative
2 GW nuclearpower plant(85% load factor)versus 23 MWsolar PV plant (22% load factor) inAlmaraz(Cáceres) 1,5 Km2 vs 5 Km2 and generating
335 times less energy/year To replace the nuclear plant some 335 times more space wil be required (≈500 Km2) (Storage facilities excluded)

The Energy System in Spain
Sources: El libro de la energía 2014. Ministerio de Industria. http://www.minetur.gob.es/energia/balances/Balances/LibrosEnergia/La_Energ%C3%ADa_2014.pdf REEEl sistema eléctrico español 2015. http://www.ree.es/sites/default/files/downloadable/avance_informe_sistema_electrico_2015_v2.pdf
PRIMARY ENERGY IN SPAIN (2014)
Coal
Oil
Natural Gas
Nuclear
Hydro
Wind+Solar+Geothermal
Biomass+Biofuels+Waste
ELECTRICITY GENERATION (2015)
Hydroelectricity
Nuclear
Coal
Fuel/Gas
Combined cycle gas plants
Generation consumption
Hydro-Wind
Minihydro
Wind
Solar PV
Solar CSP
Thermal Renewable
Cogeneration & Other

Evolution of Primary energy in Spain
Biomass, biofuelsrenewable waste Wind, solar,
Geothermal
Oil
Coal
Source: Ministry of Industry. El Libro de la Energía 2014. Page 312. http://www.minetur.gob.es/energia/balances/Balances/LibrosEnergia/La_Energ%C3%ADa_2014.pd

The Spanish Legislative Labyrinthfor the Renewable Program

The Pyramid of Energetic Needsand Required EROIs
Source: Charles Hall adapted by Lambert & Lambert 2012
❑❑

The Social Inverted Pyramid on the Energy Needs (Minimum EROI)
Minimum EROI Strip Required for Civilization
Hunter GatherersMetabolic Level EROI 2-3
Primitive Agricultureand cattle EROI 4-5
Advanced AgriculturalSociety EROI 5-6
Initial Industrial Society EROI 6-13
Industrial Developed Society EROI 8-15
Industrial andTechnological society EROI 12-25

Classic EROI Visionof an Energy System
CumulatedEnergy Production
CumulatedEnergy Costs
Project Starts
Projectends
Construction Life time Decomissioning
End of life
0 time
EnergyGeneration Starts
Self Consumption
Energy toconsumer
NetEnergy
Source: Energy from Wind: A Discussion of the EROI Research. Cutler cleveland. Quoted by Nate Hagens at http://www.theoildrum.com/node/1863
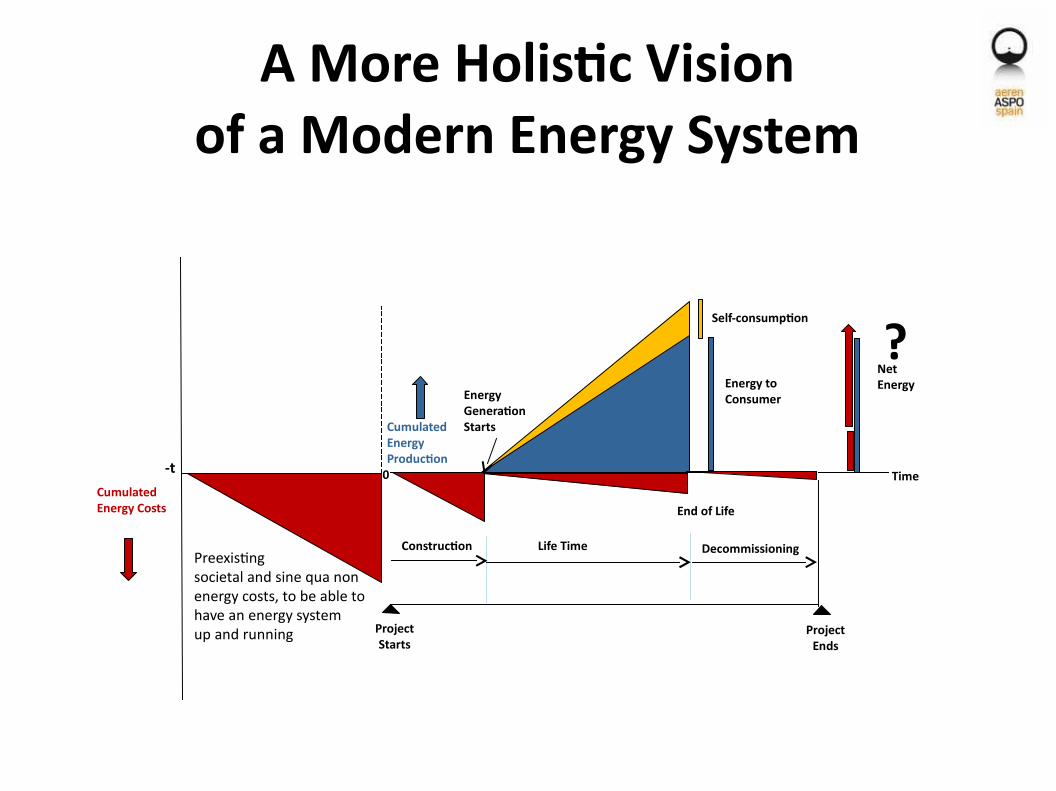
A More Holistic Visionof a Modern Energy System
CumulatedEnergy Production
Cumulated Energy Costs
ProjectStarts
ProjectEnds
Construction Life Time Decommissioning
End of Life
0 Time
Energy Generation Starts
Self-consumption
Energy toConsumer
Net Energy
Preexistingsocietal and sine qua nonenergy costs, to be able tohave an energy systemup and running
?
-t

The Energy Return (Eout)

The Energy Return (Eout)Life Cycle/Assessment of solar PV
● IEA PVPS Task 12 considers 30 years.● Manufacturers guarantee the power 25 years.● Manufacturers guarantee the modules 5-12 years.● The later guarantee supersedes the former.● From the European Association PV CYCLE it could rather be inferred a shorter life cycle.1 18 years● The “Quality Monitor, 2013” of the TUV Rheinland (Germany) gives some 30% of modules with serious deficiences● Photon magazine (January 2013) states that 70% of modules have minor defects.● The case study made a conservative assumption 25 years
1. European Association PV CYCLE (PV CYCLE – Operational Status Report – Europe calculated about 10,000 Tons of failed and wasted modules by 2014. This could correspond to some 80 MW the ooverall installed capacity in 1997 in Europe.2. From Quality Monitor 2013 of TUV Rheinland. http://www.tuv.com/media/01_presse_2/all_languages_pressemeldungen/Handout_Media_TUeV_Rheinland_Quality_Monitor_Solar_2013.pdf
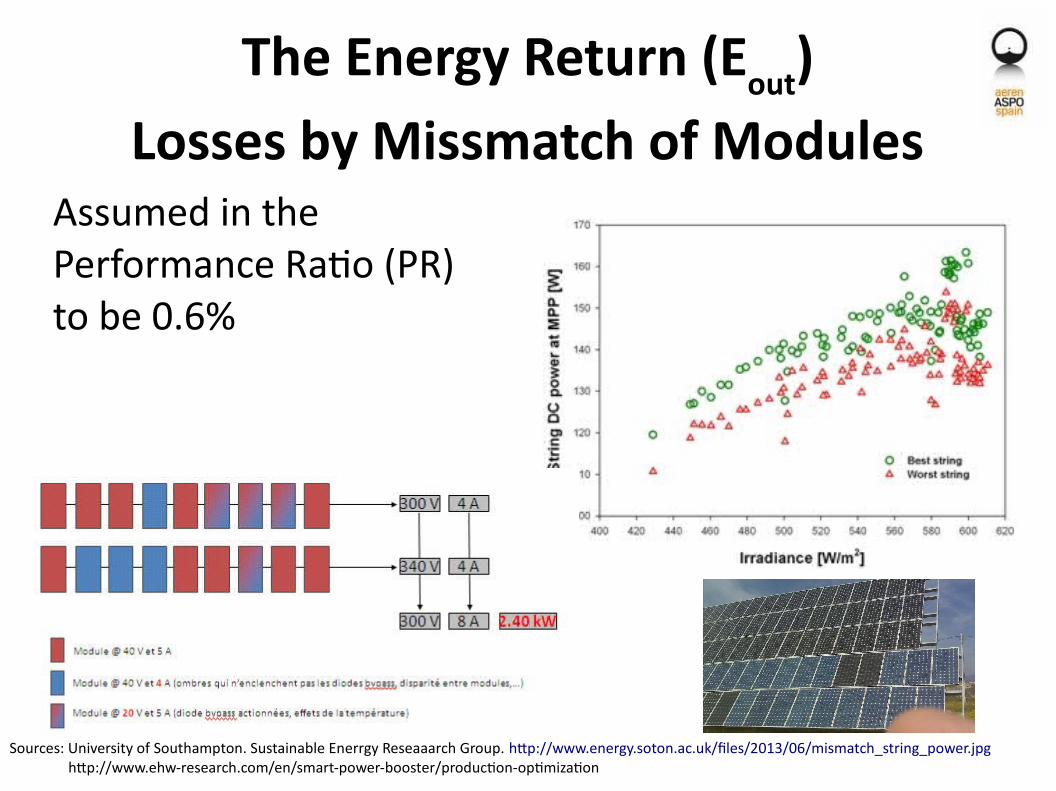
The Energy Return (Eout)Losses by Missmatch of Modules
Assumed in the Performance Ratio (PR)to be 0.6%
Sources: University of Southampton. Sustainable Enerrgy Reseaaarch Group. http://www.energy.soton.ac.uk/files/2013/06/mismatch_string_power.jpg http://www.ehw-research.com/en/smart-power-booster/production-optimization
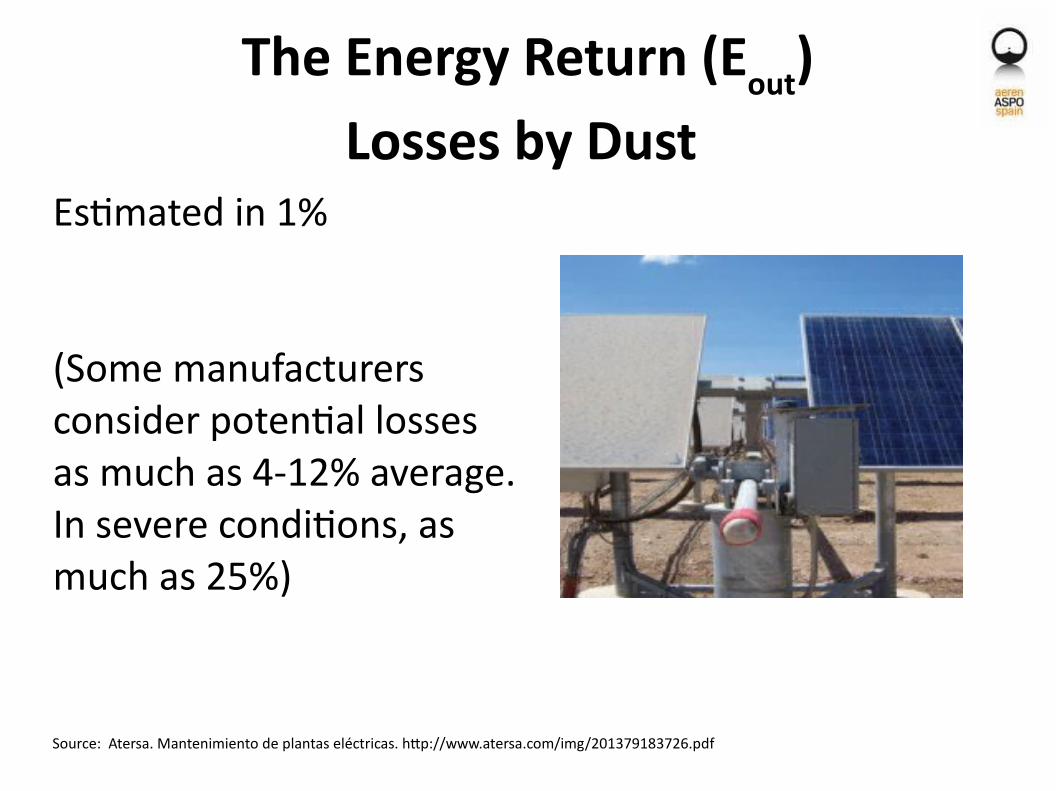
The Energy Return (Eout)Losses by Dust
Estimated in 1%
(Some manufacturers consider potential lossesas much as 4-12% average.In severe conditions, as much as 25%)
Source: Atersa. Mantenimiento de plantas eléctricas. http://www.atersa.com/img/201379183726.pdf
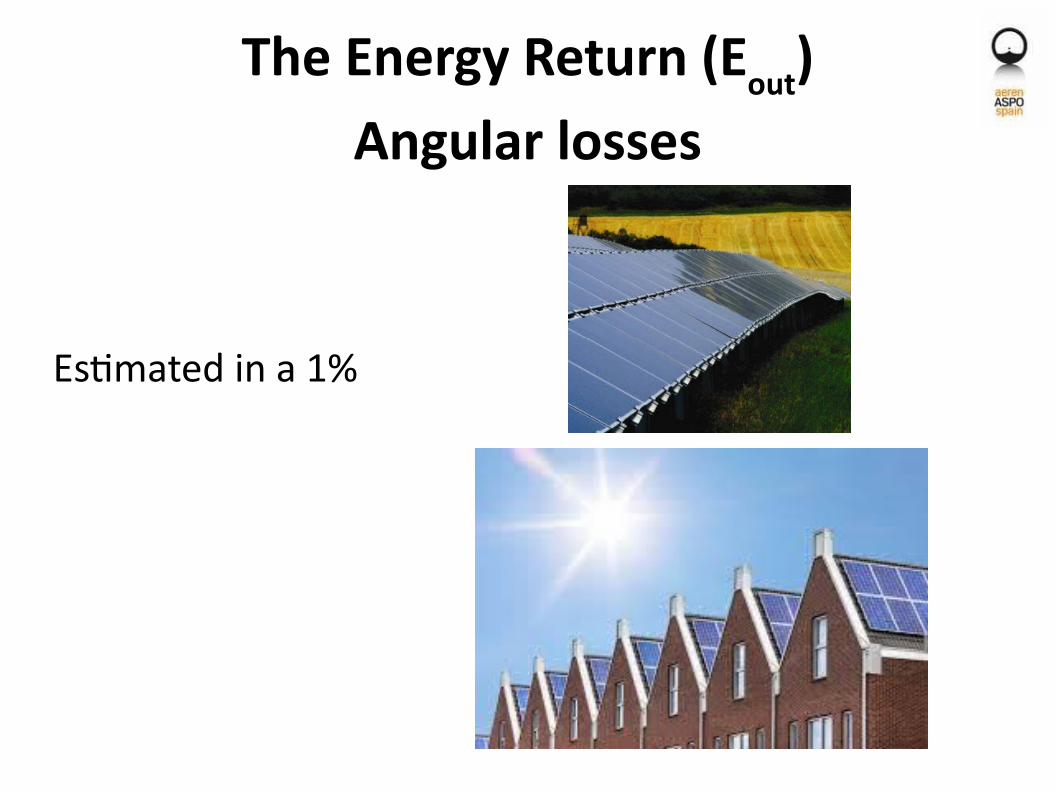
The Energy Return (Eout)Angular losses
Estimated in a 1%
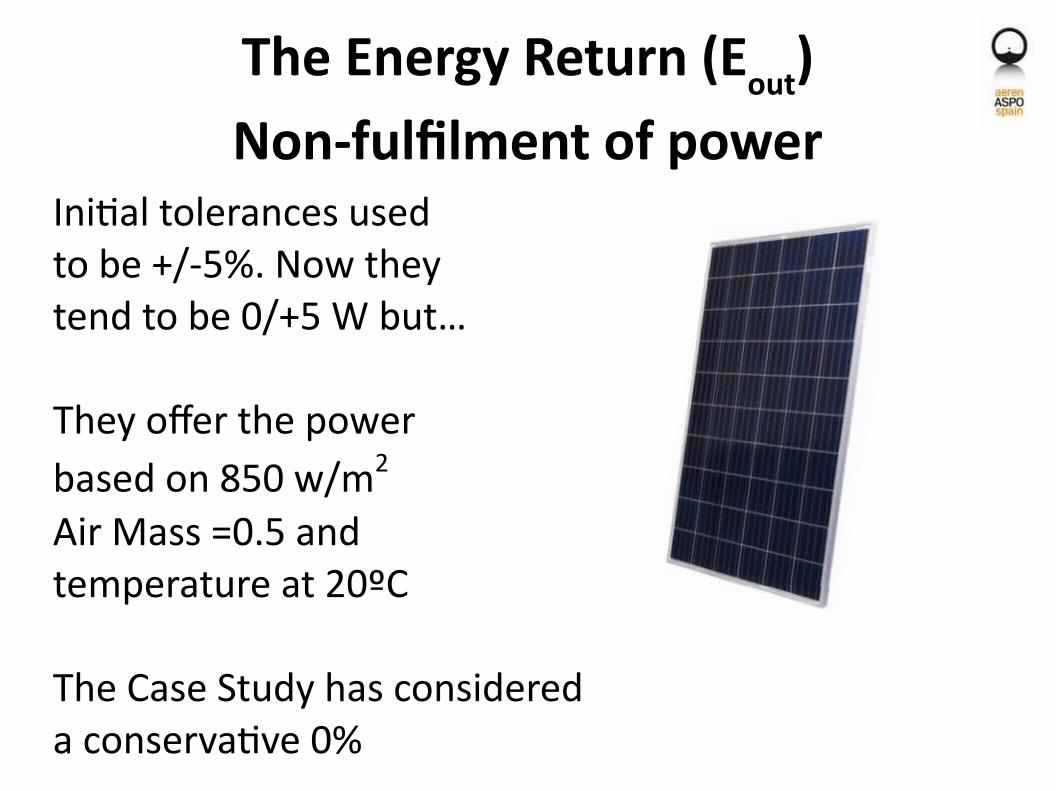
The Energy Return (Eout)Non-fulfilment of power
Initial tolerances usedto be +/-5%. Now theytend to be 0/+5 W but…
They offer the powerbased on 850 w/m2
Air Mass =0.5 andtemperature at 20ºC
The Case Study has considereda conservative 0%

The Energy Return (Eout)Losses due to temperature
The Case Study considers 5.6% losses
At 40ºC 8.2% losses
Source: Suntech. http://shangde.fanyacdn.com/imglibs/files/stp265_wem(mc4_265_260_255).pdf

The Energy Return (Eout)Losses for Shadowing
The Case Study considers a very conservative 0%
Source: Euaan Mearns. Energy Matters. http://euanmearns.com/rooftop-pv-panels-point-where-the-roof-points/

The Energy Return (Eout)Inverter (MPTT) Losses
Source: for the photo. Ingeteam. Inverter 50-100 kW. Maximum efficiency at 97.5%. For the Graph solarpowerplanetearth.com
Assumed to be 5.4% in the Case Study

The Energy Return (Eout)AC Low voltage wiring losses
Transport existing network
Electric Existing Substation
Evacuation Line
Transforming Housing
DC/ACInverters
Assumed to be 0.4%in the Case Study

The Gross Energy Return (Eout)

The Energy Return (Eout)Medium Voltage Losses within the Plant
Transport existing network
Electric Existing Substation
Evacuation Line
Transforming Housing
DC/ACInverters
Assumed to be 2.1%in the Study Case

The Energy Return (Eout)Voltage Sags and Swells losses
Transport existing network
Electric Existing Substation
Evacuation Line
Transforming Housing
DC/ACInverters
Assumed to be 0%in the Study Case

The Energy Return (Eout)Averaged overdimensioning
For the plant ownerit was initially legalto overdimension,provided no more than100 kW output will exceed at the inverter output.
The study case assessed conservatively an 8% overdimensioningI.e. 100 kWn = 108 kWp
The industry admitted laterup to 20% overdimensioning
Frontier pointfor legal measure
of Solar plantpower
100 kW standard plant
Overdimensioned modules

The Energy Return (Eout)Evacuation Line Losses
Assumed as a 2.4%in the Study Case
Transport existing network
Electric Existing Substation
Evacuation Line
Transforming Housing
DC/ACInverters
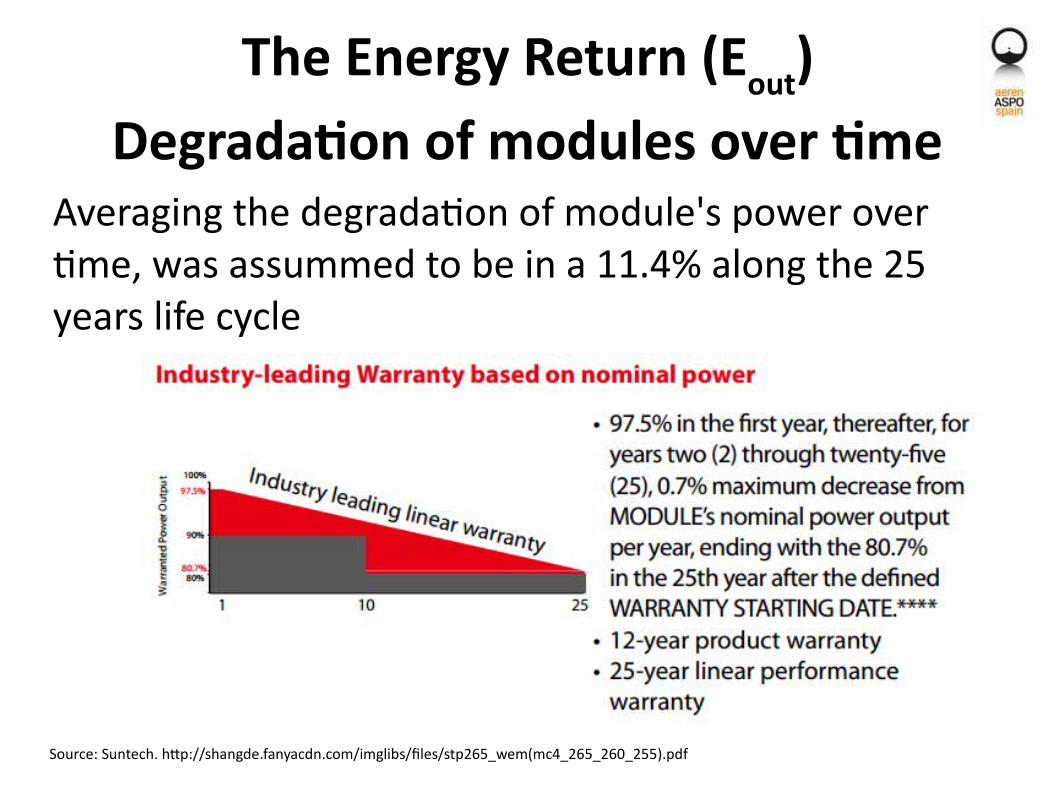
The Energy Return (Eout)Degradation of modules over time
Averaging the degradation of module's power over time, was assummed to be in a 11.4% along the 25 years life cycle
Source: Suntech. http://shangde.fanyacdn.com/imglibs/files/stp265_wem(mc4_265_260_255).pdf

The Net Energy Return (Eout)
The Energy Invested (Ein
)
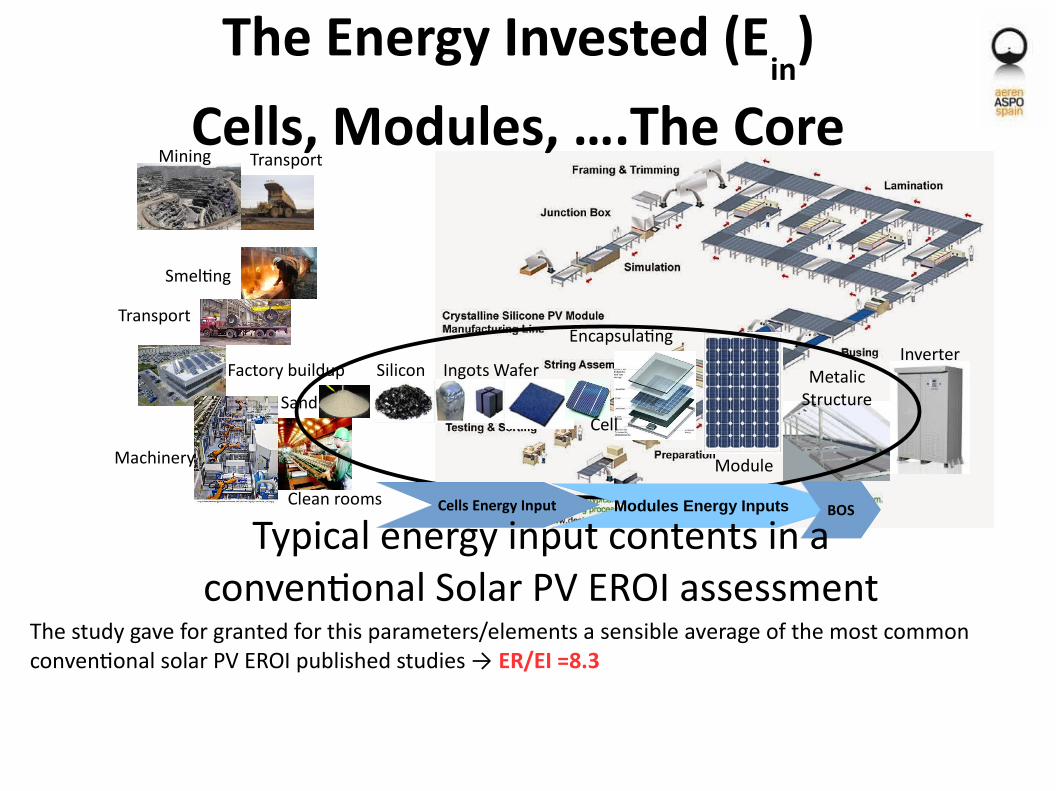
Cells, Modules, ….The CoreMining Transport
Smelting
Factory buildup
Machinery
Clean rooms
Inverter
Transport
Cell
WaferIngotsSilicon
SandMetalic
Structure
Module
Encapsulating
The study gave for granted for this parameters/elements a sensible average of the most common conventional solar PV EROI published studies → ER/EI =8.3
Cells Energy Input Modules Energy Inputs BOS
Typical energy input contents in aconventional Solar PV EROI assessment

The Energy Invested (Ein
)
Societal Energy expensesAccesses, foundations, canalizations, perimeter fences
Calculated as 1.1%of total ER (Eout)

The Energy Invested (Ein
)
Evacuation lines and rights of way
● Permits (Permisology)● Underground laying● Protected places (LIC/ZEPA)● Right of ways contracts● Water streams crossing conditions● Remote controlled switch-off by the electric power utility (OCR)● Electric substations permits● Power lines conditions●
Calculated as 0.1%of total ER (Eout)

The Energy Invested (Ein
)
O&M Energy inputs
Calculated as 7.7%of total ER (Eout)

The Energy Invested (Ein
)
Module washing and cleaning
Calculated as 0.2 %of total ER (Eout)
The Energy Invested (Ein
)
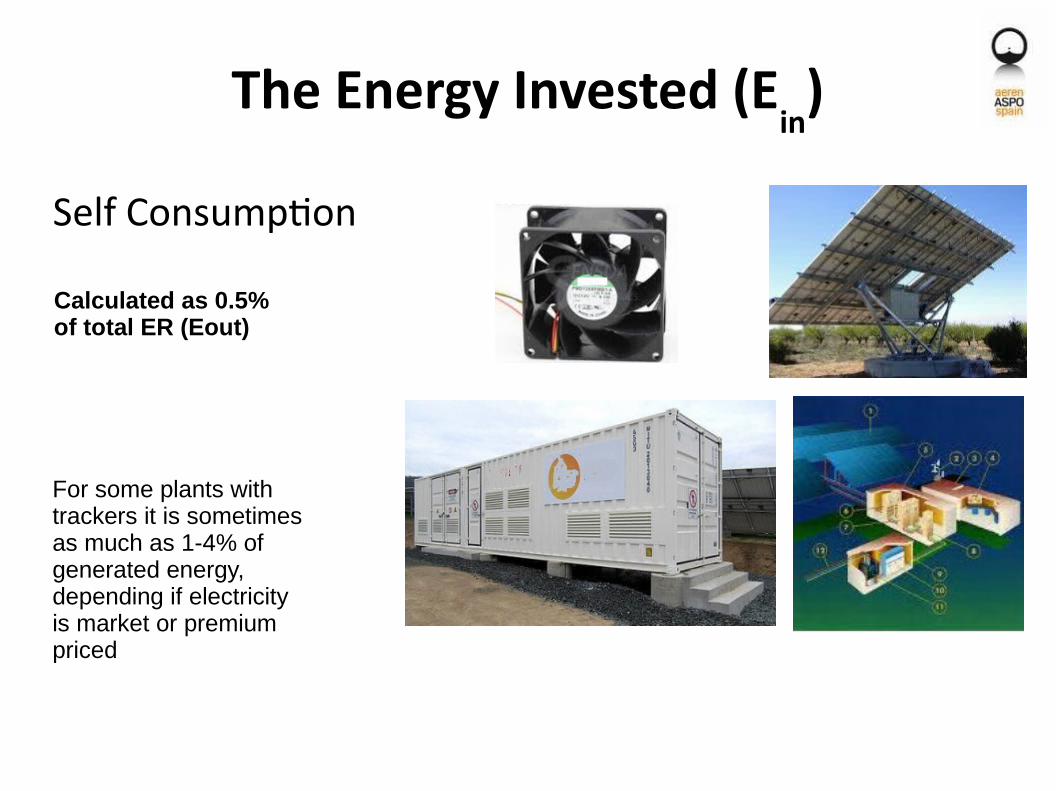
Self Consumption
Calculated as 0.5%of total ER (Eout)
For some plants with trackers it is sometimesas much as 1-4% ofgenerated energy,depending if electricityis market or premiumpriced
The Energy Invested (Ein
)
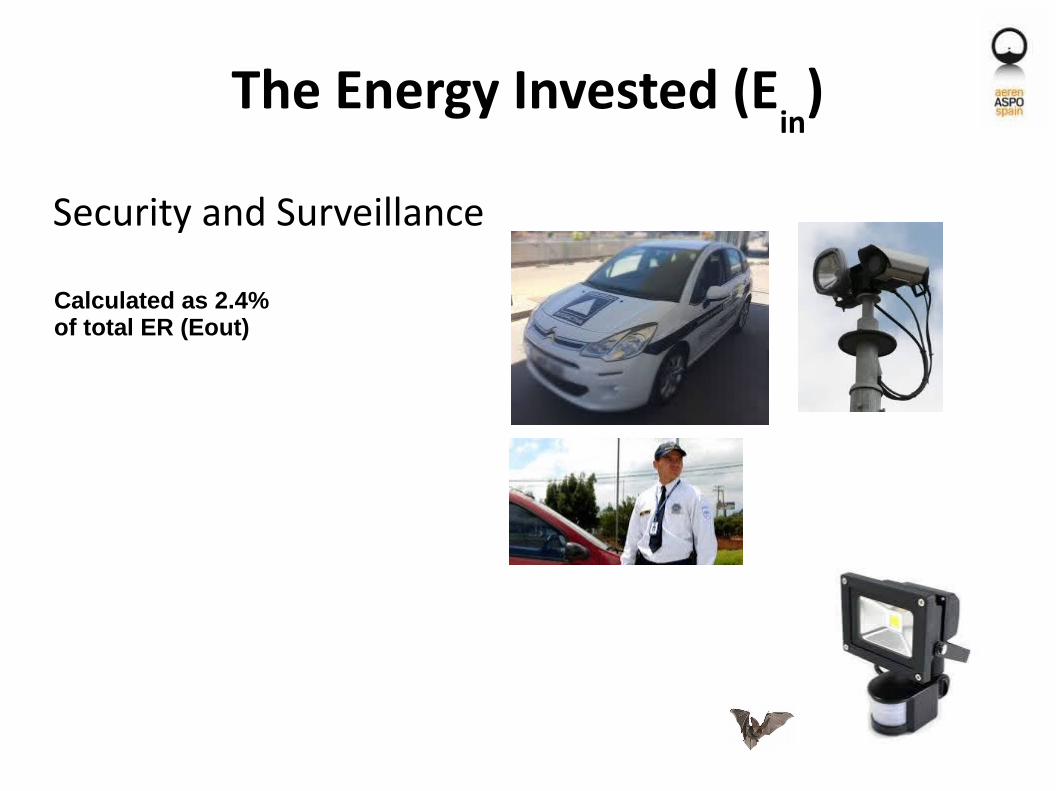
Security and Surveillance
Calculated as 2.4%of total ER (Eout)

The Energy Invested (Ein
)
Transportation For Equipment. For Engineering & R&D&IFor Commercial, MarketingFor O&M
Calculated as 1.9%of total ER (Eout)

The Energy Invested (Ein
)
Equipment Stealing and Vandalism
Calculated as 0.2%of total ER (Eout)

The Energy Invested (Ein
)
Communications, remote control and management
Calculated as 0.03%of total ER (Eout)
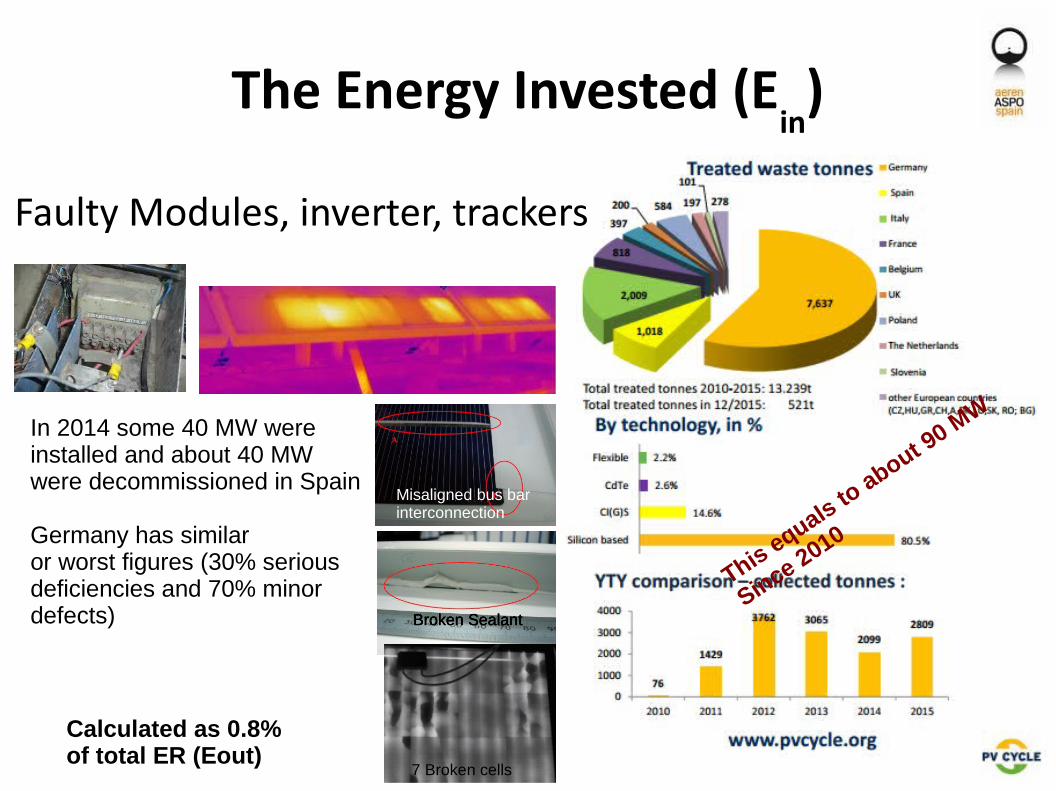
Broken Sealant
The Energy Invested (Ein
)
Faulty Modules, inverter, trackers
Broken Sealant
7 Broken cells
Misaligned bus barinterconnection
Broken SealantBroken Sealant
Calculated as 0.8%of total ER (Eout)
In 2014 some 40 MW wereinstalled and about 40 MWwere decommissioned in Spain
Germany has similar or worst figures (30% seriousdeficiencies and 70% minor defects)
This equals to about 9
0 MW
Since 2010
The Energy Invested (Ein
)
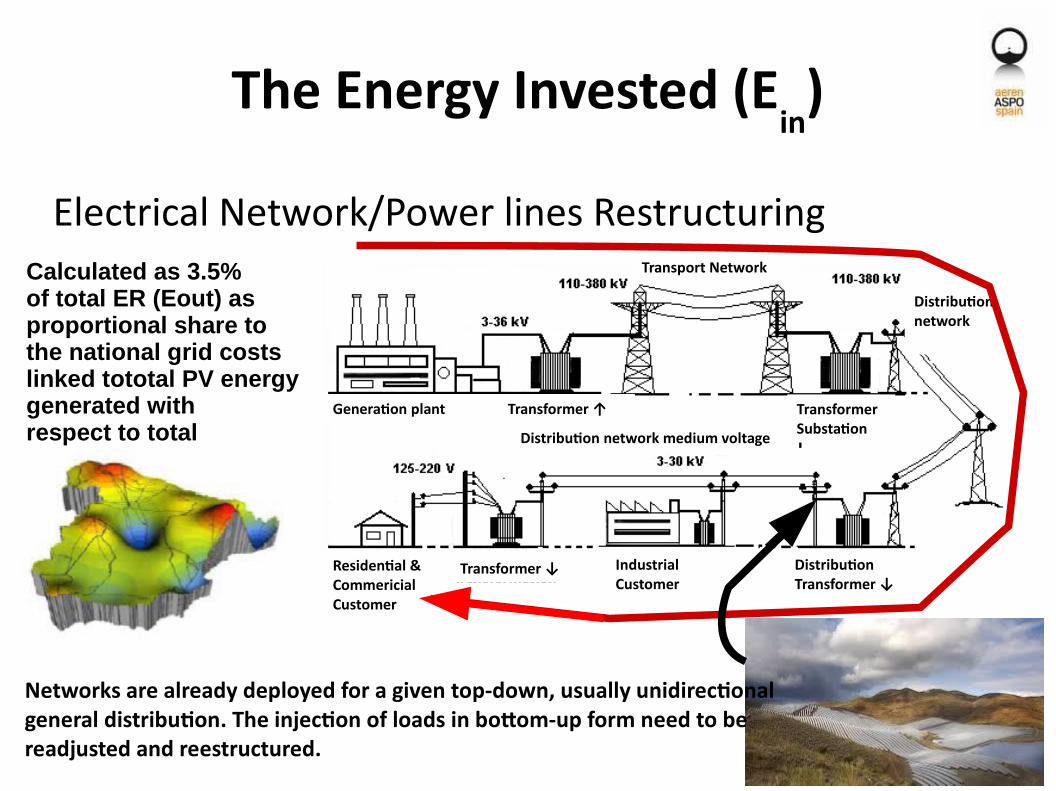
Electrical Network/Power lines Restructuring
Generation plant Transformer ↑
Transport Network
Distribution network
Residential &CommericialCustomer
Industrial Customer
Distribution network medium voltage
Transformer Substation
Generation plant
Transformer ↓ DistributionTransformer ↓
Networks are already deployed for a given top-down, usually unidirectionalgeneral distribution. The injection of loads in bottom-up form need to bereadjusted and reestructured.
Calculated as 3.5%of total ER (Eout) as proportional share to the national grid costslinked tototal PV energy generated with respect to total

The Energy Invested (Ein
)
Force Majeure/Acts of God: wind storms, lighting, flooding, hail
Calculated as 0%of total ER (Eout)in a very conservative estimate

The Energy Invested (Ein
)
Premature Phase Out of unamortized Manufacturing Equipment
Calculated as 2.8%of total ER (Eout)
Technological ultra-fast phase out,idle production,long term plansclashing with shortterm market or governmental movements
Financial costs of these itemshave not been considered

The Energy Invested (Ein
)
Insurances
Insurances usually cover fire, Acts of God,theft, vandalism, Civil Responsibility(evacuation lines), workers
Calculated as 0.5%of total ER (Eout)
There are frequent clashes betweeninsurance companies and owners andpromoters on how to determine theresponsibility of a given claim.

The Energy Invested (Ein
)
Administration Expenses
Calculated as 0.7%of total ER (Eout)
Take care of presenting balance sheets, P&L Statements, VAT declarations, bank accounts follow-up, taxes, levies, etc.

The Energy Invested (Ein
)
Indirect Labor (Direct Excluded)
● Consultants● Notary Public● Public Register● Civil Servants/Public Officers● Engineering Colleges● Legal Firms
Calculated as 0.4%of total ER (Eout)

The Energy Invested (Ein
)
Municipality taxes, duties and levies
Calculated as 0.3%of total ER (Eout),Very conservative assumption, asmost of the plantshave paid as muchas 4% of total project

The Energy Invested (Ein
)
Cost of land long term rent or ownership
Calculated as 0.2%of total ER (Eout)
From 17,000 €/ha in ownership
and 1,000 €/Ha/year in renting
Some lands sharply increasedin value, specially when demandraised and for locations close toa substation with idle capacity.
Talent spotters and intermediariesgrew like mushrooms.

The Energy Invested (Ein
)
Agent Representative
A legal obligation to contract. It sellselectricity to the market
It assumes responsibility and penalties on behalf of energy generators forgeneration deviations +/-5%on daily basis (one day in advance)and also on hourly basis (one hourin advance)
Calculated as 0.1 %of total ER (Eout)

The Energy Invested (Ein
)
Preinscription, inscription, registration bonds and fees
Calculated as 0 %of total ER (Eout)
Costs of about 1,250 M€bonds for preinscription and inscription for 6 months about8 million euros in 2009
Cost of feasibility study to becarried out by the utility wereabout 8 million euros in 2009
Neglected both amounts

The Energy Invested (Ein
)
Fairs, Exhibitions, Promotions, Conferences, etc.
Calculated as 0.5 %of total ER (Eout)
A very conservative approach formarketing and commercialexpenses of that industry sectorthat run on about 10-12% of the overall costs

The Energy Invested (Ein
)
Network Stabilization. Combined Cycles indirect costs
Spain initiated a program to reduce emissions as per the Kyoto Protocol commitments by phasing out coal plants and replacing them by combined cycle. As renewables enter first in the network, combined cycle are working at 20% of the designed power
Combined Cycle power plants were originally designed to work in a stable form some 5,500 hours/year (62.8% load factor)
1997 KyotoAgreement
2005 KyotoEntry into force
Calculated as 3.9 %of total ER (Eout)

The Energy Invested (Ein
)
Network Stabilization. Pump up or other massive storage Systems
CompressorGeneratorGas turbineCavern
Pump up systems loss some 25% of the turbined energy
Other massive storage systems even more
Not all the sites are adequate for them
Massive deployment of intermittent (stochastic) renewable Energy sourcescould have an extra cost to decide the go-no go forrenewable systems
Sources: El Hierro island. Cabildo. And Fritz Crotogino. KBB Germany
Left out of calculations for lack ofpublic consensus

The Energy Invested (Ein
)
Direct Labor. Sensitivity AnalysisJOB CREATION IN THE SOLAR PV SECTOR
Source: Memoria Asociación de la Industria Fotovoltaica (ASIF) June 2011
Employees
Permanent Temporary
CAGR*
There are several methodsto correlate energy spentand employment.
I/O Tables are most common
Spain does not publishI/O Tables
A simplified and conservativemethod is to correlate totalactive-occupied workers in a country with total primary energy consumed.

The Energy Invested (Ein
)Direct Labor. Sensitivity Analysis
Source: Memoria Asociación de la Industria Fotovoltaica (ASIF) June 2011
EMPLOYMENT BREAKDOWN IN THE SOLAR PV SECTOR IN 2010
Note: “Upstream includes employment devoted to the high value chain sector, mainly components manufacturing and R&D activities.Downsrteam includes employments devoted to the low value chain, mainly those related to services (Distribution, Engineering, Procurement and Construction (EPC) O&M, etc.)
TemporaryPermanent
About 19 million occupied workersIn 2008
About 142 million Toe in 2008 ofprimary energy
About 7.5 Toe per occupied worker
About 90 MWh per occupied worker
Assume 20,000 workers in the Solar PV sector y/y and 20,000 once in solar plants lifetime
180 Gwh consumed for people in thatSolar PV sector
They were able to produce/install and operateAbout 2,700 Mwp in 2008. Generating 3,712 Gwh
This is minimum 5% of total ER (Eout)

The Energy Invested (Ein
)Direct Labor. Sensitivity Analysis
Source: Presentación Informe (ASIF) August 2009
EMPLOYMENTS IN SOLAR PV SECTOR DURING THE 2008 PEAK OF ACTIVITY PER CONTRACT AND ACTIVITY TYPE
Installation Manufacturing
Engi
neer
ing
Adm
inist
ratio
n
Oth
ers
Prom
. & C
omm
erci
al
O&
M
Dist
ributi
onR&
D
Except in installation, employment is basically permanent
Fix Temporary

The Energy Invested (Ein
)
How to tackle monetary costs as energy?Money as a proxy of energy?Is money a lien of energy?Is or represents money a call on future energy?
Dividing the total primary energy used by total GDPgives a rough estimate: 7.16 MJ/euro or 1.99 kWh/euro. (Spain 2010) (World 2015)
Energy intensities vary much depending on the sector

The Energy Invested (Ein
)
How to tackle monetary costs as energy?
Source: International Energy Agency (IEA). WOrld Energy Outlook (WEO) 2009. Page 59
The Energy Invested (Ein
)
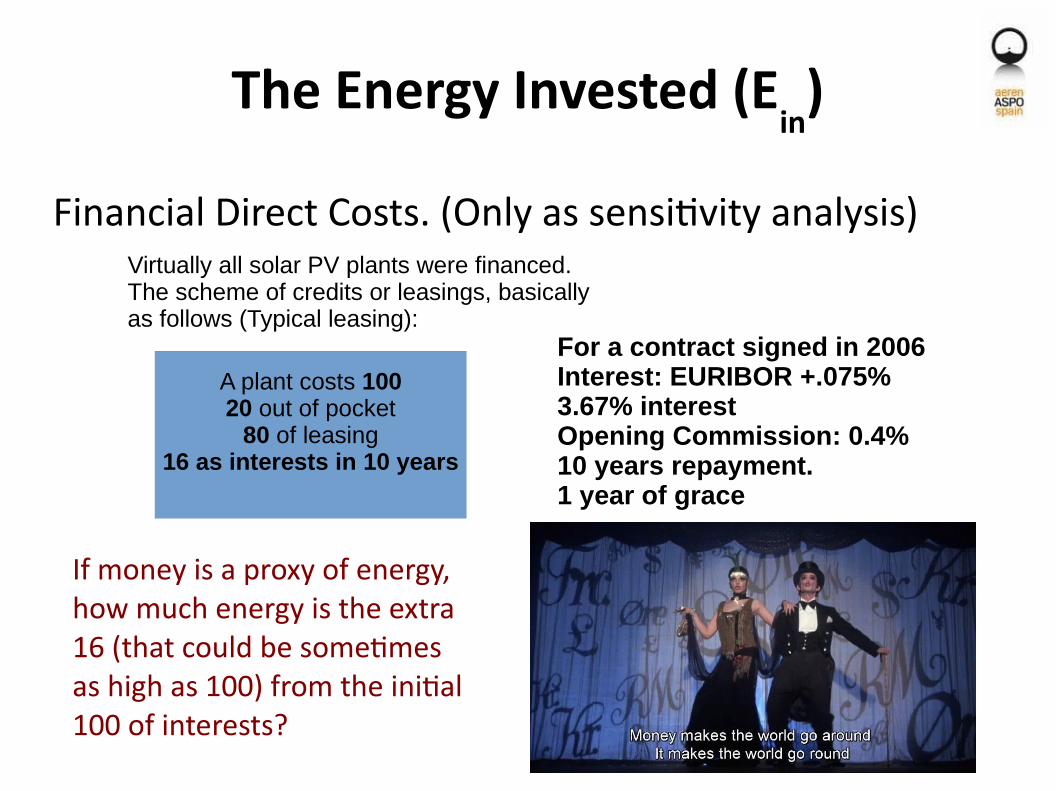
Financial Direct Costs. (Only as sensitivity analysis)Virtually all solar PV plants were financed.The scheme of credits or leasings, basically as follows (Typical leasing):
For a contract signed in 2006Interest: EURIBOR +.075%3.67% interestOpening Commission: 0.4%10 years repayment. 1 year of grace
A plant costs 10020 out of pocket
80 of leasing16 as interests in 10 years
If money is a proxy of energy, how much energy is the extra 16 (that could be sometimes as high as 100) from the initial 100 of interests?

The Energy Invested (Ein
)
Sand Silicon Ingots
Wafer Cell
+ Tempered Glass + Copper+Soldering + Tedlar + EVA +Connect. Box + Cabling +encapsulatingPacking box, etc.
2. The Module Processes
canalization, cabling
Metallic Structure
Trackers
Module washing
O&M
External and internalAccesses
Transformers
DC/AC Inverters
Digital Meters
Evacuation LinesNational ElectricGrid
Machinery and Transport in all the value chain
3. Externalities of the PV System
Industrial media
1. Cell Process
PV factories.Parkings Vehicle fleet
Streets, roads, motorways
4. Societal Areas of SINE QUA NON
energy inputs
Ministries, regulatory bodies, banksfinancial entities, municipalities, insurances, administration, etc., etc.
Skilled labor in all the value chain
Rent or land Ownership
Pump-up, pressurized gasMassive Storage
Hidden, ignored, underestimated Energy Input costs. Complete BoS in all the social process
1/3 2/3

The Flow of Global Energy as per the IEA
29%
787 EJ (569 EJ = 100%) 13,654 MToe
31%
18 %
21%
10%
0,7% 2.4%
0.4%
0.01%
4,8%
20 % 6.1 %
68 %
20 %
6 %
19 % (93% of itfrom oil)
24 % Residential &Commerical)
Source: Sankey Diagram IEA 2013. http://www.iea.org/sankey/
In Peta Joules
38 %

Direct 'Transformity'
101 EJ
48 EJ
27 EJ
12 EJ
72 EJ
188 EJ
116 EJ
13.6 EJ
Coal
Gas
Oil
Uranium
Hydro
Biomass 6.4 EJ 2.6 EJ
Wind
Solar
2.1 EJ
Fossils& nuclear
0,7 EJ
19 EJ
From direct ‘Transformity’we can conclude that from every EJ generated in solar plants grid connected, ( as final exergy), we could save about 2.6 EJ of primary energy from non renewable sources

Reverse 'Transformity' 2
100%
76-63 45-0 31-0
PV modulesdeliver 15 unitsof energy. Be this starting point = 100
Sun 100 Energy units
Electricity used to produce hydrogen byelectrolysis20-30% losses
Hydrogen iscompressed or liquefied to be stored30-40% losses
Hydrogen is lost in transport and/or storage. 15 to 100%depending on timeand logistcis
The fuel cell converts hydrogen again into electricity 30 to 50% losses
Transmission lines5 to 10% losses
95-9053-38
Direct combustion converts hydrogen In motion with about 60-70% losses because the Carnot cycle
12-0
Accumulation inbatteries+ electric motor10-20% losses
Electro-Stations
ElectrifiedLand Transport
72-49
Massive energy storage in caverns or others15-30% Losses
Pump up30% losses
80-63
Massive accumulationmethods
Non electric uses of primary energy. Total: 354 EJ or 62% from a total of >569 EJ/year
Societal functionshardly replaceable with electricity

Conclusions
2-3:1
4-5:1
5-6:1
6-13:1
8-15:1
12-25:1
Solar PV modules have a global EROIext of thislevel (as best)….
...but they need a societywith this EROIext level(at worst)
APPROX.REQUIRED EROI

Conclusions
2-3:1
4-5:1
5-6:1
6-13:1
8-15:1
12-25:1
As fossil fuels approachtheir peaks or go past peak and their EROI'sgo down, the building blocks of our modernsociety will start fallingapart.
Modern Renewables do not seem to be ableto sustain the presentworld infrastructure

Germany vs Spain


