31
The New Hampshire Greenhouse Gas Emissions Reduction Fund Year 1 (July 2009–June 2010) Evaluation

The New Hampshire Greenhouse GasEmissions Reduction Fund
Year 1 (July 2009–June 2010) Evaluation
Collaboration for a low-carbon society
The New Hampshire Greenhouse Gas Emissions Reduction Fund
Matthew Magnusson, M.B.A.University of new HampsHire
Cameron P. Wake, Ph.D.institUte for tHe stUdy of eartH, oceans, and space University of new HampsHire © 2011
Carbon Solutions New EnglandUniversity of New HampshireMorse Hall8 College RoadDurham, NH 03824
603 862-2329
CSNE Director: Cameron P. WakeUniversity of New Hampshire
Graphic Design: Kristi DonahueUniversity of New Hampshire Institute for the Study of Earth, Oceans, and Space
The transformational change required to build a low car-bon society demands collaboration among a wide range of stake-holders including the private sector, government, non-profits, and universities. Carbon Solutions New England is a public-private partnership based at the Uni-versity of New Hampshire to promote collective action to achieve a clean, secure energy future while sustaining our unique natural and cultural resources. New England is uniquely positioned to demonstrate an effective regional response by focusing our substantial entrepreneurial and
intellectual resources on this issue.
Track New England’s progress at CarbonSolutionsNE.org
CSNE Advisory Committee
Ross GittellJames R. Carter Professor and Professor of ManagementWhittemore School of Business and Economics, UNH
Tom KellyChief Sustainability Officer Director, Office of Sustainability, UNH
Adam MarkhamCEO, Clean Air – Cool Planet
Jan NisbetSenior Vice Provost for Research, UNH
Diane SchaeferDirector of Foundation Relations, UNH Foundation
Stacy VanDeveerAssociate Professor, Political Science, UNH
Year 1 (July 2009–June 2010) Evaluation

Contents 1 Executive Summary............................................................................................................................... 2
2 Background ........................................................................................................................................... 5
2.1 NH Greenhouse Gas Emissions Reduction Fund ............................................................................ 5
2.2 Annual Report .............................................................................................................................. 13
3 Grants Awarded in 2009 ....................................................................................................................... 7
3.1 Overview ........................................................................................................................................ 7
3.2 Energy Impacts............................................................................................................................. 11
3.2.1 Fuel Reductions..................................................................................................................... 11
3.2.2 Energy Cost Reductions......................................................................................................... 12
3.3 Economic Impact.......................................................................................................................... 13
3.3.1 Employment .......................................................................................................................... 14
3.3.2 Other Economic Impacts ....................................................................................................... 15
3.4 Environmental Impacts ................................................................................................................ 15
3.5 Net Cost per Ton .......................................................................................................................... 16
3.6 Other Impacts .............................................................................................................................. 18
3.6.1 Job Training ........................................................................................................................... 18
3.6.2 Benchmarking and Audits ..................................................................................................... 19
4 GHGERF Energy Reduction Projections............................................................................................... 21
5 Discussion............................................................................................................................................ 23
6 Appendix A: 2009 Grants .................................................................................................................... 24
7 Appendix B: Energy Efficiency Program Framework ........................................................................... 27

NH Greenhouse Gas Emissions Reduction Fund Year 1 (July 2009 – June 2010) Evaluation
2
1 Executive Summary
This report provides an evaluation of the first year of the New Hampshire Greenhouse Gas Emissions Reduction Fund (GHGERF) grants for the period July 15, 2009 through June 30, 2010. Between July 15,
2009 and October 21st, 2009, the GHGERF awarded $17.7 million to 30 grants (19 grants had a duration of 1 year or less; 11 grants had a duration of 1 to 2 years) with an average award amount of just under $600,000. For perspective, the total amount of grants awarded is equal to 0.3% of the $6 billion that NH
spends annually on energy across all sectors. These grants went to a wide variety of activities with approximately 80% of funds going to activities that directly reduce energy use.
During the first year reporting period, the GHGERF grants reduced energy use by 40,500 million BTU, saved NH residents and businesses $1.5 million in energy costs, and reduced CO2 emissions by 4,600
metric tons (Table 1). This is the equivalent to taking 900 cars off of the road for one year.
Projects completed during the first year reporting period and completed or scheduled to be completed during the second reporting period (July 2010 to June 2011) will result in annual energy savings of $4.2 million in energy costs and CO2 emissions reductions of 13,200 metric tons (Table 2). This is the
equivalent of taking 2,500 cars off of the road for one year.
Lifetime savings due to grants funded by the $17.7 million awarded through GHGERF are $60.6 million in energy costs (at current energy prices) and CO2 emissions reductions of 200,000 metric tons (Table 3 and Figure 1). This is the equivalent to taking 38,500 cars off of the road for one year.
Table 1: Summary actual energy reductions measured during first year reporting period (July 2009 to June 2010)
Fuel Type Energy Reduced MMBTU
Equivalent Annual NH Household
Usage
Energy Savings ($ millions)
CO2 reduced (metric tons)
Electric 7.5 million (kWh) 25,700 1,100 $1.2 3,700
Oil 54.5 thousand (gallons) 7,600 85 $0.1 550
Natural Gas 50 thousand (therms) 5,200 65 $0.1 270
Propane 21.5 thousand (gallons) 2,000 65 $0.1 120
Total 40,500 1,315 $1.5 4,600

NH Greenhouse Gas Emissions Reduction Fund Year 1 (July 2009 – June 2010) Evaluation
3
Table 2: Projected energy savings for second reporting period (July 2010 to June 2011)
Fuel Type Energy Reduced MMBTU
Equivalent Annual NH Household
Usage
Energy Savings ($ millions)
CO2 reduced (metric tons)
Electric 18.5 million (kWh) 63,100 2,650 $2.9 9,100
Oil 98.5 thousand (gallons) 13,700 155 $0.3 1,000
Natural Gas 484 thousand (therms) 49,700 620 $0.7 2,570
Propane 97 thousand (gallons) 8,900 300 $0.3 560
Total 135,400 3,725 $4.2 13,230
Table 3: Projected lifetime energy savings for projects completed or known to be completed as the end of the second reporting period
Fuel Type Energy Reduced MMBTU
Equivalent Annual NH Household
Usage
Energy Savings ($ millions)
CO2 reduced (metric tons)
Electric 253.5 million (kWh) 863,300 36,200 $39.5 124,740
Oil 1.7 million (gallons) 235,800 2,600 $4.4 17,300
Natural Gas 9.5 million (therms) 975,700 12,200 $13.2 50,400
Propane 1.3 million (gallons) 119,000 3,900 $3.5 7,480
Total 2,193,800 54,900 $60.6 199,920
The energy and CO2 reductions achieved during the first year were all verified with a defined measurement and verification protocol and are not annual or lifetime reduction estimates, but actual
energy reductions that occurred during that time period. Many of the grants were just complete or nearing completion as of the end of this reporting period (June 30, 2010) and were therefore not
reducing emissions over the entire year.
GHGERF supported energy efficiency training opportunities for 170 workers over 5,600 contact hours. GHGERF also supported 436 building benchmarking and energy audit evaluations. These are essential first steps in training the workforce and identifying and developing cost-‐effective projects that directly
reduce energy use.
While GHGERF funds were not intended for job creation, the GHGERF grants directly supported 55 full time equivalent (FTE) jobs with an estimated additional 15 to 30 FTE jobs being supported by the grants for a total job impact of 70 to 85 FTE jobs. In addition, low-‐interest loans helped improve the
competitiveness of two manufacturers employing a total of more than 400 workers.

NH Greenhouse Gas Emissions Reduction Fund Year 1 (July 2009 – June 2010) Evaluation
4
Figure 1: Cumulative energy cost reductions for grants funded in 2009 through 2030 ($ millions)
Key findings:
• GHGERF funded a wide range of projects that covered many essential areas of programmatic need for enhanced energy efficiency in the state.1
• Energy reduction projects were cost effective. Of the evaluated energy reduction projects there
was an average net SAVINGS of $147 per metric ton of CO2 reduced when considering both the cost of implementation and the cost savings resulting from reduced energy use. Put another
way each dollar invested by GHGERF resulted in $3.42 in direct energy savings. • The first year was a learning and infrastructure development period. It took a few months for
the grant recipients to develop capacity to deliver new energy efficiency services. This has
resulted in the grant recipients becoming increasingly sophisticated in providing energy efficiency services.
• Key benefits of GHGERF in the energy efficiency marketplace are its flexibility, its ability to
encourage innovation, and its leadership and support towards reducing dependence on imported energy sources in the state.
• The program has generated excitement and innovation for enhancing energy efficiency and
reducing energy use among a diverse cross-‐section of private and non-‐profit organizations across New Hampshire.
• There has been significant development of best practices for reducing energy use and reducing
dependence on imported energy. • Strong models and processes have emerged from the first year of implementation and these
new models are specifically reflected in the second round of GHGERF grants awarded in
December 2010. The new grant programs are far reaching and are expected to result in projects with significant energy and emissions reductions.
1 Essential areas are those identified in the Energy Efficiency Program Framework discussed in Appendix B.

NH Greenhouse Gas Emissions Reduction Fund Year 1 (July 2009 – June 2010) Evaluation
5
2 Background
2.1 NH Greenhouse Gas Emissions Reduction Fund
The NH Greenhouse Gas Emissions Reduction Fund (GHGERF) was created by New Hampshire legislation, RSA 125-‐O: 23 in 2008.2 The source of the funding comes from New Hampshire’s participation in the Regional Greenhouse Gas Initiative (RGGI) , a regional cap-‐and-‐trade program for
greenhouse gas emissions with 10 states from the Northeast and Mid-‐Atlantic participating and specifically covers carbon dioxide emissions from fossil-‐fuel electric power generation. RGGI creates a market for carbon dioxide emissions from fossil-‐fuel electric power generation and New Hampshire
emissions allowances are sold at quarterly auctions. The proceeds for NH from the auctions are paid into GHGERF. As of June, 2010 the GHGERF had received revenue of $24.3 million. The GHGERF is administered by the NH Public Utilities Commission (PUC) with the Sustainable Energy Division assisting
with fund management. Annual reports for the fund prepared jointly by the Department of Environmental Services and the Public Utilities Commission and submitted to the NH Legislature summarize the allocation and spending of auction revenues.
The first major expenditure from GHGERF was $1.2 million for the StayWarmNH program in winter
2008-‐2009 that provided assistance to low-‐income households by expanding existing weatherization and air sealing programs administered through the Community Action Agencies (CAAs), and funding a new kit and volunteer based weatherization efforts. As of May 2009, 3,400 homes had been reached by
the program. Volunteers installed over 1,000 compact fluorescent lights (CFLs), providing lifetime energy savings of $116,000; reducing CO2 emissions by 400 metric tons, and saving 575,850 kWh of electricity. Of the 3,400 StayWarm kits distributed for do-‐it-‐yourself installations, assuming half the four
CFLs included in the kit were installed by homeowners, lifetime savings for those 6,800 bulbs would be $760,000; reducing CO2 pollution by 2,600 metric tons, and saving 3.75 million kWh of electricity.3 The next major round of expenditures occurred with the first round of grants that were awarded in the
summer and fall of 2009. The First Request for Proposals (RFP) was issued in February of 2009. Out of 84 proposals submitted, 30 grants totaling $17.7 million were awarded in four separate rounds: July 15, 2009, August 15, 2009, September 23, 2009, and October 21, 2009. Grants went to a variety of project
types. This annual report tracks their activity from July 2009 through June 2010. Of the grants, $12.2 million (approximately 70% of the total 2009 grant award amount) was paid out during this time period
(State Fiscal Year 2010). Not all grant money was spent in State Fiscal Year 2010 as 11 of the 30 grants were for a duration of longer than one year, up to a maximum of two years.
In June 2010, about 1/7th of GHGERF funds ($3.1 million) were transferred from GHGERF to the State’s General Fund at the discretion of the NH state legislature to help balance the state budget.
2 RSA 125 0:23, Available online at http://www.gencourt.state.nh.us/rsa/html/X/125-‐O/125-‐O-‐23.htm. 3 “StayWarm Final Report 2008-‐2009” Available online at http://www.nh.gov/staywarm/#progress_reports.
NH Greenhouse Gas Emissions Reduction Fund Year 1 (July 2009 – June 2010) Evaluation
6
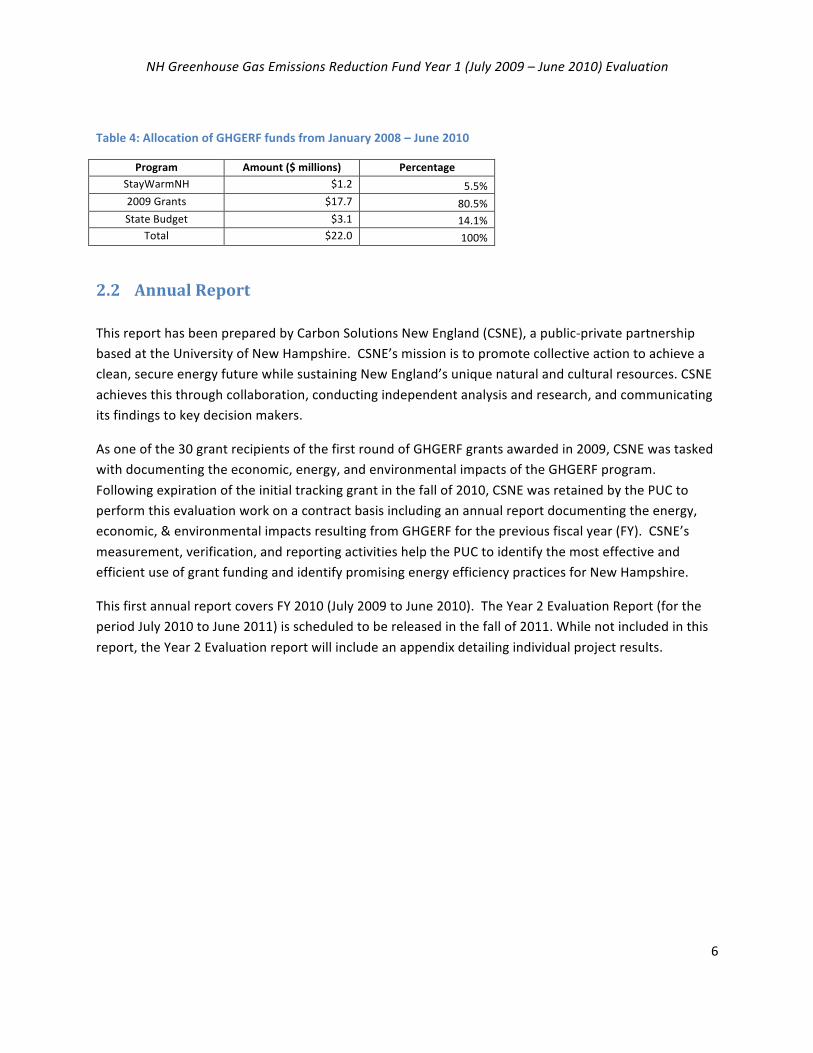
Table 4: Allocation of GHGERF funds from January 2008 – June 2010
Program Amount ($ millions) Percentage StayWarmNH $1.2 5.5% 2009 Grants $17.7 80.5% State Budget $3.1 14.1%
Total $22.0 100%
2.2 Annual Report
This report has been prepared by Carbon Solutions New England (CSNE), a public-‐private partnership based at the University of New Hampshire. CSNE’s mission is to promote collective action to achieve a clean, secure energy future while sustaining New England’s unique natural and cultural resources. CSNE
achieves this through collaboration, conducting independent analysis and research, and communicating its findings to key decision makers.
As one of the 30 grant recipients of the first round of GHGERF grants awarded in 2009, CSNE was tasked with documenting the economic, energy, and environmental impacts of the GHGERF program.
Following expiration of the initial tracking grant in the fall of 2010, CSNE was retained by the PUC to perform this evaluation work on a contract basis including an annual report documenting the energy, economic, & environmental impacts resulting from GHGERF for the previous fiscal year (FY). CSNE’s
measurement, verification, and reporting activities help the PUC to identify the most effective and efficient use of grant funding and identify promising energy efficiency practices for New Hampshire.
This first annual report covers FY 2010 (July 2009 to June 2010). The Year 2 Evaluation Report (for the period July 2010 to June 2011) is scheduled to be released in the fall of 2011. While not included in this
report, the Year 2 Evaluation report will include an appendix detailing individual project results.

NH Greenhouse Gas Emissions Reduction Fund Year 1 (July 2009 – June 2010) Evaluation
7
3 Grants Awarded in 2009
3.1 Overview In 2009, the NH Public Utilities Commission competitively awarded 30 grants to support programs and projects that directly or indirectly supported the reduction of fossil fuel based energy. These grants
went to a wide array of private, public, and non-‐profit entities and program types (Table 5) and served a wide range of energy consumers. The average grant size was just under $600,000. The list of grants is provided in Table 6 and a short description of each funded project appears in Appendix A. For additional
information on each of the funded projects, their proposals, contracts, and quarterly reports are available on the GHGERF webpage hosted by the PUC.
Table 5: Grants awarded in 2009 by recipient type
Grants Grant Funding
Recipient Type Count Percentage Amount Percentage Average Award
Size
Non-‐Profit 8 27% $2,754,328 16% $344,291
Private 6 20% $9,130,780 52% $1,521,797
Public Entity 16 53% $5,776,227 33% $361,014
Total 30 100% $17,661,335 $588,711
Table 6: Grants awarded in 2009
Grant Award
Amount Project Type Entity Served
Contract Duration (Years)
RECORE -‐ NH Electric Utilities $7,646,020 Installations/Retrofits Residential, Commercial & Industrial 2
Business Finance Authority of NH $2,000,000 Installations/Retrofits Commercial & Industrial 1 NH Community Development Finance Auth $1,500,000 Installations/Retrofits Municipal 2 Retail Merchants Assn of NH $1,372,028 Audits/Installations/Retrofits Commercial & Industrial 1 UNH-‐ Carbon Challenge $813,402 Education/Outreach Residential 2 TRC Companies $499,948 Benchmarking K-‐12 School 2 Fraser NH LLC $470,000 Installations/Retrofits Commercial & Industrial 1 Clean Air-‐Cool Planet $400,000 Benchmarking/Audits Municipal 1 City of Rochester $394,000 Installations/Retrofits Municipal 2 Town of Temple $332,100 Installations/Retrofits Municipal 2 Dartmouth College $330,936 Measurement Higher Ed 2 LighTec Inc $316,000 Installations/Retrofits Commercial/Industrial/Municipal 2 Home Builders & Remodelers Assn of NH $178,169 Training Workforce 2 Crotched Mtn Rehabilitation Ctr $176,531 Installations/Retrofits Non-‐Profit 1 DRED -‐ Division of Economic Development $174,000 Training Workforce 2 Stonyfield Farm Inc $148,927 Installations/Retrofits Commercial & Industrial 1 NH Institute of Art $146,060 Installations/Retrofits Non-‐Profit 2 UNH-‐ Carbon Solutions New England $139,945 Measurement State Government 1

NH Greenhouse Gas Emissions Reduction Fund Year 1 (July 2009 – June 2010) Evaluation
8
Grant Award
Amount Project Type Entity Served
Contract Duration (Years)
Town of Walpole $138,345 Installations/Retrofits Municipal 1 Plymouth Area Renewable Energy Initiative $99,250 Installations/Retrofits Residential 1 So NH Conservation & Development Area Council $87,000 Audits Agriculture 1 SAU 46/Merrimack Valley School District $83,685 Installations/Retrofits K-‐12 School 1 Chosen Vale Inc dba Enfield Shaker Mus $51,354 Installations/Retrofits Non-‐Profit 1 Propell Energy $49,885 Installations/Retrofits Non-‐Profit 1 No Country Res Cons & Dev Area Council $43,850 Education/Outreach Municipal 1 Town of Gorham $26,000 Installations/Retrofits Municipal 1 Town of Jaffrey $16,250 Audits Municipal 1 Town of Warner $11,150 Audits Municipal 1 Town of Hancock $8,500 Audits Municipal 1 Town of Fremont $8,000 Installations/Retrofits Municipal 1
The largest single grant was $7.6 million (over 40% of total grant awards) and went to the public electric utilities serving NH for their RECORE program. This program expanded the CORE programs; these are energy efficiency programs that are funded under the electric system benefits charge. The top four
grants—RECORE ($7.6 million), NH Business Finance Authority ($2 million), NH Community Development Finance Authority ($1.5 million), and Retail Merchants Association of New Hampshire ($1.4 million)—comprised 70% of 2009 total funding awards.
Overall approximately 90% of funding went to benefit Residential, Commercial, Industrial, and Municipal
entities (Table 7, Figures 2 and 3). While the largest number of grants went to municipal benefit (11 grants) they only accounted for 16% of fund expenditures. Other markets served included: non-‐profit, k-‐12 schools, workforce development, agriculture, state government, and higher education. Figure
shows each grant award amount in each target market column.
Table 7: Grants awarded in 2009 and funding amounts by target market
Grants Grant Funding
Target Market Count Percentage Amount Percentage
Average Award Size
Residential, Commercial & Industrial
1 3% $7,646,020 43% $7,646,020
Commercial & Industrial 5 17% $4,306,955 24% $861,391
Municipal 11 37% $2,878,195 16% $261,654
Residential 2 7% $912,652 5% $456,326
K-‐12 School 2 7% $583,633 3% $291,817
Non-‐Profit 4 13% $423,830 2% $105,958
Workforce 2 7% $352,169 2% $176,085
Higher Ed 1 3% $330,936 2% $330,936
State Government 1 3% $139,945 1% $139,945
Agriculture 1 3% $87,000 0% $87,000
Total 30 100% $17,661,335 100% $588,711
NH Greenhouse Gas Emissions Reduction Fund Year 1 (July 2009 – June 2010) Evaluation
9
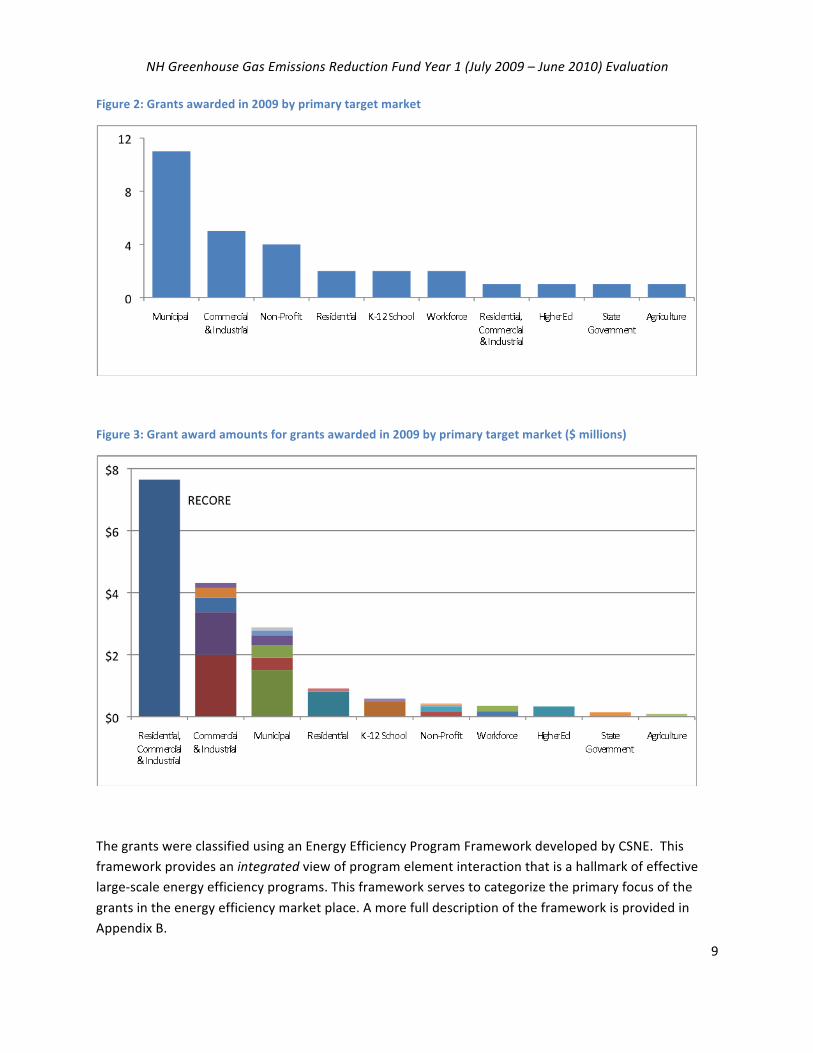
Figure 2: Grants awarded in 2009 by primary target market
Figure 3: Grant award amounts for grants awarded in 2009 by primary target market ($ millions)
The grants were classified using an Energy Efficiency Program Framework developed by CSNE. This framework provides an integrated view of program element interaction that is a hallmark of effective large-‐scale energy efficiency programs. This framework serves to categorize the primary focus of the
grants in the energy efficiency market place. A more full description of the framework is provided in Appendix B.
NH Greenhouse Gas Emissions Reduction Fund Year 1 (July 2009 – June 2010) Evaluation
10
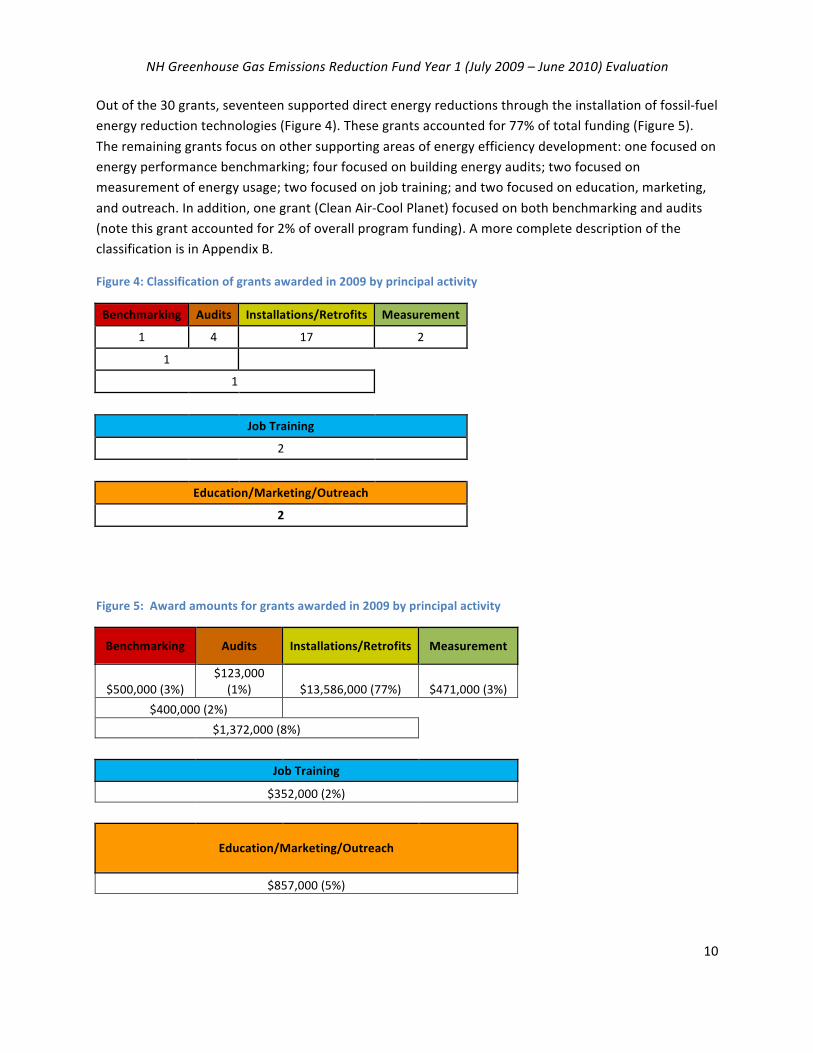
Out of the 30 grants, seventeen supported direct energy reductions through the installation of fossil-‐fuel energy reduction technologies (Figure 4). These grants accounted for 77% of total funding (Figure 5).
The remaining grants focus on other supporting areas of energy efficiency development: one focused on energy performance benchmarking; four focused on building energy audits; two focused on measurement of energy usage; two focused on job training; and two focused on education, marketing,
and outreach. In addition, one grant (Clean Air-‐Cool Planet) focused on both benchmarking and audits (note this grant accounted for 2% of overall program funding). A more complete description of the classification is in Appendix B.
Figure 4: Classification of grants awarded in 2009 by principal activity
Benchmarking Audits Installations/Retrofits Measurement
1 4 17 2
1
1
Job Training
2
Education/Marketing/Outreach
2
Figure 5: Award amounts for grants awarded in 2009 by principal activity
Benchmarking Audits Installations/Retrofits Measurement
$500,000 (3%) $123,000 (1%) $13,586,000 (77%) $471,000 (3%)
$400,000 (2%) $1,372,000 (8%)
Job Training
$352,000 (2%)
Education/Marketing/Outreach
$857,000 (5%)

NH Greenhouse Gas Emissions Reduction Fund Year 1 (July 2009 – June 2010) Evaluation
11
3.2 Energy Impacts
3.2.1 Fuel Reductions The 2009 GHGERF grants have already reduced energy use significantly during the first year (Table 8).
Ten projects had produced measurable energy savings as of June 30, 2010. Out of the remaining projects that include a direct energy reduction component (installations/retrofits in our framework terminology), six were still in progress and one had not produced any measurable savings. It is also
important to note that none of these projects had a full year of emissions reduction activity between the completion of their installation/retrofit and June 30, 2010. Several of the installations/retrofits were only operational for a few months following project completion and before the end of the reporting to
accumulate energy savings. These actual energy savings are not projected and are based on verified reporting of energy reductions for this annual reporting period (Table 8). They also are not annualized or stated on a lifetime basis.
Table 8: Actual energy reductions by fuel type from July 2009 to June 2010 for 2009 grants
Name Electric (kWh)
Oil (Gallons)
Natural Gas (Therms)
Propane (Gallons
MMBTU
Energy Cost Savings
CO2 (metric tons)
Verification
Crotched Mountain Rehabilitation Facilty
-‐
19,100
-‐
-‐
2,649 $57,109 194 CSNE
Foss Manufacturing -‐ NH BFA
-‐
3,572
19,618
-‐
2,510 $43,274 140 CSNE
Fraser NH -‐
-‐
-‐
-‐
0 $0 0 CSNE
LighTec, Inc. 202,200
-‐
-‐
-‐
690 $33,434 100 Self
NH Electric Utilities -‐ RECORE
7,145,417
24,532
12,027
21,558
30,992 $1,280,230 3,960 Self
NH Institute of Art 152,195
-‐
-‐
-‐
519 $25,165 75 3rd Party
Plymouth Area Renewable Energy Initiative
600
83 $1,794 6 Self
SAU 46/Merrimack Valley School District
33,700
-‐
3,050
-‐
428 $10,640 33 CSNE
Stonyfield Farm -‐
-‐
15,531
-‐
1,595 $25,803 82 Self & 3rd Party
Town of Fremont -‐
3,550
-‐
-‐
492 $10,615 36 CSNE
Town of Gorham 3,100
430 $9,269 31 CSNE
Total 7,533,512 54,454 50,226 21,558 40,390 $1,497,332 4,658
NH Greenhouse Gas Emissions Reduction Fund Year 1 (July 2009 – June 2010) Evaluation
12
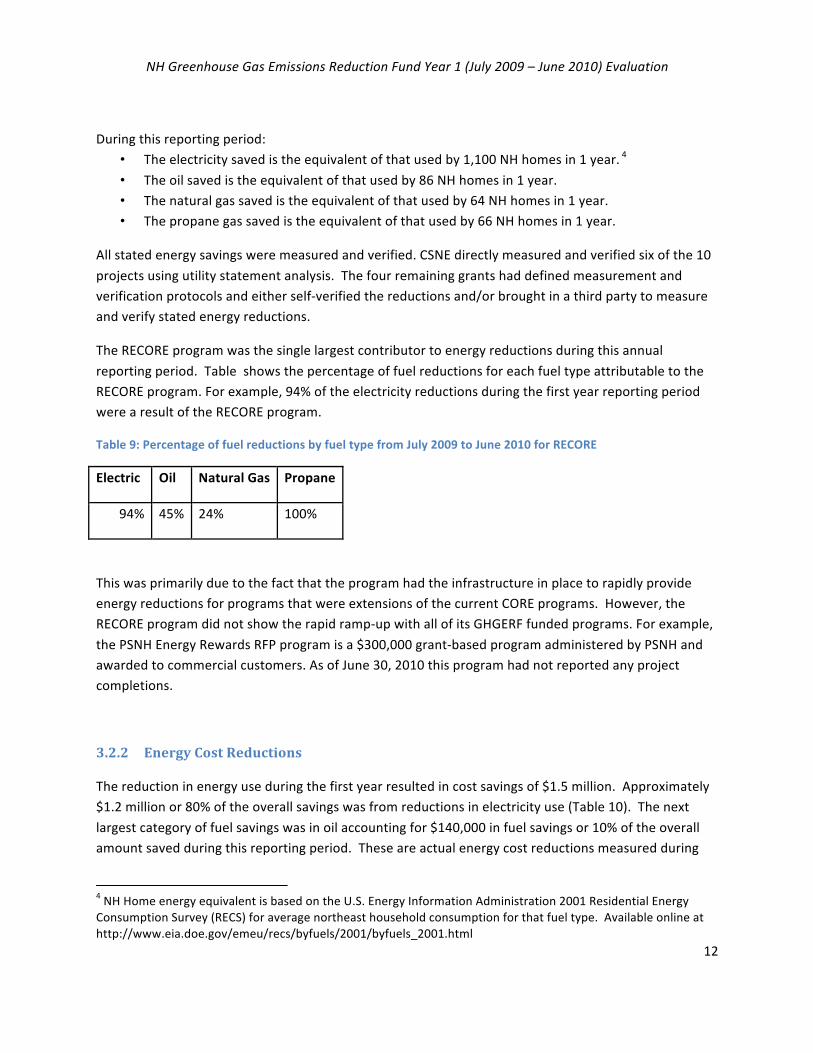
During this reporting period: • The electricity saved is the equivalent of that used by 1,100 NH homes in 1 year. 4
• The oil saved is the equivalent of that used by 86 NH homes in 1 year. • The natural gas saved is the equivalent of that used by 64 NH homes in 1 year. • The propane gas saved is the equivalent of that used by 66 NH homes in 1 year.
All stated energy savings were measured and verified. CSNE directly measured and verified six of the 10
projects using utility statement analysis. The four remaining grants had defined measurement and verification protocols and either self-‐verified the reductions and/or brought in a third party to measure and verify stated energy reductions.
The RECORE program was the single largest contributor to energy reductions during this annual
reporting period. Table shows the percentage of fuel reductions for each fuel type attributable to the RECORE program. For example, 94% of the electricity reductions during the first year reporting period were a result of the RECORE program.
Table 9: Percentage of fuel reductions by fuel type from July 2009 to June 2010 for RECORE
Electric Oil Natural Gas Propane
94% 45% 24% 100%
This was primarily due to the fact that the program had the infrastructure in place to rapidly provide energy reductions for programs that were extensions of the current CORE programs. However, the RECORE program did not show the rapid ramp-‐up with all of its GHGERF funded programs. For example,
the PSNH Energy Rewards RFP program is a $300,000 grant-‐based program administered by PSNH and awarded to commercial customers. As of June 30, 2010 this program had not reported any project completions.
3.2.2 Energy Cost Reductions
The reduction in energy use during the first year resulted in cost savings of $1.5 million. Approximately $1.2 million or 80% of the overall savings was from reductions in electricity use (Table 10). The next
largest category of fuel savings was in oil accounting for $140,000 in fuel savings or 10% of the overall amount saved during this reporting period. These are actual energy cost reductions measured during
4 NH Home energy equivalent is based on the U.S. Energy Information Administration 2001 Residential Energy Consumption Survey (RECS) for average northeast household consumption for that fuel type. Available online at http://www.eia.doe.gov/emeu/recs/byfuels/2001/byfuels_2001.html

NH Greenhouse Gas Emissions Reduction Fund Year 1 (July 2009 – June 2010) Evaluation
13
this time period and are not annual or lifetime estimates. The future annual energy cost reductions attributable to the grants awarded in 2009 will be higher as: 1) many projects were completed in 2010
Q1 & Q2, and 2) Additional projects that are scheduled to completed in 2010 Q3 & Q4 and 2011 Q1 & Q2 report results.
Table 10: Energy cost reductions by fuel type from July 2009 to June 2010 for grants awarded in 2009.
Electric Oil Natural Gas Propane Total
$1,175,000 $142,000 $69,000 $59,000 $1,446,000
This report did not attempt to estimate indirect avoided energy cost brought on through the reduction of energy use. These include avoided electrical capacity costs, reduced price of energy due to lower
demand, and avoided environmental externalities. While it was outside the scope of this annual report to try to quantify the indirect avoided costs associated with the grants awarded in 2009, it is important to mention that there are benefits which accrue to all energy users in regards to reductions in energy
use from the grants awarded through GHGERF. Future annual reports will include indirect avoided costs in the statement of economic impacts.
Key findings from a study performed by Synapse Economics, “Electricity Energy Efficiency Benefits of RGGI Proceeds” were that, in 2009, the 10 RGGI participating states invested an estimated $295 million
in RGGI carbon dioxide allowance proceeds in energy efficiency programs. Those programs will save more than $443 million in avoided electricity costs over the lifetime of the installed measures and electricity savings range from $2.17 to $3.76 for every dollar of program cost for electricity sector
energy efficiency programs.5
3.3 Economic Impact For this reporting period and this first report the only area of economic impact assessed is employment impacts from the awarded grants. This is a very limited short term perspective of the overall economic
impact of the GHGERF program. The grant recipients did a reasonable job of reporting work hours but, as this was a new program, reporting was not consistent or specific enough with respect to expenditures to allow for a systematic and broader measure of economic impact. Therefore, direct employment
impact was well measured and documented, but indirect and induced economic impacts were not well quantified. Economic modeling was used to provide an estimate of jobs in the broader economy supported by the jobs directly measured from the grants.
5 “Electrical Energy Efficiency Benefits of RGGI Proceeds,” Synapse Economics, October 2010, Available online at http://www.synapse-‐energy.com/Downloads/SynapseReport.2010-‐10.RAP.EE-‐Benefits-‐of-‐RGGI-‐Proceeds.10-‐027.pdf
NH Greenhouse Gas Emissions Reduction Fund Year 1 (July 2009 – June 2010) Evaluation
14
Economic impacts are generally classified in the following ways:
1. Direct Impacts -‐ Direct impacts are the employment and local capital expenditures necessary to support the projects being evaluated. This can include contractors installing energy efficiency technology, professionals providing audit services, and other types of work required to execute the grants.
2. Indirect Impacts -‐ Indirect impacts are the increased employment and economic activity brought on by the expenditures of firms that are directly involved in the projects. This could include wholesale merchants, maintenance professionals, trucking services, and other services.
3. Induced Impacts -‐ Induced impacts are the increased employment and economic activity
brought on through the expenditure of income and earnings in the broader local economy by individuals directly and indirectly employed by the projects and increased expenditures by members of the local community as a result of the project. This can include expenditures in the local retail sector on goods and services including: food, clothes, utilities, transportation, recreation, medical care, and childcare.
3.3.1 Employment
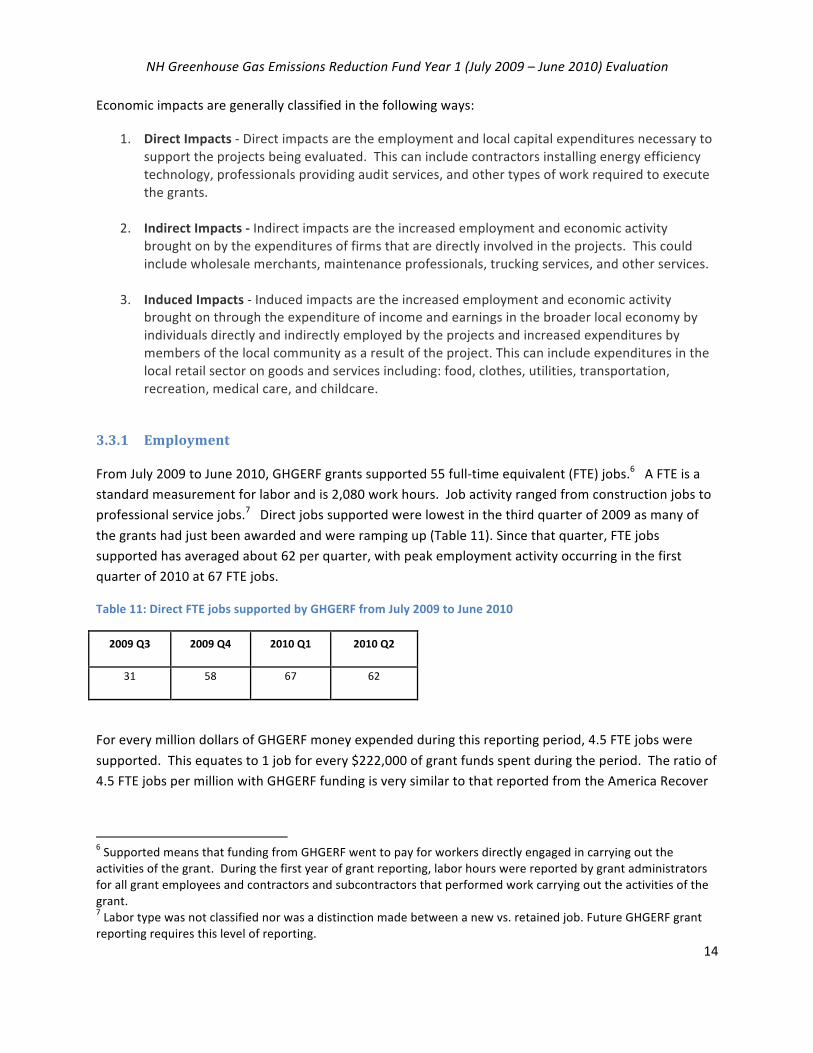
From July 2009 to June 2010, GHGERF grants supported 55 full-‐time equivalent (FTE) jobs.6 A FTE is a standard measurement for labor and is 2,080 work hours. Job activity ranged from construction jobs to professional service jobs.7 Direct jobs supported were lowest in the third quarter of 2009 as many of
the grants had just been awarded and were ramping up (Table 11). Since that quarter, FTE jobs supported has averaged about 62 per quarter, with peak employment activity occurring in the first quarter of 2010 at 67 FTE jobs.
Table 11: Direct FTE jobs supported by GHGERF from July 2009 to June 2010
2009 Q3 2009 Q4 2010 Q1 2010 Q2
31 58 67 62
For every million dollars of GHGERF money expended during this reporting period, 4.5 FTE jobs were
supported. This equates to 1 job for every $222,000 of grant funds spent during the period. The ratio of 4.5 FTE jobs per million with GHGERF funding is very similar to that reported from the America Recover
6 Supported means that funding from GHGERF went to pay for workers directly engaged in carrying out the activities of the grant. During the first year of grant reporting, labor hours were reported by grant administrators for all grant employees and contractors and subcontractors that performed work carrying out the activities of the grant. 7 Labor type was not classified nor was a distinction made between a new vs. retained job. Future GHGERF grant reporting requires this level of reporting.

NH Greenhouse Gas Emissions Reduction Fund Year 1 (July 2009 – June 2010) Evaluation
15
and Reinvestment Act funding from the Department of Energy, which recorded 4.4 FTE jobs per million spent or 1 job for every $229,000 spent.8
Utilizing economic modeling and the number of jobs supported directly by the grants, it is estimated
that an additional 15 to 30 jobs resulted (both indirect and induced) in the NH economy. This brings the total jobs impacted by GHGERF during this reporting period to 70 to 85 FTE jobs.
This employment impact from GHGERF is modest, but in-‐line with expectations. In 2008, an economic impact study of RGGI on NH performed by the University of New Hampshire projected that in 2009, the
job impact from NH participating in RGGI, if 100% of funding went to energy efficiency would result in job creation of 68 FTEs. 9
While job reporting during this first reporting period was not detailed enough to allow for a more detailed breakdown of types of labor supported, refinements have been made to the reporting process
to allow for more detailed labor descriptions in the next annual report.
3.3.2 Other Economic Impacts As discussed previously, grant reporting during this annual reporting period was not consistent enough to allow for comprehensive analysis of local economic benefits; refinements have been made to the
reporting process to allow for more detailed measurement of direct and indirect economic impacts resulting from grant activity.
3.4 Environmental Impacts During the first annual reporting period, CO2 emissions were reduced by 4,600 metric tons. This is actual
verified reductions from grants and does not include any estimated indirect reductions. Indirect reductions are reductions in energy use that are supported by all of the areas discussed in the Energy Efficiency Program Framework with the exception of installations/retrofits. This includes areas of
benchmarking, auditing, measurement, job training, and education and outreach.
The 4,600 metric tons are the actual CO2 emissions reduced during this annual reporting period. It is not an estimated annual or lifetime CO2 emissions reduction estimate. It is important to note that CO2
emissions reductions will be higher in subsequent years for reasons discussed in Section 4. The achieved
reduction is the equivalent of reducing to zero emissions 900 cars in NH for 1 year.
8 DOE ARRA Reporting, as of December 2010. 9 Gittell & Magnusson, “Economic Impact in New Hampshire of the Regional Greenhouse Gas Initiative (RGGI): An Independent Assessment,” Table 31, University of New Hampshire, January 2008.

NH Greenhouse Gas Emissions Reduction Fund Year 1 (July 2009 – June 2010) Evaluation
16
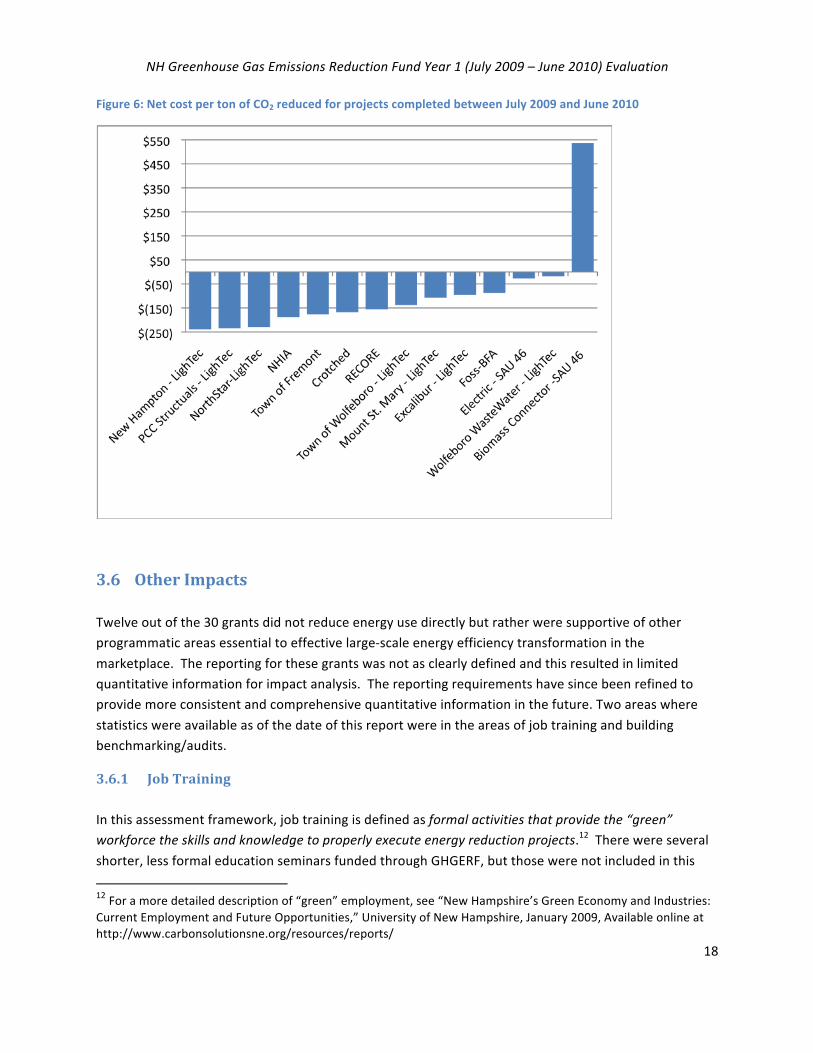
3.5 Net Cost per Ton To provide a relevant comparison of the cost effectiveness of projects in reducing greenhouse gas emissions (and as a proxy, energy savings), net cost per metric ton of CO2 emissions reduced was
calculated for 14 installations funded by GHGERF during this reporting period (Table 12, Figure 6). Net cost per ton is the cost of the measure minus energy savings divided by the amount of CO2 emissions reduced.
Net cost per ton was not calculated for Fraser Paper as this project produced no measurable energy
savings between the project completion in the first quarter of 2010 and June 2010. The Town of Gorham project did not have a net cost per ton calculated either as it did not fully utilize its new wood pellet boiler that was funded by GHGERF during the reporting period. Furthermore, SAU 46 was
separated out into two separate components (electric retrofit and biomass interconnection), primarily for illustrative purposes of how individual components of an overall project can have very different net costs per ton of CO2 reduced.
Thirteen of the 14 projects analyzed—the biomass connection for SAU 46 was the only exception— had
a negative net cost per ton of CO2 reduced. A negative cost per ton means that the energy savings were higher than the cost of the installation and that the project overall saves money when taking into account the lifetime of the project. The biomass connector for SAU 46 had a net cost per ton reduced of
$536.As a point of reference, the RECORE program was considered in its entirety and had a net cost of -‐$156 per ton.10
10 The RECORE program was a composite of many energy reduction programs. This net cost per ton is calculated based on the aggregate cost and energy savings for all projects completed during the first year reporting period.

NH Greenhouse Gas Emissions Reduction Fund Year 1 (July 2009 – June 2010) Evaluation
17
Table 12: Net cost per ton of CO2 reduced for projects completed between July 2009 and June 201011
Project
Net Cost per Ton of CO2 Reduced
New Hampton -‐ LighTec $ (239)
PCC Structuals -‐ LighTec $ (235)
NorthStar-‐LighTec $ (230)
NHIA $ (188)
Town of Fremont $ (177)
Crotched Mountain $ (168)
RECORE $ (156)
Town of Wolfeboro -‐ LighTec $ (138)
Mount St. Mary -‐ LighTec $ (107)
Excalibur – LighTec $ (96)
Foss-‐BFA $ (88)
Electric -‐ SAU 46 $ (27)
Wolfeboro WasteWater -‐ LighTec $ (18)
Biomass Connector -‐SAU 46 $ 536
Fraser Paper N/C
Gorham Fire Department N/C
11 Parenthesis around the numbers indicates a negative net cost per ton or a net savings when taking into account project lifetime. N/C means not calculated.
NH Greenhouse Gas Emissions Reduction Fund Year 1 (July 2009 – June 2010) Evaluation
18
Figure 6: Net cost per ton of CO2 reduced for projects completed between July 2009 and June 2010
3.6 Other Impacts Twelve out of the 30 grants did not reduce energy use directly but rather were supportive of other programmatic areas essential to effective large-‐scale energy efficiency transformation in the
marketplace. The reporting for these grants was not as clearly defined and this resulted in limited quantitative information for impact analysis. The reporting requirements have since been refined to provide more consistent and comprehensive quantitative information in the future. Two areas where
statistics were available as of the date of this report were in the areas of job training and building benchmarking/audits.
3.6.1 Job Training In this assessment framework, job training is defined as formal activities that provide the “green” workforce the skills and knowledge to properly execute energy reduction projects.12 There were several
shorter, less formal education seminars funded through GHGERF, but those were not included in this
12 For a more detailed description of “green” employment, see “New Hampshire’s Green Economy and Industries: Current Employment and Future Opportunities,” University of New Hampshire, January 2009, Available online at http://www.carbonsolutionsne.org/resources/reports/

NH Greenhouse Gas Emissions Reduction Fund Year 1 (July 2009 – June 2010) Evaluation
19
specific measure of training. A more formal reporting of total educational opportunities is expected to be a part of future annual reports. In this annual report, “training” was defined as rigorous, in-‐depth
classes that consisted of a day or more of instruction and provided specific energy reduction skill development.
Three grants funded formal training: Department of Resources & Economic Development – Lakes Regional Community College (DRED-‐LRCC), Home Builders & Remodelers Association of NH (HBRANH),
and the Plymouth Area Renewable Energy Initiative (PAREI) (Table 13). Of the three, DRED-‐LRCC and HBRANH were specifically focused on workforce development, while PAREI included a training component for developing its member-‐based workforce. GHGERF supported a total of 12 formal
training opportunities (courses) and resulted in 170 workers receiving formal training over 5,600 contact hours, or about 32 hours of training on average per worker. Eight of the courses were Building Performance Institute (BPI) Building Analyst (energy auditor training) and four of the courses related to
the National Association of Home Builders Green Building Standard.
Table 13: Training provided from July 2009 to June 2010
Grant
Total Grant Award
Amount Invoiced as of June 30, 2010
Courses Workers Trained
Contact Hours
Average Funds Spent per Worker Trained
Average GHGERF Funds per Contact Hour
Home Builders & Remodelers Assn of NH (HBRANH) 13
$178,169 $125,467 4 45 600 $2,788 $209
Dept of Resources & Economic Development, Lakes Region Community College (DRED-‐LRCC)
$174,000 $82,412 7 120 4800 $687 $17
Plymouth Area Renewable Energy Initiative (PAREI) 14
$99,250 $85,162 1 5 200 n/a n/a
Total 12 170 5600
3.6.2 Benchmarking and Audits Another significant area of activity and a key component of initiating energy reduction installations are
benchmarking and audits (Table 14). Benchmarking is a less time-‐consuming and lower cost process which relies on utility statement analysis to determine a building’s energy use relative to other buildings with similar use. The Environmental Portfolio Agency (EPA) Portfolio Manager tool is a commonly used
benchmarking tool in the commercial sector. Benchmarking is a tool to identify buildings that have above average energy demands and that may be better candidates for cost effective
13 The HBRANH grant also had a secondary focus on building public awareness of green buildings, but its primary focus was on workforce development and specifically training construction workers to the National Association of Homebuilders Certified Green Professional Designation. 14 Only a small amount of the overall grant to the Plymouth Area Renewable Energy Initiative went to workforce training and that was not the main focus of this grant. The grants to HBRANH and DRED-‐LRCC were primarily focused on workforce development and the grant funds per worker and grant funds per contact hour are more meaningful metrics.
NH Greenhouse Gas Emissions Reduction Fund Year 1 (July 2009 – June 2010) Evaluation
20
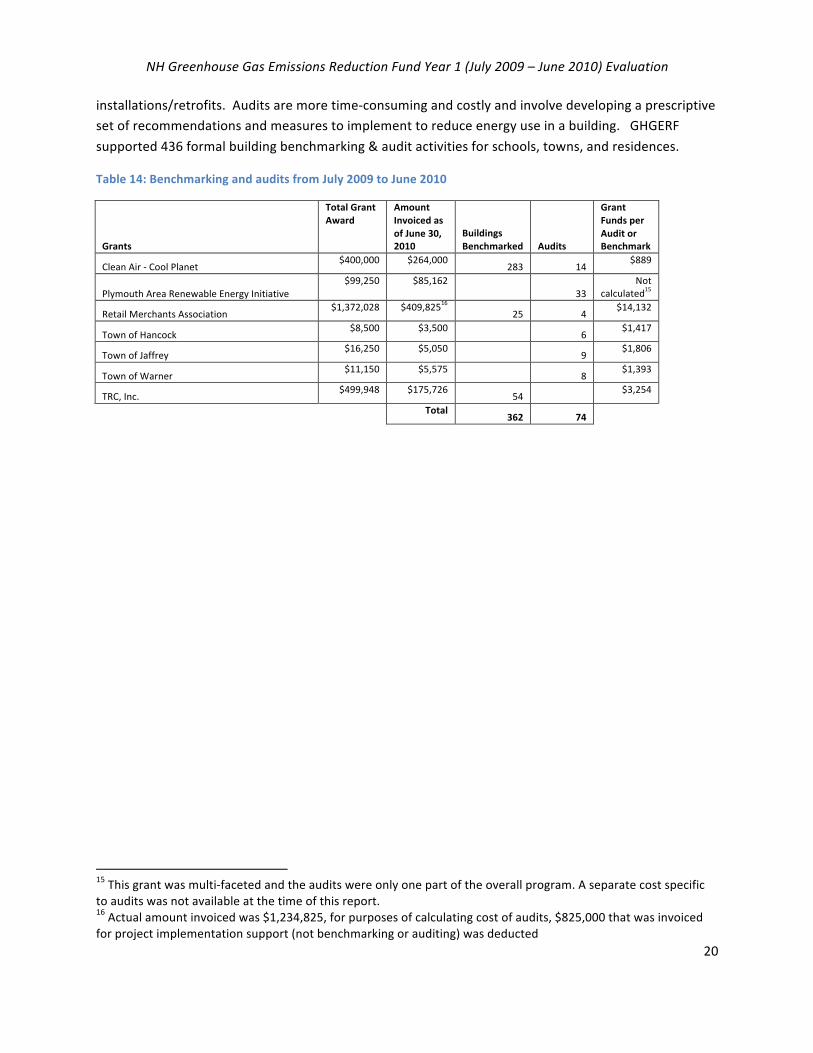
installations/retrofits. Audits are more time-‐consuming and costly and involve developing a prescriptive set of recommendations and measures to implement to reduce energy use in a building. GHGERF
supported 436 formal building benchmarking & audit activities for schools, towns, and residences.
Table 14: Benchmarking and audits from July 2009 to June 2010
Grants
Total Grant Award
Amount Invoiced as of June 30, 2010
Buildings Benchmarked Audits
Grant Funds per Audit or Benchmark
Clean Air -‐ Cool Planet $400,000 $264,000
283 14 $889
Plymouth Area Renewable Energy Initiative $99,250 $85,162
33 Not
calculated15
Retail Merchants Association $1,372,028 $409,82516
25 4 $14,132
Town of Hancock $8,500 $3,500
6 $1,417
Town of Jaffrey $16,250 $5,050
9 $1,806
Town of Warner $11,150 $5,575
8 $1,393
TRC, Inc. $499,948 $175,726
54 $3,254
Total
362 74
15 This grant was multi-‐faceted and the audits were only one part of the overall program. A separate cost specific to audits was not available at the time of this report. 16 Actual amount invoiced was $1,234,825, for purposes of calculating cost of audits, $825,000 that was invoiced for project implementation support (not benchmarking or auditing) was deducted

NH Greenhouse Gas Emissions Reduction Fund Year 1 (July 2009 – June 2010) Evaluation
21
4 GHGERF Energy Reduction Projections Projects completed during the first year reporting period and completed or scheduled to be completed
during the second reporting period (July 2010 to June 2011) will result in annual energy savings of $4.2 million in energy costs and reduced CO2 emissions reductions of 13,200 metric tons (Table 15). 17 This is the equivalent of taking 2,500 cars off of the road for one year.
Table 15: Projected energy savings for second reporting period (July 2010 to June 2011)
Fuel Type Energy Reduced MMBTU
Equivalent Annual NH Household Usage
Energy Savings ($ millions)
CO2 reduced (metric tons)
Electric 18.5 million (kWh) 63,100 2,650 $2.9 9,100
Oil 98.5 thousand (gallons) 13,700 155 $0.3 1,000
Natural Gas 484 thousand (therms) 49,700 620 $0.7 2,570
Propane 97 thousand (gallons) 8,900 300 $0.3 560
Total 135,400 3,725 $4.2 13,230
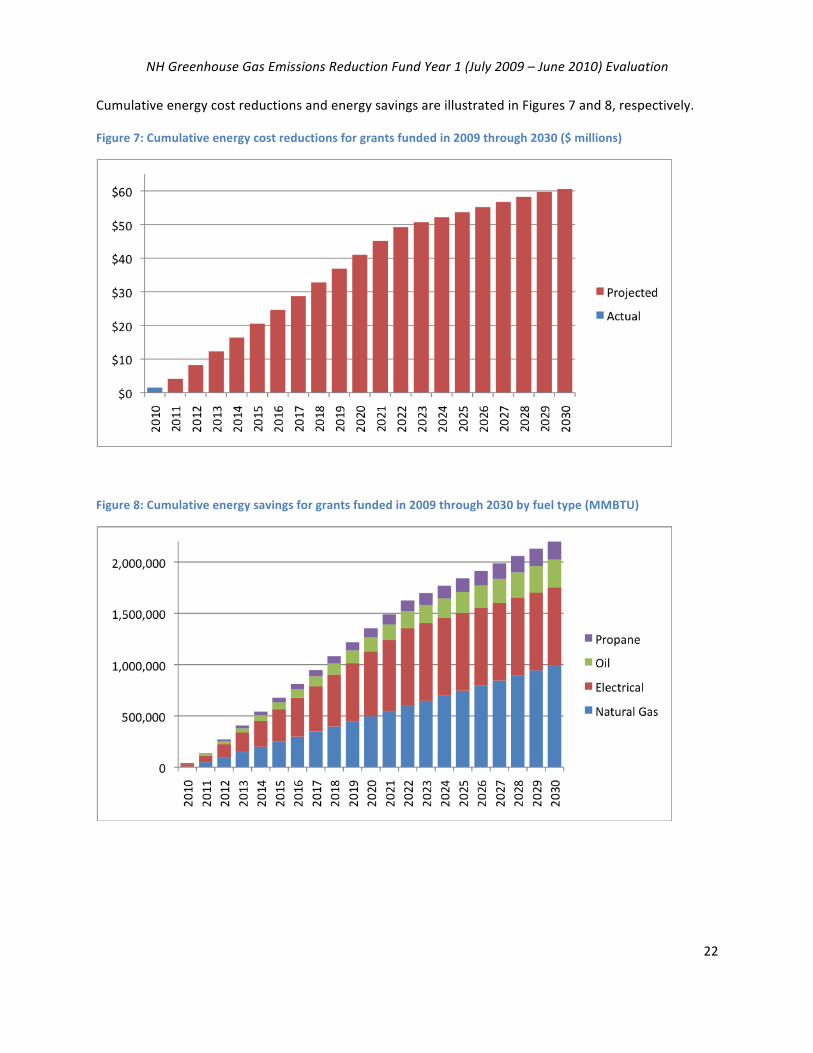
Lifetime savings due to grants funded by the $17.7 million awarded through GHGERF are $60.6 million in
reduced energy costs (at current energy prices) and CO2 emissions are estimated to be reduced by 200,000 metric tons (Table 16).18 This is the equivalent to taking 38,500 cars off of the road for one year.
Table 16: Projected lifetime energy savings for projects completed at the end of the second reporting period
Fuel Type Energy Reduced MMBTU
Equivalent Annual NH Household Usage
Energy Savings ($ millions)
CO2 reduced (metric tons)
Electric 253.5 million (kWh) 863,300 36,200 $39.5 124,740
Oil 1.7 million (gallons) 235,800 2,600 $4.4 17,300
Natural Gas 9.5 million (therms) 975,700 12,200 $13.2 50,400
Propane 1.3 million (gallons) 119,000 3,900 $3.5 7,480
Total 2,193,800 54,900 $60.6 199,920
17 Energy projections for the second annual reporting period were based on three separate calculations: 1) Energy savings for completed projects obtained during this reporting period and assumed to continue into the second reporting period, 2) Energy savings for projects completed between July 1, 2010 and October 31, 2010; 3) Estimated savings (from audits or similar analysis) from projects completed or known to be completed between November 1, 2010 and March 1, 2011. 18 Lifetime savings was calculated by extrapolating energy savings calculated for the second annual reporting period over the assumed project lifetime. Electrical projects were assumed to have a lifetime of 13 years and building shell improvements and mechanical system upgrades were assumed to have a lifetime of 20 years.
NH Greenhouse Gas Emissions Reduction Fund Year 1 (July 2009 – June 2010) Evaluation
22
Cumulative energy cost reductions and energy savings are illustrated in Figures 7 and 8, respectively.
Figure 7: Cumulative energy cost reductions for grants funded in 2009 through 2030 ($ millions)
Figure 8: Cumulative energy savings for grants funded in 2009 through 2030 by fuel type (MMBTU)

NH Greenhouse Gas Emissions Reduction Fund Year 1 (July 2009 – June 2010) Evaluation
23
5 Discussion
The 30 grants awarded from GHGERF in a competitive process in 2009 met a wide range of needs in the energy efficiency marketplace and served a broad group of energy consumers across the State of New
Hampshire. This first year of grant activity delivered real energy use reductions and also provided employment impact through the direct support of 55 full time equivalent jobs, and 15-‐30 indirect and induced time equivalent jobs, for a total of 70 to 85 FTE jobs from July 2009 to June 2010. GHGERF also
funded low-‐interest loans through the Business Finance Authority to two manufacturers employing a total of more than 400 workers. As is expected with any program start-‐up, the first year was a learning and program development period. It took several months for the grants to build capacity to provide
energy efficiency services in the state.
A key finding from the first year of this program is the significant benefits in inspiring innovation and learning how best to encourage energy efficiency in New Hampshire. The message from grant recipients was the value of GHGERF in funding areas and opportunities that have been missed under the energy
efficiency programs in NH prior to GHGERF. Related to this was the flexibility that GHGERF offered to allow grants to implement innovative approaches to reducing energy usage in NH.
While the focus of this report is on the period of time between July 2009 and June 2010, it is important to note that the six grants awarded in 2010 (two of them continuation of grants from the 2009 award
pool –NH Business Finance Authority, and Retail Merchants Association of NH) have already demonstrated a marked level of improvement in organization and sophistication in relation to the previous year’s grants. These new grants should build on the lessons learned during the first year of the
grant program (as would be expected from program start-‐ups). Specifically these new grants build on the importance of guiding and educating the end use customers and minimizing the barriers to implementation of energy reduction technologies. In addition, these grants have more sophisticated
reporting requirements and protocols that will allow for an even greater degree of reporting on energy, economic, and environmental impacts of future evaluations of GHGERF programs.

NH Greenhouse Gas Emissions Reduction Fund Year 1 (July 2009 – June 2010) Evaluation
24
6 Appendix A: 2009 Grants Grant Proposal Description Duration
(Years) Award Amount
CSNE Classification Primary Target Market
Status as of 30 June 2010
Crotched Mtn Rehabilitation Ctr
Upgrade the heating distribution and control system of a building whose residents are mainly low-‐income
1 $176,531 Installations Non-‐Profit Completed -‐2009 Q4
Fraser NH LLC The Fraser paper mill in Gorham will utilize reuse of hot water, hot air and condensate to reduce usage of #6 oil by 729,000 gallons per year through 5 specific projects.
1 $470,000 Installations Commercial & Industrial
Completed -‐ 2010 Q1
NH Institute of Art
Install geothermal heating and cooling system, premium building envelope measures, and a vegetated roof.
2 $146,060 Installations Non-‐Profit Completed -‐ 2009 Q4
SAU 46/Merrimack Valley School District
Connect its office building to an existing, central biomass plant that is already providing heat to three nearby schools, and will upgrade lighting fixtures, compressors, air handlers and controls to reduce the use of electricity and natural gas.
1 $83,685 Installations K-‐12 School Completed -‐ 2009 Q4
Town of Fremont
The Fremont Safety Complex will be retrofitted by adding insulation to ceiling areas and performing air sealing to eliminate leaks.
1 $8,000 Installations Municipal Completed -‐2010 Q1
Town of Gorham
Replace the heating system in the Gorham Fire Station by installing a high-‐efficiency oil furnace and a wood pellet boiler
1 $26,000 Installations Municipal Completed -‐2010 Q1
Town of Hancock
Energy audits will be performed in each of the town’s 8 municipal buildings
1 $8,500 Audits Municipal Completed -‐2010 Q1
Town of Warner Energy audits will be performed in each of the town’s 13 municipal buildings
1 $11,150 Audits Municipal Completed -‐2010 Q1
Business Finance Authority of NH
Establish a revolving loan fund to help businesses finance energy efficiency improvements.
1 $2,000,000 Installations Commercial & Industrial
On-‐going
Chosen Vale Inc dba Enfield Shaker Mus
The Great Stone Dwelling will be retrofitted. The Museum will also create an educational exhibit on saving energy and reducing greenhouse gas emissions.
1 $51,354 Installations Non-‐Profit On-‐going
City of Rochester
Install equipment to reduce energy demand at the city’s Wastewater Treatment Facility.
2 $394,000 Installations Municipal On-‐going

NH Greenhouse Gas Emissions Reduction Fund Year 1 (July 2009 – June 2010) Evaluation
25
Grant Proposal Description Duration (Years)
Award Amount
CSNE Classification Primary Target Market
Status as of 30 June 2010
Clean Air-‐Cool Planet
Provide 24 to 48 NH towns with baseline energy information, specific recommendations and on-‐going support necessary to renovate their most inefficient municipal buildings
1 $400,000 Benchmarking/Audits Municipal On-‐going
Dartmouth College
Implement a Campus Energy and Sustainability Management system to achieve improved building energy performance, campus smart-‐grid technology, and innovative energy feedback systems.
2 $330,936 Measurement Higher Ed On-‐going
DRED -‐ Division of Economic Development
Partner with Lakes Region Community College (LRCC) to develop a new training program to help develop a skilled labor force for energy efficiency improvements to buildings
2 $174,000 Training Workforce On-‐going
Home Builders & Remodelers Assn of NH
Provide training to building professionals and educate homeowners, buyers and occupants.
2 $178,169 Training Workforce On-‐going
LighTec Inc Install high efficiency lighting systems in 16 schools and town buildings across the state.
2 $316,000 Installations Commercial & Industrial
On-‐going
NH Community Development Finance Auth
Establish a revolving loan fund to finance energy improvements in municipal buildings.
2 $1,500,000 Installations Municipal On-‐going
No Country Res Cons & Dev Area Council
Conduct outreach to NH communities and organizations seeking to pursue district heat/power biomass systems.
1 $43,850 Education/ Outreach
Municipal On-‐going
Plymouth Area Renewable Energy Initiative
Expand its successful “Energy Raiser” programs to provide homeowners with the technical information and volunteer support to install solar hot water systems and to weatherize homes. 10 homes will be weatherized and 10 will have solar hot water systems installed. 5 will receive refrigerator replacements.
1 $99,250 Installations Residential On-‐going
Propell Energy Install a high efficiency wood pellet boiler in New England College’s Science Building.
1 $49,885 Installations Non-‐Profit On-‐going
RECORE -‐ NH Electric Utilities
National Grid, NH Electric Co-‐op, PSNH, and Unitil will expand the CORE Efficiency Programs by increasing the budget for current programs and adding new program elements.
2 $7,646,020 Installations Residential, Commercial & Industrial
On-‐going

NH Greenhouse Gas Emissions Reduction Fund Year 1 (July 2009 – June 2010) Evaluation
26
Grant Proposal Description Duration (Years)
Award Amount
CSNE Classification Primary Target Market
Status as of 30 June 2010
Retail Merchants Assn of NH
Create an energy efficiency program for RMA members and other similarly situated businesses that includes audits and project financing.
1 $1,372,028 Audits/ Installations
Commercial & Industrial
On-‐going
So NH Conservation & Development Area Council
Known as the New Hampshire Farm Energy Initiative, this program will provide up to 10 workshops on energy efficiency to agricultural business owners and operators. In addition, the initiative will provide comprehensive energy audits to 25 farms
1 $87,000 Audits Agriculture On-‐going
Stonyfield Farm Inc
Install a variety of measures that will reduce energy consumption at their plant in Londonderry.
1 $148,927 Installations Commercial & Industrial
On-‐going
Town of Jaffrey Energy audits will be performed in each of the town’s 16 municipal buildings
1 $16,250 Audits Municipal On-‐going
Town of Temple Perform comprehensive, energy-‐saving retrofits of the Municipal Building and the Mansfield Library, and create several other conservation and outreach programs.
2 $332,100 Installations Municipal On-‐going
Town of Walpole
Perform comprehensive, energy-‐saving retrofits of the Walpole Town Hall and the North Walpole Municipal Building.
1 $138,345 Installations Municipal On-‐going
TRC Companies Launch a benchmarking initiative to measure the energy performance of 250 public K-‐12 schools.
2 $499,948 Benchmarking K-‐12 School On-‐going
UNH-‐ Carbon Challenge
Create a residential energy portal (website) as a central source of sound information on energy efficiency programs, sustainable energy technologies, and available resources and incentives such as rebates and tax incentives. Also provide direct assistance to communities through public presentations, guidance on best practices, and progress reports.
2 $813,402 Education/ Outreach
Residential On-‐going
UNH-‐ Carbon Solutions New England
Track, analyze and report on the results of projects funded by the GHGERF.
1 $139,945 Measurement State Government
New Contract

NH Greenhouse Gas Emissions Reduction Fund Year 1 (July 2009 – June 2010) Evaluation
27
7 Appendix B: Energy Efficiency Program Framework
Figure 9: CSNE Energy Efficiency Program Framework
Table 17: Definitions of Framework Elements
Benchmarking Low cost screening
Audits Intensive Evaluation with clearly defined measures
Installations/Retrofits Installation of measures or technologies to reduce fossil based energy on new or existing buildings
Measurement Recording energy usage to guide future actions
Education/Marketing/Outreach Activities that increase general public awareness of energy related issues with the goal of impacting behavior
Job Training Formal activities that provides the “green” workforce the skills and knowledge to properly execute energy reduction projects
Management Oversight of all aspects of program
The New Hampshire Greenhouse Gas Emissions Reduction Funds | 5
The AuthorsCAmERoN WAkE is a research
associate professor with the Institute
for the Study of Earth, oceans and
Space and the Department of Earth
Sciences at the University of New
Hampshire. Cameron directs an active
research program investigating regional
climate and environmental change
through the analysis of ice cores and instrumental records.
Currently he is leading research programs to assess the impact of
climate change in the Northeast US and to reconstruct climate
change from ice cores recovered from glaciers across the Arctic.
Cameron also directs Carbon Solutions New England a regional
collaboration for a low carbon society. Dr. Wake received a
B.Sc. in Geology (1984) from the University of ottawa, an
m.A. in Geography (1987) from Wilfrid Laurier University, and
a Ph.D. in Geochemical Systems (1993) from the University of
New Hampshire.
mATTHEW mAGNUSSoN is a Research Scientist with Carbon Solutions New England, University of New Hampshire. matt is a graduate of the University of New Hampshire’s Whittemore School of Business and Economics with a masters of Business Administration. He has worked with Professor Ross Gittell to provide analysis
on the economic impacts of several different public policy initiatives in the state of New Hampshire, the Renewal Portfolio Standard (RPS) and the Regional Greenhouse Gas Initiative (RGGI) for the New Hampshire Department of Environment and Services. Their analysis of the policies proposed by the state agencies has been influential in passage of NH state laws implementing those policies. He was part of the economic team estimating the economic costs and benefits of actions proposed in the NH Climate Change Action Plan. He has specific research experience analyzing green job employment in New Hampshire and is a co-author of the report New Hampshire’s Green Economy and Industries: Current employment and future opportunities prepared for the NH Rockingham Economic Development Corporation and the Economic Impact of Granite Reliable Power Wind Power Project in Coos County, New Hampshire, requested by Granite Reliable Power LLC. He is a member of the United States Association for Energy Economics and recently presented at their 28th annual conference.


