The New Priority Ranking Systems for Man-made Slopes and Retaining Walls GEO Report No. 284 P.F.K. Cheng Geotechnical Engineering Office Civil Engineering and Development Department The Government of the Hong Kong Special Administrative Region
Transcript
The New Priority Ranking Systems for Man-made
Slopes and Retaining Walls
GEO Report No. 284
P.F.K. Cheng
Geotechnical Engineering Office Civil Engineering and Development Department The Government of the Hong Kong Special Administrative Region
The New Priority Ranking Systems for Man-made
Slopes and Retaining Walls
GEO Report No. 284
P.F.K. Cheng
This report was originally produced in December 2009 as GEO Special Project Report No. SPR 4/2009
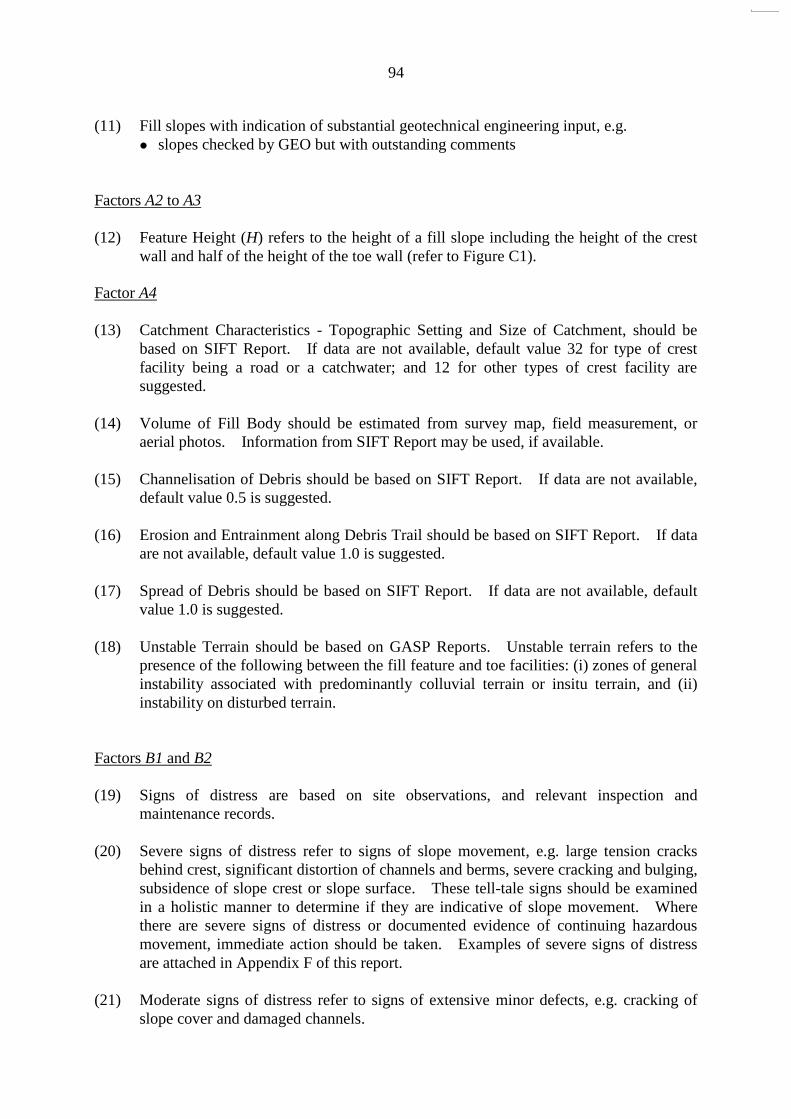
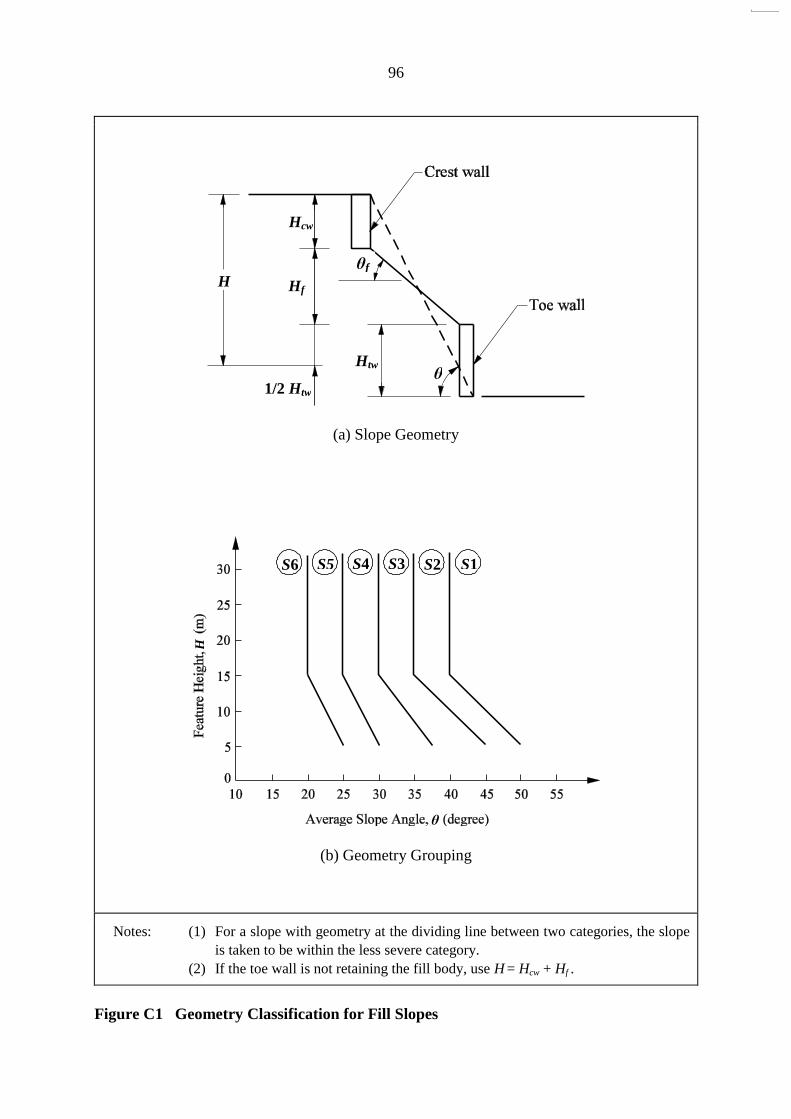
In keeping with our policy of releasing information
which may be of general interest to the geotechnical
profession and the public, we make available selected internal
reports in a series of publications termed the GEO Report
series. The GEO Reports can be downloaded from the
website of the Civil Engineering and Development Department
(http://www.cedd.gov.hk) on the Internet. Printed copies are
also available for some GEO Reports. For printed copies, a
charge is made to cover the cost of printing.
The Geotechnical Engineering Office also produces
documents specifically for publication in print. These include
guidance documents and results of comprehensive reviews.
They can also be downloaded from the above website.
The publications and the printed GEO Reports may be
obtained from the Government’s Information Services
Department. Information on how to purchase these documents
is given on the second last page of this report.
H.N. Wong
Head, Geotechnical Engineering Office
August 2013
4
Foreword
The Government has launched the Landslip Prevention and Mitigation Programme (LPMitP) on a rolling basis to dovetail with the Landslip Preventive Measures (LPM) Programme upon its completion in 2010, to deal with landslide risks associated with the remaining man-made slope features and vulnerable natural hillside catchments.
This report documents the risk-based New Priority
Ranking Systems (NPRS) which have been developed by the Geotechnical Engineering Office (GEO) to allow the ranking of both pre-1978 and post-1978 man-made slopes and retaining walls for priority attention under the LPMitP. The NPRS supersede the New Priority Classification Systems (NPCS), which were previously developed by the GEO for dealing with the high-risk old (i.e. pre-1978) man-made slope features under the 10-year (2000-2010) Extended LPM Programme.
The NPRS were jointly developed by Dr Dominic O.K.
Lo, Ms Patty F.K. Cheng, Mr W.K. Pun and Mr Anthony Y.T. Lam.
A draft of the NPRS was reviewed by the Slope Safety
Technical Review Board (SSTRB) comprising Dr Suzanne Lacasse, Professor Oldrich Hungr and Professor Wang Si-Jing, and their comments and suggestions were incorporated into the NPRS.
This report was compiled by Ms Patty F.K. Cheng under
the supervision of Mr Anthony Y.T. Lam.
Ken. K.S. Ho Chief Geotechnical Engineer/Standards & Testing
5
Abstract
This report documents the New Priority Ranking Systems (NPRS) for man-made slopes and retaining walls. The NPRS are risk-based ranking systems that consider both the likelihood and consequence of slope failures. The NPRS have been developed by the Geotechnical Engineering Office for the individual feature types (viz. soil cut slopes, rock cut slopes, fill slopes and retaining walls) to allow the priority ranking of both pre-1978 and post-1978 man-made slope features under the post-2010 Landslip Prevention and Mitigation Programme (LPMitP).
The likelihood of slope failures is reflected by an
Instability Score, while the consequence of failure is reflected by a Consequence Score. The risk of slope failures is reflected by a Total Score, which is computed as the product of the Instability Score and the Consequence Score.
Instability Score accounts for the instability potential of a
slope feature and its actual performance. The instability potential is assessed by considering the key factors that affect the likelihood of failure. The actual slope performance is manifested as signs of distress where present and records of instability after the slope feature has been formed or treated to its present configuration.
Consequence Score considers the facilities affected in the
event of a slope failure. It takes due account of the type and proximity of the affected facilities, scale and mechanism of failure, together with the topography adjacent to the slope features.
A methodology for combining the Total Score computed
by the individual NPRS is formulated based on the overall risk distribution of the four respective types of slope features, namely soil cut slopes, rock cut slopes, fill slopes and retaining walls. The resultant Ranking Score is unique for each slope feature and can be used for selection of deserving man-made slope features for follow-up action under the LPMitP.
6
Contents
Page No.
Title Page 1 Preface 3 Foreword 4 Abstract 5 Contents 6 List of Tables 8 List of Figures 9 1 Introduction 10 2 New Priority Ranking Systems 10
2.1 The Systems 10
2.2 Selection of Cross-sections of Slope Features 15
2.3 Composite Slope Features 15
2.4 A Stack of Slope Features 18
2.5 Slope Features Requiring Immediate Action 18 3 NPRS for Soil Cut Slopes 18
3.1 The System 18
3.2 Instability Score 18
3.3 Consequence Score 20 4 NPRS for Rock Cut Slopes 20
4.1 The System 20
4.2 Instability Score 22
4.3 Consequence Score 23 5 NPRS for Fill Slopes 23
5.1 The System 23
5.2 Instability Score 24
5.3 Consequence Score 25
7
Page No. 6 NPRS for Retaining Walls 25
6.1 The System 25
6.2 Instability Score 25
6.3 Consequence Score 28 7 Combined Ranking 28 8 References 29 Appendix A: Details of NPRS for Soil Cut Slopes 30 Appendix B: Details of NPRS for Rock Cut Slopes 58 Appendix C: Details of NPRS for Fill Slopes 86 Appendix D: Details of NPRS for Retaining Walls 114 Appendix E: Combined Ranking Methodology 149 Appendix F: Examples of Severe Signs of Distress 173
8
List of Tables
Table No.
Page No.
2.1 Typical Examples of Facilities under Different Facility
Groups Affected by Landslides
13
3.1 Vulnerability Factors for Crest Facilities Involving Soil Cut Slopes, Rock Cut Slopes and Retaining Walls
21
3.2 Vulnerability Factors for Toe Facilities Involving Soil Cut Slopes, Rock Cut Slopes and Retaining Walls
22
5.1 Vulnerability Factors for Crest Facilities Involving Fill Slopes
26
5.2 Vulnerability Factors for Toe Facilities Involving Fill Slopes
27
9
List of Figures
Figure No.
Page No.
2.1 Crest and Toe Facilities Affected by a Slope Feature
12
2.2 Relationship between Facility Groups, Actual AADT and Number of Traffic Lanes
14
2.3 Computation of Ranking Scores for Composite Features Comprising Soil Cut Slope, Rock Cut Slope and Retaining Walls
16
2.4 Computation of Ranking Scores for Composite Features Comprising Fill Slope and Retaining Walls
17
2.5 Computation of Total Score for a Stack of Slope Features
19
10
1 Introduction This report documents the New Priority Ranking Systems (NPRS) which have been developed by the Geotechnical Engineering Office (GEO) for slope selection under the Landslip Prevention and Mitigation Programme (LPMitP). With the completion of the Landslip Preventive Measures (LPM) Programme by 2010, all the high-risk old (i.e. pre-1978) man-made slope features affecting major roads and developments will have been dealt with. To dovetail with the LPM Programme, the Government has launched the LPMitP on a rolling basis, in order to contain the landslide risks associated with the remaining man-made slope features and vulnerable natural hillside catchments. Apart from vulnerable natural hillsides, the LPMitP primarily targets man-made slope features that are of moderate risk, viz. old slopes affecting frequently used road, footpaths, public waiting areas, etc. and post-1978 slopes formed or treated over 20 years ago with non-robust technology, which are denoted as "old technology" slopes1. The NPRS have been formulated for the respective feature types (viz. soil cut slopes, rock cut slopes, fill slopes and retaining walls) to allow the ranking of both pre-1978 and post-1978 man-made slope features for priority attention under the LPMitP. The priority ranking system for vulnerable natural hillside catchments is outside the scope of this report. This report presents the methodology of the NPRS and gives guidance on collection of field data and computation of scores for man-made slope features. Worked examples are also provided in this report. 2 New Priority Ranking Systems
2.1 The Systems The LPM Programme primarily targets high-risk pre-1978 man-made slope features, for which the New Priority Classification Systems (NPCS) were developed by the GEO for priority ranking (Wong, 1998). The LPMitP primarily targets moderate-risk pre-1978 and selected post-1978 man-made slope features. The resolution of the NPCS is not adequate to distinguish the relative risks of a large number of moderate-risk man-made slope features and that the degree of past geotechnical engineering input to post-1978 slopes is not accounted for. Also, further insights have been obtained through GEO’s systematic landslide investigation programme (Ho & Pappin, 2007), which have proved useful for refining selected factors and their weightings in the priority ranking systems. In light of the above, new NPRS were developed by the GEO primarily for use under the post-2010 LPMitP. The NPRS are risk-based ranking systems that consider both the likelihood and the consequence of slope failures. The likelihood of failure is reflected by an Instability Score (IS) while the consequence of failure is reflected by a Consequence Score (CS). Each system for the four types of slope feature is based on the same equation, which computes a Total Score (TS). The TS is the product of IS and CS, i.e.
1 Old technology slopes are formed or treated from 1977 to late 1980s based on knowledge and technology at the time, typically comprise slopes trimmed back to a less steep gradient without the provision of reinforcement or structural support. These slopes are prone to degradation and less robust than those treated with modern technology such as soil nails.
11
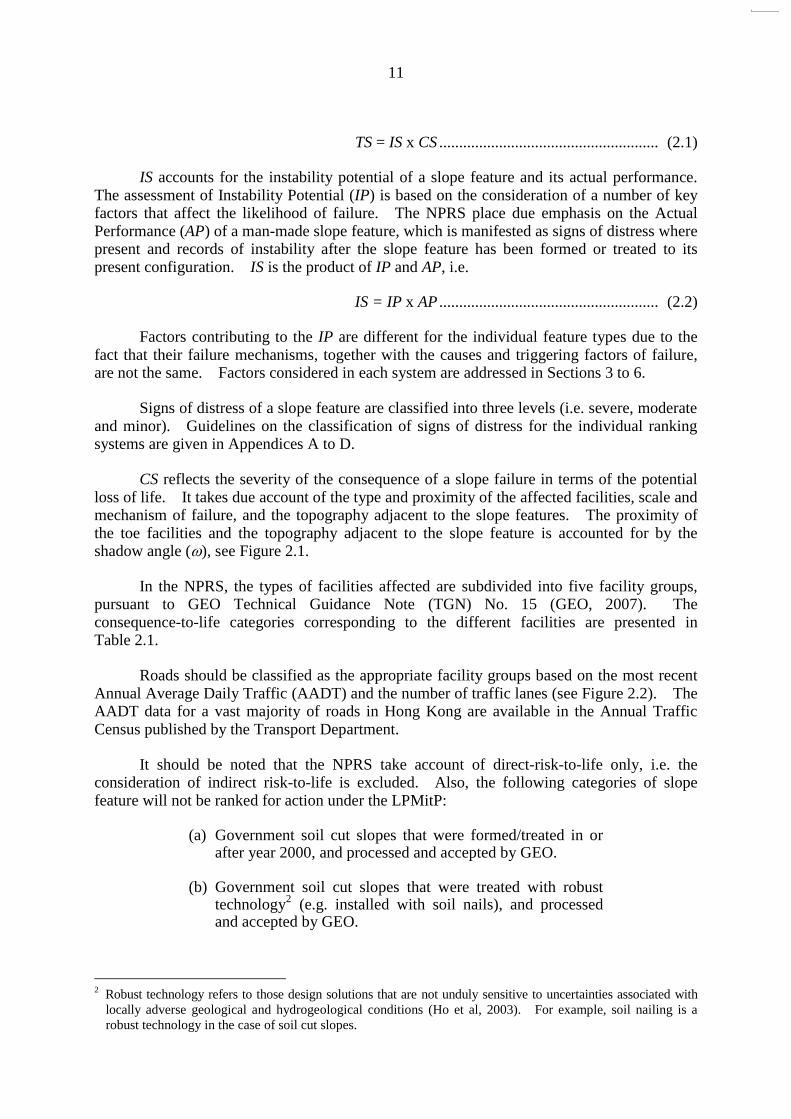
TS = IS x CS ....................................................... (2.1) IS accounts for the instability potential of a slope feature and its actual performance. The assessment of Instability Potential (IP) is based on the consideration of a number of key factors that affect the likelihood of failure. The NPRS place due emphasis on the Actual Performance (AP) of a man-made slope feature, which is manifested as signs of distress where present and records of instability after the slope feature has been formed or treated to its present configuration. IS is the product of IP and AP, i.e. IS = IP x AP ....................................................... (2.2) Factors contributing to the IP are different for the individual feature types due to the fact that their failure mechanisms, together with the causes and triggering factors of failure, are not the same. Factors considered in each system are addressed in Sections 3 to 6. Signs of distress of a slope feature are classified into three levels (i.e. severe, moderate and minor). Guidelines on the classification of signs of distress for the individual ranking systems are given in Appendices A to D. CS reflects the severity of the consequence of a slope failure in terms of the potential loss of life. It takes due account of the type and proximity of the affected facilities, scale and mechanism of failure, and the topography adjacent to the slope features. The proximity of the toe facilities and the topography adjacent to the slope feature is accounted for by the shadow angle (), see Figure 2.1. In the NPRS, the types of facilities affected are subdivided into five facility groups, pursuant to GEO Technical Guidance Note (TGN) No. 15 (GEO, 2007). The consequence-to-life categories corresponding to the different facilities are presented in Table 2.1. Roads should be classified as the appropriate facility groups based on the most recent Annual Average Daily Traffic (AADT) and the number of traffic lanes (see Figure 2.2). The AADT data for a vast majority of roads in Hong Kong are available in the Annual Traffic Census published by the Transport Department. It should be noted that the NPRS take account of direct-risk-to-life only, i.e. the consideration of indirect risk-to-life is excluded. Also, the following categories of slope feature will not be ranked for action under the LPMitP:
(a) Government soil cut slopes that were formed/treated in or after year 2000, and processed and accepted by GEO.
(b) Government soil cut slopes that were treated with robust
technology2 (e.g. installed with soil nails), and processed
and accepted by GEO.
2 Robust technology refers to those design solutions that are not unduly sensitive to uncertainties associated with
locally adverse geological and hydrogeological conditions (Ho et al, 2003). For example, soil nailing is a
robust technology in the case of soil cut slopes.
12
Figure 2.1 Crest and Toe Facilities Affected by a Slope Feature
Facility
Facility
Slope
Height , H o
Cres t Distance
Shadow Angle
D
É ω
Feature height, H
Toe Distance, L
13
Table 2.1 Typical Examples of Facilities under Different Facility Groups Affected by Landslides
Facility Group
Facilities Consequence-
to-life Category
1
(a) Heavily Used Buildings – residential building, commercial office, store and shop, hotel,
factory, school, power station, ambulance depot, market, hospital, polyclinic, clinic, welfare centre
1
(b) Others – cottage, licensed and squatter areas – bus shelter, railway platform and other sheltered public waiting area – dangerous goods storage site (e.g. petrol stations) – road with very heavy vehicular or pedestrian traffic density
2
(a) Lightly Used Buildings – indoor car park, building within barracks, abattoir, incinerator,
indoor games’ sport hall, sewage treatment plant, refuse transfer station, church, temple, monastery, civic centre, manned substation
(b) Others – major infrastructure facility (e.g. railway, tramway, flyover,
subway, tunnel portal, service reservoir) – construction site (if future use not certain)3
– road4 with heavy vehicular or pedestrian traffic density 2
3
– heavily used open space and public waiting area (e.g. heavily used playground, open car park, heavily used sitting out area, horticulture garden)
– road with moderate vehicular or pedestrian traffic density
4
– lightly used open-air recreation area (e.g. district open space, lightly used playground, cemetery, columbarium
– non-dangerous goods storage site – road with low vehicular or pedestrian traffic density 3
5 – remote area (e.g. country park, undeveloped green belt, abandoned
quarry) – road with very low vehicular or pedestrian traffic density
Note: The consequence-to-life category refers to the situation where the facilities are located within the expected travel distance of landslide debris or the expected crest influence zone of a failure. Situations where the CTL category can be downgraded are given in GEO TGN No.15 (GEO, 2007).
3 If the intended future use is known, the Facility Group should be based on the facility that corresponds to the intended future use of the site.
4 For footpaths alongside roads, it may be assumed that footpaths are within the same group as the adjoining
roads, except for Expressway (EX), Urban Trunk Roads (UT) and Rural Trunk Road (RT). Footpaths alongside EX, UT and RT roads may be taken, by default, as a Group 5 facility, unless dictated otherwise by site-specific conditions.
14
Legend:
AADT Annual Average Daily Traffic based on the most recent Annual Traffic Census carried out by the Transport Department
A Princess Margaret Road (from Wylie Road to Pui Ching Road) B Pokfulam Road (from Pokfield Road to Mount Davies Road) C Castle Peak Road (from Sham Tseng to Siu Lam) D Borrett Road E Shouson Hill Road West
Note: Figure extracted from GEO Report No. 68 (Wong, 1998).
Figure 2.2 Relationship between Facility Groups, Actual AADT and Number of Traffic
Lanes
15
(c) Government rock cut slopes, fill slopes and retaining walls that were processed and accepted by GEO.
(d) Private slopes and retaining walls that have been subjected
to GEO Stage 2 studies after 2000, checked by GEO after 2000, checked and upgraded with robust technology, or subjected to DH orders.
Should severe signs of distress or instability be observed on the above slope features, safety nets (e.g. Engineer Inspections (EI), systematic landslide investigation programme, etc.) are available to initiate actions, e.g. urgent repairs and injection into the LPMitP. Similar to NPCS, NPRS are essentially expert formulation systems (Wong, 2005), except for that on rock cut slopes which is an expert judgment system. In the latter system, the inspecting engineers need to exercise judgment in assessing the potential modes of instability and the corresponding probable scale of failures. GEO has developed a database with standard templates for computation of ranking scores under NPRS. The database can be accessed and downloaded through the following link: (http://hkss.cedd.gov.hk/hkss/eng/nprs.aspx). 2.2 Selection of Cross-sections of Slope Features In calculating the TS, the cross section corresponding to the worst-consequence (denoted as Section 1-1) should be considered. Where several facilities exist, either at the same section or at different sections across a slope feature, the potential consequence of failure in relation to each facility should be assessed to determine which facility and section would give rise to the most severe consequence. The section with the combination of crest and toe facilities which gives the highest CS should be selected as the worst-consequence section. If the cross section with the maximum feature height (denoted as Section 2-2) is not the worst-consequence section, and the feature height at Section 1-1 is less than 75% of the feature height at Section 2-2, then the TS corresponding to both sections (i.e. Sections 1-1 and 2-2) should be computed and the higher TS value is taken to be representative of the slope feature. 2.3 Composite Slope Features For composite slope features, i.e. with more than one type of slope feature present, the criteria for computation of the appropriate TS are given in Figures 2.3 and 2.4. A methodology to combine the TS as calculated by the individual NPRS is presented in Section 7.
16
(1) General
(2) Special Cases
(a) If Hcw, Hs, Hr and Htw < 3 m
Compute TS for the individual slope features, and take the highest TS as representative TS for the entire composite feature (i.e. Hcw + Hs + Hr + Htw)
(b)
Notes: (1) TS denotes Total Score. (2) Compute the Ranking Score for the composite features under Cases 1 and
2(b) using the methodology given in Appendix E.
Figure 2.3 Computation of Ranking Scores for Composite Features Comprising Soil Cut
Slope, Rock Cut Slope and Retaining Walls
For Hr ≥ 3 m : If Hcw < 3 m and Hs ≥ 1.5 m, or Hs ≥ 1 m and Hcw ≥ 1 m, Compute both TSr and TSs
Hr
Hs
Hcw
Compute TScw if Hcw ≥ 3 m
Compute TSs if Hs ≥ 3 m
Compute TSr if Hr ≥ 3 m
Compute TStw if Htw ≥ 3 m
Htw
H
r H
s H
cw
17
(1) General
(2) Special Cases
(a) If Hcw & Htw < 3 m, and Hf < 5 m, and if Hf + Hcw 5 m
Compute TSf and TScw and take the higher TS as the representative score
for the entire composite feature (i.e. Hcw + Hf + Htw)
(b) If Hcw & Htw < 3 m, and Hf < 5 m, and if Hf + Htw 5 m
Compute TSf and TStw and take the higher TS as the representative score
for the entire composite feature (i.e. Hcw + Hf + Htw)
Notes: (1) TS denotes Total Score.
(2) Compute the Ranking Scores for the composite features under Case 1
using the methodology given in Appendix E.
Figure 2.4 Computation of Ranking Scores for Composite Features Comprising Fill
Slope and Retaining Walls
Htw
H
f H
cw
Compute TScw if Hcw 3 m
Compute TSf if Hf 5 m
Compute TStw if Htw 3 m
18
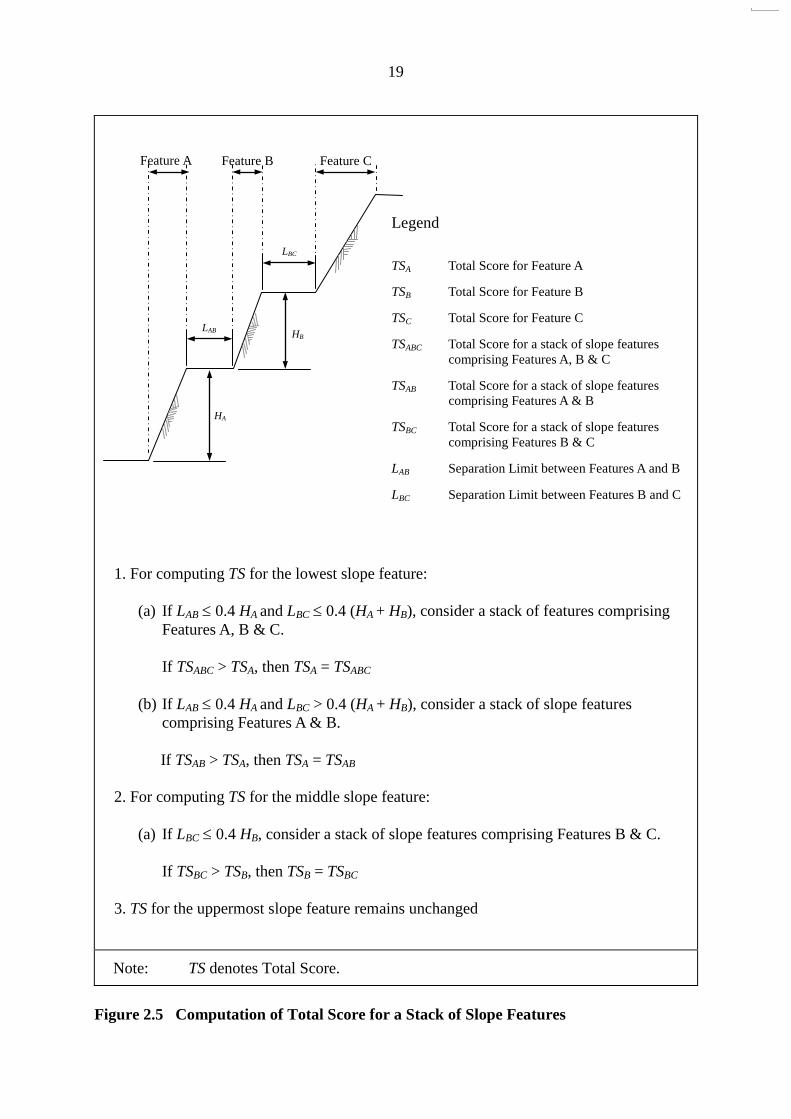
2.4 A Stack of Slope Features The overall stability of a stack of slope features that are close to each other vertically may be more critical than the individual slope feature, and is related to the proximity of the slope features relative to one another as well as the failure mechanisms. The influence of the lower slope feature on the upper slope feature has been assessed by the past landslide records. Based on past landslide records, it was established that the back scarp of a typical slope failure in Hong Kong would generally extend beyond the slope crest to a horizontal distance of less than 0.4 times the feature height (GEO, 2007). Figure 2.5 addresses the TS calculation for slope features close to each other vertically. The separation limits LAB and LBC shown in Figure 2.5 are for guidance only. Depending on the actual site conditions, possible nature of instability and interaction between the slope features, some slope features may have to be assessed as a stack even when the crest to toe distance is wider than the separation limits. The guidance given in Figure 2.5 is applicable to a stack of slope features consisting of slope features of the same type, or cut slopes and retaining walls, or fill slopes and retaining walls. For multiple retaining walls in terraced ground, reference should be made to the guidance on multiple walls given in Appendix D. 2.5 Slope Features Requiring Immediate Action Where there are significant signs of distress, or visual or documented evidence of continuous hazardous movement of slope features, or boulders or rock fragments, immediate follow-up action is recommended to be taken to remove or reduce the risk. 3 NPRS for Soil Cut Slopes
3.1 The System The system considers sliding and washout failures of soil cut slopes and computes a (TS) based on the likelihood of failure (IS) and the consequence of failure (CS), i.e.
TS = IS x CS Details of the system and the guidelines, together with sample data collection sheets and a worked example, are presented in Appendix A. 3.2 Instability Score The IS comprises two components, which account for the Instability Potential (IP) and Actual Performance (AP) of the slope, i.e.
IS = IP x AP
19
Note: TS denotes Total Score.
Figure 2.5 Computation of Total Score for a Stack of Slope Features
LAB
HA
Feature A
HB
LBC
Feature B Feature C
Legend
TSA Total Score for Feature A
TSB Total Score for Feature B
TSC Total Score for Feature C
TSABC Total Score for a stack of slope features comprising Features A, B & C
TSAB Total Score for a stack of slope features comprising Features A & B
TSBC Total Score for a stack of slope features comprising Features B & C
LAB Separation Limit between Features A and B
LBC Separation Limit between Features B and C
1. For computing TS for the lowest slope feature:
(a) If LAB ≤ 0.4 HA and LBC ≤ 0.4 (HA + HB), consider a stack of features comprising Features A, B & C.
If TSABC > TSA, then TSA = TSABC (b) If LAB ≤ 0.4 HA and LBC > 0.4 (HA + HB), consider a stack of slope features
comprising Features A & B. If TSAB > TSA, then TSA = TSAB
2. For computing TS for the middle slope feature:
(a) If LBC ≤ 0.4 HB, consider a stack of slope features comprising Features B & C. If TSBC > TSB, then TSB = TSBC
3. TS for the uppermost slope feature remains unchanged
20
The IP is reflected by the age of the slope, level of geotechnical engineering input, slope geometry, provision of surface protection and surface drainage measures, and site characteristics, i.e. factors A1 to A5 in the equation below. The AP is manifested as signs of distress where present and records of instability after the slope has been formed or treated to its present configuration, i.e. factors B1 and B2. IS = A1 x A2 x A3 x A4 x A5 x B1 x B2 .................................. (3.1)
where A1 accounts for the age of slope since formation or treatment A2 accounts for the level of geotechnical engineering input A3 accounts for the slope geometry A4 accounts for the adequacy of surface protection and surface drainage
measures A5 accounts for the site characteristics in respect of hydrogeological and
geological settings B1 accounts for signs of distress B2 accounts for instability since slope formation or treatment The weighting of individual factors in IS ranges between 1 and a value of less than or equal to 10, depending on their significance. 3.3 Consequence Score The CS, which reflects the likely consequence of failure, is computed by the following equation:
CS = (C1 x C2 + D1 x D2) x H ........................................ (3.2)
where C1 accounts for the type of crest facility C2 accounts for the vulnerability of the crest facility (see Table 3.1) D1 accounts for the type of toe facility D2 accounts for the vulnerability of the toe facility (see Table 3.2) H represents the feature height The vulnerability factors given in Tables 3.1 and 3.2, where reflect the chance of fatality given the landslide, account for the height of the slope and the nature of the affected facilities together with their proximity to the slope. 4 NPRS for Rock Cut Slopes
4.1 The System The system considers potential ravelling, toppling, wedge and planar failures of rock cut slopes and computes a TS based on the likelihood of failure (IS) and the consequence of failure (CS), i.e.
TS = IS x CS
21
Details of the system and the guidelines, together with sample data collection sheets and a worked example, are presented in Appendix B. Table 3.1 Vulnerability Factors for Crest Facilities Involving Soil Cut Slopes, Rock Cut
Slopes and Retaining Walls
(a) Vulnerability Factor (C2) for Crest Facility being Buildings
Feature Height, H (m)
Distance from Crest, D (m)
10 > D ≥ 6 6 > D ≥ 3 D < 3
H < 5 0 0.0000125 0.0003
5 ≤ H < 10 0 0.0000625 0.0015
10 ≤ H < 15 0 0.00025 0.006
15 ≤ H < 20 0.0002 0.003 0.02
H ≥ 20 0.0005 0.01 0.05
(b) Vulnerability Factor (C2) for Crest Facility other than Buildings
Feature Height, H (m)
Distance from Crest, D (m)
10 > D ≥ 6 6 > D ≥ 3 D < 3
H < 5 0 0.00025 0.0075
5 ≤ H < 10 0 0.00125 0.0375
10 ≤ H < 15 0 0.005 0.15
15 ≤ H < 20 0.002 0.04 0.4
H ≥ 20 0.002 0.074 0.54
Notes: (1) Refer to Figure 2.1 for definition of feature geometry H and D. (2) For D ≥ 10 m, accord C2 = 0 for all feature heights.
22
Table 3.2 Vulnerability Factors for Toe Facilities Involving Soil Cut Slopes, Rock Cut Slopes and Retaining Walls
(a) Vulnerability Factor (D2) for Toe Facility being Buildings
Notes: (1) Refer to Figure 2.1 for definition of feature geometry H and ω. (2) For ω ≤ 20o, accord D2 = 0 for all feature heights.
4.2 Instability Score The IS comprises two components, which account for the Instability Potential (IP) and Actual Performance (AP) of the slope, i.e.
IS = IP x AP
The IP is reflected by the level of geotechnical engineering input, slope geometry,
23
mode and scale of instability, seepage and drainage conditions, i.e. factors A1 to A4 in the equation below. Similar to soil cut slopes, the AP is manifested as signs of distress where present and records of instability after the slope feature has been formed or treated to its present configuration, i.e. factors B1 and B2. IS = A1 x A2 x A3 x A4 x B1 x B2 ...................................... (4.1)
where A1 accounts for the level of geotechnical engineering input A2 accounts for slope geometry A3 accounts for mode and scale of instability A4 accounts for seepage and drainage conditions B1 accounts for signs of distress B2 accounts for instability since formation or treatment The potential mode and scale of instability of a rock cut slope should be evaluated based on the inspecting engineer’s site observations and documentary records on site geology, rock mass conditions, geological setting, and any relevant geological features. Reference should also be made to the previous failure incidents that occurred on the rock cut slope. The weighting of individual factors in IS ranges between 1 and a value of less than or equal to 10, depending on their significance. 4.3 Consequence Score The CS, which reflects the likely consequence of failure is computed by the following equation: CS = (C1 x C2 + D1 x D2) x K ........................................ (4.2)
where C1 accounts for the type of crest facility C2 accounts for the vulnerability of the crest facility (see Table 3.1) D1 accounts for the type of toe facility D2 accounts for the vulnerability of the toe facility (see Table 3.2) K accounts for the probable scale of failure The vulnerability factors given in Tables 3.1 and 3.2, where reflect the chance of fatality given the landslide, account for the height of the slope and the nature of the affected facilities together with their proximity to the slope. The weighting of K ranges between 1 and 5, depending on the scale of failure. 5 NPRS for Fill Slopes
5.1 The System The system considers the following failure modes of fill slopes:
(a) sliding and minor washout: common slope failures which do
24
not involve the build-up of excess pore water pressure and
influence from a large amount of external water. The
debris slides downslope and may involve disintegration of
the soil mass, particle collision and minor erosion and
washout action;
(b) liquefaction: mobile failure involving the generation of high
positive excess pore water pressures during shearing and
hence a substantial reduction of the effective stress and the
shearing resistance; and
(c) major washout: mobile failure involving concentrated
discharge of water (e.g. surface runoff from a road) resulting
in scouring and erosion of the slope and the washing of
debris downslope.
The system computes a TS based on the likelihood of the different failure modes (IS)
and the consequence of different failure modes (CS), i.e.
where IS1 and CS1 account for sliding and minor washout failure
IS2 and CS2 account for liquefaction failure
IS3 and CS3 account for major washout failure
Details of the system and the guidelines, together with sample data collection sheets
and a worked example, are presented in Appendix C.
5.2 Instability Score
The IS comprises two components, which account for the Instability Potential (IP) and
Actual Performance (AP) of the slope, i.e.
IS = IP x AP
The IP is reflected by the level of geotechnical engineering input and potential of various
modes of failure to occur. The AP is manifested as signs of distress where present and records
of instability after the slope has been formed or treated to its present configuration.
IS1 = A1 x A2 x B1 x B2 ............................................ (5.2a)
IS2 = A1 x A3 x B1 x B2 ............................................ (5.2b)
IS3 = A1 x A4 x B1 x B2 ............................................ (5.2c)
where i 1, 2 and 3 correspond to "sliding and minor washout failure", "liquefaction
failure" and "major washout failure" respectively
A1 accounts for the level of geotechnical engineering input
25
A2 accounts for factors affecting sliding and minor washout failure A3 accounts for factors affecting liquefaction failure A4 accounts for factors affecting major washout failure B1 accounts for signs of distress B2 accounts for instability since formation or treatment The weighting of individual factors in IS ranges between 0.05 and 32, depending on their significance. 5.3 Consequence Score The CS, which reflects the likely consequence of different failure modes, is computed by the following equations: CSi = (C1 x C2i + D1 x D2i) x H ....................................... (5.3) where i 1, 2 and 3 correspond to "sliding and minor washout failure", "liquefaction
failure" and "major washout failure" respectively C1 accounts for the type of crest facility C2 accounts for the vulnerability of the crest facility (see Table 5.1) D1 accounts for the type of toe facility D2 accounts for the vulnerability of the toe facility (see Table 5.2) H represents the feature height The vulnerability factors given in Tables 5.1 and 5.2, where reflect the chance of fatality given the landslide, account for the height of the slope and the nature of the affected facilities together with their proximity to the slope. 6 NPRS for Retaining Walls
6.1 The System The system considers partial and complete failure of retaining walls and computes a TS based on the likelihood of failure (IS) and the consequence of failure (CS), i.e.
TS = IS x CS
Details of the system and the guidelines, together with sample data collection sheets and a worked example, are presented in Appendix D. 6.2 Instability Score The IS comprises two components, which account for the Instability Potential (IP) and Actual Performance (AP) of the wall, i.e.
IS = IP x AP
26
Table 5.1 Vulnerability Factors for Crest Facilities Involving Fill Slopes
(a) Vulnerability Factor (C2) for Crest Facility being Buildings
Feature Height, H (m) Distance from Crest, D (m)
10 > D ≥ 6 6 > D ≥ 3 D < 3
H < 5 V1=V2 0 0.0000125 0.0003
V3 0 0.00023 0.0023
5 ≤ H < 10 V1=V2 0 0.0000625 0.0015
V3 0 0.00115 0.0115
10 ≤ H < 15 V1=V2 0 0.00025 0.006
V3 0 0.00715 0.0375
15 ≤ H < 20 V1=V2 0.0002 0.003 0.02
V3 0.008 0.0285 0.101
H ≥ 20 V1=V2 0.0005 0.01 0.05
V3 0.015 0.045 0.15
(b) Vulnerability Factor (C2) for Crest Facility other than Buildings
Feature Height, H (m) Distance from Crest, D (m)
10 > D ≥ 6 6 > D ≥ 3 D < 3
H < 5 V1=V2 0 0.00025 0.0075
V3 0 0.0022 0.011
5 ≤ H < 10 V1=V2 0 0.00125 0.0375
V3 0 0.011 0.055
10 ≤ H < 15 V1=V2 0 0.005 0.15
V3 0 0.043 0.18
15 ≤ H < 20 V1=V2 0.002 0.04 0.4
V3 0.004 0.092 0.2825
H ≥ 20 V1=V2 0.002 0.074 0.54
V3 0.006 0.12 0.315
Notes: (1) Refer to Figure 2.1 for definition of slope geometry H and D. (2) V1 = Vulnerability factor for sliding and minor washout failure V2 = Vulnerability factor for liquefaction failure V3 = Vulnerability factor for major washout failure. (3) For D ≥ 10 m, accord C2 = 0 for all feature heights.
27
Table 5.2 Vulnerability Factors for Toe Facilities Involving Fill Slopes
(a) Vulnerability Factor (D2) for Toe Facility being Buildings
Notes: (1) Refer to Figure 2.1 for definition of slope geometry H and ω. (2) V1 = Vulnerability factor for sliding and minor washout failure V2 = Vulnerability factor for liquefaction failure V3 = Vulnerability factor for major washout failure. (3) For ω ≤ 10o, accord D2 = 0 for all feature heights.
28
The IP is reflected by the level of geotechnical engineering input, wall slenderness, wall type, surface protection and surface drainage measures, seepage conditions and presence of leaky water-carrying services, i.e. factors A1 to A5 in the equation below. The AP is manifested as signs of distress where present and records of instability after the retaining wall has been formed or treated to its present configuration, i.e. factors B1 and B2. IS = A1 x A2 x A3 x A4 x A5 x B1 x B2 .................................. (6.1)
where A1 accounts for the level of geotechnical engineering input A2 accounts for wall slenderness ratio A3 accounts for wall type A4 accounts for adequacy of surface protection and surface drainage measures A5 accounts for seepage conditions and the presence of leaky water-carrying
services B1 accounts for signs of distress B2 accounts for instability since formation or treatment The weighting of individual factors in IS ranges between 1 and a value of less than or equal to 10, depending on their significance. 6.3 Consequence Score The CS, which reflects the likely consequence of failure, is computed by the following equation: CS = (C1 x C2 + D1 x D2) x H ........................................ (6.2)
where C1 accounts for the type of crest facility C2 accounts for the vulnerability of the crest facility (see Table 3.1) D1 accounts for the type of toe facility D2 accounts for the vulnerability of the toe facility (see Table 3.2) H represents the feature height The vulnerability factors given in Tables 3.1 and 3.2, where reflect the chance of fatality given the landslide, account for the height of the wall and the nature of the affected facilities together with their proximity to the wall. 7 Combined Ranking A method which ranks all types of slope features in terms of the relative risk of each slope feature has been developed. Using this method, a “Ranking Score” (RS) is calculated for each slope feature based on its “Total Score” (TS) in the respective NPRS. Details of the derivation of the RS are given in Appendix E. For composite features, except the special cases illustrated in Figures 2.3 and 2.4, the individual RS for each of the feature types are summed up to obtain the RS for the slope feature. A worked example on the computation of RS for a composite feature is also
29
presented in Appendix E. The RS is unique for each slope feature and can be used for priority ranking purposes under the post-2010 LPMitP. It can also be used by the Slope Maintenance Departments in the implementation of the post-2010 Preventive Maintenance Works. 8 References GEO (2007). GEO Technical Guidance Note No. 15 - Guidelines for Classification of
Consequence-to-life Category for Slope Features. Geotechnical Engineering Office, Hong Kong, 14 p.
Ho, K.K.S. & Pappin, J.W. (2007). Geotechnical failures in Hong Kong. Proceedings of
the HKIE Geotechnical Division Annual Seminar 2007. The Hong Kong Institution of Engineers, pp 213-224.
Ho, K.K.S, Sun, H.W. & Hui, T.H.H. (2003). Enhancing the Reliability and Robustness of
Engineered Slopes (GEO Report No. 139). Geotechnical Engineering Office, Hong Kong, 63 p.
Wong, C.K.L. (1998). The New Priority Classification Systems for Slopes and Retaining
Walls (GEO Report No. 68). Geotechnical Engineering Office, Hong Kong, 117 p. Wong, H.N. (2005). Landslide risk assessment for individual facilities. Proceedings of the
International Conference on Landslide Risk Management, Vancouver, Canada, pp 237-296.
30
Appendix A
Details of NPRS for Soil Cut Slopes
31
Contents
Page No. Contents 31 List of Figures 32 A.1 Total Score (TS) Computation Sheets for Soil Cut Slopes 33 A.2 Guidelines on Data Collection and Score Computation for Soil Cut 37 Slopes A.3 Sample Data Collection Sheets for Soil Cut Slopes 43 A.4 Worked Example (Data Collection Sheets) 48 A.5 Worked Example (TS Computation Sheets) 54
32
List of Figures
Figure No.
Page No.
A1 Geometry of Soil and Rock Cut Slopes
41
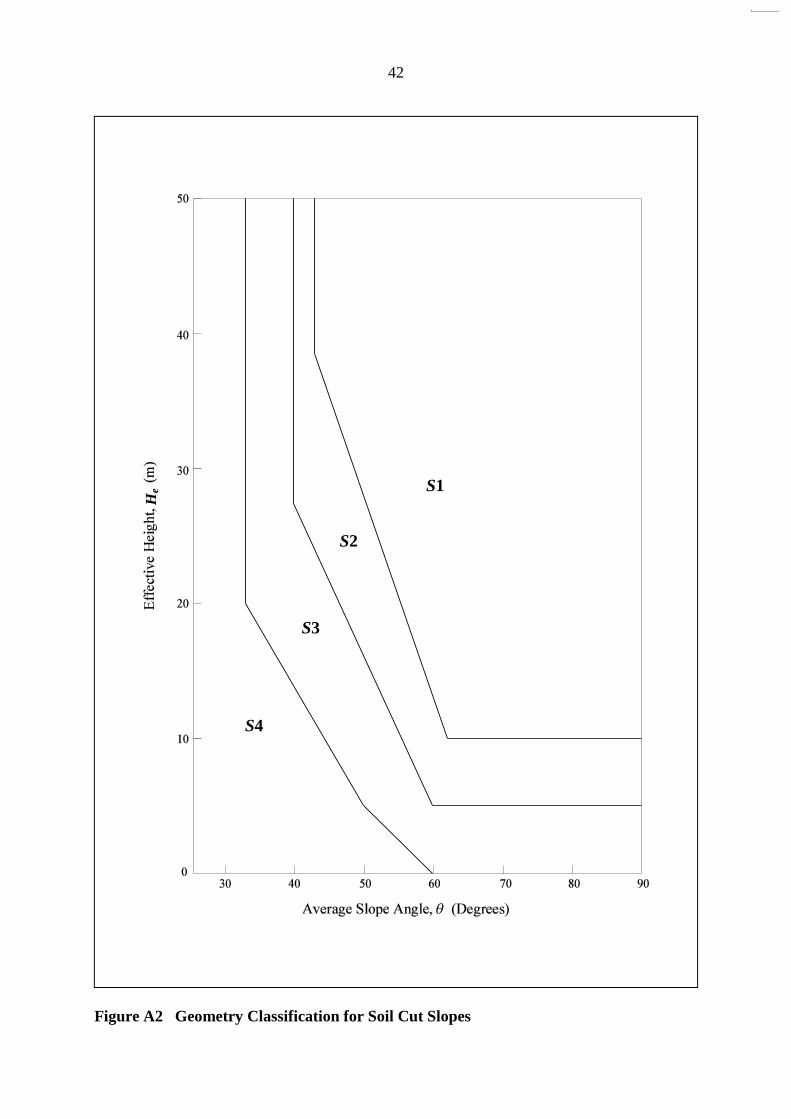
A2 Geometry Classification for Soil Cut Slopes
42
33
A.1 Total Score (TS) Computation Sheets for Soil Cut Slopes
FEATURE NO. SECTION : 1-1 (Most Severe Consequence)
2-2 (Maximum Feature Height)
(A) INSTABILITY POTENTIAL (IP)
(A1) Year of Formation/Treatment (Y)
A1
(i) Y 1980 6
(ii) 1980 < Y 1990 4
(iii) 1990 < Y 1995 2 A1
(iv) Y > 1995 1
For soil cut slopes excluded from ranking (see Note 8), denote A1 = 0
(A2) Level of Geotechnical Engineering Input
A2
(i) Slopes with none or little geotechnical engineering input 8
(ii) Slopes with indication of some geotechnical engineering input 6
(iii) Slopes with indication of substantial geotechnical engineering input 2 A2
(iv) Slopes checked and accepted by GEO 1
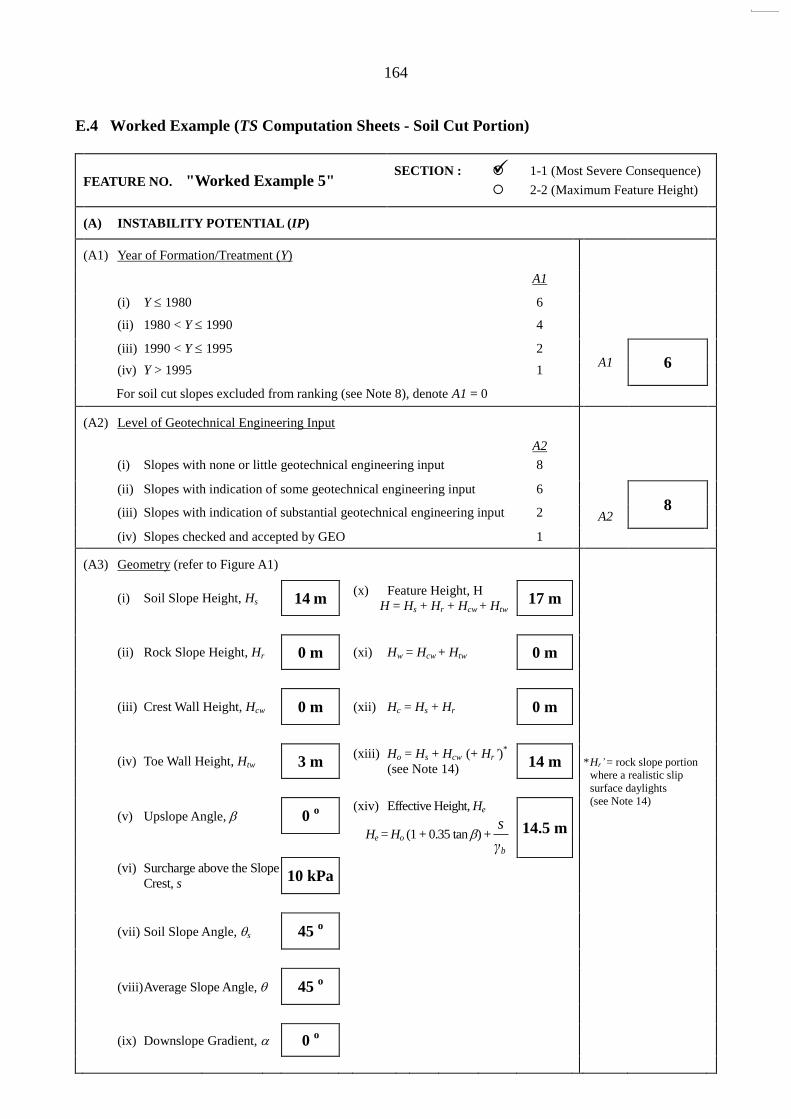
(A3) Geometry (refer to Figure A1)
(i) Soil Slope Height, Hs m (x) Feature Height, H
H = Hs + Hr + Hcw + Htw m
(ii) Rock Slope Height, Hr m (xi) Hw = Hcw + Htw m
* Hr’ = rock slope portion
where a realistic slip
surface daylights
(see Note 14)
(iii) Crest Wall Height, Hcw m (xii) Hc = Hs + Hr m
(iv) Toe Wall Height, Htw m (xiii) Ho = Hs + Hcw (+ Hr’)
*
m
(v) Upslope Angle, o
(xiv) Effective Height, He
He = Ho (1 + 0.35 tan ) +bγ
s
m
(vi) Surcharge above the Slope
Crest, s kPa
(vii) Soil Slope Angle, s o
(viii) Average Slope Angle, o
(ix) Downslope Gradient, o
34
Geometry Classification (refer to Figure A2) A3
(i) S1 8
(ii) S2 4
(iii) S3 2 A3
(iv) S4 1
(A4) Slope Protection and Surface Drainage
Slope Protection
Surface Drainage
Soil slope or crest area
substantially unprotected
Soil slope or crest area partially protected
Soil slope or crest area
substantially protected
Few or no channels, and potential for convergent flow of surface water above crest or located on a drainage line or depression
8 4 2
Few or no channels 4 2 1.5
Adequate channels 2 1.5 1
A4
(A5) Site Characteristics
Adverse hydrogeological settings
Adverse geological feature
Significant Moderate Minor/None
Significant 10 8 5
Moderate 8 3 2
Minor/None 5 2 1
A5
(B) ACTUAL PERFORMANCE (AP)
(B1) Signs of Distress
B1 (i) Severe 10
(signs of slope movement)
(ii) Moderate 4 (extensive minor defects)
B1
(iii) Minor/None 1 (none or few isolated minor defects)
35
(B2) Instability after Slope Formation/Treatment
B2 (i) Massive failures (> 500 m3) 10
(ii) Major or repeated minor failures 5 or records of previous severe signs of distress
(iii) Minor failure or records of previous moderate signs of distress 2
(iv) No failure or records of previous minor signs of distress 1
B2
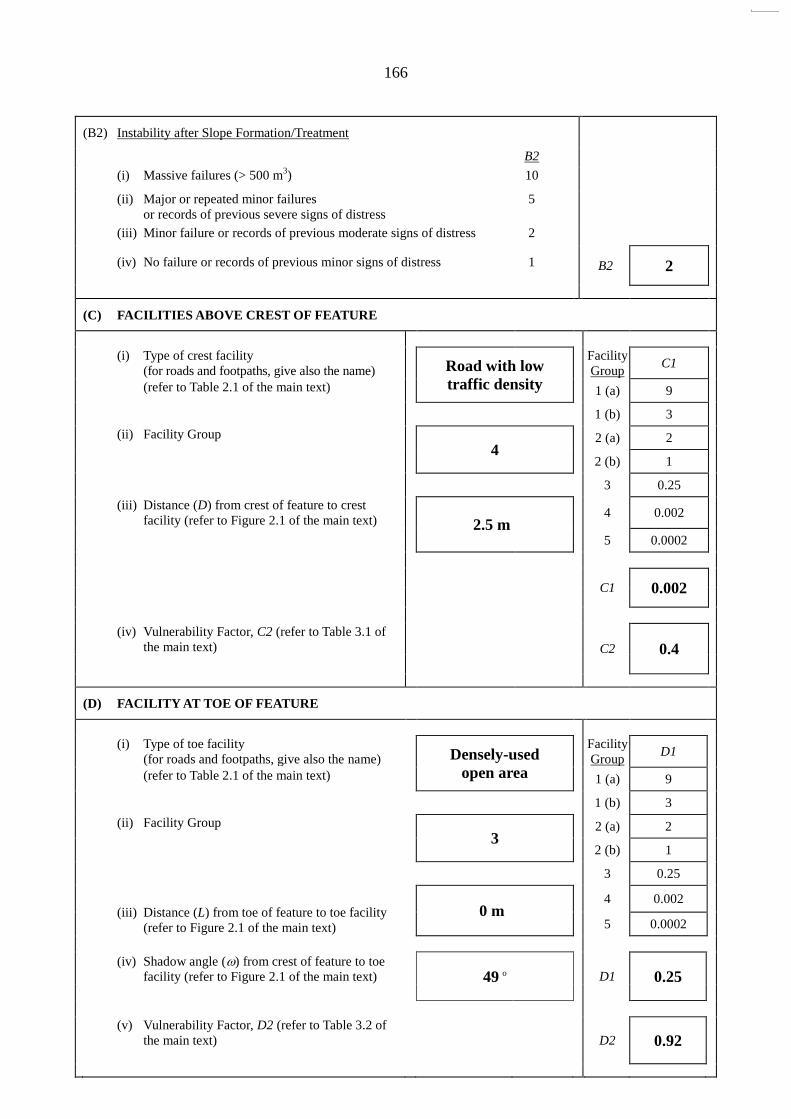
(C) FACILITIES ABOVE CREST OF FEATURE
(i) Type of crest facility (for roads and footpaths, give also the name)
Facility Group
C1
(refer to Table 2.1 of the main text) 1 (a) 9
1 (b) 3
(ii) Facility Group 2 (a) 2
2 (b) 1
3 0.25
(iii) Distance (D) from crest of feature to crest facility (refer to Figure 2.1 of the main text)
m
4 0.002
5 0.0002
C1
(iv) Vulnerability Factor, C2 (refer to Table 3.1 of the
main text)
C2
(D) FACILITY AT TOE OF FEATURE
(i) Type of toe facility (for roads and footpaths, give also the name)
Facility Group
D1
(refer to Table 2.1 of the main text) 1 (a) 9
1 (b) 3
(ii) Facility Group 2 (a) 2
2 (b) 1
3 0.25
(iii) Distance (L) from toe of feature to toe facility (refer to Figure 2.1 of the main text)
m
4 0.002
5 0.0002
(iv) Shadow angle (ω) from crest of feature to toe
facility (refer to Figure 2.1 of the main text)
o
D1
(v) Vulnerability Factor, D2 (refer to Table 3.2 of the
main text)
D2
36
CALCULATED SCORES
INSTABILITY SCORE (IS)
IS = A1 A2 A3 A4 A5 B1 B2 IS
CONSEQUENCE SCORE (CS)
CS = [C1 x C2 + D1 x D2] x H CS
TOTAL SCORE (TS)
TS = IS x CS TS
37
A.2 Guidelines on Data Collection and Score Computation for Soil Cut Slopes
General
(1) For composite features, i.e. with more than one type of slope feature, the criteria for
computation of the Total Score (TS) are presented in Figure 2.3 of the main text.
(2) If H of Section 1-1 75% of H of Section 2-2, consider Section 1-1 (i.e. in terms of
most severe consequence) in calculating the scores. Otherwise, both Sections 1-1 and
2-2 (in terms of maximum feature height, H) shall be considered.
(3) Geometric parameters of the feature (e.g. Hs, Hr, Hcw, Htw,sand) (see
Figure A1) may be obtained from survey plans and site measurements.
(4) Detailed physical inspection on the features should be carried out using all available
access/route.
(5) Unless stated otherwise, “distance” refers to horizontal distance and “height” refers to
vertical height.
(6) Details of field mapping and site observation should be recorded using data collection
sheets. Sample data collection sheets for soil cut slopes are appended for reference.
Inspecting engineers may modify the sheets to suit their specific use. Provide
photographic records of the overview of the features and facilities affected. The
photographic records shall also include details of site observations to substantiate the
factors adopted in the calculation.
Factor A1
(7) Years of formation/treatment refers to the year that the formation or substantial
modification works completed on the subject slope. Substantial modification works
refer to the engineering works to bring substandard slopes to the safety standards at
that time.
(8) Slopes that were formed/treated in or after year 2000 or treated with robust technology
(i.e. installed with structural support, e.g. soil nails), and processed and accepted by
GEO, will not be ranked. Denote these features with A1 = 0. Data on these slopes
should still be collected.
Factor A2
(9) The level of geotechnical engineering input should be inferred from databases, files
and documentary records kept by GEO and other relevant government departments and
organizations, or interpretation of aerial photographs if necessary.
(10) Slopes with none or little geotechnical engineering input, e.g.
pre-1978 slopes
38
post-1978 slopes formed by unauthorized works post-1978 slopes falling outside any engineering project boundary
(11) Slopes with indication of some geotechnical engineering input, e.g.
post-1978 slopes without GEO checking records but falling within the boundary of engineering projects
slopes assessed as being upto the required safety standard without site-specific ground investigation and laboratory testing
(12) Slopes with indication of substantial geotechnical engineering input, e.g. slopes checked by GEO but with outstanding comments
(13) Slopes checked and accepted by GEO, e.g.
slopes checked by GEO without outstanding comments slopes designed by GEO
Factor A3 (14) Definition of geometric parameters are given in Figure A1. Ho is the difference in
elevations between the crest of the feature and the lowest daylighting point of realistic slip surfaces. In the case where the lowest daylighting point is at the toe of the soil portion of the slope, Ho should be calculated as Hs + Hcw. Otherwise, Ho should be taken to include the portion of the rock slope (Hr’) where a realistic failure surface can daylight. The definition of effective height, He, takes into account the equivalent surcharging effect due to the uphill slope and applied vertical loading. An assessment of the surcharge (s) above the slope crest may be made by reference to Table 16 of the second edition of Geoguide 1 (GEO, 1993).
(15) The factor A3 involves combined consideration of the effective height, He, and average
slope angle (θ) as defined in Figure A2. Factor A4 (16) Both hard cover and vegetation cover are considered as slope protection. As a
general guideline, "substantially protected" refers to more than 75% area covered, "partially protected" refers to between 25% and 75% area protected and "substantially unprotected" refers to less than 25% area covered.
(17) Crest area refers to the area within a horizontal distance of H/2 beyond the crest of the
slope. (18) Where there is potential for ponding above the slope crest, the score for the next higher
category in respect of slope protection should be adopted. (19) In assessing the adequacy of surface drainage provisions, the overall setting including
the site topography, catchment area and environmental factors that are liable to give rise to convergent flow of surface water should be considered.
39
(20) The potential for convergent flow of surface water above crest and whether the slope is located on a drainage line or depression shall be determined from topographic plan and/or aerial photographs.
Factor A5 (21) As a general guideline, adverse hydrogeological settings are as follows:
Significant - observable or recorded adverse groundwater conditions, e.g. high permanent groundwater over a significant area of the slope; complex groundwater conditions with a significant storm response or delayed response; seepage at or above mid-height of slope
Moderate - seepage below mid-height of slope
Minor/None - no signs of seepage
(22) As a general guideline, adverse geological features are as follows:
Significant - sites with relict massive failures; observable or recorded adverse discontinuities (e.g. adversely oriented, persistent, clay- or silt-infilled discontinuities, pre-existing shear surfaces or zones, and well developed discontinuities that are slickensided or heavily coated with dark minerals or kaolinite)
Moderate - observable or recorded adverse geological materials (e.g. significantly kaolinised granite and volcanics, weathered dykes, and sedimentary layers within volcanic formations)
Minor/None - none of the above Factors B1 and B2 (23) Signs of distress are based on site observations, and relevant inspection and
maintenance records kept by the maintenance departments. (24) Severe signs of distress refer to signs of slope movement, e.g. large tension cracks
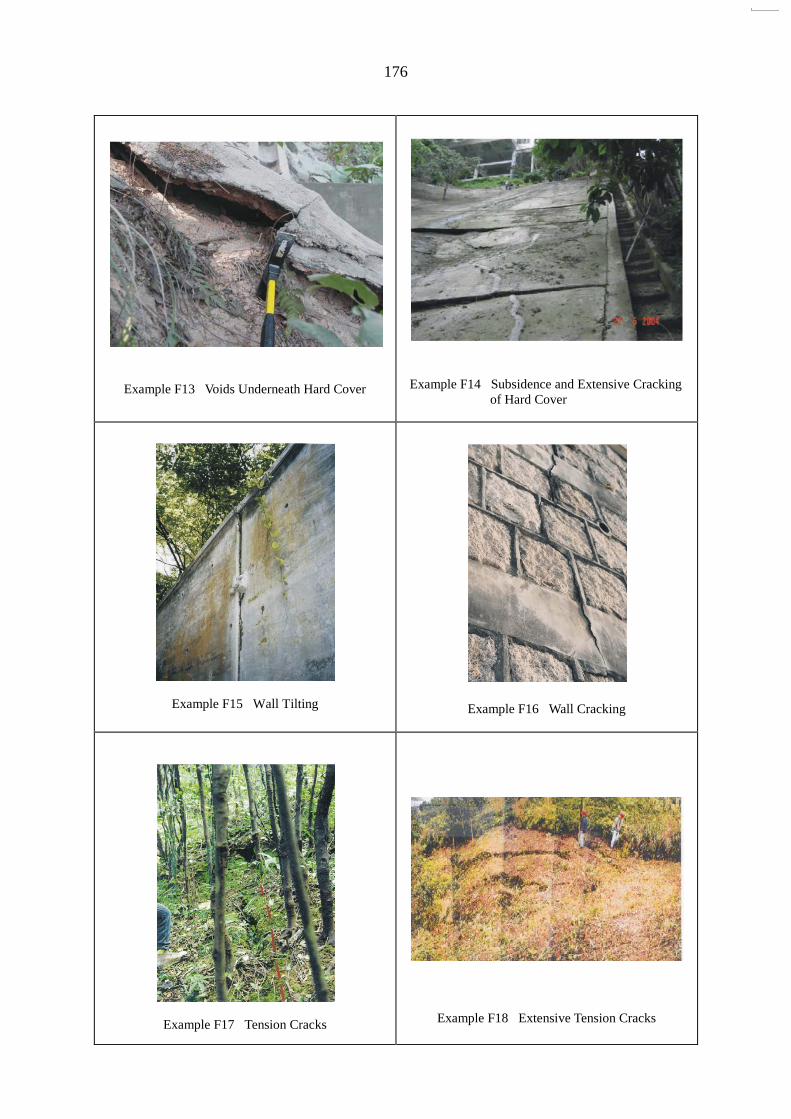
behind crest, significant distortion of channels and berms, severe cracking and bulging, subsidence of slope crest or slope surface. These tell-tale signs should be examined in a holistic manner to determine if they are indicative of slope movement. Where there are severe signs of distress or documented evidence of continuing hazardous movement, immediate action should be taken. Examples of severe signs of distress are attached in Appendix F of this report.
(25) Moderate signs of distress refer to signs of extensive minor defects, e.g. cracking of
slope cover and damaged channels. (26) Judgment should be made in assessing whether cracked slope cover, damaged channels,
etc. are due to inadequate maintenance. If these are due to inadequate maintenance, they should not be regarded as signs of distress. In case of doubt, a conservative
40
assessment should be made. (27) Instability after treatment accounts for landslide incidents that occurred after the slope
was formed or substantially modified to its present configuration, and upgrading works have not been carried out on the slope subsequent to the incidents.
Factors C and D (28) Shadow angle (ω) as shown in Figure 2.1 of the main text should be determined by site
measurements and/or from survey plans and sections. References GEO (1993). Guide to Retaining Wall Design (Geoguide 1), 2nd Edition. Geotechnical
Engineering Office, Hong Kong, 258 p.
41
Hw = Hcw + Htw
Figure A1 Geometry of Soil and Rock Cut Slopes
42
Figure A2 Geometry Classification for Soil Cut Slopes
He
S2
S3
S4
S1
43
A.3 Sample Data Collection Sheets for Soil Cut Slopes
FEATURE NO. (Page 1 of )
SECTION : 1-1 (Most Severe Consequence) 2-2 (Maximum Feature Height)
Check if H1 75% x H2. If yes, consider Section 1-1 only; If No, consider both Sections 1-1 and 2-2
Geometry (refer to Figure A1)
Section 1-1 2-2
Section 1-1
2-2
Soil Slope Height, Hs m m Feature Height,
H = Hs + Hr + Hcw + Htw m m
Rock Slope Height, Hr m m Hw = Hcw + Htw m m
Crest Wall Height,
Hcw m m Hc = Hs + Hr m m
Toe Wall Height, Htw m m Ho = Hs + Hcw ( + Hr’)# m m
Upslope Angle, o
o
# Ho should include the portion of the underlying rock
slope where a realistic slip surface can daylight (Hr’)
Hr’ m m
Surcharge above the
Slope Crest, s kPa kPa
Effective Height, He
He = Ho (1 + 0.35 tan ) +bγ
s
m
m Soil Slope Angle, s o
o
Average Slope Angle,
o
o
whereb = soil bulk unit weight
3m
kN
Downslope Gradient,
o
o
Do the dimensions of individual feature types satisfy the requirement of separate Total Score as shown in Figure 2.3 of the
main text?
If yes, number of data collection sheets required for this section :
o Yes o No
Affected Facilities (Refer to Figure 2.1 and Table 2.1 of the main text)
Section 1-1 Facility Type (for roads, please give name) Facility Group Proximity
Toe L m
Crest D = m
Section 2-2 Facility Type (for roads, please give name) Facility Group Proximity
Toe L m
Crest D = m
44
FEATURE NO. (Page 2 of )
PLAN AND CROSS-SECTION SECTION : 1-1 (Most Severe Consequence) 2-2 (Maximum Feature Height) Notes: PLAN (1:1000) CROSS-SECTIONS 1. Feature boundary (SIS) and revised feature boundary (if applicable) 1. Fully dimensioned 2. Section mark 2. Engineering measures (e.g. soil nails, shotcrete & buttress) 3. Photograph location and direction 4. Signs of distress, if any 5. Signs of seepage, if any 6. Engineering measures (e.g. soil nails, shotcrete & buttress)
45
FEATURE NO. (Page 3 of )
SLOPE CHARACTERISTICS
SITE OBSERVATIONS/FINDINGS
Slope Protection
Surface cover with o Vegetation % (including grass/shrubs/trees)
o Hard cover % (including concrete/chunam)
o Bare surface %
o Others %
1. Based on the above, slope surface is Substantially protected (> 75%)
Partially protected (25% - 75%)
Substantially unprotected (< 25%)
2. Zone(s) of depression or potential ponding exist within the crest area (within H/2)
o Yes o No
If yes, mark the extent of depression or ponding zones on plan and adopt the score of the next higher category in slope protection
Surface Drainage Provision
Location Size
(mm) Spacing
(m)
Type (e.g. U-channel, step channel,
downpipes or ditch)
Adequate Capacity
(Y/N) Remarks
Crest
Berm
On Slope
Toe
o Potential surface runoff converge onto the crest area due to topography (observed or inferred from topographic plan or aerial photos)
o Slope located on a drainage line/zone of depression o Inadequate surface drainage evident by surface erosion or erosion gully, etc. o Others observations/records : _______________________________________
Hydrogeological Settings
(Provide photographic records of signs of seepage and indicate location & extent on plan & cross-sections)
Signs of Seepage?
If Yes, provide following details
Seepage Location Condition of seepage
Copious Trickling/damp Stain
At or above mid-height
Below mid-height
o Others observations/records: ______________________________________
o Yes o No
Geological Features
(Provide photographic records of the site observations)
Presence of the following based on site observations or available records (please tick):
o No potential adverse geological features observed or recorded
o Possible relict failure (concave shaped profile)
o Shear surfaces/zone
o Clay or silt filled discontinuities
o Slickensided discontinuities
o Discontinuities heavily coated with dark minerals or kaolinite
o Significantly kaolinised granite or volcanics
o Weathered dykes/sedimentary layers within volcanic formations
o Others: ______________________________________________
46
FEATURE NO. (Page 4 of )
SLOPE CHARACTERISTICS
SITE OBSERVATIONS/FINDINGS
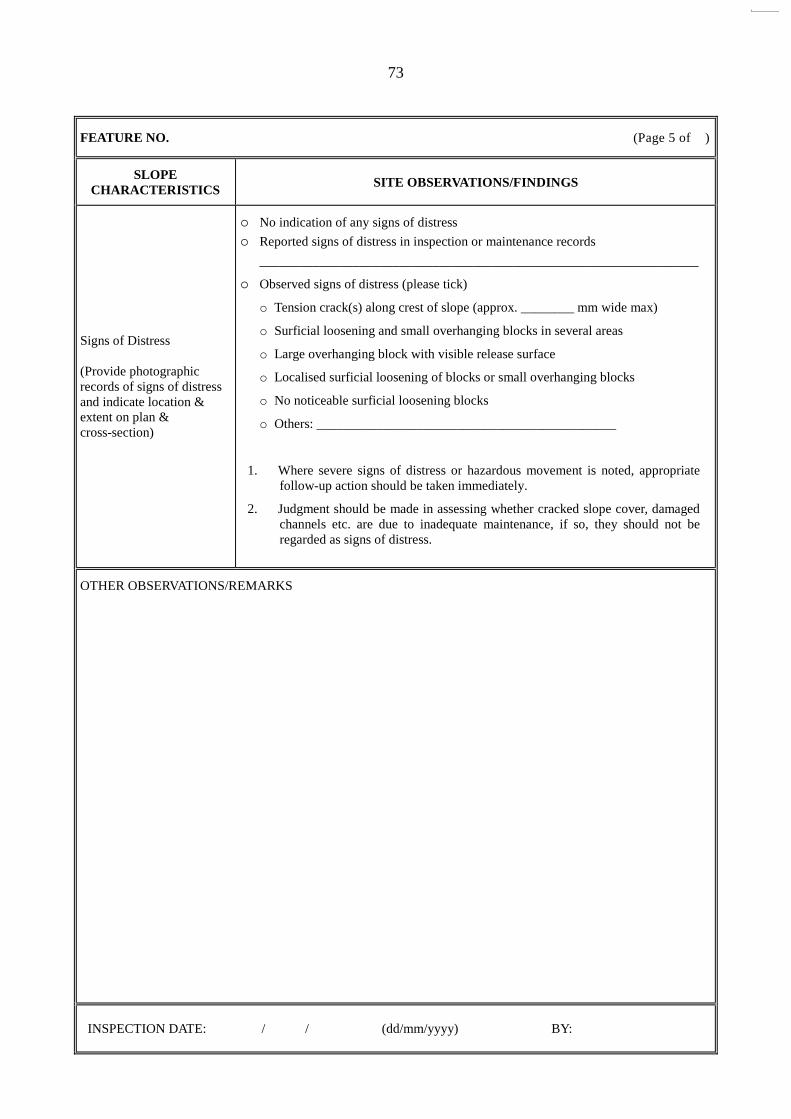
Signs of Distress (Provide photographic records of signs of distress and indicate location & extent on plan & cross-sections)
No indication of any signs of distress
Reported signs of distress in inspection or maintenance records
o Large tension cracks behind crest (approx. ________ mm wide)
o Significant distortion/damage of channels and berms
o Severe cracking and bulging of hard surfacing
o Subsidence within crest area or on slope
o Extensive cracking of slope cover
o Isolated minor cracking of slope cover/isolated cracking of channels
o Others: _________________________________________________________
1. Where severe signs of distress or hazardous movements are noted, appropriate follow-up action should be taken immediately.
2. Judgment should be made in assessing whether cracked slope cover, damaged channels etc. are due to inadequate maintenance; if so, they should not be regarded as signs of distress.
Instability after Slope Formation/Treatment (Provide photographic records of the inferred failure scar and indicate location on plan & cross-sections)
o No indication of any failure occurred after formation or treatment
o Reported failure _________________________________________________
o Possible failure scar observed at _____________ of the slope
Estimated failure volume = _________________ m3
o Debris observed on site/Other observations: _______________________________________________________________
OTHER OBSERVATIONS/REMARKS
INSPECTION DATE: / / (dd/mm/yyyy) BY:
47
FEATURE NO. (Page 5 of )
PHOTOGRAPHIC RECORDS [Caption]
PHOTOGRAPHIC RECORDS [Caption] Notes: (1) Indicate photograph vantage points on plan (2) Add more pages for additional photographic records/sketches
48
A.4 Worked Example (Data Collection Sheets)
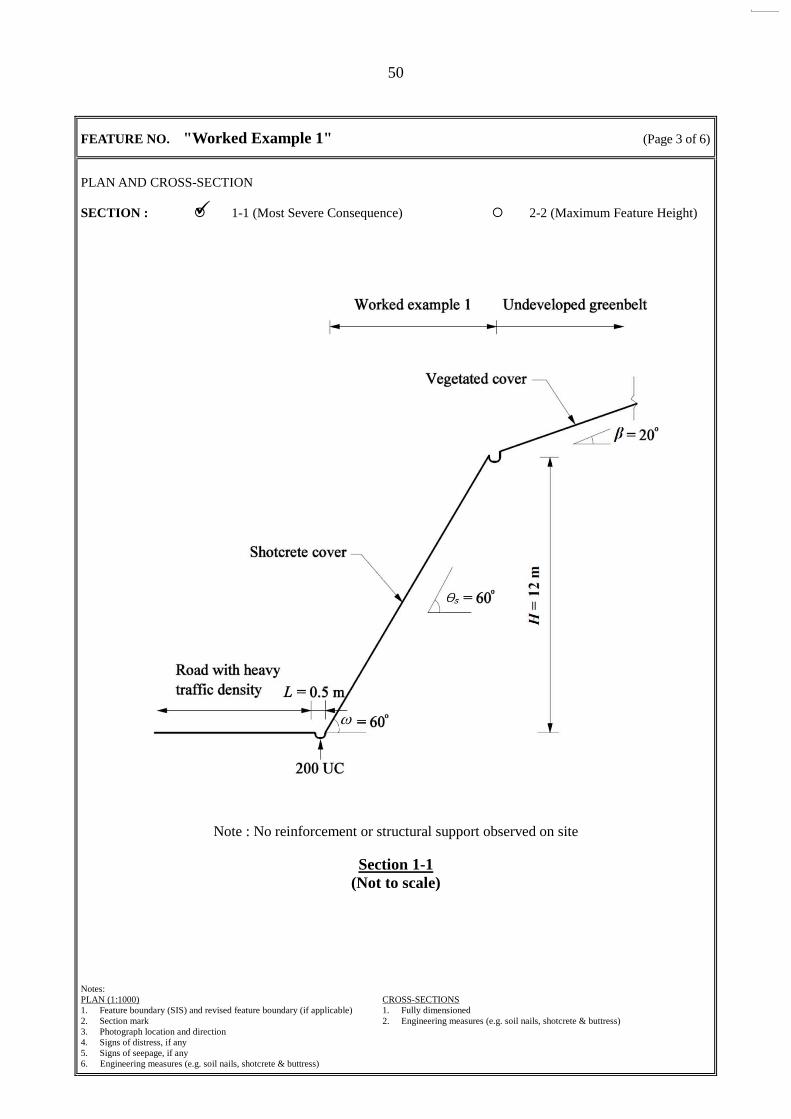
FEATURE NO. "Worked Example 1" (Page 1 of 6)
SECTION : 1-1 (Most Severe Consequence) 2-2 (Maximum Feature Height)
Check if H1 75% x H2. If yes, consider Section 1-1 only; If No, consider both Sections 1-1 and 2-2
Geometry (refer to Figure A1)
Section 1-1 2-2
Section 1-1
2-2
Soil Slope Height, Hs 12 m ― m Feature Height,
H = Hs + Hr + Hcw + Htw 12 m ― m
Rock Slope Height, Hr 0 m ― m Hw = Hcw + Htw 0 ― m
Crest Wall Height,
Hcw 0 m ― m Hc = Hs + Hr 12 m ― m
Toe Wall Height, Htw 0 m ― m Ho = Hs + Hcw ( + Hr’)# 12 m ― m
Upslope Angle, 20 o ― o
# Ho should include the portion of the underlying rock
slope where a realistic slip surface can daylight (Hr’)
Hr’ 0 m ― m
Surcharge above the
Slope Crest, s 0 kPa ― kPa
Effective Height, He
He = Ho (1 + 0.35 tan ) +bγ
s 13.5 m
― m Soil Slope Angle, s 60 o ― o
Average Slope Angle,
60 o ― o
whereb = soil bulk unit weight
3m
kN20
Downslope Gradient,
0 o ― o
Do the dimensions of individual feature types satisfy the requirement of separate Total Score as shown in Figure 2.3 of the
main text ?
If yes, number of data collection sheets required for this section :
o Yes o No
Affected Facilities (refer to Figure 2.1 and Table 2.1 of the main text)
Section 1-1 Facility Type (for roads, please give name) Facility Group Proximity
Toe Road with heavy
traffic density 2(b)
L =
0 m
60
Crest Undeveloped green belt 5 D = 0 m
Section 2-2 Facility Type (for roads, please give name) Facility Group Proximity
Toe ― ― L =
―
―
m
Crest ― ― D = ― m
49
FEATURE NO. "Worked Example 1" (Page 2 of 6)
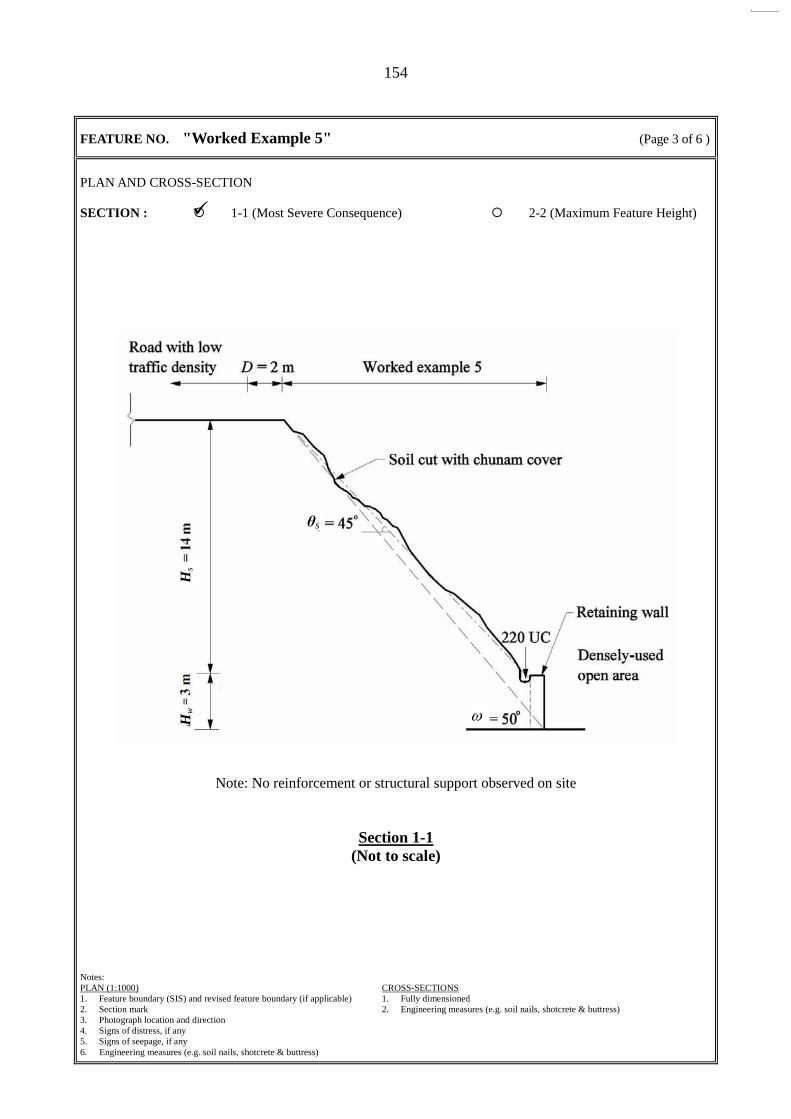
PLAN AND CROSS-SECTION SECTION : 1-1 (Most Severe Consequence) 2-2 (Maximum Feature Height)
Plan (Not to scale)
Notes: PLAN (1:1000) CROSS-SECTIONS 1. Feature boundary (SIS) and revised feature boundary (if applicable) 1. Fully dimensioned 2. Section mark 2. Engineering measures (e.g. soil nails, shotcrete & buttress) 3. Photograph location and direction 4. Signs of distress, if any 5. Signs of seepage, if any 6. Engineering measures (e.g. soil nails, shotcrete & buttress)
1
1
V1
200 UC
200 UC
200 UC
50
FEATURE NO. "Worked Example 1" (Page 3 of 6)
PLAN AND CROSS-SECTION SECTION : 1-1 (Most Severe Consequence) 2-2 (Maximum Feature Height)
Note : No reinforcement or structural support observed on site
Section 1-1
(Not to scale) Notes: PLAN (1:1000) CROSS-SECTIONS 1. Feature boundary (SIS) and revised feature boundary (if applicable) 1. Fully dimensioned 2. Section mark 2. Engineering measures (e.g. soil nails, shotcrete & buttress) 3. Photograph location and direction 4. Signs of distress, if any 5. Signs of seepage, if any 6. Engineering measures (e.g. soil nails, shotcrete & buttress)
51
FEATURE NO. "Worked Example 1" (Page 4 of 6)
SLOPE CHARACTERISTICS
SITE OBSERVATIONS/FINDINGS
Slope Protection
Surface cover with
o Vegetation % (including grass/shrubs/trees)
o Hard cover % (including concrete/chunam)
o Bare surface %
o Others %
1. Based on above, slope surface is Substantially protected (> 75%) Partially protected (25% - 75%) Substantially unprotected (< 25%)
2. Zone(s) of depression or potential ponding exist within the crest area (within H/2)
o Yes o No
If yes, mark the extent of depression or ponding zones on plan and adopt the score of the next higher category in slope protection
Surface Drainage Provision
Location Size
(mm) Spacing
(m)
Type (e.g. U-channel, step channel,
downpipes or ditch)
Adequate Capacity
(Y/N) Remarks
Crest 200 ― U-channel Y Lined Berm ― ― ― ― ― On Slope ― ― ― ― ― Toe 200 ― U-channel Y Lined
o Potential surface runoff converge onto the crest area due to topography (observed or inferred from topographic plan or aerial photos)
o Slope located on a drainage line/zone of depression
o Inadequate surface drainage evident by surface erosion or erosion gully, etc.
o Others observations/records :_______________________________________
Hydrogeological Settings (Provide photographic records of signs of seepage and indicate location & extent on plan & cross-sections)
Signs of Seepage?
If Yes, provide following details
Seepage Location Condition of seepage
Copious Trickling/damp Stain
At or above mid-height
Below mid-height
o Others observations/records: ______________________________________
o Yes o No
Geological Features (Provide photographic records of the site observations)
Presence of the following based on site observations & available records (please tick) : o No potential adverse geological features observed or recorded o Possible relict failure (concave shaped profile) o Shear surfaces/zone o Clay or silt filled discontinuities o Slickensided discontinuities o Discontinuities heavily coated with dark minerals or kaolinite o Significantly kaolinised granite or volcanics o Weathered dykes/sedimentary layers within volcanic formations o Others: __________________________________________________
100
52
FEATURE NO. "Worked Example 1" (Page 5 of 6)
SLOPE CHARACTERISTICS
SITE OBSERVATIONS/FINDINGS
Signs of Distress (Provide photographic records of signs of distress and indicate location & extent on plan & cross-sections)
No indication of any signs of distress
Reported signs of distress in inspection or maintenance records
o Large tension cracks behind crest (approx. ________ mm wide)
o Significant distortion/damage of channels and berms
o Severe cracking and bulging of hard surfacing
o Subsidence inside crest area or on slope surface
o Extensive cracking of slope cover
o Isolated minor cracking of slope cover/Isolated cracking of channels
o Others: _________________________________________________________
1. Where severe signs of distress or hazardous movement is noted, appropriate follow-up action should be taken immediately.
2. Judgment should be made in assessing whether cracked slope cover, damaged channels etc. are due to inadequate maintenance, if so, they should not be regarded as signs of distress.
Instability after Formation/Treatment (Provide photographic records of the inferred failure scar and indicate location on plan & cross-sections)
o No indication of any failure occurred after formation or treatment
o Reported failure Minor inferred past instability recorded in SIRST in 1999
o Possible failure scar observed at _____________ of the slope
Estimated failure volume = _________________ m3
o Debris observed on site/Other observations: _______________________________________________________________
OTHER OBSERVATIONS/REMARKS 1. According to the SIFT report, the slope was formed pre-1963. No record of any
development or modification works carried out on the feature.
2. No signs of distress were recorded in SIRST in 1999.
Notes: (1) Indicate photograph vantage points on plan (2) Add more pages for additional photographic records/sketches
54
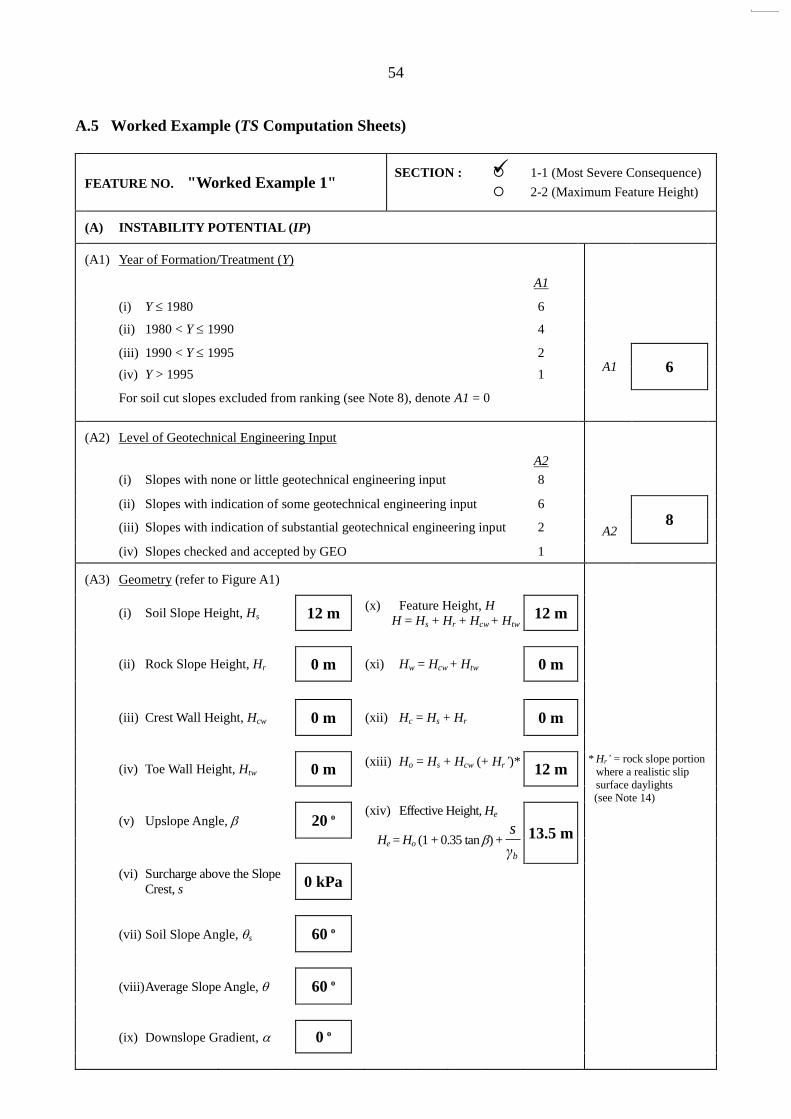
A.5 Worked Example (TS Computation Sheets)
FEATURE NO. "Worked Example 1" SECTION : 1-1 (Most Severe Consequence)
2-2 (Maximum Feature Height)
(A) INSTABILITY POTENTIAL (IP)
(A1) Year of Formation/Treatment (Y)
A1
(i) Y 1980 6
(ii) 1980 < Y 1990 4
(iii) 1990 < Y 1995 2 A1 6
(iv) Y > 1995 1
For soil cut slopes excluded from ranking (see Note 8), denote A1 = 0
(A2) Level of Geotechnical Engineering Input
A2
(i) Slopes with none or little geotechnical engineering input 8
(ii) Slopes with indication of some geotechnical engineering input 6
8
(iii) Slopes with indication of substantial geotechnical engineering input 2 A2
(iv) Slopes checked and accepted by GEO 1
(A3) Geometry (refer to Figure A1)
(i) Soil Slope Height, Hs 12 m (x) Feature Height, H
H = Hs + Hr + Hcw + Htw 12 m
(ii) Rock Slope Height, Hr 0 m (xi) Hw = Hcw + Htw 0 m
(iii) Crest Wall Height, Hcw 0 m (xii) Hc = Hs + Hr 0 m
(iv) Toe Wall Height, Htw 0 m (xiii) Ho = Hs + Hcw (+ Hr’)*
12 m
* Hr’ = rock slope portion
where a realistic slip
surface daylights
(see Note 14)
(v) Upslope Angle, 20 o
(xiv) Effective Height, He
He = Ho (1 + 0.35 tan ) +bγ
s 13.5 m
(vi) Surcharge above the Slope
Crest, s 0 kPa
(vii) Soil Slope Angle, s 60 o
(viii) Average Slope Angle, 60 o
(ix) Downslope Gradient, 0 o
55
Geometry Classification (refer to Figure A2) A3
(i) S1 8
(ii) S2 4
(iii) S3 2 A3 4
(iv) S4 1
(A4) Slope Protection and Surface Drainage
Slope Protection
Surface Drainage
Soil slope or crest area
substantially unprotected
Soil slope or crest area partially protected
Soil slope or crest area
substantially protected
Few or no channels, and potential for convergent flow of surface water above crest or located on a drainage line or depression
8 4 2
Few or no channels 4 2
1.5
Adequate channels 2 1.5 1
A4 1.5
(A5) Site Characteristics
Adverse hydrogeological settings
Adverse geological feature
Significant Moderate Minor/None
Significant 10 8 5
Moderate 8 3 2
Minor/None 5 2 1
A5 1
(B) ACTUAL PERFORMANCE (AP)
(B1) Signs of Distress
B1 (i) Severe 10
(signs of slope movement)
(ii) Moderate 4 (extensive minor defects)
B1 1
(iii) Minor/None 1 (none or few isolated minor defects)
56
(B2) Instability after Slope Formation/Treatment
B2 (i) Massive failures (> 500 m3) 10
(ii) Major or repeated minor failures 5 or records of previous severe signs of distress
(iii) Minor failure or records of previous moderate signs of distress 2
(iv) No failure or records of previous minor signs of distress 1
B2 2
(C) FACILITIES ABOVE CREST OF FEATURE
(i) Type of crest facility (for roads and footpaths, give also the name)
Undeveloped
green belt
Facility Group
C1
(refer to Table 2.1 of the main text) 1 (a) 9
1 (b) 3
(ii) Facility Group 5
2 (a) 2
2 (b) 1
3 0.25
(iii) Distance (D) from crest of feature to crest facility (refer to Figure 2.1 of the main text)
0 m
4 0.002
5 0.0002
C1 0.0002
(iv) Vulnerability Factor, C2 (refer to Table 3.1 of the
main text)
C2 0.15
(D) FACILITY AT TOE OF FEATURE
(i) Type of toe facility (for roads and footpaths, give also the name)
Road/footpath with heavy traffic density
Facility Group
D1
(refer to Table 2.1 of the main text) 1 (a) 9
1 (b) 3
(ii) Facility Group 2(b)
2 (a) 2
2 (b) 1
3 0.25
(iii) Distance (L) from toe of feature to toe facility (refer to Figure 2.1 of the main text)
0.5 m
4 0.002
5 0.0002
(iv) Shadow angle (ω) from crest of feature to toe
facility (refer to Figure 2.1 of the main text)
60 o
D1 1
(v) Vulnerability Factor, D2 (refer to Table 3.2 of the
main text)
D2 0.6
57
CALCULATED SCORES
INSTABILITY SCORE (IS)
IS = A1 × A2 × A3 × A4 × A5 × B1 × B2 IS 576
CONSEQUENCE SCORE (CS)
CS = [C1 x C2 + D1 x D2] x H CS 7.20
TOTAL SCORE (TS)
TS = IS x CS TS 4147.2
58
Appendix B
Details of NPRS for Rock Cut Slopes
59
Contents
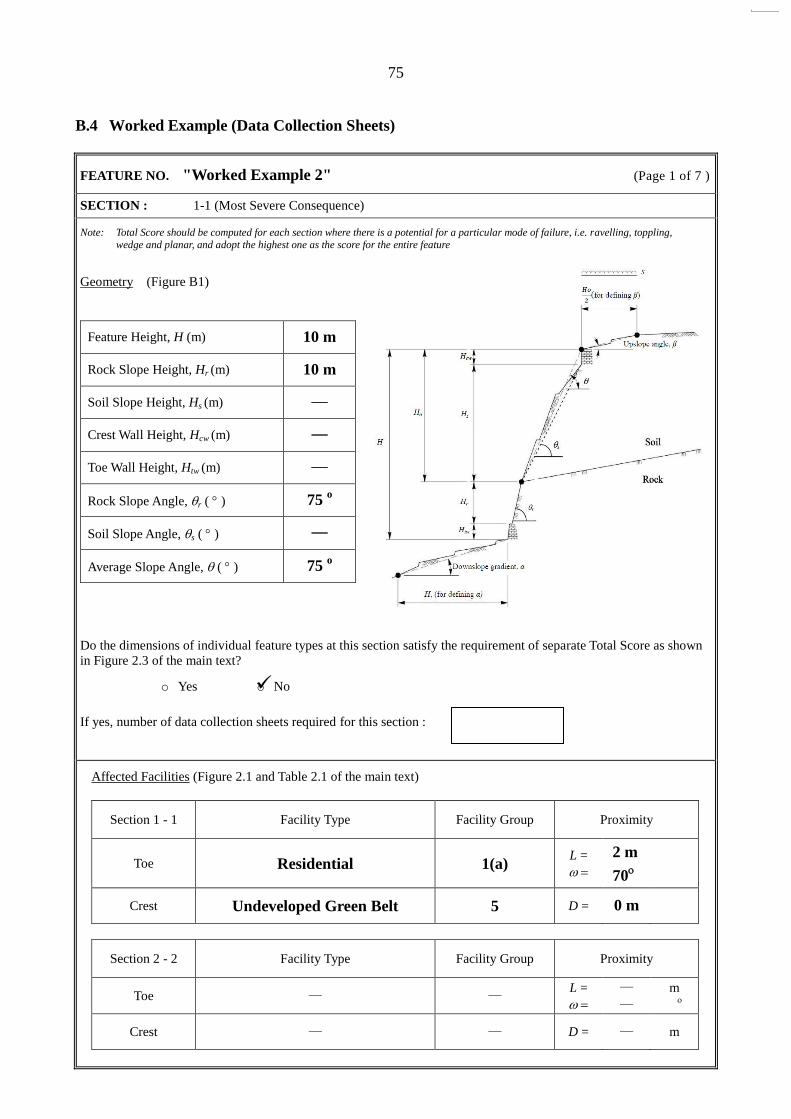
Page No. Contents 59 List of Figure 60 B.1 Total Score (TS) Computation Sheets for Rock Cut Slopes 61 B.2 Guidelines on Data Collection and Score Computation for Rock 65 Cut Slopes B.3 Sample Data Collection Sheets for Rock Cut Slopes 69 B.4 Worked Example (Data Collection Sheets) 75 B.5 Worked Example (TS Computation Sheets) 82
60
List of Figure
Figure No.
Page No.
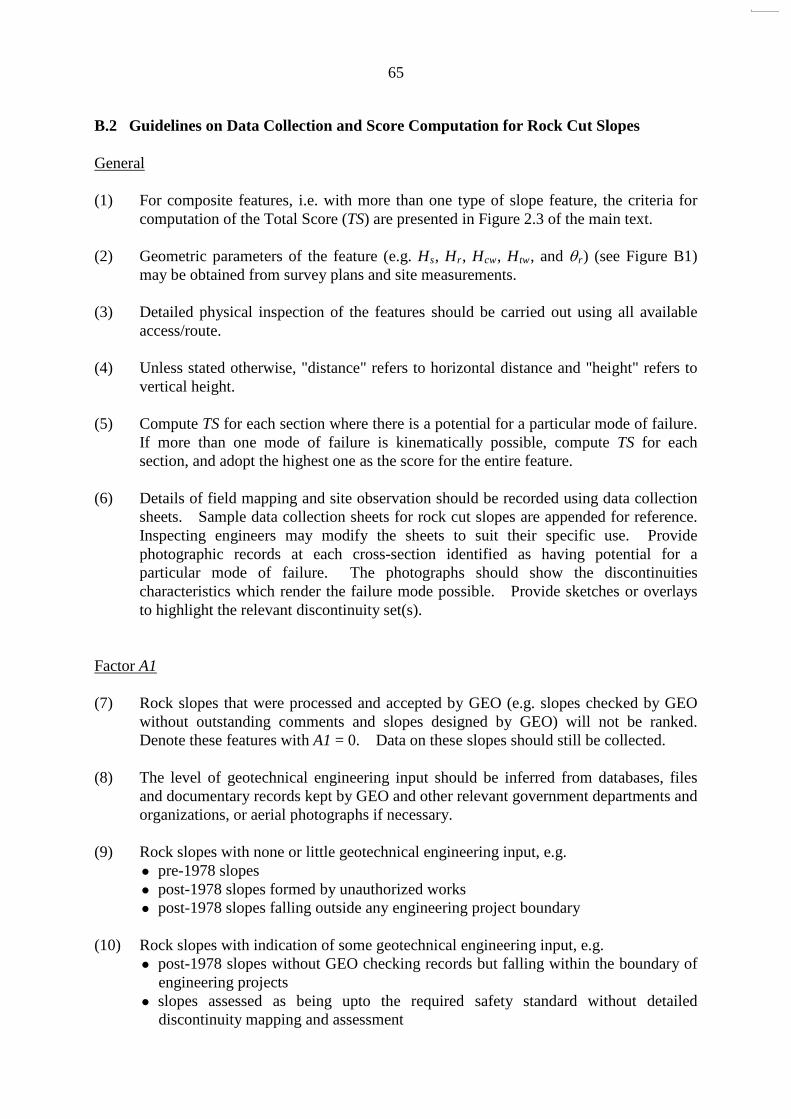
B1 Geometry of Soil and Rock Cut Slopes
68
61
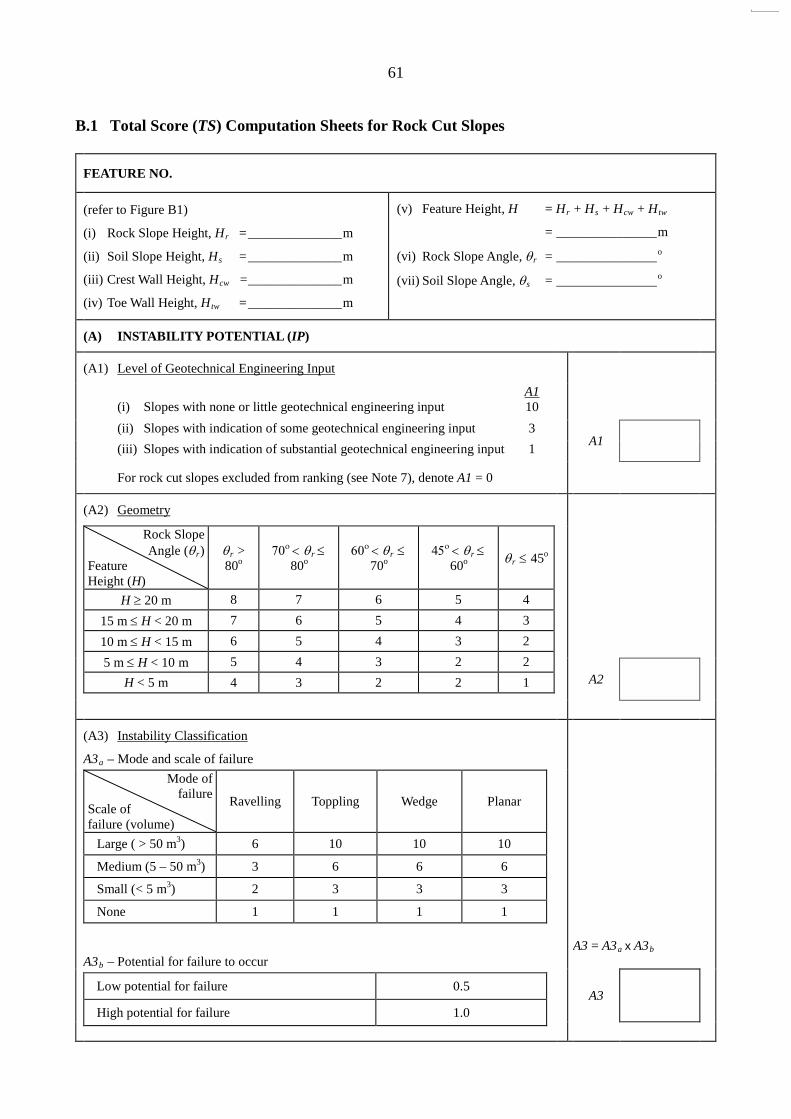
B.1 Total Score (TS) Computation Sheets for Rock Cut Slopes
FEATURE NO.
(refer to Figure B1)
(i) Rock Slope Height, Hr = ______________ m
(ii) Soil Slope Height, Hs = ______________ m
(iii) Crest Wall Height, Hcw = ______________ m
(iv) Toe Wall Height, Htw = ______________ m
(v) Feature Height, H = Hr + Hs + Hcw + Htw
= _______________ m
(vi) Rock Slope Angle, θr = _______________ o
(vii) Soil Slope Angle, θs = _______________ o
(A) INSTABILITY POTENTIAL (IP)
(A1) Level of Geotechnical Engineering Input
A1 (i) Slopes with none or little geotechnical engineering input 10
(ii) Slopes with indication of some geotechnical engineering input 3
A1
(iii) Slopes with indication of substantial geotechnical engineering input 1
For rock cut slopes excluded from ranking (see Note 7), denote A1 = 0
(A2) Geometry
Rock Slope Angle (θr)
Feature Height (H)
θr > 80o
70ο < θr ≤
80o 60ο < θr ≤
70o 45ο < θr ≤
60o θr ≤ 45o
H ≥ 20 m 8 7 6 5 4
15 m ≤ H < 20 m 7 6 5 4 3
10 m ≤ H < 15 m 6 5 4 3 2
5 m ≤ H < 10 m 5 4 3 2 2
H < 5 m 4 3 2 2 1
A2
(A3) Instability Classification
A3a – Mode and scale of failure
Mode of failure
Scale of failure (volume)
Ravelling Toppling Wedge Planar
Large ( > 50 m3) 6 10 10 10
Medium (5 – 50 m3) 3 6 6 6
Small (< 5 m3) 2 3 3 3
None 1 1 1 1
A3b – Potential for failure to occur
Low potential for failure 0.5
High potential for failure 1.0
A3 = A3a x A3b
A3
62
(A4) Seepage and Drainage Conditions
Seepage
Drainage Provision
Heavy Moderate Slight or none
Potential for convergence of runoff at crest area and/or potential for water ingress into open discontinuities
8 6 4
Insufficient or no drainage measures in place to direct water away from the crest area and face of the slope
6 4 2
Drainage measures adequately direct water away from the crest area and face of the slope
4 2 1
A4
(B) ACTUAL PERFORMANCE (AP)
(B1) Signs of Distress
B1 (i) Severe 10
(ii) Moderate 4
(iii) Minor/None 1
B1
(B2) Instability after Slope Treatment/Formation
B2 (i) Documented evidence of past instability (failure volume ≥ 50 m
3) 10
(ii) Documented evidence of past instability (failure volume < 50 m3) 5
(iii) Observed evidence of past instability 2
(iv) No recorded or observed evidence of past instability 1
B2
63
(C) FACILITIES ABOVE CREST OF FEATURE
(i) Type of crest facility (for roads and footpaths, give also the name)
Facility Group C1
(refer to Table 2.1 of the main text) 1 (a) 9
1 (b) 3
(ii) Facility Group 2 (a) 2
2 (b) 1
3 0.25
(iii) Distance (D) from crest of feature to crest facility (refer to Figure 2.1 of the main text)
m
4 0.002
5 0.0002
C1
(iv) Vulnerability Factor, C2 (refer to Table 3.1 of the main text)
C2
(D) FACILITY AT TOE OF FEATURE
(i) Type of toe facility (for roads and footpaths, give also the name)
Facility Group D1
(refer to Table 2.1 of the main text) 1 (a) 9
1 (b) 3
(ii) Facility Group 2 (a) 2
2 (b) 1
3 0.25
(iii) Distance (L) from toe of feature to toe facility (refer to Figure 2.1 of the main text)
m
4 0.002
5 0.0002
D1
(iv) Shadow angle (ω) from crest of feature to toe facility (refer to Figure 2.1 of the main text)
o
(v) Vulnerability Factor, D2 (refer to Table 3.2 of
the main text)
D2
64
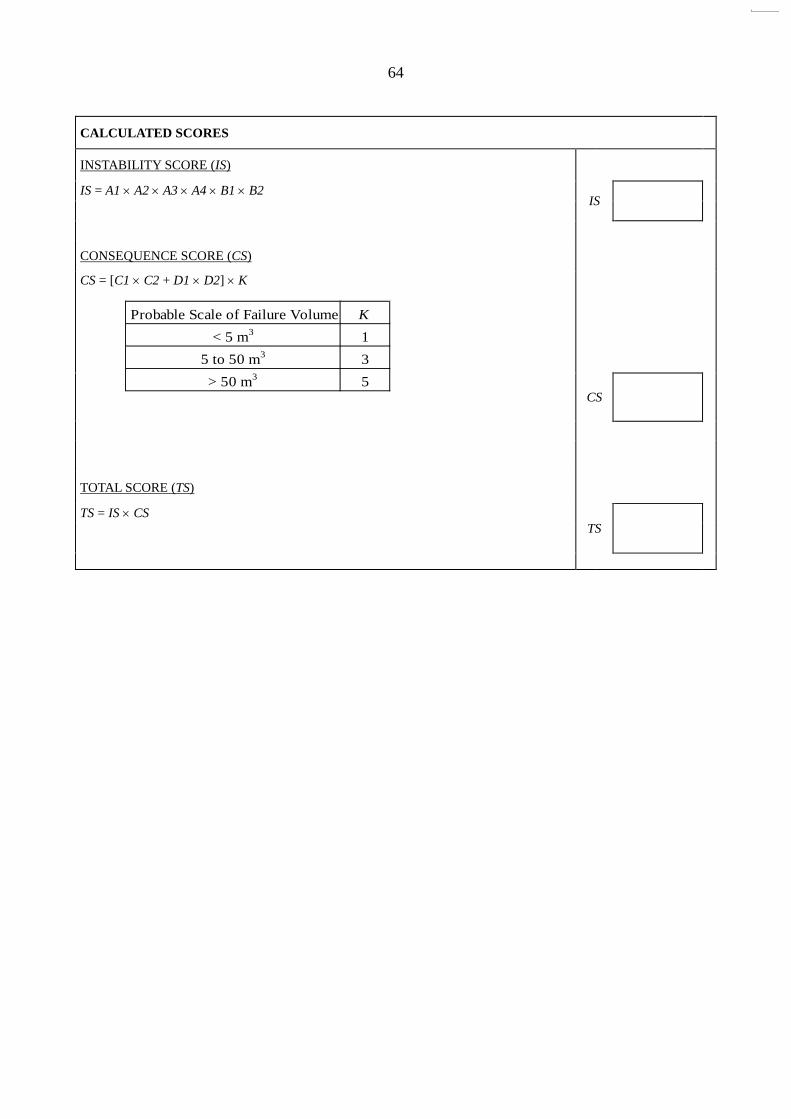
CALCULATED SCORES
INSTABILITY SCORE (IS)
IS = A1 × A2 × A3 × A4 × B1 × B2 IS
CONSEQUENCE SCORE (CS)
CS = [C1 × C2 + D1 × D2] × K
CS
TOTAL SCORE (TS)
TS = IS × CS TS
Probable Scale of Failure Volume K
< 5 m3 1
5 to 50 m3 3
> 50 m3 5
65
B.2 Guidelines on Data Collection and Score Computation for Rock Cut Slopes General (1) For composite features, i.e. with more than one type of slope feature, the criteria for
computation of the Total Score (TS) are presented in Figure 2.3 of the main text. (2) Geometric parameters of the feature (e.g. Hs, Hr, Hcw, Htw, and θr) (see Figure B1)
may be obtained from survey plans and site measurements. (3) Detailed physical inspection of the features should be carried out using all available
access/route. (4) Unless stated otherwise, "distance" refers to horizontal distance and "height" refers to
vertical height. (5) Compute TS for each section where there is a potential for a particular mode of failure.
If more than one mode of failure is kinematically possible, compute TS for each section, and adopt the highest one as the score for the entire feature.
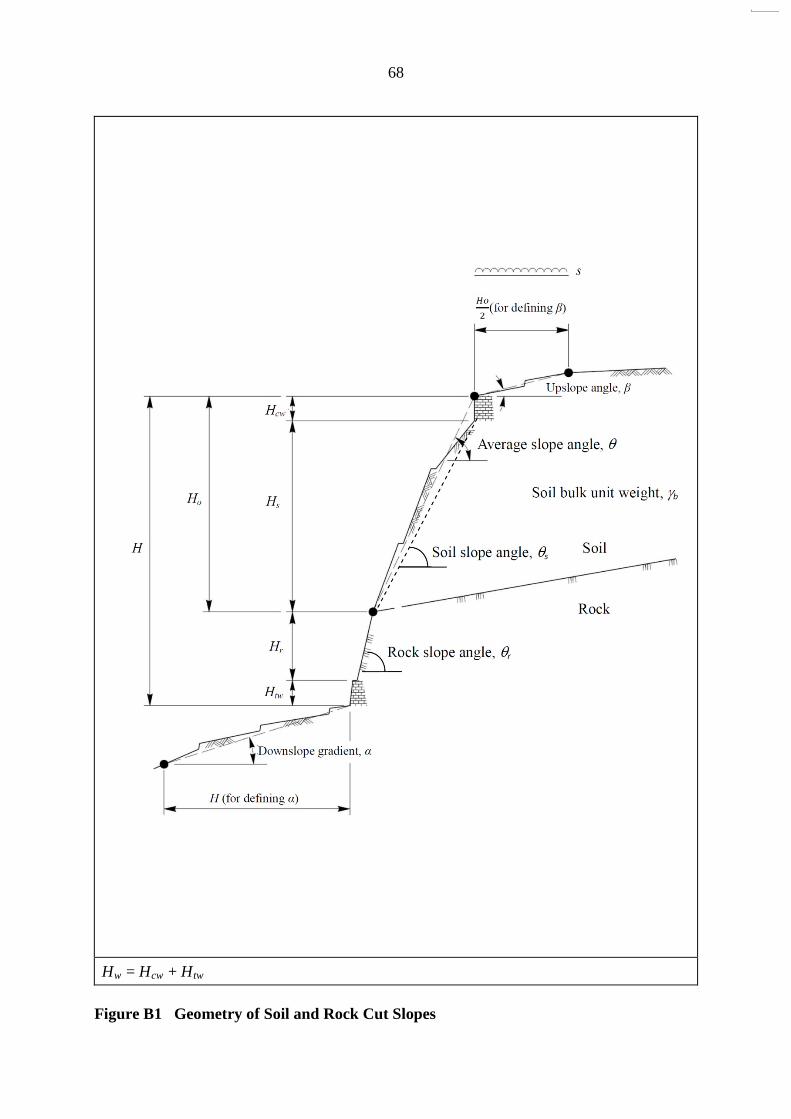
(6) Details of field mapping and site observation should be recorded using data collection
sheets. Sample data collection sheets for rock cut slopes are appended for reference. Inspecting engineers may modify the sheets to suit their specific use. Provide photographic records at each cross-section identified as having potential for a particular mode of failure. The photographs should show the discontinuities characteristics which render the failure mode possible. Provide sketches or overlays to highlight the relevant discontinuity set(s).
Factor A1 (7) Rock slopes that were processed and accepted by GEO (e.g. slopes checked by GEO
without outstanding comments and slopes designed by GEO) will not be ranked. Denote these features with A1 = 0. Data on these slopes should still be collected.
(8) The level of geotechnical engineering input should be inferred from databases, files
and documentary records kept by GEO and other relevant government departments and organizations, or aerial photographs if necessary.
(9) Rock slopes with none or little geotechnical engineering input, e.g.
pre-1978 slopes post-1978 slopes formed by unauthorized works post-1978 slopes falling outside any engineering project boundary
(10) Rock slopes with indication of some geotechnical engineering input, e.g.
post-1978 slopes without GEO checking records but falling within the boundary of engineering projects
slopes assessed as being upto the required safety standard without detailed discontinuity mapping and assessment
66
(11) Rock slopes with indication of substantial geotechnical engineering input, e.g. slopes checked by GEO but with outstanding comments
Factor A2 (12) Feature height (H) and rock slope angle (θr) of the section at which a potential mode
of instability exists. Factor A3 (13) A detailed field inspection is required to identify the probable mode and scale of
failure, e.g. ravelling, toppling, planar and wedge failures. In determining the probable mode and scale of failure, due consideration should be given to the characteristics of the discontinuities, i.e. orientation, spacing, roughness and persistence, which render a particular mode of failure kinematically possible.
(14) Choose "Scale of failure" = "None" if there is no adversely oriented discontinuity set
that may lead to instability; or the existing engineering measures in place can effectively mitigate a particular mode of failure, e.g. installation of wire mesh to prevent ravelling failure, or installation of patterned rock bolts to prevent toppling/planar/wedge failure.
(15) If the slope is concealed by shotcrete/chunam, or some part of the slope is inaccessible
for detailed inspection, the characteristics of the discontinuities may be inferred from inspection of adjoining or nearby man-made features and rock exposures. If none of the discontinuity is accessible for inspection, relate the slope performance to the instability classification where appropriate, e.g. if the slope has records of severe signs of distress (B1 = 10) or a large scale failure (B2 = 10), adopt a high score in the instability classification.
(16) Judgment on the potential for failure to occur should be based on an overall assessment
of the rock mass and the related environmental factors:
high potential for failure to occur, e.g. with steeply dipping and daylighted discontinuities, evidence of progressive deterioration of the slope or the joint conditions, potential build-up of cleft water pressure, or growth of undesirable vegetation, etc.
low potential for failure to occur, e.g. with shallow dipping discontinuities, or
release surface not present Factor A4 (17) Crest area refers to the area within a horizontal distance of H/2 beyond the crest of the
slope.
67
(18) In assessing the adequacy of drainage provisions, the overall setting including the site topography, catchment area and environmental factors that are liable to give rise to convergent flow of surface water should be considered.
(19) The potential for convergent flow of surface water above crest should be determined
from topographic plan and/or aerial photographs. (20) Staining on or below joints often indicates seepage. When seepage or staining is
noted from joints on the slope, its location should be marked on the feature plan. (21) If the inspection is being done in the dry season, seepage conditions could be assessed
based on water staining on the slope surface. Factors B1 and B2 (22) Signs of distress are based on site observations, and relevant inspection and
maintenance records kept by the maintenance departments. (23) Severe signs of distress refer to surficial loosening and small overhanging blocks in
several areas of slope, or tension cracks exist along crest of slope, or large overhanging blocks with potential release surfaces visible.
(24) Moderate signs of distress refer to localised surficial loosening, or small overhanging
blocks. (25) Minor signs of distress refer to no evidence of surficial loosening. (26) Judgment should be made in assessing whether cracked slope cover, damaged channels,
etc. are due to inadequate maintenance. If these are due to inadequate maintenance, they should not be regarded as signs of distress. In case of doubt, a conservative assessment should be made.
(27) Instability after treatment accounts for landslide incidents occurred after the slope was
formed or substantially modified to its present configuration and upgrading works have not been carried out on the slope subsequent to the incidents.
Factors C and D (28) Shadow angle (ω) as shown in Figure 2.1 of the main text should be determined by site
measurements and/or from survey plans and sections.
68
Hw = Hcw + Htw
Figure B1 Geometry of Soil and Rock Cut Slopes
69
B.3 Sample Data Collection Sheets for Rock Cut Slopes
FEATURE NO. (Page 1 of )
SECTION :
Note: Total Score should be computed for each section where there is a potential for a particular mode of failure, i.e. ravelling, toppling, wedge and planar, and adopt the highest one as the score for the entire feature
Geometry (Figure B1)
Feature Height, H (m)
Rock Slope Height, Hr (m)
Soil Slope Height, Hs (m)
Crest Wall Height, Hcw (m)
Toe Wall Height, Htw (m)
Rock Slope Angle, θr ( ° )
Soil Slope Angle, θs ( ° )
Average Slope Angle, θ ( ° )
Do the dimensions of individual feature types at this section satisfy the requirement of separate Total Score as shown in Figure 2.3 of the main text? If yes, number of data collection sheets required for this section :
o Yes o No
Affected Facilities (Figure 2.1 and Table 2.1 of the main text)
Section 1-1 Facility Type Facility Group Proximity
Toe L = m ω = ο
Crest D = m
Section 2-2 Facility Type Facility Group Proximity
Toe L = m ω = ο
Crest D = m
70
FEATURE NO. (Page 2 of )
PLAN AND CROSS-SECTION SECTION : 1-1 (Most Severe Consequence) 2-2 (Maximum Feature Height) Notes: PLAN (1:1000) CROSS-SECTIONS 1. Feature boundary (SIS) and Revised Feature Boundary (if applicable) 1. Fully dimensioned 2. Section Mark 2. Individual sections shall be provided for each probable mode of failure 3. Photo Location and Direction 3. Engineering measures. (e.g. rock bolts/dowels, shotcrete, buttress & wire mesh) 4. Signs of distress, if any 5. Signs of seepage, if any 6. Engineering measures (e.g. rock bolts/dowels, shotcrete, buttress & wire mesh)
71
(Page 3 of )
FEATURE NO.
SITE OBSERVATIONS/FINDINGS
RAVELLING TOPPLING WEDGE PLANAR
Rock lithology and nature of discontinuity (see
Remark A)
Dips of discontinuities/line of intersection of
discontinuities (o)
Persistence of discontinuity (m)
(i.e. max. dimension of trace length exposed)
Discontinuity spacing (m)
Discontinuity roughness and infilling
(see Remarks B and C)
Width of discontinuity aperture (see Remark D)
Probable scale of failure volume (m3)
Remarks
A. Nature of Discontinuity B. Roughness of Discontinuities C. Infilling Materials D. Aperture 1. Joint
2. Fault
3. Tension crack 4. Shear Plane
5. Foliation
6. Bedding
1. Rough
2. Smooth
3. Slickensided
1. Clean/staining
2. Strong/Firm materials
e.g. decomposed/disintegrated rock 3. Weak/Soft materials
e.g. soil/koalin
4. Others
1. Wide (> 200 mm)
2. Moderate (20 – 200 mm)
3. Narrow (0 – 20 mm) 4. Tight (zero)
Note: If slope face is concealed or part of the slope inaccessible, the characteristics or discontinuities should be inferred from inspection of adjoining/nearby exposed slope areas.
72
FEATURE NO. (Page 4 of )
SLOPE CHARACTERISTICS
SITE OBSERVATIONS/FINDINGS
Seepage Condition
(Provide photographic records of signs of seepage and indicate location & extent on plan & cross-sections)
Signs of Seepage?
If Yes, provide following details
Seepage Location Condition of seepage
Copious Trickling/damp Stain
At or above mid-height
Below mid-height
o Other observations/records:________________________________________
o Yes o No
Drainage Provision
Location Size
(mm) Spacing
(m)
Type (e.g. U-channel, step channel,
downpipes or ditch)
Adequate Capacity
(Y/N) Remarks
Crest
Berm
On Slope
Toe
o Potential surface runoff or flow converge onto the crest area due to topography (observed or inferred from topographic plan or aerial photos)
o Slope located on a drainage line/zone of depression
o Inadequate surface drainage provision
o Other observations/records
Instability after Slope Formation/Treatment (Provide photographic records of the inferred failure scar and indicate location on plan & cross-sections)
o No indication of any failure occurred after formation or treatment
o Reported failure _________________________________________________
o Possible failure scar observed at _____________ of the slope
o Estimated failure volume = _________________ m3
o Debris observed on site/Other observations: _______________________________________________________________
73
FEATURE NO. (Page 5 of )
SLOPE CHARACTERISTICS
SITE OBSERVATIONS/FINDINGS
Signs of Distress (Provide photographic records of signs of distress and indicate location & extent on plan & cross-section)
No indication of any signs of distress
Reported signs of distress in inspection or maintenance records
o Tension crack(s) along crest of slope (approx. ________ mm wide max)
o Surficial loosening and small overhanging blocks in several areas
o Large overhanging block with visible release surface
o Localised surficial loosening of blocks or small overhanging blocks
o No noticeable surficial loosening blocks
o Others: _____________________________________________
1. Where severe signs of distress or hazardous movement is noted, appropriate follow-up action should be taken immediately.
2. Judgment should be made in assessing whether cracked slope cover, damaged channels etc. are due to inadequate maintenance, if so, they should not be regarded as signs of distress.
OTHER OBSERVATIONS/REMARKS
INSPECTION DATE: / / (dd/mm/yyyy) BY:
74
FEATURE NO. (Page 6 of )
PHOTOGRAPHIC RECORDS [Caption]
PHOTOGRAPHIC RECORDS [Caption] Notes: (1) Indicate photograph vantage points on plan (2) Add more pages for additional photographic records/sketches
75
B.4 Worked Example (Data Collection Sheets)
FEATURE NO. "Worked Example 2" (Page 1 of 7 )
SECTION : 1-1 (Most Severe Consequence)
Note: Total Score should be computed for each section where there is a potential for a particular mode of failure, i.e. ravelling, toppling,
wedge and planar, and adopt the highest one as the score for the entire feature
Geometry (Figure B1)
Feature Height, H (m) 10 m
Rock Slope Height, Hr (m) 10 m
Soil Slope Height, Hs (m) ―
Crest Wall Height, Hcw (m) ―
Toe Wall Height, Htw (m) ―
Rock Slope Angle, r ( ) 75 o
Soil Slope Angle, s ( ) ―
Average Slope Angle, ( ) 75 o
Do the dimensions of individual feature types at this section satisfy the requirement of separate Total Score as shown
in Figure 2.3 of the main text?
If yes, number of data collection sheets required for this section :
o Yes o No
Affected Facilities (Figure 2.1 and Table 2.1 of the main text)
Section 1 - 1 Facility Type Facility Group Proximity
Toe Residential 1(a) L =
2 m
70
Crest Undeveloped Green Belt 5 D = 0 m
Section 2 - 2 Facility Type Facility Group Proximity
Toe ― ― L =
―
―
m
Crest ― ― D = ― m
76
FEATURE NO. "Worked Example 2" (Page 2 of 7 )
PLAN AND CROSS-SECTION SECTION : 1-1 (Most Severe Consequence) 2-2 (Maximum Feature Height)
Plan (Not to scale)
Notes: PLAN (1:1000) CROSS-SECTIONS 1. Feature boundary (SIS) and Revised Feature Boundary (if applicable) 1. Fully dimensioned 2. Section Mark 2. Individual sections shall be provided for each probable mode of failure 3. Photo Location and Direction 3. Engineering measures. (e.g. rock bolts/dowels, shotcrete, buttress & wire mesh) 4. Signs of distress, if any 5. Signs of seepage, if any 6. Engineering measures (e.g. rock bolts/dowels, shotcrete, buttress & wire mesh)
V1
Moderate seepage
90°/220° 80°/287°
45°/350°
1
1
225 UC
Unstable block 2 x 1.5 x 0.5
Zone of potential ravelling 6 x 4 x 0.4
225 UC
225 UC
225 UC
Potential failure wedge 7 x 4 x 1
V2
77
FEATURE NO. "Worked Example 2" (Page 3 of 7 )
PLAN AND CROSS-SECTION SECTION : 1-1 (Most Severe Consequence) 2-2 (Maximum Feature Height)
Note: No reinforcement or structural support observed on site
Section 1-1 (Not to scale)
Notes: PLAN (1:1000) CROSS-SECTIONS 1. Feature boundary (SIS) and Revised Feature Boundary (if applicable) 1. Fully dimensioned 2. Section Mark 2. Individual sections shall be provided for each probable mode of failure 3. Photo Location and Direction 3. Engineering measures. (e.g. rock bolts/dowels, shotcrete,, buttress & wire mesh) 4. Signs of distress, if any 5. Signs of seepage, if any 6. Engineering measures (e.g. rock bolts/dowels, shotcrete, buttress & wire mesh)
78
(Page 4 of 7 )
FEATURE NO. "Worked Example 2"
SITE OBSERVATIONS/FINDINGS
RAVELLING TOPPLING WEDGE PLANAR
Rock lithology and nature of discontinuity (see
Remark A)
Volcanic Rock with
Joints ―
Volcanic Rock with
Joints ―
Dips of discontinuities/line of intersection of
discontinuities (o)
Multiple sets of
sub-vertical joints ―
45o / 350
o, 50
o / 340
o
90 o
/ 220 o
, 80 o
/ 287 o
―
Persistence of discontinuity (m)
(i.e. max. dimension of trace length exposed) 0.1 – 0.4 m ― 1 – 7 m ―
Discontinuity spacing (m)
0.1 – 0.4 m ― 1 – 5 m ―
Discontinuity roughness and infilling
(see Remarks B and C) Rough and staining ― Rough and staining ―
Width of discontinuity aperture (see Remark D) 0 – 20 mm ― Narrow to tight ―
Probable scale of failure volume (m3)
6 × 4 × 0.4 = 9.6 m3
(H) (W) (D) ―
7 × 4 × 1 = 28 m3
(H) (W) (D) ―
Remarks
A. Nature of Discontinuity B. Roughness of Discontinuities C. Infilling Materials D. Aperture 1. Joint
2. Fault
3. Tension crack 4. Shear Plane
5. Foliation
6. Bedding
1. Rough
2. Smooth
3. Slickensided
1. Clean/staining
2. Strong/Firm materials
e.g. decomposed/disintegrated rock 3. Weak/Soft materials
e.g. soil/koalin
4. Others
1. Wide (> 200 mm)
2. Moderate (20 – 200 mm)
3. Narrow (0-20 mm) 4. Tight (zero)
Note: If slope face is concealed or part of the slope inaccessible, the characteristics or discontinuities should be inferred from inspection of adjoining/nearby exposed slope areas.
79
FEATURE NO. "Worked Example 2" (Page 5 of 7 )
SLOPE CHARACTERISTICS
SITE OBSERVATIONS/FINDINGS
Seepage Condition
(Provide photographic records of signs of seepage and indicate location & extent on plan & cross-sections)
Signs of Seepage?
If Yes, provide following details
Seepage Location Condition of seepage
Copious Trickling/damp Stain
At or above mid-height ― ― ―
Below mid-height ― ―
o Other observations/records:________________________________________
o Yes o No
Drainage Provision
o Potential surface runoff or flow converge onto the crest area due to topography (observed or inferred from topographic plan or aerial photos)
o Slope located on a drainage line/zone of depression
o Inadequate surface drainage provision
o Others observations/records
Remarks : Due to a large catchment exist above the rock slope, the 225 UC at crest and toe are considered inadequate
Location Size
(mm) Spacing
(m)
Type (e.g. U-channel, step channel,
downpipes or ditch)
Adequate Capacity
(Y/N) Remarks
Crest 225 • U-channel N Lined
Berm • • • • •
On Slope • • • • •
Toe 225 • U-channel N Lined
Instability after Slope Formation/Treatment (Provide photographic records of the inferred failure scar and indicate location on plan & cross-sections)
o No indication of any failure occurred after formation or treatment
o Reported failure _________________________________________________
o Possible failure scar observed at _____________ of the slope
Estimated failure volume = _________________ m3
o Debris observed on site/Other observations:
A small amount (< 1 m3) of rock fragments found at slope toe
80
FEATURE NO. "Worked Example 2" (Page 6 of 7 )
SLOPE CHARACTERISTICS
SITE OBSERVATIONS/FINDINGS
Signs of Distress (Provide photographic records of signs of distress and indicate location & extent on plan & cross-section)
No indication of any signs of distress
Reported signs of distress in inspection or maintenance records
o Tension crack(s) along crest of slope (approx. ________ mm wide max)
o Surficial loosening and small overhanging blocks in several areas
o Large overhanging block with visible release surface
o Localised surficial loosening of blocks or small overhanging blocks
o No noticeable surficial loosening blocks
o Others: The slope was in poor maintenance conditions, and potentially unstable blocks and wedges noted in several areas
1. Where severe signs of distress or hazardous movement is noted, appropriate follow-up action should be taken immediately.
2. Judgment should be made in assessing whether cracked slope cover, damaged channels etc. are due to inadequate maintenance, if so, they should not be regarded as signs of distress.
OTHER OBSERVATIONS/REMARKS 1. According to SIFT Report, the slope was formed pre-1978. A GEO Stage 1 study
was carried out in 1986. 2. The residential building at the toe was abandoned at the time of inspection and the
V2 Potential Wedge Failure of the Rock Mass Notes: (1) Indicate photograph vantage points on plan (2) Add more pages for additional photographic records/sketches
82
B.5 Worked Example (TS Computation Sheets)
FEATURE NO. "Worked Example 2"
(refer to Figure B1)
(i) Rock Slope Height, Hr = 10 m
(ii) Soil Slope Height, Hs = - m
(iii) Crest Wall Height, Hcw = - m
(iv) Toe Wall Height, Htw = - m
(v) Feature Height, H = Hr + Hs + Hcw + Htw
= 10 m
(vi) Rock Slope Angle, θr = 75 o
(vii) Soil Slope Angle, θs = -
(A) INSTABILITY POTENTIAL (IP)
(A1) Level of Geotechnical Engineering Input
A1 (i) Slopes with none or little geotechnical engineering input 10
(ii) Slopes with indication of some geotechnical engineering input 3
A1 10
(iii) Slopes with indication of substantial geotechnical engineering input 1
For rock cut slopes excluded from ranking (see Note 7), denote A1 = 0