Page 1
The Olive and Olive Oil value chain in Albania
Rr. Leke Dukagjini, No. 11/1, Kati 4, A. 2 Tirana, Albania
Tel: 042 225237 ; Fax: 042 225237
Email: [email protected]
Website: http://www.dsaconsult.com
`
THE OLIVE AND OLIVE OIL VALUE CHAIN IN
ALBANIA
Authors: Luciano Leonetti, Drini Imami, Andi Stefanllari, Edvin Zhllima
Tirana May 2009
Page 2
The Olive and Olive Oil value chain in Albania
i
TABLE OF CONTENTS
EXECUTIVE SUMMARY ............................................................................................................. 1
METHODOLOGY .......................................................................................................................... 4
1. PRODUCTION AND FOOD BALANCE .................................................................................. 5
1.1 PRODUCTION DYNAMICS ......................................................................................................... 5
1.1.1 production and food balance overview ........................................................................... 5
1.1.2 Evaluation of available statistics ..................................................................................... 6
1.2 STRUCTURE OF PRODUCTION ................................................................................................... 7
2. PROCESSING AND DISTRIBUTION .................................................................................... 10
2.1 STRUCTURE OF PROCESSING (ACTORS AND FIGURES) ............................................................ 10
2.1.1 Structure of the industry................................................................................................ 10
2.1.2 Categories of olive processors and business practices and trends in olives processing
11
2.1.3 Procurement of olives and product policy .................................................................... 16
2.2 DISTRIBUTION ....................................................................................................................... 17
2.2.1 Main characteristics and flows in the olive oil and table olives distribution system ... 17
2.2.2 The main distribution channels of olive oil and table olives ........................................ 17
3. COST, PRICE AND MARGIN ANALYSIS ............................................................................ 21
3.1 OLIVE PRODUCTION COSTS .......................................................................................... 21
3.2 OLIVE OIL PROCESSING AND RELEVANT MARK UP ................................................................. 26
3.2.1 Processing cost .............................................................................................................. 26
3.22 Evolution of factory gate olive oil prices and oil mills mark up ................................... 28
3.3 DISTRIBUTION MARK UP AND RETAIL PRICES ......................................................................... 29
3.3.1 Evolution of prices and margins in distribution. ........................................................... 29
3.3.2 Distribution margins of main Albanian brands ............................................................. 30
4. INTERNATIONAL TRADE ................................................................................................. 34
5 CONSUMER PREFERENCES .................................................................................................. 35
5.1 CONSUMERS’ SEGMENTS AND KEY PREFERENCE FACTORS .................................................... 35
5.2 IMPLICATIONS OF CONSUMERS’ PROFILES AND SET OF PREFERENCES ON SECTOR POLICIES ... 37
6 SUPPORT BY THE GOVERNMENT FOR THE SECTOR ..................................................... 37
6.1 SUBSIDIES ............................................................................................................................. 37
6.2 MARKET INFORMATION SYSTEM ........................................................................................... 39
7. FUTURE PRODUCTION AND INVESTMENT SCENARIOS .............................................. 39
Page 3
The Olive and Olive Oil value chain in Albania
ii
7.1 PLANNED EXPANSION OF THE PRODUCTION BASE AND EXPECTED SCENARIOS OF SUPPLY AND
DEMAND ...................................................................................................................................... 39
7.2 INVESTMENT COSTS RELATED TO EXPANDING PRODUCTION BASE ......................................... 42
8 FINDINGS OF THE ANALYSIS AND SWOT APPRAISAL ................................................. 43
8.1 THE DOMESTIC SUPPLY: A GROWING SECTOR WITH UNRESOLVED CONSTRAINTS ................... 43
8.1.1 Development perspectives and constraints factors in olive oil production ................... 44
8.1.2 Development perspectives and constraints factors in table olives production and
processing .............................................................................................................................. 47
8.1.3 Rapid changes in the competitive environment ............................................................ 48
8.2 EVOLUTION OF DEMAND AND MAIN FACTORS DRIVING CONSUMER PREFERENCE .................. 50
8.3 SWOT MATRIX .................................................................................................................... 51
8.4 CONCLUSIONS ....................................................................................................................... 52
9.1 MAIN FACTORS FOR DEVELOPMENT ...................................................................................... 52
9.2 RECOMMENDATIONS AND OUTLINE FOR A SECTOR DEVELOPMENT INITIATIVE ...................... 57
Page 4
The Olive and Olive Oil value chain in Albania
1
EXECUTIVE SUMMARY
The olive and olive oil sector is an important segment of Albanian primary production and
agroindustry. Primary production of olives accounts for approximately 16% of total fruit output
in value, including grapes. The number of planted trees exceeds 5 m and is rapidly increasing, as
a response to sustained demand, good prices and government subsidies for expanding the
production base.
Official data on olive oil production show an output ranging between 6,400 Mt in bad harvest
years and 11,900 Mt in good harvest years. There is a structural production deficit of
approximately 1,000 Mt per year, mostly covered by imports of bottled olive oil from Italy and
other EU countries. Main production areas of olives for olive oil are Fier, Vlora and the area
between Elbasani and Tirana. In these areas, 90% to 95% of cultivars are for olive oil production.
Demand of table olives is also growing. Considering also olives from olive oil cultivars
processed as table olives, about 15% to 20% of total production of olives is processed/used as
table olives. There is also a structural deficit of table olives, mainly covered by imports from
Greece. Production of table olives is concentrated in Berat, where it is estimated that more than
90% of olive trees belong to the table olive variety Kokerrmadh.
Processing industry is specialized: with the exception of a medium-sized producer in Berat, all
the other industries are producing either table olives or olive oil. Official data for 2009 show 108
enterprises processing all edible oils, including olive oil. Some larger enterprises have more than
one oil mill and some oil mills are not registered. The estimate number of working oil mills score
about 150 units. About 16 enterprises are processing table olives.
Olive oil industry can be divided in four main clusters, namely: i) small localized oil mills,
representing the majority of enterprises, mostly providing to farmers the service of processing
olives into olive oil, against a fee. They also produce for themselves some olive oil; ii) small
modern producers; this is the most qualitative group of processors, producing high quality olive
oil that they sell with their own brand; these oil mills also get a share of revenues from fees for
processing farmers’ olives; iii) medium-sized processors, mostly processing olives for
themselves and selling olive oil in bulk to bottlers and; iv) industrial producers and bottlers,
whose main business is to buy olive oil in bulk and bottle the product. Some of them are also
producing part of the olive oil they bottle.
Equipment of oil mills is generally less than 15 years old, including many second hand lines,
therefore from the technical point of view the lines are mostly not obsolete. Premises, especially
of smaller mills are generally not in good conditions and do not comply with EU standards. A
particularly critical aspect is environmental management, as there is not even a regulatory
framework for management of wastes and effluents.
There are two categories of table olives processors: i) producers of table olives in retail
packaging (6 to 7 enterprises, included semi-informal ones) and, ii) producers of table olives in
bulk (about 10 enterprises). The specialization is not related to the size: one of the two largest
producers makes both table olives in retail and bulk package and the other only in bulk.
Distribution is still mostly based on traditional channels: many consumer buy directly from
farmers, in the oil mills or from corner shops; sales of non-bottled olive oil in traditional retailing
are also common. However, the share of bottled olive oil is rapidly growing and the rapid growth
of supermarket chains after 2006 is sensibly changing the distribution patterns.
Page 5
The Olive and Olive Oil value chain in Albania
2
The analysis of costs, mark-ups and margins shows an unusual share of value remaining at
production level. This situation is going to change with the strengthening of larger industrial
bottlers and the consolidation in the distribution sector.
Margins are particularly high in olive production (well over 100%), even if total revenue per
farm and per ha is very low, as most producers try to minimize cash costs and the size of farms is
quite small.
Demand of olive oil and table olives is increasing, in parallel with revenues growth and
urbanization. Consumption per capita is becoming more homogeneous throughout the country,
while in the past was extremely high in production areas and near to zero in non-production areas
and also some segmentation is emerging, with the price being no more the only factor of choice
for the new emerging middle-class.
Consumers strongly prefer domestic production, but do not trust domestic industrial producers;
as a result, imported bottled olive oil covers a large share of the highest market segment. Also in
this case, the development of supermarket chains is rapidly changing the competitive
environment, with the largest domestic producers are marketing out smaller enterprises, even the
most qualitative ones.
Even if the sector is expanding and domestic industry is consolidating, there are several
constraints to the competitiveness of domestic production, the main being: i) the high production
cost and farm gate price of raw olives; ii) the extremely high oscillation of output from one year
to another, reflected in oscillation of prices, which is related to the lack of investments for
increasing and stabilizing productivity of trees iii) the low quality of a large share of olives and
olive oil, mostly due to improper harvesting practices and logistics; and iv) insufficient controls
against fiscal and commercial frauds, resulting in lower trust of consumers in domestic
production, distort competition against formalized producers and slows down the process of
consolidation of the industry.
As a whole, there is a concrete risk that the strengthening of the downstream part of the value
chain (bottlers and supermarket chains) will lead to increasing imports of cheap olive oil in bulk
in bad harvest years and in increasing share of imported products, in parallel with the expansion
of supermarket chains.
The key issue is the low productivity per tree and the high oscillation of yields from one year to
another. Both factors are not improving in the years; the driver for output growth is only the
increasing number of trees; this situation is due to small size of plots, lack of agronomic services,
few investments in in-farm irrigation and unrealistic expectations of farmers about revenues and
sale prices. This last aspect is also related to the high percentage of olive oil directly sold from
producers to final consumers, as many farmers try to keep the olive oil for direct sale when prices
of olives for processing drop, and on the other hand, many consumer are more confident about
the quality, when they buy the olive oil directly from producers.
This situation is creating a dangerous gap between domestic and international prices: the general
trend of international prices of olive oil is decreasing, in spite of a spark in 2005 and 2006. The
wholesale international price of extra-virgin olive oil (in Italy, Greece and Spain) is now
corresponding to the farm gate price in Albania of two kg of raw olives for processing, making
the situation not sustainable in the long term.
Page 6
The Olive and Olive Oil value chain in Albania
3
The Government is undertaking an extremely ambitious policy for expanding the production
base, targeting a fivefold increase of the total number of olive trees, i.e. up to 25 m trees. For this
purpose, most subsidies provided from 2007 to the agricultures sector from the State (scoring
about 10 m Euro in 2008) are addressed to the olive and olive oil value chain.
Focusing investments in increasing yields (production per tree), stabilizing output from one year
to another and improving harvesting and pest management practices would be at present a more
cost/effective option for ensuring a sustainable development of the sector.
Priority actions include: i) improvement of value chain governance tools, including
harmonization of laws to EC acquis, ii) increased technical assistance to farmers to increase
productivity and stabilize output; iii) support to value chain operators for facilitating access to
services, iv) supporting establishment and strengthening of farmers’ associations and
cooperatives and; v) Optimize the use of effluents and by-product in olive oil industry, to
mitigate environmental impact of olive oil production and increase profitability in olive oil
processing.
Page 7
The Olive and Olive Oil value chain in Albania
4
METHODOLOGY
This study is based on data and information collected in 2009, within the framework of the FAO
TCPF initiative “Formulation of a Technical Assistance Project in Support of Albania’s Olive Oil
Sector”.
The study is based on primary data, collected through interviews with value chain operators,
donor organizations and policy makers and on secondary data, taken from national and
international statistics. Monthly data were used when available and appropriate. We also referred
to literature and publications on olive and olive oil production in Albania.
During the FAO project “Agriculture Production Project in Albania” a panel of representative
shops in seven cities was established, to monitor structure of competition and retail prices of
olive oil and wine. As part of the sector analysis exercise, the panel was updated and relevant
data collected.
In addition, there has been carried out a consumer preference survey, using the latent choice
method, clustering consumers according to product attributes and socio-economic background.
Data have been analyzed to assess market size, price, production and international trade
developments.
Page 8
The Olive and Olive Oil value chain in Albania
5
1. PRODUCTION AND FOOD BALANCE
1.1 PRODUCTION DYNAMICS
1.1.1 Production and food balance overview
Official statistics provided by MAFCP provide information about number of trees (total and in
production), olive production (without distinguishing between destinations or variety of trees),
output (see Table 1.1) and structure of the olive oil industry and an estimate of the olive oil
produced on behalf of farmers.
Table 1.1: Key statistics on olive production base
Statistic items 2004 2005 2006 2007 2008
Olive trees 000 4,092 4,264 4,497 4,715 5,011
Olive trees in production 000 3,429 3,488 3,603 3,728 4,179
Total output Mt 58,700 30,160 40,195 28,120 56,200
Production per tree kg 30.2 8.6 11.2 7.0 15.8
Olive oil retained by farmers
Mt
No data No data 4,756 2,570 6,274
Olive oil from oil industries
Mt
4,036 3,454 8,985 3,879 5,634
Source: MAFCP statistical yearbook
In qualitative terms, data are consistent with the opinion of all the interviewed stakeholders,
considering olive growing and olive oil production as a food chain with good perspective. The
trend of increasing the olive trees stock is now consolidated with approximately 5% of the total
stock increasing each year.
After a peak in 2004, production in the years 2005-2007 has been low in spite of the increasing
production base; this was due to adverse climatic conditions and to the natural oscillation of
production of olive trees among the years, not mitigated by appropriate agronomic practices and
irrigation. After having reached a new peak in 2008, provisional 2009 data show another year of
low output.
Albanian domestic production of olive oil meets 4/5 of the domestic demand while imports are
significant and much higher than exports, leading to a trade deficit of more than 1,000 tons in
some years (Table 1.2).
Page 9
The Olive and Olive Oil value chain in Albania
6
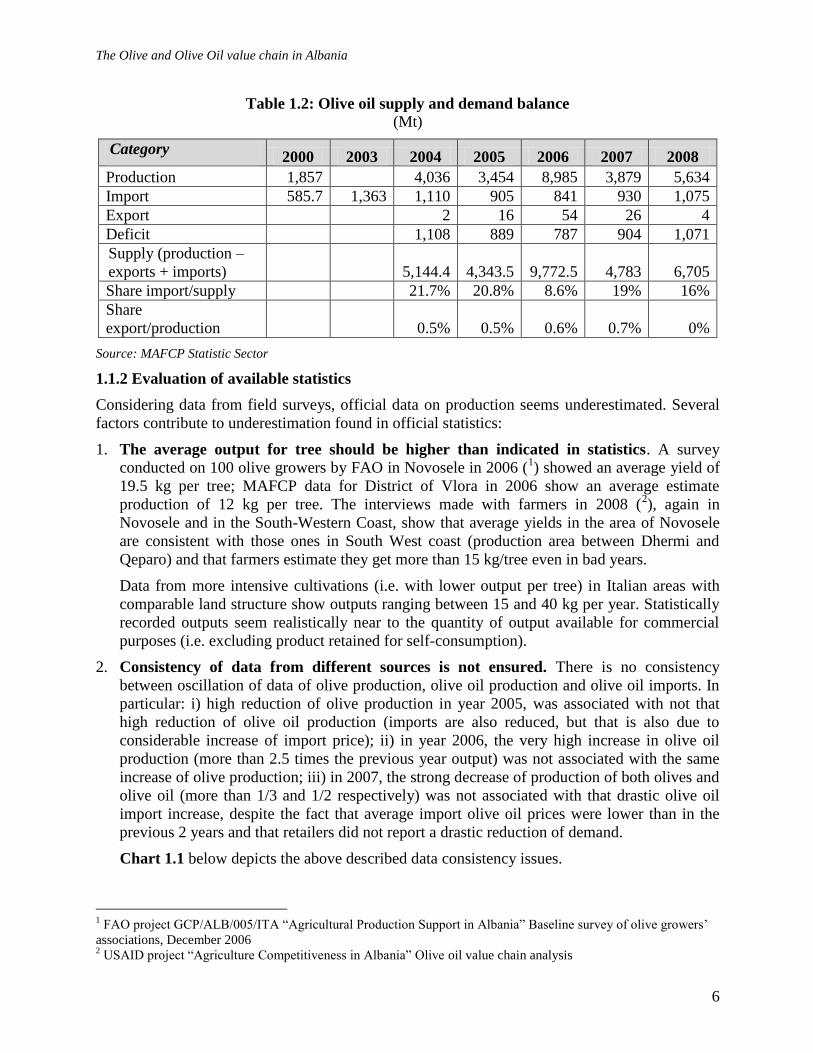
Table 1.2: Olive oil supply and demand balance
(Mt)
Category 2000 2003 2004 2005 2006 2007 2008
Production 1,857 4,036 3,454 8,985 3,879 5,634
Import 585.7 1,363 1,110 905 841 930 1,075
Export 2 16 54 26 4
Deficit 1,108 889 787 904 1,071
Supply (production –
exports + imports) 5,144.4 4,343.5 9,772.5 4,783 6,705
Share import/supply 21.7% 20.8% 8.6% 19% 16%
Share
export/production 0.5% 0.5% 0.6% 0.7% 0%
Source: MAFCP Statistic Sector
1.1.2 Evaluation of available statistics
Considering data from field surveys, official data on production seems underestimated. Several
factors contribute to underestimation found in official statistics:
1. The average output for tree should be higher than indicated in statistics. A survey
conducted on 100 olive growers by FAO in Novosele in 2006 (1) showed an average yield of
19.5 kg per tree; MAFCP data for District of Vlora in 2006 show an average estimate
production of 12 kg per tree. The interviews made with farmers in 2008 (2), again in
Novosele and in the South-Western Coast, show that average yields in the area of Novosele
are consistent with those ones in South West coast (production area between Dhermi and
Qeparo) and that farmers estimate they get more than 15 kg/tree even in bad years.
Data from more intensive cultivations (i.e. with lower output per tree) in Italian areas with
comparable land structure show outputs ranging between 15 and 40 kg per year. Statistically
recorded outputs seem realistically near to the quantity of output available for commercial
purposes (i.e. excluding product retained for self-consumption).
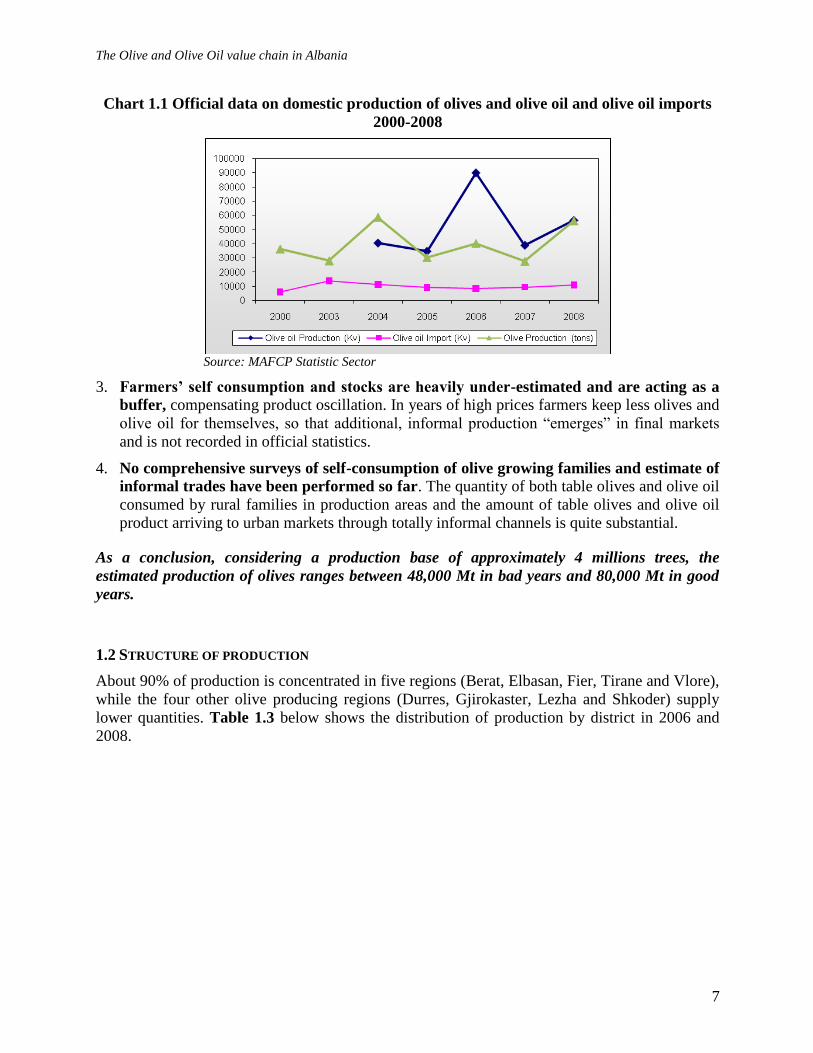
2. Consistency of data from different sources is not ensured. There is no consistency
between oscillation of data of olive production, olive oil production and olive oil imports. In
particular: i) high reduction of olive production in year 2005, was associated with not that
high reduction of olive oil production (imports are also reduced, but that is also due to
considerable increase of import price); ii) in year 2006, the very high increase in olive oil
production (more than 2.5 times the previous year output) was not associated with the same
increase of olive production; iii) in 2007, the strong decrease of production of both olives and
olive oil (more than 1/3 and 1/2 respectively) was not associated with that drastic olive oil
import increase, despite the fact that average import olive oil prices were lower than in the
previous 2 years and that retailers did not report a drastic reduction of demand.
Chart 1.1 below depicts the above described data consistency issues.
1 FAO project GCP/ALB/005/ITA “Agricultural Production Support in Albania” Baseline survey of olive growers’
associations, December 2006 2 USAID project “Agriculture Competitiveness in Albania” Olive oil value chain analysis
Page 10
The Olive and Olive Oil value chain in Albania
7
Chart 1.1 Official data on domestic production of olives and olive oil and olive oil imports
2000-2008
Source: MAFCP Statistic Sector
3. Farmers’ self consumption and stocks are heavily under-estimated and are acting as a
buffer, compensating product oscillation. In years of high prices farmers keep less olives and
olive oil for themselves, so that additional, informal production “emerges” in final markets
and is not recorded in official statistics.
4. No comprehensive surveys of self-consumption of olive growing families and estimate of
informal trades have been performed so far. The quantity of both table olives and olive oil
consumed by rural families in production areas and the amount of table olives and olive oil
product arriving to urban markets through totally informal channels is quite substantial.
As a conclusion, considering a production base of approximately 4 millions trees, the
estimated production of olives ranges between 48,000 Mt in bad years and 80,000 Mt in good
years.
1.2 STRUCTURE OF PRODUCTION
About 90% of production is concentrated in five regions (Berat, Elbasan, Fier, Tirane and Vlore),
while the four other olive producing regions (Durres, Gjirokaster, Lezha and Shkoder) supply
lower quantities. Table 1.3 below shows the distribution of production by district in 2006 and
2008.
Page 11
The Olive and Olive Oil value chain in Albania
8
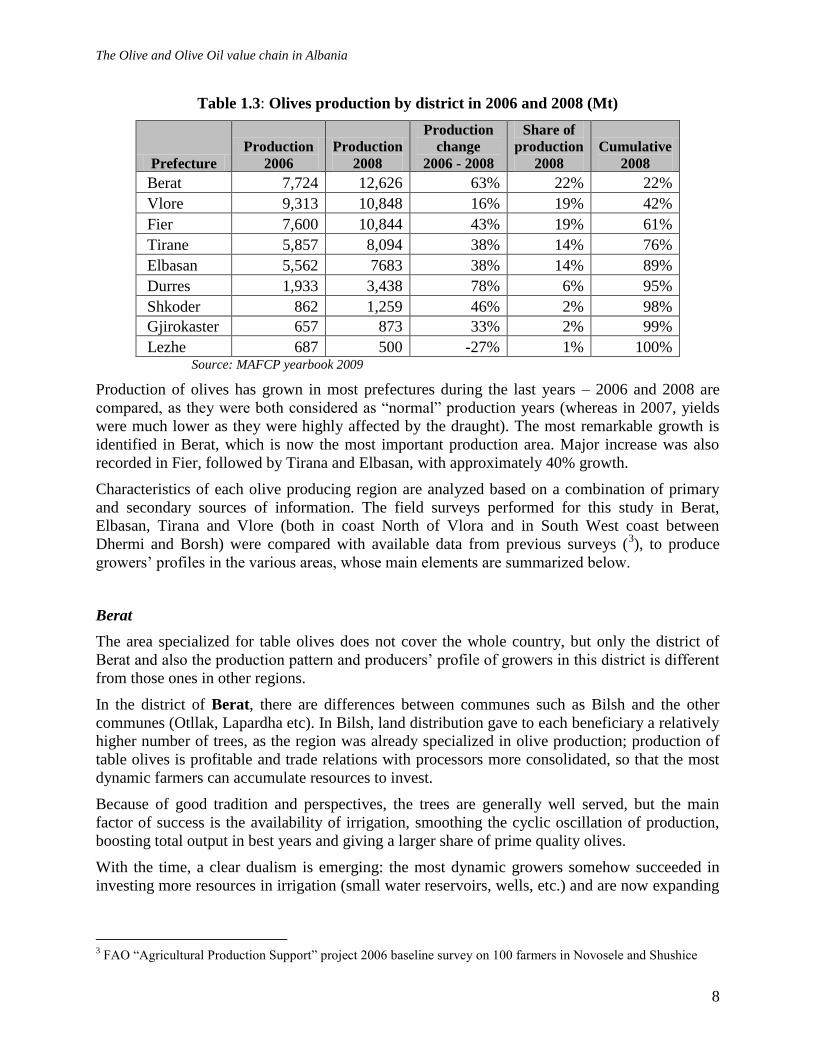
Table 1.3: Olives production by district in 2006 and 2008 (Mt)
Prefecture
Production
2006
Production
2008
Production
change
2006 - 2008
Share of
production
2008
Cumulative
2008
Berat 7,724 12,626 63% 22% 22%
Vlore 9,313 10,848 16% 19% 42%
Fier 7,600 10,844 43% 19% 61%
Tirane 5,857 8,094 38% 14% 76%
Elbasan 5,562 7683 38% 14% 89%
Durres 1,933 3,438 78% 6% 95%
Shkoder 862 1,259 46% 2% 98%
Gjirokaster 657 873 33% 2% 99%
Lezhe 687 500 -27% 1% 100% Source: MAFCP yearbook 2009
Production of olives has grown in most prefectures during the last years – 2006 and 2008 are
compared, as they were both considered as “normal” production years (whereas in 2007, yields
were much lower as they were highly affected by the draught). The most remarkable growth is
identified in Berat, which is now the most important production area. Major increase was also
recorded in Fier, followed by Tirana and Elbasan, with approximately 40% growth.
Characteristics of each olive producing region are analyzed based on a combination of primary
and secondary sources of information. The field surveys performed for this study in Berat,
Elbasan, Tirana and Vlore (both in coast North of Vlora and in South West coast between
Dhermi and Borsh) were compared with available data from previous surveys (3), to produce
growers’ profiles in the various areas, whose main elements are summarized below.
Berat
The area specialized for table olives does not cover the whole country, but only the district of
Berat and also the production pattern and producers’ profile of growers in this district is different
from those ones in other regions.
In the district of Berat, there are differences between communes such as Bilsh and the other
communes (Otllak, Lapardha etc). In Bilsh, land distribution gave to each beneficiary a relatively
higher number of trees, as the region was already specialized in olive production; production of
table olives is profitable and trade relations with processors more consolidated, so that the most
dynamic farmers can accumulate resources to invest.
Because of good tradition and perspectives, the trees are generally well served, but the main
factor of success is the availability of irrigation, smoothing the cyclic oscillation of production,
boosting total output in best years and giving a larger share of prime quality olives.
With the time, a clear dualism is emerging: the most dynamic growers somehow succeeded in
investing more resources in irrigation (small water reservoirs, wells, etc.) and are now expanding
3 FAO “Agricultural Production Support” project 2006 baseline survey on 100 farmers in Novosele and Shushice
Page 12
The Olive and Olive Oil value chain in Albania
9
their groves, while the others from the other communes are not expanding, although getting
relatively good revenues out of the available trees.
As emulation influences the behavior of growers, village clusters of expanding entrepreneurs are
also emerging, while production and surface in other villages remain stable.
Elbasan
Distribution of olive trees in Elbasan generated a kind of dualism between very small groves and
relatively large ones, these last being mainly attributed to more numerous families and to the
recovery of previous property rights.
In many cases such distribution did not correspond to the priority given by beneficiaries to the
received assets. As a result, output is low, due to inadequate care and agronomic practices.
Tirana and Durres
Property rights and competition for land use are major issues around Tirana. Illegal occupation of
land is rather diffused and has been partially sanctioned by law, thus paving the way to long
litigations about the final ownership of the land with those who received the property rights on
the base of pre-war ownership. At the same time, the value of land is high and rising, as the need
of land for the continuing expansion of Tirana urban area and for SME around the city are clearly
the main drivers of owners’ land use decisions.
As a result of the above, olive groves are not properly tendered and generally, the remarkable
potential of Tirana hills for olive growing is largely under-used. Local olive processors face
difficulties in collecting enough quality olives to process and new ventures (i.e Agrotal) are
establishing their own olives groves to secure at least a part of the needed raw olives inflows.
Such a situation is also reflected in statistics: the expansion of olives groves in the area of Durres
is negligible and that one in Tirana, district has been much lower than national average in 2007,
in spite of available subsidies.
Vlora - Novosele
This area, specialized in olives for double purpose (of Kalinjioti cultivar) and olive oil production
(mainly Frantoio cultivar), appears one of the most dynamic in the country.
Farmers are planting new orchards, although few investments have been reported in irrigation
and mechanization. Trees are also comparatively better serviced, even if pruning, fertilization
and collection practices are still largely inadequate when compared with other non-EU key
Mediterranean producers.
The area owned in average by each grower is larger than in inner and less developed areas. A
survey made by FAO in 2006 on a sample of 100 farmers (4) showed that the majority of farmers
in Novosele had more than 1.5 ha (and 20% more than 2.5 ha), while in the more internal area of
Shushice, the majority of growers had less than 1.5 ha.
4 FAO “Agricultural Production Support” project 2006 baseline survey on 100 farmers in Novosele and Shushice
Page 13
The Olive and Olive Oil value chain in Albania
10
Vlora- South West coast
The South West olive production area is made by the coastal hills between Dhermi and Borsh
and includes part of the districts of Vlora and Saranda.
A large number of olive trees – many quite old – are planted in this major production area, but
they are largely not attended. Property rights problems combined with massive emigration, stand
behind the lack of investments and care for olives in these areas; remittances are a major source
of income.
In such conditions, olive trees are not attended, fertilized and pruned. Even when prices are
exceptionally high, as in 2007 and 2009, it is necessary to bring temporary workers from other
areas of the country (5), who sometimes keep up to 50% of the olives in exchange of their work.
Lack of services contribute to stabilize the output per tree in this area, which is always low, even
if the area as a whole remain a key supply source for many of the main processing plants.
2. PROCESSING AND DISTRIBUTION
2.1 STRUCTURE OF PROCESSING (ACTORS AND FIGURES)
2.1.1 Structure of the industry
Olive oil processing is mainly a separate business from table olive production. Only in Berat the
table olives processors (the main being Sydney) are also producing olive oil.
There is not an exact census of olive processing facilities.
Out of the existing processing units, only about 40 have registered brands and approved labels:
34 for olive oil production and 6 for table olives production. According to the law, these would
be the only companies entitled to sell olive oil or table olives, even if they could still produce it,
provided that they hold a production license.
Some companies own more than a processing plant, but generally speaking each company owns
and manages a single processing facility.
MAFCP statistical yearbook records 110 processors of vegetable oil in year 2008 (6), without
specifying the number of olive oil mills; a previous review performed by AAC (7) indicates in
150 the total number of oil mills.
All medium and large sized processors and the most reputed small ones now have their brands
registered and in general a slow process of formalization is occurring.
5 During the field survey there was confirmed temporary employment of workers from districts as far as Librazhd.
6 MAFCP, Statistical Yearbook, 2009
7 USAID-AAC “Olives value chain assessment”, October 2007.
Page 14
The Olive and Olive Oil value chain in Albania
11
2.1.2 Categories of olive processors and business practices and trends in olives processing
Olive oil
Olive oil processors can be categorized into five categories:
1. Small and localized. This category includes most processors based in the villages, primarily
producing virgin and lampante olive oil. These companies are actually the backbone of the
processing capacity in the country, even if they are not visible to the final consumer.
Small and localized processors use their processing lines mainly to provide processing
services to farmers and to produce limited quantities of own olive oil.
Facilities, processing technology and know-how of these processors are heterogeneous: the
majority of processing units is made of inadequate premises with outdated equipment, but
there are quite a few units operating good second-hand processing lines or new ones,
obtained with the support of different development projects (8). The storage capacity of this
category of processors is generally limited and the quality of tanks is also generally poor.
These operators have no direct links to retailers or supermarkets and sell their own olive oil
to bottling companies and to consumers visiting their villages.
2. Small modern. This is the main category of processors producing high quality extra virgin
olive oil on a regular basis. There are about 5 operators of this type. Small modern processors
use their processing lines to provide processing services to farmers but they also produce 4 to
10 Mt of olive oil, which they sell under their own brand during the year. This category of
processors produce high quality olive oil including virgin, extra virgin olive oil and even
organic. Most of them invested more than 10 m ALL (i.e. over 120,000 USD) in new
technologies and factory premises. The largest part of sales is made directly to consumers, so
that their marketing costs are very low; each of these processors has an estimated pool of 50-
100 regular clients purchasing high quality olive oil in containers of 5-6 litres. These
operators seldom, if ever, sell their own olive oil to bottling companies. These processors are
also exporting small quantities of products.
In this category can be included some of the most reputed olive oil producers, such as
Shpresa Shkalla, Vesaf Musai, Valentina Postoli and most of the processors receiving
national and international quality awards. Shpresa Shkalla and Vesaf Musai are certified for
the production of organic olive oil by international certifying bodies. Valentina Postoli also is
in the process of receiving organic certification. Shpresa Shkalla regularly exports to
Switzerland small quantities of organic and extra virgin olive oil with very rewarding prices.
3. Medium sized processors produce and store higher quantities of their own olive oil, within
the range of 20-80 Mt each. They produce extra virgin, virgin, normal and lampante olive oil.
Virgin and lampante olive oils are produced in largest quantities. There are about 15
operators in this category, such as Skilja (Elbasan), Jal (Kruja), Anastas Gjikondi (Qeparo),
Sabin (owned by Kapllani brothers in Vlora), Alliu brothers (Vlora), Jani Kokedhima
(Qeparo), Pellumb Aliraj (Vlora), Rakip Iljazi (Delvina), Qirjako Merkuri (Borsh), Agron
Papagjika (Bunec), Benjamin Toro (Kurjan, Fier), etc.
8 Some examples of this kind of oil mills are those ones in Shushice (Vlora) equipped with the support of 2KR
project and the three cooperative oil mills in Elbasan restructured with the support of the Italian NGO CEFA.
Page 15
The Olive and Olive Oil value chain in Albania
12
These companies sell their olive oil to larger bottling companies, to restaurants, to consumers
and even export. Some of them bottle and sale their own branded olive oil to retailers,
supermarkets and to restaurants. They are supplied with olives from growers in the area
where they are based, from other different parts of the country but also purchase olive oil
from small localized processors.
Skilja and Jal are the only medium sized processors who bottle their own branded olive oil
and deliver to retail outlets and supermarkets and to restaurants.
Skilja and Gjikondi have managed to export relatively large quantities of olive oil to Croatia
and Malaysia.
The other processors mainly sell olive oil to bottlers, restaurants and to consumers; for
example, Qirjako Merkuri has supplied for several years olive oil to the bottling company
Borshi Origjinal, Agron Papagjika has supplied Fiol bottling company, Gjikondi has
supplied olive oil to Misha&Ladi, and lately to Hajdini Borshi, Benjamin Toro has supplied
bottlers in Tirana etc. Whereas, Sabin mainly sells to restaurants in Vlora and Durres, and
directly to consumers.
4. Industrial processors/bottlers. Industrial processors typically produce and sell high
quantities of olive oil at the range of above 80 tons a year. The main business of these
companies is bottling and selling olive oil. In most cases they buy olive oil in bulk from other
oil mills or local producers or import it. The largest companies have also their own
processing lines. The enterprises of this group include all the market leaders.
These operators have organized sales forces and distribute directly to tens or hundreds retail
outlets, wholesale markets and restaurants all over the country. Each of them has an
estimated 2-3 delivery vans with a driver and a salesperson. The marketing costs of this
category of processors are therefore higher than any other group of olive oil processors.
Within this group, Sidnej, based in Berat, is the only company that delivers to retail outlets
not only olive oil, but also vegetal oil and a wide range of canned fruit and vegetables. Sidnej
is the second largest company of fruit and vegetable processing.
5. The company Agrotal, for its origin, size and structure stands as a separate type of
processor. It has been established as a pure agri-business, with support of the EBRD (the only
investment of EBRD in agri-business in Albania). Because of its size, it has the potential to
become by far the largest producer in the country. So far, Agrotal did not manage to exploit
its potential, because of difficulties in obtaining sufficient flows of good quality raw material
and excessive cost of raw material. The company has therefore decided to establish its own
production of olives and for this purpose it obtained from the State a lease agreement on
1,000 ha of land, with very favourable conditions. Considering the time and the investments
required to develop such a surface, it is not yet clear whether Agrotal will be a success story
or not. However, it represents by far the largest single investment in the olive sector.
As a whole, even the largest competitors are essentially family businesses, with the exception of
“Agrotal” should this company manage to develop its potential.
The bottlers’ category is more concentrated than it appears to a first analysis, as some important
brands are owned by the same person (such as Dhermiu and ALOR, owned by the same
entrepreneur).
Page 16
The Olive and Olive Oil value chain in Albania
13
Trade flows and competition mechanisms are also more complex than it appears, and it happens
(as it happened in 2007) that a bottler imports olive oil and sells part of the imported products to
his competitors.
In terms of market share of branded products, the three leading processing companies with
highest production and market share in the domestic market are: Borshi "Ylli Hajdini", Dhermiu
and Novi Borshi "Origjinal". Of these three companies, Dhermiu and Novi Borshi "Origjinal" are
packagers, i.e. buying olive oil in bulk and bottling it, while Borshi "Ylli Hajdini" is both
producing and buying olive oil and packaging it.
During the late 2000’, bottlers sourced their supplies from local processors and started to import
olive oil from Greece, Italy and Tunisia.
Borshi “Ylli Hajdini”, based in Borsh, produces and bottles olive oil since 1995 and has grown
into the market leader.
The company has the widest range of categories of olive oil in retail outlets including extra
virgin, virgin, normal, salad, and refined olive oils. Olive oil is packaged in a variety of
packaging sizes of 0.5, 1 l, in glass and plastic bottles.
The company has two processing lines, sourcing olives from producers, collectors and keeping
5% of the olives processed on behalf of farmers. In addition olive oil is also purchased from
other local processors and imported.
An important point of strength has been the establishment of an organized sales force and
efficient distribution system, allowing direct dispatching to customers all over the country.
Another strength has been the maintenance of consistent quality, which has created brand
loyalty among consumers.
Other companies have the potential to become leading actors:
Agrotal, has the ambition to become the largest integrated olive oil producer in the country,
as above described.
Sidnej, the second largest domestic producer of pickles, jam and other vegetable preserves,
owns one of the largest processing lines in the country, with a 17 quintal/h capacity, so far
only partially exploited.
Alboliva has a factory with three processing lines based in Ndroq. They started to produce
some olive oil with olives imported from Italy in 2007. Since May 2008, they are supplied
with olive oil from Italy and are selling their own branded olive oil to Tirana and Durres
markets, directly distributing to retailers and restaurants. Their goal is to become one of the
main suppliers of olive oil in Albania.
Fiol is the leading bottler for vegetable oil (mostly sunflower oil) in the country. In 2008 the
company decided to enter in the business of olive oil bottling as well. The company has a
strong marketing and logistic background and is also investing more than any other company
of the sector in advertising. So far, the results have been much limited, with the product
barely visible in retail outlets. Fiol has been supplied with olive oil by small processors
situated in the Southwest Coast.
Page 17
The Olive and Olive Oil value chain in Albania
14
Table olives
The business of professional table olives processing is mainly concentrated in Berat. Only two
medium sized actors are located another areas (Amarilto, in Lezha and Xhafa in Tirana). The
main type of table olive cultivated in Berat is by far the green “Kokerrmadh Berati”, so that the
quantities of other types of table olives (“White of Tirana” of black varieties from Berat)
professionally processed are very small.
The main factors for clustering into categories table olive processors are the quantity of table
olives processed and the type of packaging used. Companies can be therefore divided in two
groups, namely: i) small and medium enterprises specialised in retail packaging; and ii) small and
medium enterprises specialised in bulk packaging.
There are only 6 companies with a registered brand and an authorised label; comparing findings
of retail outlet survey with the database of approved labels, it is possible to conclude that
Albanian table olives sold in retail packages are mostly produced by licensed companies, while
the majority of table olives sold by weight comes from informal processing activities.
1. Processing companies specialised in retail packaging of Albanian and imported table
olives. Imported table olives are purchased in 200 kg drums and then processed and re-
packaged.
There are 5 to 6 companies in this category, as smaller companies are not regularly present in
the market. The leading company is Sidnej, which is also producing a wide range of
processed vegetables in retail packages and processes on average 300-400 tons of table olive
each year. The other companies (such as Shpiragu, BEEM, Alb-Berat, Amarilto, Xhafa etc.)
are processing less than 100 Mt per year each.
These companies mainly distribute their products directly, through their own transports, but
are also using wholesalers and other intermediators.
2. Processing companies specialised in bulk packaging. Most of the companies in this cluster
are semi-formal or informal. There are two or three larger and formal companies such as
Kastriot Cuedari (which is one of the few larger companies selling only in bulk), each
processing about 100 Mt per year. A few other (probably no more than 10) mostly informal
companies are annually processing around 50-60 tons of olives each.
Processed olives are sold to wholesalers in plastic drums, to be eventually retailed by weight
in retail outlets and green markets.
The largest processors are improving their equipment to produce pitted olives and ¼ olives,
these last for the catering business.
Olives in bulk packaging generally proved easier to sell in the domestic market, thus giving less
margins, but quicker turn over, as compared with retail packaged table olives.
As a consequence, even processed vegetables market leaders as Sidnej get 20% of their table
olives turn over from bulk-packaged olives.
As a whole, it is estimated that formal or semi-formal companies are processing about 800 to
1,000 Mt of table olives, including imported ones, i.e. 8% to 10% of the total amount of table
olives retailed.
Page 18
The Olive and Olive Oil value chain in Albania
15
Considering that all imported table olives are also sourced by licensed enterprises and that about
50% of the imported table olives are re-processed by Albanian companies, it is possible to
conclude that 80% to 90% of table olives retailed (i.e. without considering self-consumption) are
sourced from informal producers. There are no recorded cases of exports of table olives.
Sidnej, the market leader for table olives, is selling both retail packaged and bulk packaged table
olives. The product range of the company includes table olives in olive oil and brine in 190 gr,
350 gr, 500 gr. and 550 gr. Glass jars and in vacuum plastic packaging.
Sales are divided into 40% packaged in jars, 40% in plastic under vacuum, and 20% in bulk. The
best selling product is the 190 gr. jar of table olives in olive oil.
Most of the retail packaged table olives are directly distributed to retail outlets through the
company vehicles, while two wholesalers in Tirana (Uzina Dinamo) are the main buyers of bulk
packaged table olives.
Sidnej sends its own grading field machines to the suppliers of raw olives. Grading is therefore
ensured by the company, but in the place where procurement is made, thus giving the possibility
to decide a price based on objective assessment of quality.
Sidnej applies a 30% mark up on purchase prices for quality I olives, 15% for quality II olives,
and 2% for quality III olives.
The company is packaging both Albanian and imported olives. Imports are sourced from Greece.
Shipments are made in 200 kg bulk package in brine.
In the last few years, the business of table olives became even more fragmented and informal. As
demand and profit grows, newcomers seek profit opportunities, challenging the business of
consolidated actors.
Leading enterprises in the activity estimate that in 2005, around 80% of the total production from
Berat went through the processors, while in 2007, around 60% of the olives are sold from
farmers to wholesalers, bypassing the processors.
Wholesalers started to perform some processing, pressing olives and keeping them in plastic
drums at home. To react to unfair competition from unlicensed traders, Sidnej increased its
processing of olives in brine and olive oil.
In fact, this has to be considered as a stage of the sector strengthening process: as demand for
table olives grows and both table olive growers and wholesalers become wealthy enough to have
resources available for investments, a share of such investments is oriented towards vertical
integration (i.e. in-house olive processing) rather than towards increase of efficiency in
production or increase in the planted surface area.
Such approach is generating a large number of micro-processors who directly sell in the markets,
thus keeping the share of informal trades of table olives well over 80% of total consumption,
when considering also the production of table olives in regions other than Berat.
Such evolution is causing reduction of consumer protection and increases confusion in the
market, a situation which will be not sustainable in the long term. After this small boom in
Page 19
The Olive and Olive Oil value chain in Albania
16
cottage-level processing workshops, the business of table olives will start again a drive towards a
more formal and ordered structure, under the pressure from retailers, always seeking for cheaper
alternatives, but also asking for reliable trade partners.
A few, more established, competitors will eventually emerge from this phase, increasing the
number of formal actors in the business.
2.1.3 Procurement of olives and product policy
Olive processors operate in three distinct ways:
1. Buying olives from farmers and from collectors, processing them and selling the olive oil
under its own brand.
2. Processing oil for farmers. Some larger oil mills do not provide this kind of service In this
operation, farmers can chose in most cases either to pay a fee or to leave a share of the olives
as payment in kind. The processing fee has been 700-900 ALL per quintal of olives in 2005,
while in 2009 it went up in line with the rise of prices of olives within the range of 1,000-
1,200 ALL per quintal of olives. In both cases the fee was more or less corresponding to 10%
of the value of the olives processed. In case of in-kind transactions the processing fee is by
leaving 5 percent of the oil to the processor.
3. Buying olive oil from other mills or importing it and bottling the olive oil under their brand.
At present, all the larger competitors are either bottlers (such as ALOR, Dhermiu, Borshi
“Origjinal”, FIOL) or bottlers/processors (such as Borshi “Ylli Hajdini”, Sidnej). Agrotal is
the only company planning to establish an integrated olive and olive oil production system.
In spite of the fact that price/quality ratio of Albanian olive oil is usually low as compared
with imported one, there are only few cases of bottlers importing olive oil in bulk; most of
them prefer dealing with domestic producers.
Most small localized olive processors operate under the first and second mode. In fact, providing
the service of olive oil processing is for many small plants the main source of revenue and,
through the payment in kind, an important way of sourcing raw olives.
As payments are made in cash, limited financial resources induce small processing plants to
purchase small amounts of olives for producing their own olive oil.
Small modern processors are mainly buying olives or processing farmers’ olives for a fee, as they
do not want their extra-virgin production being mixed with lower quality olive oils obtained by
processing olives got as payment in kind.
Some medium-size and industrial processors such as Sabin (with three plants in Southern
Albania) and Sidnej (Berat) also prefer to buy olives for production with their own brand or to
get the processing fees. Other medium-sized processors are more interested to increase the
quantity processed, so that they prefer either to buy and process olives or to get in kind
processing fees. This mode is adopted by operators such as Anastas Gjikondi and Borshi Hajdini,
both located in the South West coast.
Page 20
The Olive and Olive Oil value chain in Albania
17
2.2 DISTRIBUTION
2.2.1 Main characteristics and flows in the olive oil and table olives distribution system
The evolution of the distribution system
The Albanian distribution system is traditional and extremely fragmented, without a real
wholesaling sector. Especially for olive oil, distribution to retailers is mainly performed by the
bottlers themselves, wholesalers play a more important role in distributing table olives.
More in general, food processing companies are distributing directly to retail outlets bypassing or
relaying less on wholesalers.
Two major changes occurred in the last three years, which will induce major changes in the
distribution system:
1. The establishment of a network of wholesale markets, facilitating wholesale trading and
gradually introducing more transparency in price formation;
2. The development of organized distribution, with the entrance of two foreign-owned
supermarket chains and the parallel growth of some domestic larger retailers into supermarket
chains.
These two factors, like in other countries, will substantially change in a few years the distribution
system in the main cities. As a consequence, the share of traditional retail is expected to be
reduced in a few ears to 75% or less.
More organized logistic will be necessary to cope with such evolution; total mark up in the post-
production section of the food chain is also likely to increase; as prices are already high, this is
likely to put more pressure on producers to reduce sales prices.
For olive oil and table olives, such evolution is likely to induce the following changes:
1. Organized distribution needs regular supplies of relatively large quantities of products. The
role of bottlers will further increase and medium producers will be forced to upgrade their
distribution system or to reduce the share of olive oil sold with their own brand. This
evolution is also representing a challenge for the small modern processors which will be
forced to increase the resources devoted to marketing, as increasing number of wealthy
customers will make their purchases in supermarkets.
2. An increasing role will be played by wholesale markets in distribution of table olives, thus
facilitating in the short term a further increase in the number of small wholesalers/processors.
Generally, wholesalers and importers will become more important players in the table olive
trading.
2.2.2 The main distribution channels of olive oil and table olives
Most urban dwellers buy olive oil in mini-markets and traditional retail outlets whereas imported
olive oil is almost exclusively sold through supermarkets.
Organized distribution is catching an increasing share of customers. These outlets do not
represent any more the higher end of retailing business. Supermarkets are adjusting their prices to
those ones of traditional retailers, aiming at widening the range of customers beyond the middle
income consumers’ segment.
Page 21
The Olive and Olive Oil value chain in Albania
18
Restaurants and other catering outlets are buying, with few exception, the cheapest qualities of
olive oil; limited purchasing of higher quality olive oil are made by high-end restaurants.
Apart from self-consumption, olive oil in rural areas is mostly informally traded and purchased
from local oil mills; a smaller share, estimated in 30% of the total or less, is sold, usually by the
liter (i.e. not bottled), in traditional retail outlets.
Retail shops and green markets are the prevalent market channels in rural areas where there is no
olive oil production.
Tables 2.1 and 2.2 below show the estimate structure of the food chain at distribution level.
Relevant data are based on rough estimates, as there are no data about olive oil flows in the
distribution channel; the estimate of olive oil flows matching rural demand is based on
information on family budgets (9), field interviews, previous analyses (
10), consumption of rural
families in other traditional Mediterranean producing countries (11
) and difference between
estimated production and estimate demand in urban area.
Estimate made with different techniques on urban demand are rather stable, while there are
different estimate on rural demand.
Table 2.1: Estimate structure of olive oil flows for urban markets at distribution level
Mt
Urban consumption
Type of
processor
Organized
retail
Traditional
retail
Green
markets
Direct sales Restaurants
Small local - 400 100
Modern small 5 41 2
Medium 50 100 100 250
Industrial 150 400 200
Bottlers 800 2.800
Importers 600 300
Total 1,605 3,600 541 552
Grand total 6,300 Source: Estimate of the consultant
9 INSTAT-WB LSMS (Living Standards Measurement Survey) 2005
10 FAO “Agricultural Production Support in Albania” 2006 baseline survey of 100 olive growers in Novosele and
Shushice, Vlora; FAO “Agricultural Production Support in Albania” 2005 and 2006 budget cops analysis in Vlora;
USAID – AAC Olives Value Chain assessment; USAID - AAC Field survey performed by DSA on olive growers in
five districts; AAC 11
Consumption in rural production areas has been assumed similar to that one in rural EU Mediterranean countries,
while in non-producing areas rural consumption has been assumed near to zero.
Page 22
The Olive and Olive Oil value chain in Albania
19
Table 2.2: Estimate structure of olive oil flows for rural markets at distribution level
Mt
Rural consumption
Type of
processor
Traditional
retail
Green markets Direct sales
Small local 400 500 800
Modern small
Medium 400 300
Industrial 900 200
Imported 30
Total 1,730 1,000 800
Total trades 3,530
Grand total (incl. Self-consumption) 6,800 Source: Estimate of the consultant
Page 23
The Olive and Olive Oil value chain in Albania
20
Chart 2.1: Structure of the food chain and estimate flows for olive oil
100 Mt
30 Mt
250 Mt
100 Mt
41 Mt
100 Mt
300 Mt
DISTRIBUTION
7,700-11,000 Mt
PROCESSING
11,300-18,800 Mt
Self consumption: 460,000 cons.
11,000-37,000 Mt olives 2,200-7,400 Mt 4.0-16.6 lt per capita
PRODUCTION FOR OIL
45,000-87,500 Mt
Small Olive
Growers
Medium/Large
Olive Growers Olive Imports
400 Mt
Channel 1:
Traditional food
chain
Channel 2:
Quality-oriented
Channel 3:
Medium Processors
and bottlers
Channel 4:
Industrial Processor
Export
30 Mt
Urban Consumers:
1.4 m cons., 6,300 Mt, 4.2-4.5 lt per capita
Rural & Peri-Urban consumers
Commercial: 1.3 m cons., 1,400-4,700 Mt , 1.2-4.2 lt. per
capita
Bottlers (8)
Bottled
Olive Oil
Importers
650 Mt
Roadside Sales
Medium Sized
Processors (15)
Industrial
Processor
Bottlers/
Processors (2)
Olive oil imports
150 Mt
Collectors
Micro & Small
Localized
Processors
105-120
Small Modern
Processors (3-5)
Small Retail
Shops
Supermarkets &
Retail Chains
Restaurants
3,600 Mt
400 Mt
Source: Own Survey
Table olives
Table olives are mostly purchased by the weight (i.e. not in retail packaging) in traditional retail
outlets and, in lower quantities, in green markets.
Restaurants and other catering outlets remain a major channel for table olive retailing.
Page 24
The Olive and Olive Oil value chain in Albania
21
3. COST, PRICE AND MARGIN ANALYSIS
3.1 OLIVE PRODUCTION COSTS
The assessment of production costs was made comparing different sources and methods. Based
on the findings, significant differences were found in total cost and expenditure patterns between
farms with more than 150 trees and less than 150 trees, thus leading to re-define the size limits of
farm categories.
Table 3.1 and Chart 3.1 below summarize the main olives production costs by area and farm
size and the average cost per kg of output in high-yield and low-yield years.
Table 3.1: Main olives production costs in the surveyed areas (ALL/00 trees)
Surveyed group
Labor
Cost Fertilizers
Other
costs
Total
Costs
Novosele >=150 trees 119,000 65,500 10,000 194,500
Novosele <150 trees 151,400 44,600 10,000 206,000
Berat >=150 trees 153,500 30,500 10,000 193,500
Berat <150 trees 215,000 20,000 10,000 245,000
SW Coast >=150
trees 86,250 86,250
SW Coast <150 trees 121,400 121,400 Source: Evaluation of the consultant based on field survey
The main variable costs items are labor and fertilizers. Costs sustained for IPM measures
(included pesticides and expensive eco-traps granted by the Government) are comparatively low.
Comparing costs structure in different areas and types of farms shows that: i) labor costs’ share is
higher in smaller farms; and ii) olive growing in Novosele is comparatively a more capital-
intensive activity than in other parts of the country.
Chart 3.1: Production costs in different regions, by farm size
Cost structure (All/100 tree)
-
50,000.0
100,000.0
150,000.0
200,000.0
250,000.0
Novosele
>=150
Novosele
<150
Berat
>=150
Berat <150 SW Coast
>=150
SW Coast
<150
Labor Cost per
Fertilizer
Other costs
Source: Evaluation of the consultant based on field survey
Page 25
The Olive and Olive Oil value chain in Albania
22
Yields
The analysis of yields shows that the main factor of variation remains the impact of climatic
conditions and in particular drought, thus leading to conclude that lack of investments in
irrigation facilities remains a constraint more important than inefficient use of inputs, size of
farm and total number of trees planted.
Variation among years
Yields vary strongly from year to year. In hot dry years, production is very low. Most farms,
missing irrigation, are exposed and vulnerable to the draught, obtaining low yields and poor
quality.
Yields in Central Albania (Tirana and Elbasan) are lower than in other parts of the country both
in good and bad years. In South West Coast, yields are lower than in neighboring Novosela, due
to lack of investments and services. In parts of Elbasan (counting for most of production Central
Albania) yields go down to 5 – 10 kg/tree in bad years (i.e. 2007 due to draught and 2009 due to
rains), and go up to 30 kg/tree in “good years”.
Chart 3.2 below compares the evaluation of average yields in the surveyed region in low yield
and high yield years.
Chart 3.2: Yield in good and bad years for different areas
Source: Evaluation of the consultant based on field survey
Variation of yield in function of farm size and use of inputs
Efficiency of large and small olive growers was also compared, analyzing yields by farm size.
Having ascertained that larger farms are more capital-intensive, using less labor and more inputs,
the effects of this different production modality in terms of yields was analysed.
As a result of a better use of inputs, larger farms have higher yield on average than smaller ones,
but such difference is really significant only in high yields years. An exception recorded is the
case of Novosela (North of Vlora), where the planted surface is sensibly increased in the last
years, especially in larger farms; since many trees are in the first years of production (or some are
not even entered into production) larger farms, which also have the higher share of new
plantings, report lower yields than smaller farms in this area.
Page 26
The Olive and Olive Oil value chain in Albania
23
In the bad (dry) years, smaller farms become more productive than larger ones, and overall
production levels are much lower than in the good ones. Lack of (proper) irrigation system is a
major reason.
In South West Coast there are no new plantings due to the above mentioned problems of
depopulation.
Charts 3.3 and 3.4 below compare the average yields of smaller and larger olive farms in
different surveyed regions.
Chart 3.3: Yield in high yield years for different areas
High Yield (kg/tree)
-
20.0
40.0
60.0
80.0
100.0
120.0
140.0
Novosele Berat SW Coast
>=150
<150
Source: Evaluation of the consultant based on field survey
Chart 3.4: Yield in low yield years for different areas
Low Yield (kg/tree)
-
5.0
10.0
15.0
20.0
25.0
Novosele Berat SW Coast
>=150
<150
Source: Evaluation of the consultant based on field survey
Farm budget and sensibility of prices to crop oscillations
Profitability of farms depends both on output yields and prices. These last are quite volatile in a
relatively small country as Albania, where weather conditions are likely to affect in the same way
Page 27
The Olive and Olive Oil value chain in Albania
24
the harvests in the whole country and oscillation of output between high yield and low yield
years is very high.
The analysis of costs and yields, summarized in Chart 3.5 below led to conclude that the average
production cost ranges between 26 and 34 ALL/kg, with significant differences between regions
and between high yield and low yield crop seasons (years).
Chart 3.5: Production costs of olives in different regions
Cost, revenue and profit (All/100 tree)
-
10.0
20.0
30.0
40.0
50.0
60.0
70.0
80.0
Novosele
>=150
Novosele
<150
Berat
>=150
Berat
<150
SW Coast
>=150
SW Coast
<150
Average
Cost All/kg good year Cost All/kg bad year
Source: Evaluation of the consultant based on field survey
Comparing production costs with average prices paid to the farmers it emerges that the average
profit per unit (per tree or kg) of olive production is unsustainably high, with all main reviews
agreeing that it systematically exceeds 50% even considering both the cost/opportunity of
family labor and the amortization of the plantation, in most cases received without any
investment; still, the average revenue of an olive grove is not so high, mainly due to the limited
size of the farm and to the low level of investments.
In particular years or conditions, profit per unit is 100% and even 150% (i.e. revenues score two
times and half the costs) the production costs, for a product whose quality is often poor.
In year 2007, the lower levels of production triggered the prices to more than double compared to
the previous two years. The income effect from the increase of prices has offset the one from the
decrease of production, leading to higher overall profits for the farmers, even if the harvest was
much smaller.
Prices remained high in 2008, in spite of exceptionally abundant harvest and raised to over 130
ALL/kg in 2009.
Increasing prices and profits encouraged farmers to increase planted surface, but in the long term,
it is not feasible to keep prices much higher than international ones, in good as well as in bad
years. Trade channels are becoming more efficient, and barriers are being reduced; traders and
processors will respond to high domestic raw olive prices, by increasing imports of olives or
olive oil.
In particular, the finding that, due to domestic olives price oscillation, profits are higher in bad
years than in good ones is absolutely not sustainable.
Page 28
The Olive and Olive Oil value chain in Albania
25
In these conditions, as efficiency of both processors and distributors increases, producers will be
under increasing pressure to increase yields, improve quality and at the same time to reduce
prices. Thus, for the olive farmers, in order to survive and to become competitive, it is a must to
reduce costs and come up with considerably lower prices, and more stable production/supply
record along the years.
A basic calculation made on average processing costs and international prices of extra-virgin
olive oil, shows that farm-gate sales prices exceeding 40 to 45 ALL/kg (i.e between 0.3 to 0.4
eur/kg, as compared with prices of 0.5 eur/kg in 2006 and well over 1 eur/kg in 2007) of raw
olives would be not sustainable in the long run.
Table 3.2 below shows the evaluation of profits per hundred trees and per kg in different areas of
the country in high and low yield years.
Table 3.2: Costs and profit of olive growing in different areas, by farm size (All/kg)
Cost All/kg
good year
Cost All/kg
bad year
Profit All/kg
good year
Profit All/kg
bad year
Novosele >=150 trees 30.4 46.8 19.6 47.4
Novosele <150 trees 22.1 36.1 27.9 51.3
Berat >=150 trees 22.2 36.1 107.8 69.9
Berat <150 trees 51.5 71.2 78.5 57.0
SW Coast >=150
trees 6.6 11.7 53.4 72.8
SW Coast <150 trees 21.9 32.0 38.1 73.9
Average 25.8 39.0 54.2 62.1 Source: Evaluation of the consultant based on field survey
In addition to expected reduction of margins at production level, unit margins and opportunities
of informal trades of table olives and olive oil (12
), are also shrinking, as competition in the retail
market is becoming stronger in both terms of quality and quantity.
Increasing the share of product processed at farm level (as it is happening for table olives) or
increasing the share of olive oil that the farmers keep and trade directly will be therefore not a
solution for maintaining the present levels of profitability per hundred trees.
The evolution of the value chain is therefore pushing towards a reduction of present margins at
any level, thus calling for increasing production efficiency.
12
Many farmers and processors sell all or most of their olive oil though informal networks, reducing considerably
distribution and other marketing costs. It is common for some processors, recognized for high quality, to sale the
olive oil at the factory, even for final consumers, in big plastic cans.
Page 29
The Olive and Olive Oil value chain in Albania
26
3.2 OLIVE OIL PROCESSING AND RELEVANT MARK UP
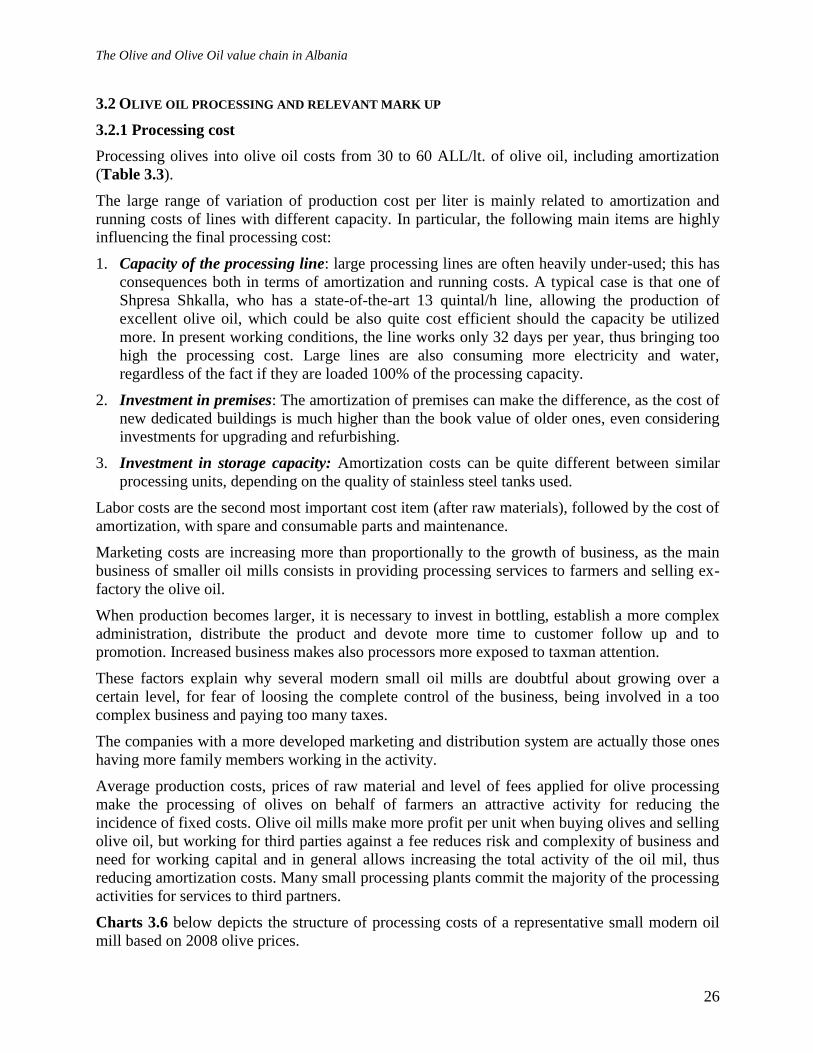
3.2.1 Processing cost
Processing olives into olive oil costs from 30 to 60 ALL/lt. of olive oil, including amortization
(Table 3.3).
The large range of variation of production cost per liter is mainly related to amortization and
running costs of lines with different capacity. In particular, the following main items are highly
influencing the final processing cost:
1. Capacity of the processing line: large processing lines are often heavily under-used; this has
consequences both in terms of amortization and running costs. A typical case is that one of
Shpresa Shkalla, who has a state-of-the-art 13 quintal/h line, allowing the production of
excellent olive oil, which could be also quite cost efficient should the capacity be utilized
more. In present working conditions, the line works only 32 days per year, thus bringing too
high the processing cost. Large lines are also consuming more electricity and water,
regardless of the fact if they are loaded 100% of the processing capacity.
2. Investment in premises: The amortization of premises can make the difference, as the cost of
new dedicated buildings is much higher than the book value of older ones, even considering
investments for upgrading and refurbishing.
3. Investment in storage capacity: Amortization costs can be quite different between similar
processing units, depending on the quality of stainless steel tanks used.
Labor costs are the second most important cost item (after raw materials), followed by the cost of
amortization, with spare and consumable parts and maintenance.
Marketing costs are increasing more than proportionally to the growth of business, as the main
business of smaller oil mills consists in providing processing services to farmers and selling ex-
factory the olive oil.
When production becomes larger, it is necessary to invest in bottling, establish a more complex
administration, distribute the product and devote more time to customer follow up and to
promotion. Increased business makes also processors more exposed to taxman attention.
These factors explain why several modern small oil mills are doubtful about growing over a
certain level, for fear of loosing the complete control of the business, being involved in a too
complex business and paying too many taxes.
The companies with a more developed marketing and distribution system are actually those ones
having more family members working in the activity.
Average production costs, prices of raw material and level of fees applied for olive processing
make the processing of olives on behalf of farmers an attractive activity for reducing the
incidence of fixed costs. Olive oil mills make more profit per unit when buying olives and selling
olive oil, but working for third parties against a fee reduces risk and complexity of business and
need for working capital and in general allows increasing the total activity of the oil mil, thus
reducing amortization costs. Many small processing plants commit the majority of the processing
activities for services to third partners.
Charts 3.6 below depicts the structure of processing costs of a representative small modern oil
mill based on 2008 olive prices.
Page 30
The Olive and Olive Oil value chain in Albania
27
Chart 3.6 Structure of processing cost of a representative example of small modern oil mill,
excluded raw material
Source: Evaluation of the consultant based on field survey
When considering the structure of costs net of raw materials, the onus of amortizations becomes
evident, as well as the key importance of providing oil milling services for others in order to
distribute better the fixed costs. It is not exaggerated to state that, if services for third subjects
represent less than 50% of total amount of olives processed, most small and medium-sized oil
mills are not able to cover properly amortization costs (some processors process more than ¾ of
the olives as service for third parties). Also the level of use of production capacity is very low
(Table 3.4), confirming the low level of efficiency.
Table 3.3: Cost structure of a representative small modern producer of producing olive oil
ex-factory, excluding packing and labeling (years 2006 and 2009)
Costs (All/liter)
All/liter
2006
All/liter
2009
Processing cost 39 39
Olive cost 316 600
Total cost 355 639 Source: Evaluation of the consultant based on field survey
Table 3.4: Use of production capacity by type of olive oil producer (year 2008)
Production capacity coverage October November December
Small representative producer 2% 6% 9%
Average representative producer 2% 7% 7% Source: Evaluation of the consultant based on field survey
Page 31
The Olive and Olive Oil value chain in Albania
28
3.22 Evolution of factory gate olive oil prices and oil mills mark up
As mentioned in Chapter 3.1 above, prices of olives are characterized by strong oscillations, as
poor agronomic services and lack of irrigation makes Albanian production particularly exposed
to whether conditions. For example, both draught in 2007 and heavy rains in 2009 damaged and
reduced the quantity of olives produced, increasing significantly the prices of raw olives,
affecting quantities, cost and prices of domestically produced olive oil.
The evolution of raw olives cost and ex-factory olive oil prices provides evidence on the
following trends:
1. Within a framework of major yearly oscillations, the procurement cost of raw olives is
growing, in spite of increasing output. In the last season, olive prices exceed for the first time
1 eur/kg
2. The yearly oscillation of olive oil sale prices is lower that that one of raw olives. Most
extra-virgin olive oil prices are ranging between 600 and 800 ALL/liter since 2006; in the
same period, prices of raw olives experienced a variation of prices ranging from 50 to 150
ALL/kg.
3. The mark up of oil mills is rapidly shrinking; in 2008, in some cases, there was no profit
or margin. Considering a prevalent processing cost of 39 ALL/liter (13
) and variable costs for
packaging and distribution, the factory gate price of extra-virgin olive oil gave in 2006 a
mark up ranging around 50% to 60%, constantly reduced in the following years and only
partially compensated by higher efficiency of processing companies. At present, there is little
space for further reduction of oil processors and bottlers’ margins.
Table 3.5 below shows the evolution of ex-factory prices of extra virgin olive oil of small olive
oil mills (excluding packaging, labelling, not subject to VAT) and farm gate prices of olives.
Table 3.5: Ex-factory prices of extra virgin olive oil of small olive oil mills and farm gate
prices of olives
Year Prices All/liter
extra-virgin olive oil
Prices All/kg
olive
2006 600 - 700 50 – 60
2007 800 - 900 100 – 120
2008 600 - 750 80 – 110
2009 750 - 800 120 – 150 Source: own survey
The reduction of margins of olive oil mills is partially related to the impossibility to set retail
prices of Albanian olive oil higher than those ones of imported extra-virgin olive oil.
Wholesale prices of imported olive oil have been regularly lower that factory-gate prices of
Albanian oil mills, as shown in table 3.6 below, providing monthly prices of olive oil imported
in Albania from EU countries in the years 2006 to 2009.
13
As mentioned in chapter 3.2.1 processing costs ranges between 39 and 60 ALL/kg; many large processing units
have higher costs, due to heavy under-utilisation and consequent high amortization costs.
Page 32
The Olive and Olive Oil value chain in Albania
29
Table 3.6: Import prices of virgin and extra virgin olive oil
Eur/kg.
Year Jan. Feb. Mar. Apr. May. Jun. Jul. Aug. Sep. Oct. Nov. Dec.
Year ALL
(*)
2006 3.8 4.4 4.8 3.9 2.5 4.0 5.1 3.2 3.9 3.4 3.3 3.4 374
2007 3.1 2.1 4.0 2.8 2.6 3.0 3.5 3.0 2.1 3.2 2.6 3.1 2.9 258
2008 2.9 3.1 2.8 3.2 1.9 2.2 2.8 3.1 3.0 2.7 2.7 3.1 2.8 255
2009 2.4 2.7 2.2 2.2 2.3 2.5 2.6 2.8 2.5 3.0 2.1 283 (*) equivalent in ALL, based on average yearly exchange rate (
14)
Source: EUROSTAT, Banca d’Italia
Ex-factory prices of olive oil, particularly during the “bad” years (such as 2007 and 2009) are
about two times higher than import prices; this demonstrates the inefficiency of both Albanian
domestic producers and olive oil processor in comparison with other Mediterranean producers. It
is also an indicator of the overall inefficiency of the value chain, as the high price of raw olives
and olive oil is not causing a surge of imports.
The small modern processors sell almost exclusively to final consumers who normally have
preference for the domestic product and prefer to buy directly from the buyer. More detailed
information on consumer preferences are provided in Chapter 5.
3.3 DISTRIBUTION MARK UP AND RETAIL PRICES
3.3.1 Evolution of prices and margins in distribution.
The primary data collected in the survey (15
) show that mark up applied on the cheaper olive oil
ranges around 30-50 ALL per liter, while mark up on medium priced and high priced olive oil is
more than 50 ALL per liter. In both cases, the margin for olive oil in the supermarket is
approximately 20% of purchasing price. At present, distribution margins are relatively low, as
compared with international standards.
Margins in different cities surveyed do not show major differences: in Durres prices and margins
are generally lower than in Tirana, while in Vlora margins can be even higher than in Tirana.
In the last years, margins did not change much, but prices have increased along the whole value
chain; the increase of retail prices of Albanian extra-virgin olive oil has found a limit in the price
of imported olive oil, which is remained more or less stable since 2006, ranging between 850 and
1,000 All/lt.
Retail prices of imported bottled olive oil and prices of olive oil supplied by the largest bottlers
are more stable than prices of medium-sized and smaller domestic producers. This is due to the
following factors: i) the need to compete directly with imported bottled olive oil in the shops; ii)
the possibility to import in bulk olive oil when the prices of domestic olives and olive oil are too
high and; iii) the possibility to work on the margins of a larger-scale production and the
importance for nation-wide competitors to maintain and enlarge their market share, especially in
a period of rapid changes in the retail sector.
14
The exchange rate reported by Central Bank of Italy, was 123 All/Eur during 2006, 2007 and 2008 and 132
All/Eur in 2009 respectively. http://uif.bancaditalia.it/UICFEWebroot/indexHP.jsp?lingua=en 15
Interviews with supermarket managers and with olive oil processing companies
Page 33
The Olive and Olive Oil value chain in Albania
30
In the same period, the medium-sized producers who could only rely on their own production or
on domestic production (i.e. are not large enough to find profitable importing olive oil) had to
increase much more their prices, as it happened in the case of JAL, whose ex factory prices rose
more than 50%, as shown in Table 3.9 below.
The comparison between retail prices in 2008 and 2009 of leading olive oil brands shows that, at
retail level, prices of imported and domestic olive oil are converging: so far, the shorter value
chain of domestic branded olive oil (16
) has allowed to compensate for the much higher cost of
raw material and the scarce efficiency of small-scale processing, but the gap between prices of
domestic and imported olive oil is now bridged.
Also, the difference of prices for the same product or for comparable products in different shops
is narrowing, as an effect of increasing diffusion of supermarket chains and higher competition in
food distribution.
Retail prices in 2008 and 2009 of the most popular products from leading competitors are shown
in table 3.7 below.
Table 3.7: Retail prices of the leading olive oil brands in main supermarkets
Supermarket
chain Olive oil brand Liters Packaging Type
2008
All
2009
All
Big Market Borshi "YLLI HAJDINI" 0.5 GLA EV 420 435
Euro Max Borshi "YLLI HAJDINI" 0.5 GLA EV 480 409
Big Market Carapelli (imported) 1 GLA EV 1,000 850
Big Market Borshi "YLLI HAJDINI" 1 GLA EV 800 850
Euro Max Borshi "YLLI HAJDINI" 1 GLA EV 910 779
Euro Max Borshi "YLLI HAJDINI" 1 PET N 475 445
Big Market DHERMIU 1 PET N 520 490
Euro Max DHERMIU 1 PET N 410 410
Legend: GLA: glass; PET: PET; EV: Extra-virgin olive oil; N: Normal olive oil
Source: own survey
Further increase of efficiency in the distribution system are likely to generate downward pressure
on prices of domestic products, as distribution margin on imported and domestic products will
converge and the higher price/quality ratio of imported olive oil will force domestic producers to
reduce prices and improve quality.
3.3.2 Distribution margins of main Albanian brands
Different destination and distribution system used by bottler and by other producers
In analyzing distribution margins and relevant evolution it is appropriate to focus on the products
of bottlers, as these are the operators most commonly present in retail shops with their own
brands and find themselves in direct competition with imported olive oil.
16
in most cases much shorter, as largest bottlers are directly distributing to retailers, thus skipping wholesaling,
while imported olive oil is subject to a double wholesaling mark up of the Albanian importer and of the foreign
exporter
Page 34
The Olive and Olive Oil value chain in Albania
31
All leading brands belong to bottlers; among them, only Borshi “Ylli Hajdini” and Sidnej are
both processing olives and buying olive oil. All the other bottlers are only buying olive oil in
bulk, bottling and distributing it.
In most cases, bottlers and olive oil processors are directly distributing to retail outlets. Only a
small share of the product is traded through wholesalers.
The analysis of distribution margins of medium-sized producers, small modern oil mills and
farmers is less significant: small modern oil mills and farmers are mostly selling directly to
consumers, without involving retailers or wholesalers, while medium-sized oil mills mostly sell
in bulk to bottlers, in most cases without middlemen. Some of them are selling with their own
brand, directly distributing to retailers.
Most of the imported olive oil is traded by wholesalers. The supermarket chain CONAD is
mostly relying on its own logistic platform abroad, i.e. does not deal with local wholesalers and
importers and sells a limited range of Albanian products.
Pricing policies of supermarket and leading olive oil brands
The distribution margins of the main products of the Albanian leading brands, i.e. Borshi “Ylli
Hajdini” in Tirana in 2006 and 2008 were compared. For matter of comparison, the evolution of
margins for JAL (which is selling only the olive oil they produce) was analyzed as well.
Distribution margins of other relevant products in 2006 (17
) were also analyzed.
In the case of Borshi “Ylli Hajdini”, the mark up on ex factory prices were more or less
homogeneous before the price surge of 2007, ranging between 15% to 20%. Mark up applied by
retailers on ex factory prices of both leading and medium-sized processors was more or less the
same.
A dramatic increase of olive oil prices was experienced in 2008. Chart 3.7 below gives a good
visual idea of the size of such increase: in most cases, 2008 ex factory prices are higher than
retail prices in 2006.
17
Data were taken from the former FAO “Agricultural Production Support” and USAID SBCA projects
Page 35
The Olive and Olive Oil value chain in Albania
32
Chart 3.7 Evolution of ex-factory and retail prices of key Borshi “Ylli Hajdini” products
ALL/bottle
0
100
200
300
400
500
600
700
800
900
Extra Virgin
Glass
Virgin Glass Normal Plastic Normal Glass
Ex factory price 2006 Retail prices 2006
Ex factory price 2008 Retail prices 2008
Source: own survey
Table 3.8 below shows the distribution margins of four leading products from Borshi “Ylli
Hajdini”, and the evolution of such margins between 2006 and 2008.
Table 3. 8: Evolution of prices and margins of leading olive oil products produced by Borshi
“Ylli Hajdini” between 2006 and 2008
Product Ex factory
price
Average retail
price in
Tirana
Retail
Margin
Mark up %
Extra Virgin 1 lt. glass 2006 600 700 100 17%
Extra Virgin 1 lt. glass 2008 710 809 99 14%
Virgin 1 lt. glass 2006 470 550 80 17%
Virgin 1 lt. glass 2008 560 755 195 35%
Normal 1 lt. PET 2006 350 390 40 11%
Normal 1 lt. PET 2008 380 417 37 10%
Normal 1 lt. Glass 2008 410 536 126 31% Source: own survey
As it is possible to note, Borshi “Ylli Hajdini” applied a different price policy than the retailers:
the processing company price policy was aimed at increasing segmentation, increasing the ex
factory prices of extra virgin and virgin olive oil by 18-19%, while limiting the increase of prices
of normal olive oil by 7%.
Retailers decided to apply a different system of segmentation, “pushing up” prices of all the
products in glass bottle towards the most expensive product and limiting to the maximum the
price increase of olive oil in PET.
In other words, the processing company made a pricing policy focused on the product, while the
retailers on its packaging.
Page 36
The Olive and Olive Oil value chain in Albania
33
Chart 3.8 below depicts the application of these two different price policies, showing how
margins on virgin and normal olive oil in glass bottle increased in the period much more than the
others.
Chart 3. 8 Evolution of prices of key Borshi “Ylli Hajdini” products ALL/bottle
0
100
200
300
400
500
600
700
800
900
Ex factory price
2006
Retail prices
2006
Ex factory price
2008
Retail prices
2008
Extra Virgin Glass Virgin Glass Normal Plastic Normal Glass
Source: own survey
The dynamic analysis of margins shows that policy of distribution margins is becoming more
independent from price policy of processing companies: in 2008, retailers reacted to the
dramatic increase of prices in some cases reducing their margins and in other ones increasing
them, in accordance to their own price policy.
This recent evolution is one of the first results of the consolidation of supermarket chains, which
are now strong enough to develop their own pricing policy, which is some cases traditional
retailers are forced to follow to remain competitive.
The price policy applied by retailers with a smaller producer, JAL, was completely different. In
this case the presence and the turn over generated by the brand did not justify a specific price
policy at retail level, so that in this case, retailers maintained the margin stable in absolute value,
reducing it in percentage.
Table 3.9: Evolution of prices and margins of two olive oil products produced by JAL
between 2006 and 2008 (normal, not extra-virgin)
Product Ex factory
price
Average retail
price in Tirana
Retail
Margin
Mark up %
Virgin 1 lt. glass 2006 450 515 65 14%
Virgin 1 lt. glass 2008 700 770 70 10%
Normal 1 lt. PET 2006 240 290 50 21%
Normal 1 lt. PET 2008 400 450 50 13%
Source: own survey
Page 37
The Olive and Olive Oil value chain in Albania
34
4. INTERNATIONAL TRADE
Albanian exports are very limited and sporadic – in year 2008, only 4 tons were exported. Thus,
we will focus our analysis on imports and development in world markets (exports and trade
balance were analyzed in Chapter 1). Albanian imports are significant and ranging between 850
and 1,100 Mt per year.
Part of the olive oil is imported in bulk and then bottled by Albanian processors, as mentioned in
Chapter 3.3.2 above.
About 99.9% of olive oil is imported from the EU, of which up to more than 90% is supplied
from Italy, the rest being imported from Greece.
Italy and Greece, together with Spain, are the key players at World level in the market of olive
oil, making up for more than 2/3 of world production of olives and olive oil. Spain and Italy are
also leading world exporters of olive oil – they exported together 60% of the World total exports.
The third larger exporter currently is Tunisia, which has surpassed Greece over the last years, and
is narrowing the gap with Italy and Spain (detailed data on world production and trade trends are
provided in Appendix).
Albanian import of olive oil has increased since year 2000 (see Chart 1.1). In 2005 and 2006,
due to major increase of EU olive oil prices and higher levels of domestic olive production,
imports of olive oil dropped. In 2008, imports of olive oil were considerably higher than the
same period of the previous years, due to the low olive oil production in 2007, caused by low
olive production.
This evolution of imports shows how the olive oil demand in Albania is price sensitive. The olive
oil price increase by almost 40% from year 2004 to 2005 was associated with almost 20%
reduction of the import of olive oil (Table 4.1). Simultaneously, the continuous increase of
domestic production of olives and olive oil has partially compensated the increasing demand, and
contributed to lowering demand for imports.
Table 4.1: Dynamics of olive oil imports from EU in terms of quantity, value and prices
Category 2003 2004 2005 2006 2007 2008
Mt 1,363 1,111 906 842 930 1,087
Eur (000) 2,419 2,384 2,591 2,871 2,415 2,781
Price Eur/liter 1.8 2.1 2.9 3.4 2.6 2.6
Source: EUROSTAT
Imports usually increase in the last part of the year, when consumption is higher and the olive oil
of the new crop is not yet ready. Imports reach a minimum in summer. In general, the yearly
peak of imports of olive oil follows by one or two months that one of table olives. In 2008
imports remained high also in January and February, due to the scarcity of domestic production
(see Chart 4.1).
Page 38
The Olive and Olive Oil value chain in Albania
35
Chart 4.1: Monthly dynamics of olive oil imports (Mt)
Source: EUROSTAT
Sector trade deficit is now nearly 3 m Eur and could easily exceed such levels in the next years.
At present, imports cover about 10% of market-based (i.e. except self-consumption) demand, but
imports from the highly competitive Mediterranean producers could lead to increase the market
share of imported olive oils in the next years. Increasing demand, years of relatively scarce crops
and a general scarce competitiveness of the Albanian products caused such a situation
It is now possible to buy large quantities of extra-virgin olive oil in bulk from Italy, Greece,
Spain and Tunisia for little more than 2.5 Eur/lt FOB, a price at which few Albanian companies
can produce a reasonably good quality olive oil.
5 CONSUMER PREFERENCES
5.1 CONSUMERS’ SEGMENTS AND KEY PREFERENCE FACTORS
There has been limited research on Albanian olive oil consumer preferences. Understanding
consumer preferences and olive oil consumer characteristics or profiles will help in matching
supply and demand, an issue which becomes increasingly important with the segmentation of
demand, with the price becoming only one of the customers’ choice factors.
Information on consumer preferences and market trends are useful also for the policy-making, in
the context of choosing the measures and ways of supporting the sector.
In recent years, Albania has seen a rapid evolution in its citizens’ consumption behaviors and life
styles due to economic growth, improvement in the standard of living, fast urbanization and trade
liberalization within the country. One consequence of this has been the gradual segmentation of
the food and beverages market, similar to what has been seen in other transitioning countries
(Berisha and Mara, 2005: WB, 2007). The transition from a centrally planned socialist economy
to a market oriented economy has also given rise to an urban middle-income class of consumers.
The food demand from the emerging urban middle-income consumers, combined with the
gradual consolidation of the retail sector and the recent establishment of the first supermarket
Page 39
The Olive and Olive Oil value chain in Albania
36
chains, has strong implications for the agri-food industry, which in the past has been almost
exclusively based on price.
Olive oil is an important component of the Albanian diet and its contribution to Albanian fat
consumption has been increasing in the last two decades (Chan-Halbrendtet al, 2010).
A recent consumer survey done in Tirana (Chan-Halbrendt et al., 2010), provided the following
main outcomes:
1. Six consumers’ segments and profiles were identified, based on set of preferences and
willingness to pay. The fact that it is now possible to clearly identify several segments of
consumers marks a milestone in the process of evolution of agri-food marketing, with
major consequences on development policies.
2. Origin is a key choice factor for 82% of respondents, in three out of six consumers’
segments (18
).
3. The confidence on quality and safety of domestic product is low. This conclusion
emerges from the analysis of several factors: i) imports are growing notwithstanding the
consumers’ preference for Albanian olive oil; ii) consumers have little confidence on
reliability of domestic industrial producers and controls made by competent authorities
(19
), so they prefer to buy olive oil directly from trusted farmers, or from the oil mills or to
buy imported products; iii) during the analysis there was a scarce correspondence
between low income and preference for low prices, as high prices are considered one of
the few reliable proxies for quality.
4. The majority of purchased olive oil is still traded as not bottled product, being
sourced either directly from farmers and oil mills or as by quantity in traditional shops.
44% of the interviewed consumers in Tirana confirm that they buy directly from farmer
and olive oil mill respectively (see Chart 5.1 below). This percentage should be much
higher in smaller cities or rural areas characterized by olive and olive oil production and
consumption. When considering also self-consumption of farmers in production areas, it
is possible to conclude that most probably, more than 70% of the olive oil consumed
in the country is sold as a non-bottled product and is subject to little quality control.
Chart 5.1: Place where consumers in Tirana buy olive oil
Source: Own survey
18
Applying the method of Latent Class Analysis, consumers are classified into groups based on preferences for
products’ characteristics and socio-demographic characteristics 19
Commercial fraud are widely considered both common and easy (QSR, 2005)
Page 40
The Olive and Olive Oil value chain in Albania
37
5.2 IMPLICATIONS OF CONSUMERS’ PROFILES AND SET OF PREFERENCES ON SECTOR POLICIES
The main outcome of the analysis of consumers’ preferences is that the vast majority of
Albanian consumers’ would prefer Albanian olive oil, should they be guaranteed about
quality and safety. They also showed willingness to pay for quality.
All these factors create ideal conditions for branding policies, for promotion of quality in typical
or regional productions and for territorial marketing. Consumers are willing to pay for a product
they can rely on, with a certain origin and not necessarily produced by a large food industry.
A key issue for improving customer’s confidence is increasing reliance on actual application of
standards. Albanian standards for olive oil are substantially reproducing the provisions included
in 1995 European Union regulation.
The process of approximation of Albanian legislation to European Union system of rules (the
acquis communautaire) will require updating Albanian regulation on olive oil, but no substantial
changes are required.
In addition, the institutions in charge of controlling and promoting the olive oil industry have to
focus the policies on issues of food safety, with local, national and international means of quality
certification. The main need consists in a much stronger effort from public bodies, producers and
consumers’ organizations for ensuring respect of legislation on production and trade of olive oil
and for improving transparency and quality of information to consumers.
Only if consumers will gain confidence in the correspondence between quality declared in the
label and actual quality of product, high price will be no more considered the best proxy for
quality.
Incorporating consumer preferences into product development and marketing strategy will
benefit the industry and help in selling the product. Knowing the olive oil attributes preferred by
the consumers, can help suppliers improve define their market segments and niches which are
clearly characterized. Consumers’ segmentation can be used by olive oil producers and by food
distribution operators for adapting their offer.
The presence of small niche markets for olive oil such with specific characteristics of taste and
type and the importance of origin for Albanian olive oil consumers gives the opportunity and the
need to maintain a sufficiently wide range of varieties in olive cultivation, a particularly
important issue in a period of expansion of the production base.
6 SUPPORT BY THE GOVERNMENT FOR THE SECTOR
6.1 SUBSIDIES
Up to 2007, support for agriculture production at farm level was channeled through subsidies for
fuel used by agriculture mechanism, but starting from 2007, new measures of direct support were
introduced, supporting new plantations of fruits, olives and vineyard. In year 2008, the range of
beneficiaries was expanded, as well as the budget, which further increased in year 2009.
The main objective of GoA/MAFCP has been to improve competitiveness, giving main priority
to the expansion of the production base (i.e. increasing areas planted by fruit trees) to increase
farm/production size. The subsidies and the other support measures are described below.
Page 41
The Olive and Olive Oil value chain in Albania
38
Capital cost contributions
New plantations: 50% of the project value, with a cap of 250 000 All/ha for traditional
planting and 350 000 All/ha for intensive planting of fruit trees olives, citrus and other fruit
trees for a surface not smaller than 0.2 ha for individual farmers (used to be 0.4 Ha, initially).
In year 2008, the disbursements for olive trees plantations scored 25% of all subsidies for
agriculture.
Drip irrigation: 50% of the total project value, with a cap of 300 000 All/ha for drip
irrigation on intensive orchards, including olives, of at least 0.2 ha. In year 2008, the
subsidies for this measure scored 5 percent of the total.
Soft loans
Investments financed by new loans in post-harvest or agro-processing: up to 70% of the
interests for a period of 3 years, with a cap of 15. 000 000 All.
Establishing a guaranty fund, covering up to 50% of the value of the principal, with a cap of
15. 000 000 All.
Current expenditures
Plant protection for olive trees, using bio-traps: 125 Euro/ ha. 18.4 m ALL were disbursed
in 2008 and 28.7 m ALL in 2009 (+55%).
Organic production: 50 000 All/farm.
Production of extra-vergin olive oil: 100 All/liter, up to 15 ton/year. 22.2 m ALL were
disbursed in 2008 and 9.7 m ALL 2009 (3.5 times higher).
Table 6.1: Subsidies for plantation and protection of olives (20
)
No. Qarks
Planting subsidies
2008
Planting subsidies
2009
Plant protection
2008
Plant protection
2009
No. of
projects
Payment
000 All
No. of
projects
Payment
000 All
No. of
project
Payment
000 All
No. of
projects
Payment
000 All
1 Berat 208 36,147 545 83,594 1,723 6,749 175 8,844
2 Dibër 0 0 1 100 0 0 0 0
3 Durrës 68 11,442 146 22,730 667 2,184 468 3,112
4 Elbasan 174 36,610 454 77,844 0 140 2,398
5 Fier 166 37,453 364 70,884 0 0 0
6 Gjirokastër 44 9,864 76 14,036 0 0 0
7 Korçë 0 0 0 0 0 0 0
8 Kukës 0 0 0 0 0 0 0
9 Lezhe 90 17,100 80 18,035 0 0 0
10 Shkodër 74 11,913 122 26,049 0 0 0
11 Tiranë 78 17,821 190 34,848 0 300 2,398
12 Vlore 102 33,191 253 58,345 1,131 9,442 947 11,952
Total 1,004 211,541 2,231 406,465 3,521 18,375 2,030 28,704
Source: Payment Agency, MAFCP
As a whole, the support for new plantations of olives, vineyard and other fruit trees, grew in 2009
by 15 percent compared to 2008, from 580 to 667 million All.
20
Data of 2009 are preliminary.
Page 42
The Olive and Olive Oil value chain in Albania
39
6.2 MARKET INFORMATION SYSTEM
MAFCP collect on a weekly basis data for 90 agriculture and livestock commodities (21
). Three
types of prices are collected:
Farm gate prices - prices at which the farmer sells his products at the wholesale market or to
individual buyers that come to buy on farm (more than 100 Kg).
Wholesale prices are collected from all the main agriculture wholesale markets in Albania,
including those of Lushnje, Tirana, Korca, and Fier. Prices are recorded separately for
domestic and imported products.
Retail prices are collected from different fresh fruits and vegetable retail markets.
Some prices of processed products are also collected in the agro-industry survey.
The existing MIS has several limits:
1. data are not collected for olives, fruits and vegetables used for processing;
2. data are not collected by variety of products (i.e. in the case of apples, Golden Delicious
versus Starking).
3. there is not a proper MIS for processed agri-food products (such as olive oil, wine, cheese,
etc.). Data on the prices of such products are collected in the agro-industry survey, but are not
collected and analyzed by a standard methodology, as needed for any MIS.
FAO’s Project “Support of Albanian Agriculture production”, established a MIS for agrifood
processed products; namely wine, cheese and olive oil. Retail prices were collected in average
shops and supermarkets across Tirana and other major urban areas, and were analyzed, taking
into consideration the type of product (extra-virgin versus virgin olive oil, white versus red wine,
etc.), by brand, by origin (imports versus domestic), packaging, etc. This MIS ceased to exist
after the project acvtivities were closed in 2007, while the capacities are still in place (the people
who operated the MIS).
7. FUTURE PRODUCTION AND INVESTMENT SCENARIOS (22
)
7.1 PLANNED EXPANSION OF THE PRODUCTION BASE AND EXPECTED SCENARIOS OF SUPPLY AND
DEMAND
The GoA of Albania lunched since early 2009 the idea of supporting the plantation of 20 million
olive trees, which would eventually transform Albania into a world level competitor. Before
analyzing the feasibility and implications of such an undertaking, we will analyze different
scenarios of production of the existing trees applying different levels of yield.
At present, domestic demand of olive oil scores around 12,200 Mt and that one of table olives
14,000 Mt per year (excluding self-consumption).
21
Data are collected for the main fruits and vegetables, potatoes, beans, wheat, corn, all livestock categories, forage,
wool and honey. 22
This analysis was conducted during the first quarters of year 2009.
Page 43
The Olive and Olive Oil value chain in Albania
40
Yearly yields and output are highly variable, as Albanian olive orchards receive poor or no
services and are highly vulnerable to weather conditions. According to previous surveys and
according to the evaluation of specialists, average yield of olive trees in Albania is circa 15
kg/tree.
Under these assumptions and estimations, there is a deficit of 1,500 tons of olive oil which is not
very different from the recorded official imports of olive oil – circa 1,000 tons of olive oil (the
current yields may be even a bit more than 15 kg/tree, i.e. if assumed 15.5 kg/tree, than we obtain
a deficit corresponding exactly to the recorded imports).
Different calculations and sources, may confirm the relative reliability of the above data.
Based on the above, it is also possible to analyze different scenarios related to different yields, as
shown in Table 7.1 below.
Table 7.1: Olive and olive oil production and surplus, under different scenarios of yield,
applied on the current number of trees (5,011,000 trees - 2008)
Yield
Kg/tree
Olive production
(Mt)
Olives for
processing (Mt)
Olive oil
production (hl)
Surplus (DSA
estimates)
10 45,099 31,099 6,220 -5,980
15 67,649 53,649 10,730 -1,470
16 72,158 58,158 11,632 -568
17 76,668 62,668 12,534 334
18 81,178 67,178 13,436 1,236
19 85,688 71,688 14,338 2,138
20 90,198 76,198 15,240 3,040
25 112,748 98,748 19,750 7,550
Source: Own calculations
Improving average yield to 17 kg/tree (+13%) to the current 5,011 million of trees (thus
excluding in these calculations the expected increased number of trees in the coming years) there
a surplus of production will be already achieved. Considering that many trees will enter in full
production in the next years, this objective seems easy to achieve.
According to expert (agronomist) evaluations, under irrigation and proper treatment, it is possible
to achieve average yield of 25 kg/tree (conservative assessment). At this level, suficit, is of
equivalent 7,550 tons.
As a conclusion, Albania can meet its demand for olives and olive oil, and even achieve surplus,
by simply improving services to the current olives; moreover, even without further support for
new plantings, the expansion of the production base will continue, even if at a slower pace: befor
the introduction of subsidies for new plantings, the average growth of the production base was of
166,000 new trees/year; in 2007-2008, after the introduction of subsidies, this amount increased
to 257,000 per year.
Now we analyze several investment scenarios and related implications. Five scenarios will be
considered, as described below.
Scenario 1 – Average future plantings in accordance to the trend recorded before the
introduction of subsidies.
Page 44
The Olive and Olive Oil value chain in Albania
41
Scenario 2 - Average future plantings in accordance to the trend recorded after the introduction
of subsidies (2007- 2008).
Scenario 3 - 20 million trees are planted within 5 years, starting in year 2009, at a pace of 4
million trees per year.
Scenario 4 - 20 million trees are planted within 10 years, starting in year 2009, 2 million trees
per year
Scenario 5 - 20 million trees are planted within 15 years, starting in year 2009, 1.33 million trees
per year.
The number of trees and production level are reflected respectively in Chart 7.1 and Chart 7.2
below. For the production, based on expert assessment, we assume that old trees (planted till
2008) have a yield of 15 kg/tree, whereas the new ones, 25 kg/tree. In the second year, the new
trees achieve 3 kg/tree, third year 8 kg/trees, fourth 20kg/tree, fifth 25 kg/tree.
Chart 7.1: Olive trees dynamics under different scenarios
(000 trees)
Source: Own calculations
Chart 7.2: Olive production dynamics under different scenarios
Mt
Source: Own calculations
Page 45
The Olive and Olive Oil value chain in Albania
42
Chart 7.3: Olive oil surplus, under different scenarios
Mt olive oil
Source: Own calculations
In case in Albania will be planted 20 million trees, the surplus at present level of consumptions
would be about 100,000 tons of olive oil (23
). Should consumption rise to the levels of Spain
(higher than in Italy, four times more than present consumption), there would be still a 20%
surplus, corresponding to 10,000 Mt of olive oil.
7.2 INVESTMENT COSTS RELATED TO EXPANDING PRODUCTION BASE
The initial investment cost, per tree, including seedling and the needed services is estimated 13.1
Euros.
In the years after plantation the cost of services grows, which becomes maximal, in the fifth year,
about 11.7 Euros/tree. In the fifth year, it is expected also the highest yield to be achieved,
namely 25 kg/tree.
Table 7.2 below summarises the yearly costs per tree, due to initial investment and agronomic
services in the start-up period of the plantation.
Table 7.2: Cost of initial investment and other operating cost
Eur
Year Cost Eur/tree
1 13.1
2 4.0
3 7.0
4 10.0
5 11.7 Source: Own calculations
23
As a matter of comparison, this would make Albania the third or fourth World producer, with exports
corresponding to 10% of total EU exports
Page 46
The Olive and Olive Oil value chain in Albania
43
The yearly investment costs for planting 20 million olives within 15, 10 or 5 years are quit high;
17.5, 26.2 and 52.4 million Eur per year respectively, and the total cost is almost 262 million Eur
(24
), as shown in table 7.2 below.
Table 7.2: Yearly investment cost for planting 20 million new trees (25
)
Scenarios
Plantings year
(000 trees)
Cost per tree
(first year)
Total cost per
year (000 Eur)
15 years 1,333 13.06 17,467
10 years 2,000 13.06 26,200
5 years 4,000 13.06 52,400
Total cost
000 Eur 262,000 Source: Own calculations
Even considering that most of these investments should be covered by growers (and therefore
based on investment decisions made by independent economic actors), the option of investing
more than a quarter billion euro in olive production in Albania in a competition scenario
characterized by low international prices, scarce competitiveness of domestic production and
processing system, scarce labour force in some key production areas and increasing capacity of
larger bottlers in importing cheap olive oil, seems overambitious.
At the same time the production cost, in the long run, is expected to be 0.4-0.5 Euros/kg
(respectively, optimistic and conservative scenarios), higher than EU average. Working on
increasing production efficiency and yields is therefore a key issue for a sustainable expansion of
the sector.
8 FINDINGS OF THE ANALYSIS AND SWOT APPRAISAL
8.1 THE DOMESTIC SUPPLY: A GROWING SECTOR WITH UNRESOLVED CONSTRAINTS
At production level, high prices of olives and Government subsidies led to increase the pace of
expansion of production base. After reaching a minimum in 1998, the total stock of olive trees
started to grow back and the growth rate is sensibly increased in the last two years.
In many cases this expansion of the production base is made by individual subsistence farms and
there are few cases of substantial investments in commercial olive groves.
The demand of both olive oil and table olives is increasing and market segmentation is becoming
more evident. The response of the most dynamic entrepreneurs in olive processing consisted in
widening the range of products offered and in investing in new processing lines.
Distribution is also undergoing major and rapid changes, as the emergence of a middle-income
consumer class and rapid urbanization makes it possible to segment the offer and paves the
24
the planting costs can decrease, as a result of the economies of scale (in procurement of sapling, etc.), but it
remains very high. It cannot be realistically supported by any donor, and/or by the government especially
considering the restrictive fiscal policy which is likely to be applied in the coming years. 25
Here are included only costs emerging in the first year, including seedlings and necessary agronomic services and
inputs. There are also assumed zero interest rate, which is not realistic.
Page 47
The Olive and Olive Oil value chain in Albania
44
ground for strengthening wholesaling businesses and for food retailing consolidation. The fast
growth of supermarket chains and the construction of shopping center in the area Tirana-Durres
are the marks of such change.
At the same time, the sector constraints at production level remain substantially unchanged. High
prices of olives and Government subsidies contribute to expand the production base, but
unresolved problems of production efficiency and quality undermine the advantages of such
expansion.
Despite potentials based on natural conditions and tradition, there is a wide consensus that there
is a lack of competitiveness in the subsector of olive and olive oil, due to constraints relvant to
the whole agriculture sector and to factors more specific of olive oil and table olive production,
detailed in the following chapters.
Low value chain efficiency and scarce quality/safety are heavily affecting the competitiveness of
this sector in Albania. Should these issue be not addressed, a larger production base will make a
future sector crisis both heavier and more likely.
The production base is mostly made by subsistence farming. The only areas where the
development is driven by more specialized, wealthier and organized (but still small-sized) farms
are some parts of Vlora (olives for processing) and Berat (table olives) districts.
Development perspectives and constraint factors are different for olive oil and table olives.
8.1.1 Development perspectives and constraints factors in olive oil production
Natural conditions and tradition make the production of olive oil in Albania potentially
competitive. Demand is also growing and becoming more qualified in terms of willingness top
pay for quality.
Notwithstanding this, the structure of the value chain makes domestic production not
competitive, a situation which so far did not result in a decline of domestic production mostly
because of: i) sustained growth of demand and, ii) inefficiency and fragmentation of both bottlers
and wholesalers, who are not taking full advantage by the possibility to import good quality olive
oil in bulk.
The two main factors affecting competitiveness of Albanian olive oil are: i) the inefficiency at
production level and; ii) the inadequate system of quality control, undermining consumers’ trust.
The constraint of scarce production efficiency
A key problem is the increasing divergence between expectations of farmers on raw olive prices
and international price trends.
Farm-gate prices higher than 0.3 to 0.35 euro/kg (45 to 50 ALL) for high quality raw olives will
be not sustainable in the medium and long term. Now prices are 2.5 times higher, for a poor
quality product, due to improper harvesting practices.
The mark up at production level is exceptionally high (in most cases well over 100%), but the
revenue from an average olive grow is small, because of limited size of the plot and low
productivity. Olive farms, are typically smaller than 1 Ha. Moreover, many farms are fragmented
Page 48
The Olive and Olive Oil value chain in Albania
45
into 2 or more plots. Small size and fragmentation directly affects production efficiency, due to
lack of economies of scale.
Even in the years of highest production (i.e. when prices of raw olives are lower) the cost of
producing olive oil exceeds 320 to 350 All/lt (i.e. about 2.5 euro); this value does not include any
marketing and environmental management cost (for treating waste) and assumes unsustainably
low amortization costs.
At present, the international wholesale prices of the main extra-virgin olive oil producers range
from 3.1 Eur/lt. (Italy) to 2.3-2.4 Eur/lt. for Greek and Spanish products. Even considering
transports, custom fees, margins of traders and inefficiency of the whole Albanian wholesaling
system, bottlers can get good quality imported olive oil at less than 500 ALL/CIF (they paid 550
ALL in 2007, when international prices were higher). This means that, considering an average
20% margin of processing companies and average processing costs of olives (from 70 to 110
all/kg), any price of the olives above 70 ALL/kg is likely to lead to a gradual, but steady increase
of olive oil imports.
In a scenario characterized by increasing efficiency of the distribution system, gradual adoption
of EU rules on environment protection (with relevant costs) and needs to replace obsolete
equipment, the maximum raw olives price that can be paid while remaining competitive in the
domestic market is expected to decrease well below 0.4 euro/kg (i.e. less than 55 ALL/kg).
Such price would be considered unacceptably low by farmers in Central Albania (the main
production areas being Tirana and Elbasan) and low in Vlora and in Southwest Coast, where the
new plantations were made in the expectation that prices of olives will not decrease much from
2007 level (when price was well over 110 all/kg, i.e. almost 1 euro/kg at 2007 exchange rate).
To be really competitive, the processing cost should not exceed 80 to 90 ALL/lt., the mark up of
processors should be not higher than 10% and the cost of raw olives should be as low as 0.3
Euro/kg (45 ALL/kg at 2009 exchange rate) - with a better quality. In this way, the factory-gate
price of olive oil would be comparable to the wholesale price of Greek and Spanish olive oil and
still higher than Tunisian one.
In the next years, production of olives will gradually increase, as newly planted olive trees will
start to enter into production. Nevertheless, the yield per plant will remain low and the variation
of yield among years high, as investments are mostly devoted to plant more trees rather than to
take better care of existing ones.
Many key critical factors which are the cause of the very low and oscillating yields
characterizing Albanian olive production, are likely to be made worse by a larger production
base. Among such factors we can include the following:
1. Poor infrastructure and lack of irrigation, affecting the yields and making the production
vulnerable to weather conditions;
2. Low level of mechanization
3. High percentage of poorly tendered trees and, more in general, scarce agronomic services
provided to olive orchards
4. Limited plant protection and lack of post-harvest know how and investment
The expansion of the production base not accompanied by investments for increasing
productivity and organisation of the value chain are therefore going to perpetuate the problem of
low yields and exacerbate the oscillation of production between years. Moreover, as new
Page 49
The Olive and Olive Oil value chain in Albania
46
plantations are made on a small scale and without receiving technical assistance, a growing
surface under plantations characterized by heterogeneity of varieties, making more difficult
planning and organizing harvesting (varieties have different suitability for mechanical harvesting,
sensibility to water stress etc.) and also increasing difficulties of oil mills focused on high
quality, as it is more difficult to produce high quality olive oil with different varieties of olives.
Other socio-economic factors requiring counter-balancing measures that the expansion of
production base cannot solve and in some cases can contribute to worsen are the following:
1. The increasing age of farmers, particularly in areas affected mostly by migration, such as
South-West Coast, reducing labor resources and affecting entrepreneurship.
2. Lack of marketing and management know-how – the farming base is made by subsistence
farming and are typically not perceived as businesses but as mere agriculture production units
3. Preference of farmers for self-standing activity, with consequent scarcity of joint farmers’
initiatives, such as producer groups or cooperatives. Without increased cooperation between
farmers logistic of harvesting and marketing will become increasingly difficult.
4. Poor private and public extension services, contributing to the wrong focus of investments,
now essentially driven by erroneous perception of price trends, government subsidies and to
and the casual choice of varieties.
The need for gaining consumers’ trust
Another major issue is the scarce trust of consumers in domestic industrial producers. Albanian
consumers prefer domestic production, when considered genuine: the low trust in industrial
producers push many of them either to buy olive oil directly from trusted farmers or oil mills (26
)
or to buy imported olive oil, perceived as safer, if not tastier.
Higher consumers’ trust and better visibility (27
) of imported products is duly reflected in the
competitive map (28
) on the key segment of extra-virgin olive oil sold in Tirana supermarkets (29
)
The last competitive map of extra-virgin olive oil in retail packaging was performed in 2008 by a
USAID project (30
). The outcomes are shown in table 8.1 below:
26
who in fact do not guarantee quality and safety of the product, due to improper use of raw material, poor storage
conditions and frauds. 27
which not necessarily translates in higher sales, but is anyhow a very strong marketing tool 28
A competitive map shows the presence of brands and different packages of a certain product (in the case, olive oil
of different categories) in one or more clusters of outlets, and their prices. 29
This combination represents the very edge of the market, as it is the best product sold in the outlets with best
image in terms of reliability and appeal and with higher growth rate, in the richest and largest market of the country. 30
“Report on food chain analysis of olive oil and table olives in Albania”, DAI/USAID Albanian Agriculture
Competitiveness project, Tirana 2008
Page 50
The Olive and Olive Oil value chain in Albania
47
Table 8.1: Extra-virgin olive oil references recorded in Tirana supermarkets in 2008, by
price segment
All
Origin/price segment
All References
Imported
>650 23
430-650 0
<=430 1
National
>650 8
430-650 8
<=430 7 Source: 2008 AAC Field survey
Since 2008, the situation is slightly more equilibrated, with higher presence of leading Albanian
bottling companies in the supermarkets and prices of Albanian extra-virgin olive oil more similar
to those ones of imported extra-virgin olive oil.
Notwithstanding this progress, most of what is considered the best and more qualitatively reliable
olive oil sold in Albania is still made by imported products. The higher trust of Albanian
consumers in imported olive oil is confirmed by the stability of imports, in spite of increasing
domestic production and of higher percentage of bottled extra-virgin olive oil produced in
Albania.
8.1.2 Development perspectives and constraints factors in table olives production and
processing
The perspectives for table olives are better, especially in Berat, the main specialized production
area.
Prices of domestic table olives are high, but the image of the green “Kokerrmadh Berati” is
strong enough to support a premium price even against imported table olives. Also, the
international price of table olives is also sensibly higher than that one of olives for olive oil.
Traditional specialization of Berat district in table olive growing also allows some economies of
scale, as the distribution of land resulted in transferring to farmers olive groves which are larger
than those ones in most parts of the country.
The structure of processing industry is also more sustainable than that one of olive oil, as there
are relatively few, consolidated leading operators.
The sub-sector of table olives in retail packaging is made by a market leader and few other
enterprises; this situation is not expected to change much in the near future.
Processing of table olives in bulk is becoming increasingly fragmented, but this trend could be
considered as a temporary situation, as most of the smaller, improvised wholesalers/processors
will most probably find more profitable to focus back on trading or will be gradually induced to
become more formal.
Page 51
The Olive and Olive Oil value chain in Albania
48
Imports of table olives are rising, but increasing efficiency and quality of domestic production is
likely to upturn this trend. At present, due to the difficulties to get sufficiently large and reliable
supplies of extra and prime quality olives from local producers (less than 10% of olives from
Berat belongs to extra quality), a large share of extra and first quality table olives packed in
Albania have been previously imported in bulk
Anyhow, considering the market as whole, more than 50% of table olives of extra and first
quality and filled ones is made by table olives from Berat. This share can easily increase, should
the quality of the most commercially valuable Albanian table olives (i.e. “Kokerrmadh” and “E
barde”) be improved.
Margins at production level are still too high (they have been always largely over 100% in the
last years), but it is possible to limit them, as the system of relations between growers and
processing companies is more consolidated and the overall revenue of an olive grove is good,
thanks to the larger average surface.
The second and third quality and the olives without bones are mostly covered by domestic
production. The demand in this segment is expected to increase, but at a relatively low pace.
8.1.3 Rapid changes in the competitive environment
The Albanian sector of olive and olive oil is undertaking a process of rapid changes: new
enterprises quickly raise and decline in a period of a couple of years; the opportunities to profit
from a growing and increasingly qualified demand leads many operators to invest.
High prices of raw olives in the last four harvest seasons, (wrong) expectation that olive prices
will remain high in the long term and availability of different types of Government subsidies for
olive oil have contributed to accelerate the pace of expansion of the production base and to
stimulate new initiatives in olive processing
Farmers have mostly invested in planting more trees, as this option is easier and less demanding
than improving productivity of existing orchards; the fact that the Government advertised the
expansions of production base as the main path to sector development and the allocation of
considerable public financial resources to subsidise new plantations has also contributed to the
preference for this option.
Investments in processing have been on a small scale, made by farmers and by small operators
willing to establish some processing facilities.
Some larger investments in olive oil processing have been also made, first of all that one of the
(such as the establishment of a relatively large olive processing line by Sidnej) or in integrated
enterprises (such as Agrotal) respond to a longer term commitment to develop business in the
sector, which in fact is negatively affected by excessive cost of raw material, which was possible
to transfer only partially into higher sales prices of olive oil.
At present, the majority of key actors in the olive oil sub-sector are bottlers, gradually becoming
larger and more consolidated, but the market leader is Borshi “Ylli Haidjni” a producer/bottler.
New developments see a polarization of new initiatives, either quite small (wholesalers starting
to process small quantities of table olives, new local small oil mills being established, etc.) or
large (for Albanian standards), such as the establishment of Agrotal (an enterprise planning to
establish a large scale, integrated production cycle) or the widening of the olive oil business by
Page 52
The Olive and Olive Oil value chain in Albania
49
existing agri-food industries such as Sidnej (which bought one of the largest olive processing
lines in the country) and Fiol (the leading bottler for other vegetable oils).
The recent development of supermarket chains is also going to generate new challenges and to
induce major changes for domestic producers, the main ones being described below:
The opportunities of medium-sized brands to operate successfully with own retail packaging
will be reduced, as larger operators will find easier to ensure regular flows of products and
more stable trade relations; companies which are already leaders in other products sold in
supermarkets, such Sidnej (processed vegetables) and Fiol (vegetable oils) will find easier to
widen their range of products.
The distribution margins will gradually increase, as increasingly strong supermarket chains
will impose their contract conditions ad will take over the logistics from producers.
Informal trades and direct sales to consumers will be not necessarily affected by these
changes, as direct purchasing from oil mills is driven either by qualitative matters (the
consumer trust in the olive oil of a specific producer and this is the reason why the most
qualitative small oil mills are selling most of their production directly to consumers), or by
family and traditional links wit a certain area (as many consumers recently moved into the
cities from countryside, they keep sourcing part of their food directly from producers they
know) or by price (non-packed olive oil is cheaper than branded one by not 70-80 ALL/lt. or
more)
Small and medium sized operators with a relatively passive marketing, such as JAL or Saranda
are likely to loose more market shares, being already in decline in the last two years.
Competition from imported olive oil is also likely to become stronger, as the presence of a wider
range of imported products will be a strong promotion tool.
Changes in the competitive environment are duly reflected in retail surveys performed in 2006
(31
) and in 2008: many medium-sized actors are practically disappeared (as in the case of general
food wholesalers who were bottling olive oil, as ALFAVO) or strongly downsized (as JAL and
Saranda), while new medium-sized actors started to be present in the markets (e.g. Alb-Berat)
and some bottling companies (such as Dhermiu and Borshi “Origijnal”) substantially increased
their presence in the market.
8.1.4. Impact of changes in food distribution on the olive sector
The economic growth and the improvement in the standard of life, fast urbanisation and trade
liberalization, have recently led in Albania to a rapid evolution of consumption behaviour and
lifestyle and consequently to the gradual segmentation of the food and beverages market, similar
to other transition countries. The demand from the emerging urban middle income class of
consumers, combined with the gradual consolidation of the retail sector and the recent
establishment of the first supermarket chains has strong implications for the agrifood market,
which in the past years was almost exclusively based on price. Thus, in Albania there is a larger
demand for olive oil in general, and for quality olive oil, specifically.
The Albanian distribution system is traditional and extremely fragmented: wholesaling is still
underdeveloped and consolidation of retailing is just beginning.
31
By FAO “Agricultural Production Support” project
Page 53
The Olive and Olive Oil value chain in Albania
50
Especially for olive oil, distribution to retailers is mainly performed by bottlers, while the role of
wholesalers in distributing table olives is higher. However, a large share of the production is
bought by households directly from producers.
In general, olive oil processing companies distribute directly to retail outlets bypassing, relying
less on wholesalers. However, small processors and farmers still largely rely on direct personal
sales to final consumers.
The growth of organized distribution is changing the value chain. This is a recent evolution (the
first suburban shopping center including a large supermarket was opened in 2006). The entrance
in the market of two foreign-owned supermarket chains and the parallel growth of some domestic
larger retailers into supermarket chains is expected to trigger substantial changes in the food
distribution system of the main cities in a few years.
8.2 EVOLUTION OF DEMAND AND MAIN FACTORS DRIVING CONSUMER PREFERENCE
Important changes occurred in the last three years in the demand pattern: the work for increasing
consumers’ awareness about product safety and quality started to give results in terms of changes
in consumers’ preferences, thanks also to the increased revenues of the urban middle class,
allowing more definite market segmentation.
The demand for olive oil and table olives has been increasing in the recent years. Sales of
medium and small supermarkets confirm this trend. The quantity sold in the 2008 increased with
10-15% compared with the previous year and kept increasing in 2009, in spite of the economic
slowdown.
Consumers are mostly accustomed to “traditional” olive oil, which is a single product, without
specification of quality (lampante, virgin, extra-virgin etc.). In fact the average consumer has not
a real knowledge of the product. This situation is rapidly changing and local enterprises react to
this introducing a wider range of products.
Consumer behaviour and preferences have been recently analysed using different techniques (32
),
providing results which complement each other in providing an increasingly complex profile of
the Albanian consumer.
Price remains the main factor for the majority of population, so that normal olive oil (category 3
of virgin olive oils under the Albanian standard) remains by far the most required item. The field
survey performed in 2008 showed that extra virgin and virgin quality of olive oil makes up
respectively 2% and 5% of the overall supply in supermarkets, meaning that in the market as a
whole the share of such products is even lower. Considering also imported olive oil, 70% of sales
in supermarkets is made by normal olive oil. In the whole market such share is most probably
exceeding 80%
At the same time, the latent class analysis, performed in Tirana among consumers, provided for
the first time evidence of market segmentation. The most important outcome has been that 47%
32
The olive oil competitive map has been produced for the first time in 2006 by the FAO project “Agricultural
Production Support in Albania”; the map was updated and integrated with interviews to supermarket managers in
2008 (see: “Report on food chain analysis of olive oil and table olives in Albania”, DAI/USAID Albanian
Agriculture Competitiveness project, Tirana 2008). Finally, a latent class analysis has been performed in 2009
among consumers (“Consumer Preference for Olive Oil: The Case of Albania” Catherine Chan-Halbrendt et al.,
paper to be presented in AIEA 2009).
Page 54
The Olive and Olive Oil value chain in Albania
51
of consumers interviewed in the richest urban area of the country are willing to pay an high price
(33
) for high quality olive oil.
Also, the latent class analysis showed the importance of origin for Albanian consumers and the
strong preference for domestic production, if genuine.
Combining the outcomes of the interviews with supermarket managers and import flows data and
results of the latent class analysis, the conclusion is that in absence of other trustworthy reference
elements, the perceived quality is identified with high prices and that imported products are
perceived as more reliable.
8.3 SWOT MATRIX
Based on the above, it is possible to produce the SWOT matrix:
Factors of strength
Production base with good potential and in
phase of expansion
Diffused cultivation of at least two local
varieties with a very good commercial
potential (Kokerrmadhe Berati and Kalinjot)
Improving know-how base in processing and in
some technical services.
Existing processing capacity of reasonably
modern oil mills can absorb a much larger
production without requiring additional
investments.
Increasing investments addressed to the sector
Consolidated industrial base of medium-sized
bottlers
Some small oil mills have reached high quality
standards, gaining national and international
awards
Positive trend of demand of olive oil and table
olives.
Albanian customers prefer domestic products
when sure about quality
Factors of Weakness
Fragmentation of olive production base (farms
are too small to be efficient)
Excessive farm-gate price of olives: pricing is
related to family income objectives rather than
to international prices.
Low average quality of olives, due to poor
agronomic, harvesting and post-harvesting
practices.
Insufficient know-how and inadequate
awareness of producers about market quality
criteria (as opposed to traditional quality
criteria)
Too high degree of informality. In the short
term, level of informality in table olives
processing is even increasing
Long term constraints in key production areas
of Elbasan-Tirana (competition from
alternative uses of land) and South West Coast
(scarcity of labor and financial resources)
High quality olive oil represents a very small
share of both demand and supply.
Consolidation in the processing sector is
progressing too slowly
Opportunities
Olive and olive oil sector is considered a
priority in the Agricultural policy of the
country; beneficiary of Government subsidies
and long term support from several donors.
Demand at regional level is also increasing
Threats
Improving efficiency in distribution increases
the chances of importing olive oil with a better
price/quality ratio.
The sector in other Mediterranean countries is
growing faster and in a more organized way
Pressure for formalization of enterprises will
increase processing and distribution costs.
33
“Low,”, “medium” and “high” price thresholds were based on the indication of the competitive map.
Page 55
The Olive and Olive Oil value chain in Albania
52
8.4 CONCLUSIONS
The above analysis shows how far is the sector from being internationally competitive and that
the main efforts should be focused on import substitution, keeping the share of imported olive oil
below 10% of urban consumption (34
), including not only retail-packaged olive oil, but also olive
oil imported in bulk and packed by Albanian bottlers.
Considering the present structure of the value chain, perspectives are better for table olives and
more problematic for olive oil. However, the limited size and growth pace of domestic market
represents a limit to sector development ambitions: while import substitution or a broadly neutral
trade balance (with some exports balancing imports) seem a realistic goal, making Albania a
major actor of the international trade of olive oil seems an overambitious target.
Having to choose between adding more olive trees and optimizing the yield of existing ones the
first option is the easiest and eventually the less expensive one for producers (also considering
that new plantations are subsidized), but not the most efficient. The situation of the sector would
require an expansion of the production base and a drastic increase of productivity, but having to
set a priority, the second issue is more important. As a consequence of the above, the present
expansion of the production base will not necessarily lead to a more efficient use of resources,
especially in the use of labor (35
).
More important, the expansion of production base will not solve the structural factor of weakness
of domestic production.
9 Priorities for intervention and recommendation for development measures
9.1 MAIN FACTORS FOR DEVELOPMENT
1. Strengthening the upstream supply chain and consolidating the processing industry. To
remain competitive, the oil processing industry will need to consolidate its structure, increase
its efficiency and, most important, ensure a regular flow of cheaper raw olives. The
alternative consists in a gradual split of the market: the branded olive oil will be increasingly
produced by bottlers importing olive oil, while the quantity of not branded olive oil directly
marketed by farmers will further increase, but sales will decrease, with the result that
increasing quantities of olive oil will remain unsold in the farms.
Considering the increasing role of organized distribution (which can bypass Albanian
importers) and the dominance of bottlers over producers in the domestic market, (which, are
buying olive oil in country or abroad, according to convenience, as it happened in 2008),
maintaining and possibly increasing the present share on the domestic market should be the
first priority of Albanian olive oil industry.
34
MAFCP statistics show that imported olive oil corresponds to approximately 10% of domestic production; Even
considering heavily under-estimated the data on domestic production, the estimate share of imported olive oil on the
consumption generating cash transactions (i.e. excluding self-consumption of growers) is not far from this figure.
The estimate share of imported olive oil on urban consumption is 14%. 35
An extensive production pattern will require a lower total amount of man/days as compared with a more intensive
one, giving to higher margins per production unit, but will require more labor for a limited period (during harvest),
thus decreasing the total share of family labor force used for the cultivation and eventually the total profit.
Page 56
The Olive and Olive Oil value chain in Albania
53
Some small high-quality Albanian producers have now reached a level that would make them
competitive in any market, but the quantity they produce is so small and the constraints to
their growth are such, that their results can be considered as success stories of small
individual businesses, rather than a promising trend for the Albanian industry as a whole.
2. Speeding up the process of approximation to EU norms and requirements: Being olive and
olive oil included in the products supported by CAP (Common Agricultural Policy), the
relevant regulation cannot rely only on the provisions of the Codex Alimentarius and requires
specific legislation to make it compliant with EC regulations. Existing legislation must be
updated, including provisions for safety and quality Minimal Technical Requirements (36
).
The olive cadastre must be established as soon as possible, as part of the steps to establish
the IACS (Integrated Administrative Control System), which is a key step in the process of
approximation.
Finally, it is necessary to start the introduction for mitigation and eventual elimination of
environmental impact of olive oil production, an issue on which EU rules are particularly
strict (environmental standards).
3. Increase measures to boost productivity at production level. Increasing productivity is an
elusive goal, as it requires either cooperation between farmers (e.g. for pest control or to
access to water resources), or higher minimal investments (e.g. to dig an individual well or to
build up a water reservoir), or more labour for tendering the groves (which is a scarce
resource in South West Coast). More in general, increasing productivity require more cash
costs (as opposed to family labour or one-off plantation cost). However, the experience of
olive growers in Berat (for table olives production) and Novosele (mainly for olive oil
production) shows that increasing capital intensity pays back. Incentives should be therefore
studied and addressed at increasing productivity.
Efforts to support the establishment and development of farmers’ cooperatives and
associations should be continued.
More cost/effective methods for IPM (integrated pest management) should be introduced, in
addition to those ones presently subsidised.
Finally, more extension and technical assistance should be provided as part of any incentive
package.
4. Implementing actions to increase profit margins of domestic olive oil producers, At present,
the cost of raw material is unsustainably high. In these conditions, olive processors cannot be
competitive. Their preset ability to stay in the market comes from exceptionally low
marketing costs, lax fiscal control, absence of any cost for disposing and processing waste
and inefficiency of food distribution system. All these factors are about to change.
However, making better use of sub-products would contribute to increase processing industry
margins.
5. Supporting the establishment of producers’ associations and cooperatives, to improve
market access to farmers and help formalizing direct sales of olive oil. Direct sales of olive
oil by farmers will gradually decline, but will represent a major share of total supply flows
for many years. As new plantations will enter in full production and farmers will try to resist
36
The use of term “standards”, although often used, can be misleading, as “standards” are voluntary ones, while
those ones required by law to produce and sell a product are Minimal Technical Requirements (MTR). There are two
types of MTR: safety ones (those ones to be satisfied in order to have a product not harmful for the consumer) and
quality ones, which are used to classify the product (e.g. different types of virgin and non virgin olive oils).
Page 57
The Olive and Olive Oil value chain in Albania
54
to the reduction of prices of raw olives, trying to sell less olives and have more of them
processed for direct sale of olive oil. As a result of these opposite trends, the gap between
supplies of olive oil from farmers and demand from consumers will grow.
At present, even if perceived by the consumer as more genuine, the olive oil sold by farmers
is generally of poor quality, due to inappropriate harvesting and storage.
Supporting the establishment of farmers’ associations and cooperatives is one of the few
practicable ways to improve the quality of farmers’ olive oil and ensure gradual formalization
of their business, while keeping the value added of the olive oil to olive producers. Albanian
farmers are particularly reluctant to involve themselves in joint activities, but confidence can
be gradually built around joint initiatives having a limited purpose (such as coordinating
harvesting and storing properly the olive oil) as demonstrated during the activity of the FAO
project “Agricultural Production Support in Albania”.
The establishment and strengthening of farmers’ associations and cooperatives is also a
necessary step to overcome the extreme fragmentation of olive farming, which prevents any
economy of scale and contributes to high production costs. Vertical cooperation and
partnership (i.e. between processors and farmers) should be also strengthened.
Continuing the action to support the establishment and strengthening of farmers’ associations
and cooperatives is also a way to establish gradually the Producers’ Organisations (PO),
which have a key function in the application of Common Agricultural Policy.
The experience of the FAO project in supporting farmers’ association and cooperatives also
identified the scarcity of specialized services as a the key point of weakness. The lack of
specialised accountants, lawyers and fiscal advisors makes it difficult to establish a
cooperative and does not allow the members to make full use of the advantages given by the
law and to use the cooperative to optimise their fiscal charge and to get easier access to
Government support.
6. Provide extension and technical assistance to improve productivity and make best use of
available incentives. Availability of field services is a key factor to increase productivity and
improve quality both for farmers and olive oil processors. Also, an increasingly important
constraint is not the lack of incentives, but the scarce know-how of farmers about them, the
limited capacity of applying for them and the difficulty to integrate different benefits. Good
examples of such difficulties are: i) the scarce success so far recorded among agro-industries
of the soft credit line for SME financed by the Italian Government and; ii) the equally much
limited demand for the rebate offered by MAFCP on passive interests paid by agro-industries
on the loans taken for new investments.
At present, the filed extension services provided by MAFCP are quite limited, as well as the
range of services provided by private consultants to facilitate the access to loans and other
financial facilities.
In particular, information and technical assistance on markets and marketing issues is
practically not provided at all.
7. Improving consumers’ awareness and market surveillance on olive oil quality and safety.
Increased consumers’ awareness and knowledge of the product will improve the capacity of
consumer to choose quality products based on factors other price, thus strengthening the
leadership of most qualitative domestic producers.
Better organized market surveillance will contribute to reduce the incidence of commercial
frauds, bolstering consumers’ trust in domestic products and providing a clearer separation
Page 58
The Olive and Olive Oil value chain in Albania
55
between products of formal and informal producers. Quality and safety inspection/control
should be strengthened to protect consumers but also to prevent unfair competition.
8. Improving quality of inputs and relevant quality controls. Low quality, high prices and poor
know-how about the proper of use agricultural inputs contribute to inefficiency and low
yields at production level. Concern and mistrust of producers on quality of agricultural inputs
is both widespread and deeply rooted. Recurrent frauds and prices higher than in
neighbouring countries contributed to this difficult relation between input suppliers and
farmers. Increasing controls, encouraging more competition between input suppliers and
supporting the establishment of joint input procurement of farmers (such as farmers’
associations or cooperatives specialised in input procurement) would help to solve the
problem of low quality and high price of agricultural inputs.
9. Improving quality of propagation material and making appropriate use of it. The need for
improving input supplies include also the provision of more homogeneous and qualitative
saplings and olive trees. At present, nurseries are providing sapling of variable quality and
much heterogeneous. The most important supply source of homogeneous remain the
Technology Transfer Centre of Vlora, but the output is not sufficient for the need of the
increasing demand. Moreover, the range of products offered is mostly limited to few
mainstream varieties for olive oil, so that supply of olive trees for table olives and of some
valuable domestic varieties (such as the family of “White olive” of Tirana and Elbasan) is
quite limited. Also, the work of varietal selection for some autocthon varieties has been not
yet completed.
At the same time, the range of varieties of imported samplings is quite large and producers
often want to try different varieties, so that it is frequent to find several varieties in the same
plot. As a whole, the choice of a variety, especially for olive oil production, is not driven by
land suitability and/or marketing criteria.
The situation is better for table olives, as the specialised plantations are more homogeneous
and concentrated in Berat and few other areas.
More in general, producers consider that the quality of imported saplings is better than that
one of domestically produced ones; this is reflected by the higher final cost of imported
sapling and by the higher mark up applied on them by nurseries.
10. Need for a more organic reform of land transactions and use of uncultivated areas. The
process of land consolidation shows little progress. The average size of farms is increased by
0.1 ha since 2000 and most of the progress is limited to coastal areas in Fier and Vlora. The
fiscal policy related to land transaction and the land use taxes are not encouraging
consolidation, either. The agriculture land transaction reference prices, upon which taxes are
calculated, are often not realistic (too high), thus hindering land transaction, a prerequisite for
the consolidation process. The lack of proper urban planning is also creating a market price
distortion, because the land planned for the planting of olives, is used also as a land for
development (e.g. the coastal-touristic areas in South West).
The tax on land sale is becoming also an obstacle because is calculated on the 10% of the
difference between the sale price and the value of the of the actual reference price deflated
for 1991(37
) (time of land distribution). The legislation for the re-allocation of uncultivated
or abandoned agricultural land has been amended, but is still focused on better allocation of
land for annual crops and does not tackle the increasingly important issue of semi-abandoned
37
Such value gives to the probable sellers the illusion that the land given for 1991 is not given for granted.
Page 59
The Olive and Olive Oil value chain in Albania
56
or abandoned olive groves, a problem particularly important in the South-West coast. A new
legal base is created for the stimulation of the rental market, where farmers are obliged to
present every year a plan of land plantation and if fallow land is declared , it will be given for
rent with the intermediary and obligatory role of the local government. This law is not still
under implementation, but is expected to not function actively because of the weak force of
the local governance to implement land obligations (the land tax has still a high delinquency
rate).
11. Revising the support scheme to olive production: The scheme of incentives to oliviculture
should be more coherent with the general agriculture sector development objectives and with
the overall development perspectives of the value chain, i.e. should be based on a value chain
organic development approach. Support to expansion of the production base should be
included in a much more articulated exercise of land suitability (to optimise the use of scarce
natural resources) and development of typical production, supporting only a limited range of
varieties in each region and increasing the homogeneity of olive varieties.
Plant protection remains, at large, a major weakness for most farms, and further support is
needed on that aspect; the present support scheme, exclusively based on the adoption of an
effective, but quite expensive use of bio traps is both financially not sustainable and
ineffective, as it often fails to cover sufficiently large areas.
A more articulated action should be deployed, including: i) the definition and enforcement of
quality MTR (thus discouraging the production of olive oil made with olives heavily attacked
by the olive fly), ii) the dissemination of know how for the use of cheaper IPM methods (as
compared to the use of bio traps), iii) improving technical assistance to farmers, focused on
the aspects of relations between quality, harvesting times and methods (38
) and iv) the
provision of subsidies only in the cases when the pest control campaign can be carried out on
a sufficiently wide area, in force of agreements between farmers and/or campaigns organized
at least at village level.
12. Focusing investments in processing on improvement of existing oil mills. Interviewed
processors confirm that there are enough processing capacities in Albania; as a consequence
priority should be given to the improvement of the existing oil mills, to comply with EU
standards safety and quality of production, labour safety and environmental management, a
particularly sensible issue in the olive oil industry.
13. Improving marketing and developing marketing support tools. Marketing is another major
weakness faced in the olive and olive oil value chain. In addition to providing assistance at
firm level, introducing initiatives, such as national and regional brands, is deemed to be
useful, in the context of market preferences developments.
The recent work performed with support of EC for the introduction of appropriate legislation
and methodology for the establishment of wines with Protected Denomination of Origin
(PDO) and Protected Geographic Indication (PGI) provides a blueprint also for the
establishment of olive oils with PDO and PGI.
14. Increasing consumer awareness. Olive oil is traditionally part of the diet only in the areas
where it is produced and in urban population. Part of the recently population recently
immigrated in urban areas and rural population in non-producing areas make little use of
38
Harvesting olives a bit before full ripening ensure the production of better quality olive oil and sensibly reduces
the risks of attacks from the olive fly.
Page 60
The Olive and Olive Oil value chain in Albania
57
olive oil, also because of its cost. On the contrary, rural population in production areas use
very large quantities of olive oil. However, these regular consumers have a limited
knowledge of olive oil quality, being accustomed to the traditional, generic, olive oil,
characterized by high acidity and other defects, whose quality is further damaged by long
storage in unsuitable conditions.
Frequent commercial frauds have also contributed to create among consumers mistrust about
industrial production; since Albanian consumer anyhow prefer domestic production, the
result is that the average consumer prefer, when they can, either to buy directly the olive oil
from a trusted producer or to buy bottled imported olive oil.
This situation is changing with the consolidation of the olive oil industry, the emergence of
some reputed brands, and the new emerging urban middle class has a better knowledge of
quality in olive oil.
Some development projects, mainly implemented by USAID, had devoted some resources to
improve know how on olive oil quality and to increase consumers’ awareness, organising
competitions among olive oil producers and training professionals in tasting olive oil.
However, the resources allocated for this purpose have been always quite limited. More
structured consumer awareness campaigns are therefore necessary to improve knowledge of
the product among occasional consumers and knowledge of quality among regular
consumers.
The acquisition of full membership in the COI in 2009 will facilitate this action, as COI can
provide the know how and part of the resources for implementing consumers’ awareness
campaigns
9.2 RECOMMENDATIONS AND OUTLINE FOR A SECTOR DEVELOPMENT INITIATIVE
Considering the above, an organic sector development initiative should primarily address the
following aspects:
1. Improve governance of the value chain, strengthening the legal and institutional
environment and the tools for policy-making. This activities must include: i) support to
development and updating relevant legislation (on olive and olive oil, olive cadastre, products
with protected denomination of origin); ii) support to improvement of sector support
schemes, including development of better decision-making tools such as the land suitability
map and a basic Market Information System for bottled olive oil and iii) improvement of
documentation and technical tools for extension services, developing an “extension package”
similar to that one produced by FAO for fruits, vegetables and grapes and wine.
2. Improving technical assistance to farmers. High production cost and farm gate price of raw
olives and extreme oscillation of production from one year to another are major factors
affecting sector competitiveness. Improving harvesting practices can give a major
contribution to the qualification of the offer.
Field assistance to farmers to improve productivity of existing groves is a cost/effective and
sustainable option for expanding and stabilizing output. Focusing technical assistance in the
main production areas (such as Fier, Vlora and Elbasan/Tirana) is a very cost/effective way
for developing the whole sector.
3. Improving access to services of value chain operators. The range of services and support
measures available to value chain operators is increasing, yet most actors do not know about
Page 61
The Olive and Olive Oil value chain in Albania
58
such services or are not able to access them. Providing direct (though seminars) and indirect
(through Local Development Agencies or MAFPC Technology Transfer Centres) assistance
could contribute to increase both volume and efficiency of investments.
4. Supporting the establishment of farmers’ associations and cooperatives. Support to joint
activities of farmers associated in different ways (as cooperatives for joint production and
trade, as associations for provision of services to members) can be provided through technical
assistance and development of specialized services. The lack of specialized advisory services
in legal and fiscal aspects is a factor hampering the development of cooperatives.
5. Reducing the environmental impact of olive oil production. Effluents and sub products from
olive oil production (vegetation water and olive cake) are now just thrown in the environment
(water) or used in minimal part (olive cake). The regulatory framework for environmental
management is still far from being harmonized to EU requirements. However, this process is
starting. Increasing the know how in environmental management of agroindustrial waste and
investing in making the best use of effluents and by-products will be a key feature in the next
years. Problems and investments related to environmental management of olive oil
production are particularly important, as the financial sustainability of plants complying with
EU environmental management requirements is a particularly delicate matter in periods of
decreasing international olive oil prices, as the present one.
Regional focus
Considering the above, it emerges that action could be conveniently focused in Berat (for table
olives), Fier (which is one of the main production areas, even if not considered among the best)
and in Vlora (both in the area of Novosele and in the South-West Coast, with different
approaches). More specific actions and limited could be implemented in Lezha (table olives), and
Elbasan-Tirana (both olive oil and table olives).
Page 62
The Olive and Olive Oil value chain in Albania
59
Bibliography
Berisha, A. & Mara.V. 2005 “Role of diets in Balkan countries, as part of Mediterranean diets, in
people’s health” Albanian Journal of Agricultural Sciences, Vol 1, No 1, Tirane, Albania
Chan-Halbrendt, C., Zhllima, E., Sisior, G., Imami, D., Leonetti, L., 2010, “Consumer Preference
for Olive Oil: The Case of Albania”, IAMA World Symposium, Boston, USA
DSA, 2008, “Report on food chain analysis of olive oil and table olives in Albania”, prepared for
USAID-AAC (Albanian Agriculture Competitiveness) project
FAO Project “Agricultural Production Support in Albania”, 2006, 7th
Report on Technical
Assistance on Marketing”, Final Report, Tirana, Albania
FAO Project “Agricultural Production Support in Albania”, 2006, baseline survey on 100
farmers in Novosele and Shushice
MAFCP, 2005, Statistical yearbook, Tirana, Albania
MAFCP, 2007, Statistical yearbook, Tirana, Albania
MAFCP, 2009, Statistical yearbook, Tirana, Albania
Qendra per Studime Rurale (QSR), 2005, Marketing with Dignity, Working Paper
Skreli, E., Imami, D., Leonetti, L. & Feraj, B., 2009, Analysis of the olive and olive oil value
chain in Albania through the expert choice method. 4th Annual Meeting of Alb-Shkenca
Institute, Tetova, Maqedonia
USAID-AAC “Olives value chain assessment”, October 2007.
World Bank, 2007, “Strategic Policies for a More Competitive Agriculture Sector in Albania”,
Tirana, Albania
http://epp.eurostat.ec.europa.eu
http://www.bancaditalia.it
Ministry of Agriculture, Food and Consumer Protection, Statistics Sector
Page 63
The Olive and Olive Oil value chain in Albania
APPENDIX 1
World review
Page 64
The Olive and Olive Oil value chain in Albania
A1-1
Chart A1.1: Dynamics of production of virgin olive oil
Mt
Source: FAOSTAT
The production of olive oil has increased significantly over the last decades and is more than
doubled since the 1960’.
More than 75% of the total olive oil is produced in EU Mediterranean countries, which are also
the main driving force behind the production growth.
Chart A1.2: Dynamics of virgin olive oil production structure
Source: FAOSTAT
Chart A1.3: Structure of virgin olive oil production by country in year 2007
Page 65
The Olive and Olive Oil value chain in Albania
A1-2
Source: FAOSTAT
Chart A1.4: Dynamics of olive production by country
Mt
Chart A1.5: Dynamics of olive production structure
Source: FAOSTAT
Chart A1.6: Structure of olive production by country in year 2007
Page 66
The Olive and Olive Oil value chain in Albania
A1-3
Source: FAOSTAT
Chart A1.7: Dynamics of exports of virgin olive oil
(Mt)
Source: FAOSTAT
Page 67
The Olive and Olive Oil value chain in Albania
A1-4
Chart A1.8: Dynamics of export structure of virgin olive oil
(Mt)
Source: FAOSTAT
Chart A1.9: Structure of olive oil exports by country in year 2007
Source: FAOSTAT