Send Orders of Reprints at [email protected]The Open Fuel Cells Journal, 2013, 6, 21-39 21 1875-9327/13 2013 Bentham Open Open Access On Thermodynamic Stability of Hydrogenated Graphene Layers, Rele- vance to the Hydrogen on-board Storage Yury S. Nechaev 1,* and T. Nejat Veziroglu 2 1 Bardin Institute for Ferrous Metallurgy, Kurdjumov Institute of Metals Science and Physics, Vtoraya Baumanskaya St., 9/23, Moscow 105005, Russia 2 International Association for Hydrogen Energy, 5794 SW 40 St. #303, Miami, FL 33155, USA Abstract: The present analytical study using thermodynamic methods for analysis of data from a number of theoretical and experimental works, devoted to the current problem of thermodynamic stability and related thermodynamic character- istics of the following graphene layers systems: 1) double-side hydrogenated graphene of composition CH - theoretical graphane (Sofo et al. 2007) and experimental graphane (Elias et al. 2009); 2) theoretical single-side hydrogenated gra- phene of composition CH; 3) theoretical single-side hydrogenated graphene of composition C 2 H - graphone; 4) experi- mental hydrogenated epitaxial graphene, bilayer graphene and a few layers of graphene on SiO 2 or other substrates; 5) ex- perimental and theoretical single-external side hydrogenated single-walled carbon nanotubes, and experimental hy- drofullerene C 60 H 36 ; 6) experimental single-internal side hydrogenated (up to C 2 H or CH composition) graphene nanoblis- ters with intercalated high pressure H 2 gas inside them, formed on a surface of highly oriented pyrolytic graphite or epi- taxial graphene under the atomic hydrogen treatment; and 7) experimental hydrogenated graphite (multigraphene) nanofi- bers with intercalated solid H 2 nano-regions inside them. The main target of the present study is to show a possible break- through in solving the problem of hydrogen on-board storage in fuel cell powered vehicles (Nechaev 2011-2012). Keywords: Hydrogenated graphene layers, graphanes, thermodynamic stability, solid hydrogen intercalated into hydrogenated graphite nanofibers, the hydrogen on-board storage in fuel-cell-powered vehicles 1. INTRODUCTION As noted in a number of articles 2007 through 2013, hy- drogenation of graphene - a single layer of carbon atoms arranged in a honeycomb lattice [1, 2], as a prototype of co- valent chemical functionalization and an effective tool to open the band gap of grapheme, is of fundamental impor- tance. It is relevant to the current problem of hydrogen on-board storage, and also to the related problems of thermodynamic stability and thermodynamic characteristics of the following systems: 1). double-side hydrogenated graphene - theoretical graphane of composition CH [3, 4] and experimental graphane [5]; 2). theoretical single-side hydrogenated graphene of composition CH (SSHG) [6-8]; 3). theoretical single-side hydrogenated graphene of composition C 2 H (graphone) [9]; 4). experimental hydrogenated epitaxial graphene, bigra- phene and a few layer graphene on SiO 2 or other sub- strates [5]; *Address correspondence to these authors at the International Association for Hydrogen Energy, 5794 SW 40 St. #303, Miami, FL 33155, USA; Tel: +7495 491-02-62; Fax: +7495 777-93-50; E-mail: [email protected]5). experimental and theoretical single-external-side hy- drogenated single-walled carbon nanotubes (SWCNTs) of composition about C 2 H and experi- mental hydrofullerene C 60 H 36 [10-14]; 6). experimental single-internal-side hydrogenated gra- phene nanoblisters possessing of a very high Young’s modulus (with intercalated into them H 2 gas of a high pressure) formed on the surface of highly oriented py- rolytic graphite (HOPG) or epitaxial graphene under the definite atomic hydrogen treatment ([15-21]); 7). experimental hydrogenated graphite nanofibers pos- sessing of a high Young’s modulus (with intercalated into them solid H 2 ) that is relevante to the problem of the hydrogen on-board storage [18-21]. In this analytical review, results of thermodynamic analysis and comparison of some theoretical and experimen- tal data are presented, including those from the most cited works [3, 5] and from the least non-cited works [18-21]. In [8], the double-side hydrogenation of graphene is now well understood, at least from a theoretical point of view. For example, Sofo et al. predicted theoretically a new insulating material of CH composition called graphane - double-side hydrogenated graphene, in which each hydrogen atom ad- sorbs on top of a carbon atom from both sides, so that the hydrogen atoms adsorbed in different carbon sublattices are on different sides of the monolayer plane [3]. The formation
On Thermodynamic Stability of Hydrogenated Graphene Layers, Rele-vance to the Hydrogen on-board Storage
Yury S. Nechaev1,* and T. Nejat Veziroglu2
1Bardin Institute for Ferrous Metallurgy, Kurdjumov Institute of Metals Science and Physics, Vtoraya Baumanskaya St., 9/23, Moscow 105005, Russia 2International Association for Hydrogen Energy, 5794 SW 40 St. #303, Miami, FL 33155, USA
Abstract: The present analytical study using thermodynamic methods for analysis of data from a number of theoretical and experimental works, devoted to the current problem of thermodynamic stability and related thermodynamic character-istics of the following graphene layers systems: 1) double-side hydrogenated graphene of composition CH - theoretical graphane (Sofo et al. 2007) and experimental graphane (Elias et al. 2009); 2) theoretical single-side hydrogenated gra-phene of composition CH; 3) theoretical single-side hydrogenated graphene of composition C2H - graphone; 4) experi-mental hydrogenated epitaxial graphene, bilayer graphene and a few layers of graphene on SiO2 or other substrates; 5) ex-perimental and theoretical single-external side hydrogenated single-walled carbon nanotubes, and experimental hy-drofullerene C60H36; 6) experimental single-internal side hydrogenated (up to C2H or CH composition) graphene nanoblis-ters with intercalated high pressure H2 gas inside them, formed on a surface of highly oriented pyrolytic graphite or epi-taxial graphene under the atomic hydrogen treatment; and 7) experimental hydrogenated graphite (multigraphene) nanofi-bers with intercalated solid H2 nano-regions inside them. The main target of the present study is to show a possible break-through in solving the problem of hydrogen on-board storage in fuel cell powered vehicles (Nechaev 2011-2012).
Keywords: Hydrogenated graphene layers, graphanes, thermodynamic stability, solid hydrogen intercalated into hydrogenated graphite nanofibers, the hydrogen on-board storage in fuel-cell-powered vehicles
1. INTRODUCTION
As noted in a number of articles 2007 through 2013, hy-drogenation of graphene - a single layer of carbon atoms arranged in a honeycomb lattice [1, 2], as a prototype of co-valent chemical functionalization and an effective tool to open the band gap of grapheme, is of fundamental impor-tance.
It is relevant to the current problem of hydrogen on-board storage, and also to the related problems of thermodynamic stability and thermodynamic characteristics of the following systems:
1). double-side hydrogenated graphene - theoretical graphane of composition CH [3, 4] and experimental graphane [5];
2). theoretical single-side hydrogenated graphene of composition CH (SSHG) [6-8];
3). theoretical single-side hydrogenated graphene of composition C2H (graphone) [9];
4). experimental hydrogenated epitaxial graphene, bigra-phene and a few layer graphene on SiO2 or other sub-strates [5];
*Address correspondence to these authors at the International Association for Hydrogen Energy, 5794 SW 40 St. #303, Miami, FL 33155, USA; Tel: +7495 491-02-62; Fax: +7495 777-93-50; E-mail: [email protected]
5). experimental and theoretical single-external-side hy-drogenated single-walled carbon nanotubes (SWCNTs) of composition about C2H and experi-mental hydrofullerene C60H36 [10-14];
6). experimental single-internal-side hydrogenated gra-phene nanoblisters possessing of a very high Young’s modulus (with intercalated into them H2 gas of a high pressure) formed on the surface of highly oriented py-rolytic graphite (HOPG) or epitaxial graphene under the definite atomic hydrogen treatment ([15-21]);
7). experimental hydrogenated graphite nanofibers pos-sessing of a high Young’s modulus (with intercalated into them solid H2) that is relevante to the problem of the hydrogen on-board storage [18-21].
In this analytical review, results of thermodynamic analysis and comparison of some theoretical and experimen-tal data are presented, including those from the most cited works [3, 5] and from the least non-cited works [18-21].
In [8], the double-side hydrogenation of graphene is now well understood, at least from a theoretical point of view. For example, Sofo et al. predicted theoretically a new insulating material of CH composition called graphane - double-side hydrogenated graphene, in which each hydrogen atom ad-sorbs on top of a carbon atom from both sides, so that the hydrogen atoms adsorbed in different carbon sublattices are on different sides of the monolayer plane [3]. The formation
22 The Open Fuel Cells Journal, 2013, Volume 6 Nechaev and Veziroglu
of graphane was attributed to the efficient strain relaxation for sp3 hybridization, accompanying with a strong (diamond-like) distortion of the graphene network [3, 22]. In contrast to graphene - a zero-gap semiconductor, graphane is an insu-lator with an energy gap of Eg 5.4 eV [4, 23]. Only if hy-drogen atoms adsorbed on one side of graphene (in grap-hane) are retained, we obtain graphone of C2H composition, which is a magnetic semiconductor with Eg 0.5 eV and a Curie temperature of Tc 300-400 K [24].
As was noted in [6], neither graphone nor graphane are suitable for real practical applications, since the former has a low value of Eg, and undergoes a rapid disordering because of hydrogen migration to neighboring vacant sites even at a low temperature, and the latter cannot be prepared on a solid substrate [9].
Single-side hydrogenated graphene (SSHG) of CH com-position [7, 25] is an alternative to graphane, in which hy-drogen atoms are adsorbed only one side. In contrast to gra-phone, they are adsorbed on all carbon atoms rather than on every second carbon atom. The value of Eg in SSHG is suffi-ciently high (1.6 eV lower than in graphane), and it can be prepared on a solid substrate in principle. But, this quasi-two-dimensional carbon-hydrogen theoretical system is shown to have a relatively low thermal stability, which makes it difficult to use SSGG in practice [6, 7].
As seen in [7], it may be inappropriate to call the cova-lently bonded SSHG system sp3 hybridized, since the charac-teristic bond angle of 109.5° is not present anywhere, i.e., there is no diamond-like strong distortion of the graphene network, rather than in graphane. Generally in the case of a few hydrogen atoms interacting with graphene or even for graphane, the underlining carbon atoms are displaced from their locations. For instance, there may be the diamond-like local distortion of the graphene network, showing the signa-ture of sp3 bonded system. However, in SSHGraphene all the carbon atoms remain in one plane, making it difficult to call it sp3 hybridized. Obviously, this is some specific sp3–like hybridization. Such model is taken into further consideration in this analytical study [10-21].
In a number of works, it shows that hydrogen chemisorp-tion corrugates the graphene sheet in fullerene, carbon nano-tubes, graphite and graphene, and transforms it from a semimetal into a semiconductor [3, 5, 25-28]. This can even induce magnetic moments [29-31].
It is worth repeating [8] the prediction for the double-side hydrogenated graphene [3] was partially confirmed by Elias et al. [5]. They demonstrated that graphene can react with atomic hydrogen, which transforms this highly conductive zero-overlap semimetal into an insulator of high thermal stability, and the double-side hydrogenation of graphene is reversible. The authors themselves expressed some doubts, relevant to the complete adequacy of the experimental grap-hane to the theoretical one [3]. Alternatively, they supposed, that the experimental graphane (a free-standing membrane) produced by them, may have a more complex hydrogen bonding than the one suggested by the theory, and that the latter may be as an “until now theoretical material”.
In the case of epitaxial graphene on substrates such as SiO2 and others, hydrogenation occurs only on the top basal plane of graphene, and it is not accompanied with a strong
(diamond-like) distortion of the graphene network, but only with some ripples. The first experimental indication of such a specific single-side hydrogenation came from Elias et al. [5]. The authors mentioned a possible contradiction with the theoretical results of Sofo et al. [3], which had down-played the possibility of a single side hydrogenation. They proposed an important facilitating role of the material ripples for hy-drogenation of graphene on SiO2, and believed that such a single-side hydrogenated epitaxial graphene can be a disor-dered material, similar to graphene oxide, rather than a new graphene-based crystal – the experimental graphane pro-duced by them.
On the other hand, it is expedient to note that changes in Raman spectra of graphene caused by hydrogenation were rather similar (with respect to locations of D, G, D′, 2D and (D+D′) peaks) both for the epitaxial graphene on SiO2 and for the free-standing graphene membrane [5].
As it is supposed by many scientists [5, 8], such a single side hydrogenation of epitaxial graphene occurs, because the diffusion of hydrogen along the graphene-SiO2 interface is negligible, and perfect graphene is impermeable to any atom and molecule [32]. But these two aspects are of the kinetic character, and therefore they can not influence the thermo-dynamic predictions [3, 24, 31].
Authors of [8] noted that their test calculations show that the barrier for the penetration of a hydrogen atom through the six-membered ring of graphene is larger than 2.0 eV. Thus, they believe that it is almost impossible for a hydrogen atom to pass through the six-membered ring of graphene at room temperature (from a private communication with H.G. Xiang and M.-H. Whangbo).
In the present analytical review, a real possibility is con-sidered when a hydrogen atom can pass through the gra-phene network at room temperature. This is the case of exis-tening relevant defects in graphene, i.e., in grain boundaries and/or vacancies [33-42]. This is related to further considera-tion of data in this analytical study as mentioned above.
Previous theoretical studies suggest that single-side hy-drogenation of ideal graphene would be thermodynamically unstable [31, 24]. Thus [8], it remains a puzzle why the sin-gle-side hydrogenation of epitaxial graphene is possible and even reversible, and why the hydrogenated species are stable at room temperatures [5, 43]. This puzzling situation is also considered in the present analytical review. The main aim of this study is to show a real possibility, at least, from the thermodynamic point of view, of the existence of hydrogen-ated graphene-based nanostructures [18-21] possessing very high Young’s modulus, and also showing a real possibility of intercalation in such nanostructures of solid molecular hy-drogen under definite hydrogenation conditions relevant to the current problem of hydrogen on-board storage in fuel-cell-powered vehicles.
2. ANALYSIS AND COMPARISON OF DATA ON THEORETICAL AND EXPERIMENTAL GRAP-HANES
2.1. Consideration of Data on Theoretical Graphanes (CH)
In work [3], the stability of graphane with formula CH, a fully saturated extended two-dimentional hydrocarbon de-
On Thermodynamic Stability of Hydrogenated Graphene Layers, Relevance to the Hydrogen The Open Fuel Cells Journal, 2013, Volume 6 23
rived from a single graphene sheet, has been predicted on the basis of the first principles total-energy calculations. All of the carbon atoms are in sp3 hybridization forming a hexago-nal network (a strongly diamond-like distorted graphene network) and the hydrogen atoms are bonded to carbon on both sides of the plane in an alternative manner. It has been found [3] that graphane can have two favorable conforma-tions: a chair-like (diamond-like) conformer and a boat-like (zigzag-like) conformer.
The diamond-like conformer [3] is more stable than the zigzag-like one. This was concluded from the results of the calculations of binding energy (∆Hbind.(graphane)) (i.e., the dif-ference between the total energy of the isolated atoms and the total energy of the compounds), and the standard energy of formation (∆H0
f298(graphane)) of the compounds (CH(graphane)) from crystalline graphite (C(graphite)) and gaseous molecular hydrogen (H2(gas)) at the standard pressure and temperature conditions [3].
For the diamond-like graphane, the former quantity is ∆Hbind.(graphane) = 6.56 eV/atom, and the latter one is ∆H1 = ∆H0
f298(graphane) = - 0.15 eV/atom. The latter quantity corre-sponds to the following reaction:
C(graphite) + ½H2(gas)→ CH(graphane) (∆H1) (1)
where ∆H1 is the standard energy (enthalpy) change for this reaction.
By using the theoretical quantity [3] of ∆H0f298(graphane),
one can evaluate, within the framework of the thermody-namic method of cyclic processes [44], a value of the energy of formation (∆H2) of graphane (CH(graphane)) from graphene (C(graphene)) and gaseous atomic hydrogen (H(gas)). For this, it is necessary to take into consideration the following three additional reactions:
C(graphene)+ H(gas)→ CH(graphane) (∆H2) (2)
C(graphene)→ C(graphite) (∆H3) (3)
H(gas)→ ½ H2(gas) (H4) (4)
where ∆H2, ∆H3 and ∆H4 are the standard energy (enthalpy) changes.
Reaction (2) can be presented as a sum of reactions (1), (3) and (4) using the framework of the thermodynamic method of cyclic processes [44]:
∆H2 = (∆H3+∆H4+∆H1) (5)
Substituting in Eq. (5) the known experimental values of ∆H4 = -2.26 eV/atom and ∆H3 -0.05 eV/atom [25, 45], and also the theoretical value [3] of ∆H1 = -0.15 эВ/atom, one can obtain a desired value of ∆H2 = -2.5 ± 0.1 eV/atom. The quantity of -∆H2 characterizes the break-down energy of C-H sp3 bond in graphane (Fig. 1), relevant to the breaking away of one hydrogen atom from the material, which is ∆H(C-H)graphane = -∆H2 = 2.5 ± 0.1 eV.
In evaluating the above mentioned value of ∆H3, one can use the experimental data [45] on the graphite sublimation energy at 298 K (∆Hsubl.(graphite) = 7.41 0.05 eV/atom), and the theoretical data [25] on the binding cohesive energy at about 0 K for graphene (∆Hcohes.(graphene) = 7.40 eV/atom). Therefore, neglecting the temperature dependence of these
quantities in the interval of 0-298 K, and one obtains the value of ∆H3 -0.05 eV/atom.
∆Hcohes.(graphene) quantity characterizes the break-down energy of 1.5 C-C sp2 bond in graphene, relevant to the breaking away of one carbon atom from the material. Conse-quently, one can evaluate the break-down energy of C-C sp2 bonds in graphene, which is ∆H(C-C)graphene = 4.93 eV. This theoretical quantity coincides with the similar empirical quantities obtained in [18-21] from the graphite sublimation energy ∆Hsubl.(graphite) for C-C sp2 bonds in graphene and graphite, which are ∆H(C-C)graphene ∆H(C-C)graphite = 4.94 0.03 eV. The similar empirical quantity for C-C sp3 bonds in diamond obtained from the diamond sublimation energy ∆Hsubl.(diamond) is ∆H(C-C)diamond = 3.69 0.02 eV [18-21].
It is important to note that in [25] chemisorption of hy-drogen on graphene was studied using atomistic simulations, with a second generation reactive empirical bond order of Brenner inter-atomic potential. As it has been shown, the cohesive energy of graphane (CH) in the ground state is ∆Hcohes.(graphane) = 5.03 eV/atom(C). This results in the bind-ing of hydrogen energy, which is ∆H(C-H)graphane = 1.50 eV/atom(H) [25].
The theoretical ∆Hbind.(graphane) quantity [3] characterizes the break-down energy of one C-H sp3 bond and 1.5 C-C sp3 bonds (Fig. 1). Hence, by using the above mentioned values [3] of ∆Hbind.(graphane) and ∆H(C-H)graphane, one can evaluate the break-down energy of C-C sp3 bonds in the theoretical grap-hane [3], which is ∆H(C-C)graphane = 2.7 eV. Also, by using the above noted theoretical values [25] of ∆Hcohes.(graphane) and ∆H(C-H)graphane, one can evaluate similarly the break-down energy of C-C sp3 bonds in the theoretical graphane [25], which is ∆H(C-C)graphane = 2.35 eV. Comparing the obtained values of ∆H(C-C)graphane, ∆H(C-C)graphene, ∆H(C-C)graphite and ∆H(C-
C)diamond show that the elastic and intrinsic strength properties depending on ∆H(C-C) equantities, and especially, the Young’s modulus of the theoretical graphanes [3, 25] can be much less than those for perfect graphene [1, 25], perfect graphite [45] or perfect diamond [45] possessing of the lower ∆H(C-C) values.
2.2. Consideration of Data on Hydrogen Thermal De-sorption from Theoretical and Experimental Graphanes
In [4], the process of hydrogen thermal desorption from graphane [3] has been studied using the method of molecular dynamics. The temperature dependence for T = 1300-3000 K at the time (0.01) of hydrogen desorption onset (i.e., the time of removal 1 % (-ΔC) of the initial hydrogen concentration C0 0.5 (in atomic fractions), -ΔC/C0 0.01) from the C54H(54+18) clusteres (with 18 hydrogen passivating atoms at the edges to saturate the dangling bonds of sp3-hybridized carbon atoms) have been calculated. The corresponding acti-vation energy of Ea = 2.46 0.17 eV and the corresponding near temperature independent frequency factor A = (2.1 0.5)1017 s-1 have also been calculated. The process of hydro-gen desorption at T = 1300-3000 K has been described in terms of the following standard Arrhenius relationship:
1/0.01 = A exp (-Ea / kB T) (6)
24 The Open Fuel Cells Journal, 2013, Volume 6 Nechaev and Veziroglu
where kB is the Boltzmann constant. The authors predicted that their results would not contradict the experimental data [5], according to which the nearly complete desorption of hydrogen (-ΔC/C0 0.9) from a graphane membrane was achieved by annealing it in argon at T = 723 K for 24 hours (i.e., 0.9(membr.)723K = 8.64104 s).
By using Eq. (6), the authors evaluated the quantity of 0.01(graphane) for T = 300 K (11024 s) and for T = 600 K (2103 s). However, they note that the above two values of 0.01(graphane) should be considered as rough estimates. Using Eq. (6), one can evaluate the value of 0.01(graphane)723K 0.7 s for T = 723 K, which is much less (by five orders) than the 0.9(membr.)723K value [5].
In the framework of the formal kinetics approximation of the first order rate reaction [46], a characteristic quantity for the reaction of hydrogen desorption is 0.63 – the time of the removal of ~ 63 % (-ΔC) of the initial hydrogen concentra-tion C0 (i.e., -ΔC/C0 0.63) from the hydrogenated gra-phene. Such a first order rate reaction (desorption) can be described by the following equations [14, 46]:
d C / d t = - K C (7)
(C / C0) = exp (- K t ) = exp (- t /0.63) (8)
K = (1/0.63) = K0 exp (-ΔHdes. / kB T ) (9)
where K = (1/0.63) is the reaction (desorption) rate constant, ΔHdes. is the reaction (desorption) activation energy, and K0 is the per-exponential (or frequency) factor of the reaction rate constant. In the case of a non-diffusion rate limiting ki-netics, the quantity of K0 may be the corresponding vibra-tional frequency (K0 = ), and Eq. (9) may be related to the Polanyi-Wigner equation [14]. By substituting in Eq. (8) the quantities [4] of t = 0.01(graphane)723K and (C / C0) = 0.99, one can evaluate the desired quantity 0.63(graphane)723K 70 s. Hence, using Eq. (9) results in the analytical quantity of Aan. = 21015 s-1 corresponding to data [4].
Analogically, one can evaluate the desired quantity 0.63(membr.)723K = (1/K(membr.)723K) 3.8104 s corresponding to data [5], which differs from 0.63(graphane)723K quantity corre-sponding to data [4] by about three orders. By substituting in Eq. (9) the quantity of K = K(membr.)723K and supposing that ΔHdes. = ΔHdes.(membr.) ∆HC-H(graphane) = -∆H2, where ΔHdes.(membr.) corresponds to the desorption activation energy in [5], one can evaluate the quantity K0(membr.) = (membr.) 71012 s-1 for the experimental graphane membranes [5]. The obtained quantity of (membr.) is less by one and a half orders of the vibrational frequency RD = 2.51014 s-1 corresponding to the D Raman peak (1342 cm-1) for hydrogenated graphene membrane and epitaxial graphene on SiO2. The activation of this peak in the hydrogenated samples authors [5] attribute to breaking of the translation symmetry of C-C sp2 bonds after formation of C-H sp3 bonds. Also, (membr.) is less by one order of the vibrational frequency HREELS= 8.71013 s-1 corre-sponding to an additional HREELS peak in [47] arising from C-H sp3 stretching appears at 369 meV after a partial hydro-genation of the epitaxial graphene. The authors [47] suppose that this peak can be assigned to the vertical C-H bonding, giving direct evidence for hydrogen attachment on the epi-taxial graphene surface.
Taking into account RD and HREELS quantities [5, 47], and substituting in Eq. (9) quantities of K = K(membr.)723K = 1/0.63(membr.)723K and K0 K0(membr.) HREELS, one can evalu-ate ΔHdes.(membr.) = ∆HC-H(membr.) 2.66 eV. In such approxi-mation, the obtained value of ∆HC-H(membr.) coincides (within the errors) with the experimental value [13] of the break-down energy of C-H sp3–like bonds in hydrofullerene C60H36 (∆HC-H(C60H36) = 2.64 0.01 eV) [5].
The above analysis of the related data shows that for the experimental [5] graphene membranes (hydrogenated up to the near-saturation) can be used the following thermodesorp-tion characteristics, relevant to Eq. (9), of the empirical char-acter: ΔHdes.(membr.) = ∆HC-H(membr.) = 2.6 ± 0.1 eV, K0(membr.) = C-H(membr.) 51013 s-1. The analysis also shows that this is a case for a non-diffusion rate limiting kinetics, when Eq. (9) corresponds to the Polanyi-Wigner one [14]. Certainly, these tentative analytical results for the experimental [5] graphene membranes could be unambiguosly confirmed and/or modi-fied by receiving and treating within Eqs. (8, 9) of the ex-perimental data (similar to [5]) on 0.63 at several annealing temperatures.
The above noted fact that the empirical quan-tity0.63(membr.723K) is much larger (by about 3 orders), than the theoretical one (0.63(graphane723K)) corresponding to data [4] is consistent with that mentioned in [5]. It was noted the alter-native possibility that the experimental graphane membrane (a free-standing membrane) might have a more complex hy-drogen bonding, than the suggested by the theory [3]. This may point out for further theoretical and experimental devel-opments.
2.3. Consideration of Thermodynamic Probability Exis-tence of Hydrogenated Graphenes - Graphanes* Possess-ing of Very High Binding Energy
In connection with the above consideration, it seems ex-pedient to consider a thermodynamic probability of existence of hydrogenated graphene - graphane* (CHgraphane*) possess-ing of the values of ∆H(C-H)graphane* 2.6 eV [3-5, 12, 13, 18-21] and ∆H(C-C)graphane* 4.9 eV [18-21]. This corresponds to a very high binding (cohesive) energy (∆Hbind.(graphane*) 10 eV/atom, in comparison with those considered above for theoretical graphanes [3, 4, 25]. Because of such thermody-namic probability, it is necessary to take into consideration two more additional reactions:
C(gas)→ C(graphene) (∆H10) (10)
C(gas)+ H(gas)→ CH(graphane*) (∆H11) (11)
where ∆H10 and ∆H11 are the standard energy (enthalpy) changes.
Reaction (11) can be presented as a sum of reaction (2), applied for graphane* as (2*) with the standard energy change ∆H2*, as well as reaction (10), resulting in the follow-ing equation:
∆H11 = (∆H2* + ∆H10) (12)
Substituting in Eq. (12) the above considered values of ∆H2* ∆H2 -∆HC-H(membr.) = -2.6 ± 0.1 eV/atom and ∆H10 -∆Hcohes.(graphene) -∆Hsubl.(graphite) = -7.41 0.05 eV/atom, one can obtain a desired value of ∆H11 = -10.0 ± 0.1 eV/atom.
On Thermodynamic Stability of Hydrogenated Graphene Layers, Relevance to the Hydrogen The Open Fuel Cells Journal, 2013, Volume 6 25
The quantity of -∆H11 corresponds to the binding (cohesive) energy of graphane* (-∆H11 = ∆Hbind.(graphane*) = ∆Hcohes.(graphane*)). The quantity -∆H11 characterizes the break-down energy of one (C-H) sp3–like bond and 1.5 (C-C) sp3–like bonds, relevant to breaking away of one hydrogen atom and one neighboring carbon atom from the material:
where ∆H(C-H)graphane* - the break-down energy of C-H sp3 bond in graphane*, relevant to the breaking away of one hydrogen atom from the material; ∆H(C-C)graphane* - the break-down energy of C-C sp3 bonds in graphane*.
Hence, substituting in Eq. (13) the above noted ∆H(C-
H)graphane* value, one can evaluate the desired value of ∆H(C-
C)graphane* 4.9 eV, which coincides (within the errors) with the analogical values for perfect graphene and perfect graph-ite. The same value of ∆H(C-C) 4.9 eV can be evaluated in a similar manner, i.e., for hydrogenated (up to composition C2H) single-walled carbon nanotubes* and hydrofullerene* C60H36. Comparing of the obtained values of ∆H(C-C)graphane*, ∆H(C-C)nanotubes*, ∆H(C-C)hydrofullerene*, ∆H(C-C)graphene and ∆H(C-
C)graphite show that the elastic and intrinsic strength properties (and particularly Young’s modulus (E)) of graphane*-like nanostructures can be rather close to those for graphene. In connection with this, it is relevant to note that a unique ex-perimental value from work [48] of a Young’s modulus of graphene is Egraphene = 1.0 terapascal.
As was noted in [5], when a hydrogenated graphene membrane has no free boundaries (a rigidly fixed membrane) in the expanded regions of it, the lattice is stretched isotropi-cally by nearly 10 % (i.e., the elastic deformation degree fix.membr. 0.1) with respect to the pristine graphene. This amount of stretching ( 0.1) is close to the limit of possible elastic deformations in graphene [48], and indeed it has been observed [5] that some of their membranes rupture during hydrogenation. It is believed [5] that the stretched regions are likely to remain non-hydrogenated. They also found that instead of exhibiting random stretching, hydrogenated gra-phene membranes normally split into domain-like regions of the size of the order of 1 m, and that the annealing of such membranes led to complete recovery of the periodicy in both stretched and compressed domains [5].
By using the experimental value [5] of the degree of elas-tic deformation (fix.membr. 0.1) of the hydrogenated fixed graphene membranes, and the experimental value [5, 48] of a Young’s modulus of graphene (Egraphene = 1.0 TPa), one can evaluate (within Hooke’s law approximation) the stretching stress value (σfix.membr. (fix.membr. Egraphene) 0.1 TPa) in the expanded regions (domains or grains) of the material [5]. This analytical result in this study is consistent with the ana-lytical results of the related data considered from [15-21], relevant to the possibility of the existence of hydrogenated graphane*-like nanostructures possessing of a Young’s modulus value close to that of graphene (Egraphane* Egraphene = 1.0 TPa).
2.4. Consideration of Data on Hydrogen Desorption in the Hydrogenated Mono- and bi-layer Epitaxial Gra-phene Samples
In [5], both the graphene membrane samples considered above, and the epitaxial graphene and bi-graphene samples
on substrate SiO2 were exposed to a cold hydrogen dc plasma for 2 hours to reach the saturation in the measured characteristics. They used a low-pressure (0.1 mbar) hydro-gen-argon mixture of 10 % H2. Raman spectra for hydrogen-ated and subsequently annealed graphene membranes are rather similar to those for epitaxial graphene samples, but with some notable differences. If hydrogenated simultane-ously for 1 hour, and before reaching the saturation (a partial hydrogenation), the D peak area for a membrane was two factors greater than the area for graphene on a substrate, which indicates the formation of twice as many C-H sp3 bonds in the membrane. This result also agrees with the gen-eral expectation that atomic hydrogen attaches to both sides of the membranes. Moreover, the D peak area became up to about three times greater than the G peak area after pro-longed exposures (for 2 hours, a near-complete hydrogena-tion) of membranes to atomic hydrogen. The integrated in-tensity area of the D peak corresponding to the adsorbed hydrogen saturation concentration in the graphene mem-branes is larger by a factor of about 3 for the area of the D peak, corresponding to the hydrogen concentration in the epitaxial graphene samples. This may be related to some partial hydrogenation localized in some defected nano-regions [33-42, 49] of the epitaxial graphene samples even after the prolonged (3 hour) exposures, i.e. after reaching their near-saturation. It is expedient to note that in [5], the absolute values of the adsorbed hydrogen concentration (C0) were neither considered for the hydrogenated graphene membranes, nor for the hydrogenated epitaxial graphene samples.
According to a private communication from D.C. Elias, a near-complete desorption of hydrogen (-ΔC/C0 0.95) from a hydrogenated epitaxial graphene on a substrate SiO2 (Fig. 2A) has been achieved by annealing it in 90% Ar/10% H2 mixture at T = 573 K for 2 hours (i.e., 0.95(epitax.)573K = 7.2103 s). Hence, by using Eq. (8), one can evaluate the value of 0.63(epitax.)573K = 2.4103 s corresponding to data [5] for the epitaxial graphene samples, which is about six orders less than the evaluated value of 0.63(membr.)573K = 1.5109 s corre-sponding to data [5] for the membrane graphene samples.
Also, the changes in Raman spectra of graphene [5] caused by hydrogenation were rather similar in respect to locations of D, G, D′, 2D and (D+D′) peaks, both for the epitaxial graphene on SiO2 and for the free-standing gra-phene membrane. Hence, one can suppose that the kinetic quantities (K0 and ) for the the epitaxial graphene on SiO2 are close to those for the free-standing graphene membrane, ie., K0(epitax) = C-H(epitax.) K0(membr) = C-H(membr.) 51013 s-1. Then, by substituting in Eq. (9) the values of K = K(epitax.)573K
= 1/0.63(epitax.)573K corresponding to data [5] for the epitaxial samples and the above considered value of K0 K0(membr.), one can evaluate the desorption activation energy for the epitaxial samples [5] in question (ΔHdes.(epitax.) = ∆HC-H(epitax.) 2.0 eV). Here, the case is supposed of a non-diffusion-rate-limiting kinetics, when Eq. (9) corresponds to the Polanyi-Wigner one [14]. Certainly, these tentative thermodynamic characteristics of the hydrogenated samples [5] of epitaxial graphene on a substrate SiO2 could be unambiguosly con-firmed and/or modified by receiving and treating within Eqs. (8, 9) of the experimental data (similar to [5]) on 0.63(epitax.) at several annealing temperatures.
26 The Open Fuel Cells Journal, 2013, Volume 6 Nechaev and Veziroglu
It is now easy also to state that: 1) these analytical results are not consistent with the mass spectrometry data on ther-mal desorption of hydrogen from a specially prepared single-side graphane [5]; and 2) they cannot be described in the framework of the theoretical models and characteristics of thermal stability of single-side hydrogenated graphene [6] or graphone [9]. According to the further considerations in this study, it may be a hydrogen desorption case of a diffusion rate limiting kinetics, when K0 , and Eq. (9) does not cor-respond to the Polanyi-Wigner one [14].
By using the method [14] of treatment of thermal desorp-tion (TDS) spectra, relevant to the mass spectrometry data [5] on thermal desorption of hydrogen from a specially pre-pared single-side graphane (under heating from room tem-perature to 573 K for 6 minutes), one can obtain the follow-ing results: 1) the total integrated area of the thermal desorp-tion spectra corresponds to 210-8 g of desorbed hydrogen; 2) the TDS spectra can be approximated by three thermode-sorption (TDS) peaks (# 1 , # 2 and # 3); 3) TDS peak # 1 (30 % of the total area, Tmax#1 370 K) can be characterized by the activation energy of ETDS-peak # 1= 0.6 0.3 eV and by the per-exponential factor of the reaction rate constant K0(TDS-peak # 1) 2107 s-1; 4) TDS peak # 2 (15 % of the total area, Tmax#2 445 K) can be characterized by the activation energy ETDS-peak # 2 = 0.6 0.3 eV, and by the per-exponential factor of the reaction rate constant K0(TDS-peak # 2) 1106 s-1; and 5) TDS peak # 3 (55 % of the total area, Tmax#3 540 K) can be characterized by the activation energy ETDS-peak # 3 = 0.23 0.05 eV and by the per-exponential factor of the reaction rate constant K0(TDS-peak # 3) 2.4 s-1. These analytical results show that all three of the above noted thermal desorp-tion (TDS) processes (# 1TDS, # 2TDS and # 3TDS) may be re-lated to a hydrogen desorption case of a diffusion-rate-limiting kinetics [14], when in Eq. 9 the value of K0 (D0app.
/ L2) and the value of ΔHdes. = Qapp., where D0app is the per-exponent factor of the apparent diffusion coefficient Dapp. = D0app.exp (-Qapp./kBT), L is the characteristic diffusional size (length), and Qapp. is the apparent diffusion activation energy.
TDS process # 3TDS may be related to TDS process (or peak) I in [14, 18-21], for which the apparent diffusion acti-vation energy is Qapp.I 0.2 eV ETDS-peak # 3 and D0app.I 310-3 cm2/s. Hence, one can evaluate the quantity of LTDS-peak
# 3 (D0app.I / K0(TDS-peak # 3))1/2 3.510-3 cm, which may be
related to the linear size of the graphene specimens. Thus, TDS process # 3TDS may be related to chemisorption models “H” and/or “G” (Fig. 1) corresponding to TDS process (or peak) I in [14, 18-21].
TDS processes # 1TDS [5] and # 2TDS [5] may be related, (in some extent) to chemisorption models “H” and/or “G” (Fig. 1 [50]). Model “H” corresponds to TDS process (or peak) II in [14, 16, 18-21], for which the apparent diffusion activation energy is Qapp.II 1.2 eV that is comparatively close to ETDS-peak # 1,2. Obviously, chemisorption models “H” and/or “G” (Fig. 1) can be applied only for the defected nano-regions in the epitaxial graphene flakes [5], for in-stance, as vacancies, grain boundaries (domains), and/or tri-ple junctions (nodes) of the grain-boundary network [33-42, 49]), where the dangling carbon bonds can occur.
It is important to note that in Items 2.1-2.3 chemisorption of atomic hydrogen on graphene membranes [3-5] may be related to model “F*” [14, 16, 18-21], which is relevant to chemisorption of a single hydrogen atom on one of the car-bon atoms possessing of 3 unoccupied (by hydrogen) nearest carbons, but not two hydrogen atoms on two carbons, as seen in model “F” (Fig. 1). Model “F*” is characterized [14, 16, 18-21] by the quantity of ∆H(C-H)”F*” 2.5 eV, which coin-cides with the similar quantities of graphanes [3-5].
In work [5], the same hydrogenation procedures of the 2 hour long expositions have been applied, as well as bilayer epitaxial graphene on SiO2/Si wafer. Bilayer samples showed little change in their charge carrier mobility and a small D Raman peak, compared to the single-layer epitaxial graphene on SiO2/Si wafer exposed to the same hydrogena-tion procedures. The authors believe that higher rigidity of bilayers suppressed their rippling, thus reducing the prob-ability of hydrogen adsorption.
Fig. (1). Schematics (used in [14, 16, 18-21]) of some theoretical models (ab initio molecular orbital calculations [50]) of chemisorption of atomic hydrogen on graphite on the basal and edge planes.
On Thermodynamic Stability of Hydrogenated Graphene Layers, Relevance to the Hydrogen The Open Fuel Cells Journal, 2013, Volume 6 27
In this study, further consideration must be given to some other known experimental data that on hydrogenation and thermal stability characteristics of mono-layer, bi-layer and three-layer epitaxial graphene systems play an important role some defects found in graphene networks [33-42, 49], rele-vant to the probability of hydrogen adsorption and the per-meability of graphene networks for atomic hydrogen. The analytical results of Item 2 are presented in Table 1.
3. ANALYSIS AND COMPARISON OF RELEVANT EXPERIMENTAL DATA
3.1. Analysis of the Raman Spectroscopy Data on Ther-mal Desorption of Hydrogen from Hydrogenated Gra-phene Flakes
In [51], it is reported that the hydrogenation of single and bilayer graphene flakes by an argon-hydrogen plasma pro-duced in a reactive ion etching (RIE) system. They analyzed two cases: one where the graphene flakes were electrically insulated from the chamber electrodes by the SiO2 substrate, and the other where the flakes were in electrical contact with the source electrode (a graphene device). Electronic transport measurements in combination with Raman spectroscopy were used to link the electric mean free path to the optically
extracted defect concentration, which is related to the defect distance (Ldef.). This showed that under the chosen plasma conditions, the process does not introduce considerable dam-age to the graphene sheet, and that a rather partial hydro-genation (CH 0.05%) occurs primarily due to the hydrogen ions from the plasma, and not due to fragmentation of water adsorbates on the graphene surface by highly accelerated plasma electrons. To quantify the level of hydrogenation, they used the integrated intensity ratio (ID/IG) of Raman bands. The hydrogen coverage (CH) determined from the defect distance (Ldef.) did not exceed 0.05 %.
In [51], they also performed the heating of the hydrogen-ated single graphene flakes (on the SiO2 substrate) in a nitro-gen environment, on a hot-plate, and with temperatures rang-ing from 348 K to 548 K, each time (Δt) of 1 min. Heating results decrease the integrated intensity ratio (ID/IG) of Ra-man bands. Within a formal kinetics approach [14, 46], the averaged kinetic data for samples of 10, 20 and 40 minute exposure can be treated by using Eq. (7) transformed to a more suitable form (7′): K -((C/t)/C), where t = 60 s, C and C are determined from [51]. This resulted in finding 5 values of the reaction (desorption) rate constant (K) for 5 temperatures (T = 348, 398, 448, 498 and 548 K). Their tem-perature dependence is described by Eq. (9). Hence, the de-
28 The Open Fuel Cells Journal, 2013, Volume 6 Nechaev and Veziroglu
sired quantities have been determined (Table 2) for the de-sorption activation energy ΔH(des.) = 0.11 0.07 eV, the per-exponential factor of the reaction rate constant K0(des.) 0.15 s-1, and also the desorption time at 553 K 0.63(des.)553K 70 s.
The calculated values of ΔH(des.)[51] and K0(des.) are close (within the errors) to those for TDS process # 3 (Table 1) [5]. These two desorption processes may be related to TDS process (or peak) I in [14, 18-21], for which the apparent diffusion activation energy is Qapp.I 0.2 eV ETDS-peak #3 ΔH(des.). By taking into account the facts that the RIE expo-sure regime [51] is characterized by a form of (ID/IG) Ldef.
-2
(for (ID/IG) 2.5 and Ldef. 11 - 17 nm), and the hydrogen concentration CH 510-4 is rather small, one can suppose that the hydrogen adsorption centers in the single graphene flakes (on the SiO2 substrate) are related in some point to nanodefects (i.e., vacancies and/or triple junctions (nodes) of the grain-boundary network [33-42, 49]) of diameter ddef. const. In such a model, the quantity CH can be described sat-isfactory as:
CH nH (ddef.)2 / (Ldef.)
2 (14)
where nH const. is the number of hydrogen atoms adsorbed by a center; CH (ID/IG) Ldef.
-2. It was also found that after the Ar/H2 plasma exposure, the (ID/IG) ratio for bilayer graphene device is larger than that of the single graphene device. As noted in [51], this observation is in contradiction to the Raman ratios after exposure of gra-phene to atomic hydrogen (considered in the previous Item 2.4.) and when other defects are introduced.
3.2. Analysis of the STM and STS Data on Reversible Hydrogenation of Epitaxial Graphene and Graphite Sur-faces
In [52], the effect of hydrogenation on topography and electronic properties of graphene grown by CVD on top of a nickel surface and high oriented pyrolytical graphite (HOPG) surfaces were studied by scanning tunneling mi-croscopy (STM) and spectroscopy (STS). The surfaces were chemically modified using 40 min Ar/H2 plasma (with 3 W power) treatment. This determined that the hydrogen chemi-sorption on the surface of graphite/graphene opens on aver-age an energy bandgap of 0.4 eV around the Fermi level. Although the plasma treatment modifies the surface topogra-phy in an irreversible way, the change in the electronic prop-erties can be reversed by moderate thermal annealing (for 10 min at 553 K), and the samples can be hydrogenated again to yield a similar, but slightly reduced, semiconducting behav-ior after the second hydrogenation. The data shows that the time of desorption from both the epitaxial graphene/Ni sam-ples and HOPG samples of about 99 % of hydrogen under 553 K annealing is 0.99(des.) 553K 6102 s. Hence, by using Eq. (8), one can evaluate the quantity 0.63(des.) 553K 130 s, which is close (within the errors) to the similar quantity of 0.63(des.)553K 70 s for the epitaxial graphene flakes [51] con-sidered in the previous Item 3.1.
As noted in [53], before the plasma treatment, the gra-phene grown on nickel by CVD exhibits a Moiré pattern superimposed to the honeycomb lattice of graphene. This is due to the lattice parameter mismatch between the graphene and the nickel surfaces, and thus the characteristic of the
most of the epitaxial graphene samples. On the other hand for the hydrogenated CVD graphene, the expected structural changes are twofold [53]. First, the chemisorption of hydro-gen atoms will change the sp2 hybridization of carbon atoms to tetragonal sp3 hybridization, modifying the surface geome-try. Second, the impact of heavy Ar ions, present in the plasma, could also modify the surface by inducing geometri-cal displacement of carbon atoms (rippling graphene surface) or creating vacancies and other defects (for instance, grain or domain boundaries) [33-42, 49]. The topography image of the surface CVD graphene after the extended (40 min) plasma treatment . The nano-order-corrugation increases after the treatment, and there are brighter nano-regions (of about 1 nm in height and several nm in diameter) in which the atomic resolution is lost or strongly distorted. It was also found that these bright nano-regions present a semiconduct-ing behavior, while the rest of the surface remains conduct-ing [52, 53].
It is reasonable to assume that most of the chemisorbed hydrogen is localized into these bright nano-regions, which have a blister-like form. Moreover, it is also reasonable to assume that the monolayer (single) graphene flakes on the Ni substrate are permeable to atomic hydrogen only in these defected nano-regions. This problem has been formulated in Item 1 (Introduction). A similar model may be valid and relevant for the HOPG samples [52].
It has been found outthat when graphene is deposited on a SiO2 surface, the charged impurities presented in the gra-phene/substrate interface produce strong inhomogeneities of the electronic properties of graphene. On the other hand, it has also been shown how homogeneous graphene grown by CVD can be altered by chemical modification of its surface by the chemisoption of hydrogen. It strongly depresses the local conductance at low biases, indicating the opening of a band gap in grapheme [53, 54].
The charge inhomogeneities (defects) of epitaxial hydro-genated graphene/SiO2 samples do not show long range or-dering, and the mean spacing between them is Ldef. 20 nm [53, 54]. It is reasonable to assume that the charge inho-mogeneities (defects) are located at the interface between the SiO2 layer (300 nm thick) and the graphene flake [53, 54]. A similar quantity (Ldef. 11 - 17 nm, [51])) for the hydrogen adsorption centers in the single graphene flakes on the SiO2 substrate has been considered in Item 3.1.
3.3. Analysis of the HREELS/LEED Data on Thermal Desorption of Hydrogen from Hydrogenated Graphene on SiC Substrate
In [55], hydrogenation of deuterium-intercalated quasi-free-standing monolayer graphene on SiC(0001) was ob-tained and studied with low-energy electron diffraction (LEED) and high-resolution electron energy loss spectros-copy (HREELS). While the carbon honeycomb structure remained intact, it has shown a significant band gap opening in the hydrogenated material. Vibrational spectroscopy evi-dences for hydrogen chemisorption on the quasi-free-standing graphene has been provided and its thermal stability has been studied. Deuterium intercalation, transforming the buffer layer in quasi-free-standing monolayer graphene (de-
On Thermodynamic Stability of Hydrogenated Graphene Layers, Relevance to the Hydrogen The Open Fuel Cells Journal, 2013, Volume 6 29
noted as SiC-D/QFMLG), has been performed with a D atom exposure of 51017 cm-2 at a surface temperature of 950 K. Finally, hydrogenation up to saturation of quasi-free-standing monolayer graphene has been performed at room temperature with a H atom exposure 31015 cm-2. The latter sample has been denoted as SiC-D/QFMLG-H to stress the different isotopes used, first, to prepare quasi-free-standing monolayer graphene (the D-intercalation step), and second, to hydrogenate it.
According to a private communication from R. Bisson, the temperature indicated at each point of data [55] corre-sponds to successive temperature ramp (not linear) of 5 min-utes. Within a formal kinetics approach for the first order reactions [14, 46], one can treat the above noted points at Ti = 543 K, 611 K and 686 K, by using Eq. (8) transformed to a more suitable form (8′): Ki -(ln(C/C0i)/t), where t = 300 s, and the corresponding quantities C0i and C are determined from [55]. It resulted in finding values of the reaction (hy-drogen desorption from SiC-D/QFMLG-H samples) rate constant Ki for 3 temperatures Ti = 543, 611 and 686 K. The temperature dependence is described by Eq. (9). Hence, the desired quantities have been determined (Table 2) as the reaction (hydrogen desorption) activation energy ΔHdes.(SiC-
D/QFMLG-H) = 0.7 0.2 eV, and the per-exponential factor of the reaction rate constant K0des.(SiC-D/QFMLG-H) 9102 s-1. The obtained value of ΔHdes.(SiC-D/QFMLG-H) is close (within the errors) to the similar ones (ETDS-peak # 1 and ETDS-peak # 2) [5] for TDS processes # 1 and # 2 (Item 2.4, Table 1). But the ob-tained value K0des.(SiC-D/QFMLG-H) differs by several orders from the similar ones K0des.(TDS-peak # 1) and K0des.(TDS-peak # 2) [5] for TDS processes # 1 and # 2 (Item 2.4, Table 1). Nevertheless, these three desorption processes may be (in some extent) related to chemisorption models “H” and/or “G” (Fig. 1). Model “H” is related to TDS process II in [14, 18-21], for which the apparent diffusion activation energy is Qapp.II 1.2 eV.
In the same way, one can treat the points from data [55] at Ti = 1010, 1120 and 1200 K, which one are related to the intercalated deuterium desorption from SiC-D/QFMLG samples. This results in finding the desired quantities (Table 2): the reaction (deuterium desorption) activation energy ΔHdes.(SiC-D/QFMLG) = 2.0 0.6 eV, and the per-exponential factor of the reaction rate constant K0des.(SiC-D/QFMLG) 1106 s-
1. The authors supposed that it may be related to hydrogen chemisorbed on the silicon atoms of the SiC substrate below the graphene plane [55]. Formally, this desorption process (of a diffusion-limiting character) may be described similarly
to TDS process (peak) III in [14, 18-21], and the apparent diffusion activation energy may be close to the break-down energy of the Si-H bonds. As concluded in [55], the exact intercalation mechanism of hydrogen diffusion through the anchored graphene lattice, at a defect or at a boundary of the anchored graphene layer, remains an open question.
It is reasonable to assume that the quasi-free-standing monolayer graphene on the SiC-D substrate is permeable to atomic hydrogen (at room temperature) in some defect nano-regions (probably, in vacancies and/or triple junctions (nodes) of the grain-boundary network [33-42, 49]). It would be expedient to note that the HREELS data [55] on bending and stretching vibration C-H frequencies in SiC-D/QFMLG-H samples (153 meV (3.71013 s-1) and 331 meV (8.01013
s-1), respectively) are consistent with those considered in Section 2.2, related to the HREELS data [47] for the epi-taxial graphene.
The obtained characteristics (Table 2) of desorption processes [51, 52, 55] show that these processes may be of a diffusion-rate-controlling character [14].
3.4. Analysis of the Raman Spectroscopy Data on Ther-mal Desorption of Hydrogen from Hydrogenated Gra-phene Layers on SiO2 Substrate
In [56], graphene layers on SiO2/Si substrate have been chemically decorated by radio frequency hydrogen plasma (the power of 5-15 W, the pressure of 1 Tor) treatment for 1 min. As seen from the investigation of hydrogen coverage by Raman spectroscopy and micro-x-ray photoelectron spec-troscopy characterization demonstrates that the hydrogena-tion of a single layer graphene on SiO2/Si substrate is much less feasible than that of bilayer and multilayer graphene. Both the hydrogenation and dehydrogenation processes of the graphene layers are controlled by the corresponding en-ergy barriers, which show significant dependence on the number of layers. These results [56] on bilayer graphene/ SiO2/Si are in contradiction to the results [5] on a negligible hydrogenation of bilayer epitaxial graphene on SiO2/Si wa-fer, when obviously other defects are produced.
Within a formal kinetics approach [14, 46], the kinetic data [56] for single layer graphene samples (1LG-5W and 1LG-15W ones) can be treated. Eq. (7) is used to transform into a more suitable form (7′): K -((C/t)/C), where t = 1800 s, and C and C are determined from [56].
Table 2. Analytical results of Sections 3.1-3.3
Value/Quantityxx
Material ΔH(des.) (eV) K0(des.) ( s-1) 0.63(des.)553K (s)
Graphene flakes/SiO2 [51] 0.11 0.07 0.15 70
Graphene/Ni [52] HOPG [52]
130 130
(SiC-D/QFMLG-H) [55] 0.7 0.2 9102
(SiC-D/QFMLG) [55] 2.0 0.6 1106
30 The Open Fuel Cells Journal, 2013, Volume 6 Nechaev and Veziroglu
It results in finding for 1LG-15W samples three values of the I [56] reaction rate constant KI(1LG-15W) for three tempera-tures (T = 373, 398 and 423 K), and three values of the II [56] reaction rate constant KII(1LG-15W) for three temperatures (T = 523, 573 and 623 K). Hence, by using Eq. (9), the fol-lowing values for 1LG-15W samples have been determined (Table 3): the I reaction activation energy ΔHdes.I(1LG-15W) = 0.6 0.2 eV, the per-exponential factor of the I reaction rate constant K0des.I(1LG-15W) 2104 s-1, the II reaction activation energy ΔHdes.II[(1LG-15W) = 0.19 0.07 eV, and the per-exponential factor of the II reaction rate constant K0des.II[(1LG-
15W) 310-2 s-1. It also resulted in finding for 1LG-5W sam-ple 4 values of the I[56] reaction rate constant KI(1LG-5W) for 4 temperatures (T = 348, 373, 398 and 423 K), and 2 values of the II[56] reaction rate constant KII(1LG-5W) for 2 temperatures (T = 523 and 573 K). Therefore by using Eq. (9), one can evaluate the desired quantities for 1LG-5W specimens (Ta-ble 3): the I reaction activation energy ΔHdes.I(1LG-5W) = 0.15 0.04 eV, the per-exponential factor of the I reaction rate con-stant K0des.I[(1LG-5W) 210-2 s-1, the II reaction activation en-ergy ΔHdes.II(1LG-5W) = 0.31 0.07 eV, and the per-exponential factor of the II reaction rate constant K0des.II(1LG-
5W) 0.5 s-1.
A similar treatment of the kinetic data for bilayer gra-phene 2LG-15W samples resulted in obtaining 4 values of the II reaction rate constant KII(2LG-15W) for 4 temperatures (T = 623, 673, 723 and 773 K). Hence, by using Eq. (9), the following desired values are found (Table 3): the II reaction activation energy ΔHdes.II(2LG-15W) = 0.9 0.3 eV, the per-exponential factor of the II reaction rate constant K0des.II(2LG-
15W) 1103 s-1 [56].
A similar treatment of the kinetic data from [56] for bi-layer graphene 2LG-5W samples results in obtaining 4 val-ues for the I reaction rate constant KI(2LG-5W) for 4 tempera-tures (T = 348, 373, 398 and 423 K), and 3 values for the II reaction rate constant KII(2LG-5W) for 3 temperatures (T = 573, 623 and 673 K). Their temperature dependence is described by Eq. (9). Hence, one can evaluate the following desired values (Table 3): the I reaction activation energy ΔHdes.I[(2LG-
5W) = 0.50 0.15 eV, the per-exponential factor of the I reac-tion rate constant K0des.I(2LG-5W) 2103 s-1, the II reaction ac-tivation energy ΔHdes.II(2LG-5W) = 0.40 0.15 eV, and the per-exponential factor of the II reaction rate constant K0des.II(2LG-
5W) 1 s-1.
The obtained characteristics (Table 3) of the desorption processes I and II show that these processes may be of a dif-fusion-rate-controlling character [14].
3.5. Analysis of TDS and STM Data on HOPG Treated by Deuterium
In [57], the results are present of a scanning tunneling microscopy (STM) study of graphite (HOPG) treated by atomic deuterium, which reveals the existence of two distinct hydrogen dimer states on graphite basal planes. The density functional theory calculations allow them to identify the atomic structure of these states and to determine their re-combination and desorption pathways. As predicted, the di-rect recombination is only possible from one of the two dimer states. In conclusion, this results in an increased stabil-ity of one dimer species, and explains the puzzling double peak structure observed in temperature programmed desorp-tion (TPD) TDS - spectra for hydrogen on graphite [57].
In the present study, by using the described in [14] the method of TPD (TDS) peaks treatment (for the first order reactions), relevant to TPD (TDS) peak I [57] (65 % of the total area, TmaxI 473 K). The values have been obtained from the reaction I rate constant (KI = 1/0.63(des.)I) for several temperatures (T = 458, 482 and 496 K). Their temperature dependence is described by Eq. (9). Hence, the desired val-ues are defined as follows (Table 3): the reaction (desorp-tion) I activation energy ΔH(des.)I = 0.6 0.2 eV, and the per-exponential factor of the reaction I rate constant K0(des.)I 1.5104 s-1. In a similar way, relevant to TPD (TDS) peak II [57] (35 % of the total area, TmaxII 588 K)) [57], the values have been obtained of the reaction II rate constant (KII = 1/0.63(des.)II) for several temperatures (T = 561 and 607 K). Hence, the desired values are defined as follows (Table 3):
Table 3. Some Analytical (an.) Results of Items 3.4, 3.5, 3.6, 3.7 and 4
HOPG[57], TDS-peaks I, II 0.6 0.2 1.5104 1.0 0.3 2106
Graphene/SiC [17] 3.6 21014
HOPG[59], TDS-peaks I, II
HOPG [59], TDS-peak I
2.4 [59] (2.4 0.5)an.
(21010)an.
4.1 [59]
GNF[61,62],TDS-peaks I,II (2.4 0.5)an.
On Thermodynamic Stability of Hydrogenated Graphene Layers, Relevance to the Hydrogen The Open Fuel Cells Journal, 2013, Volume 6 31
the reaction (desorption) II activation energy ΔH(des.)II = 1.0 0.3 eV, and the per-exponential factor of the reaction II rate constant K0(des.)II 2106 s-1.
The obtained characteristics (Table 3) of the desorption processes I and II show that these processes probably are of a diffusion-rate-controlling character [14]. In a diffusion-rate-controlling case, these processes can not be described by using the Polanyi-Wigner equation (as it has been done in [57]). The observed in [57] “nano-dimer states” or “nano-protrusions” may be related to the defected nano-regions, probably, as grain (domain) boundaries [49] and/or triple and other junctions (nodes) of the grain-boundary network in the HOPG samples. Some defected nano-regions at the grain boundary network (hydrogen adsorption centers # I, mainly, the “dimer B” structures) can be related to TPD (TDS) peak I, the others (hydrogen adsorption centers # II, mainly, the “dimer A” structures) to TPD (TDS) peak II.
In STM data [57], one can imagine some grain boundary network (with the grain size of about 2-5 nm) decorated (in some nano-regions at grain boundaries) by some bright nano-protrusions. Similar “nano-protrusions” are observed and in graphene/SiC systems [17, 58].
In STM data [58], one can also imagine some grain boundary network in the hydrogenated graphene samples (with the grain size of about 2-5 nm) decorated in some nano-regions at grain boundaries, by some bright nano-protrusions [33-42, 49].
In [58], hydrogenation was studied by a beam of atomic deuterium 1012-1013 cm-2s-1 (corresponding to PD 10-4 Pa) at 1600 K, and the time of exposure of 5-90 s, for single gra-phene on SiC-substrate. The formation of graphene blisters were observed, and intercalated with hydrogen in them, simi-lar to those observed on graphite [57] and graphene/SiO2 [17].
The blisters [58] disappeared after keeping the samples in vacuum at 1073 K (~ 15 min). Hence, by using Eq. (8), one can evaluate the quantity of 0.63(des.)1073K 5 min, which co-incides (within the errors) with the similar quantity of 0.63(des.)1073K 7 min evaluated in the study for graphene/SiC samples [17] (Item 3.6, Table 3).
A nearly complete decoration of the grain boundary net-work [33-42, 49] can be imagined in STM data [17]. Also, seen in STM data [17], such decoration of the nano-regions (at the grain boundaries [33-42, 49]) has a blister-like cross-section of height of about 1.7 nm and width of 10 nm order.
According to the thermodynamic analysis presented in Item 3.7, Eq. (15), such blister-like decoration nano-regions (at the grain boundaries [33-42, 49]) may contain the interca-lated gaseous molecular hydrogen at a high pressure. It has not been taken into account in the most related studies [17, 52-54, 57-59].
3.6. Analysis of PES and ARPES Data on Dehydrogena-tion of Graphene/SiC Samples
Atomic hydrogen exposures at a pressure of PH 110-4 Pa and temperature T = 973 K on a monolayer graphene grown on the SiC(0001) surface are shown, to result in hy-
drogen intercalation [17]. This shows that the hydrogen in-tercalation induces a transformation of the monolayer gra-phene and the carbon buffer layer to bi-layer graphene with-out a buffer layer. The STM, LEED, and core-level photo-electron spectroscopy (PES) measurements reveal that hy-drogen atoms can go underneath the graphene and the carbon buffer layer. This transforms the buffer layer into a second graphene layer. Hydrogen exposure (15 min) results initially in the formation of bi-layer graphene (blister-like) islands with a height of ~ 0.17 nm and a linear size of ~ 20-40 nm, covering about 40% of the sample. With larger (additional 15 min) atomic hydrogen exposures, the islands grow in size and merge until the surface is fully covered with bi-layer graphene. A ( 3 3) R30º periodicity is observed on the bi-layer areas. Angle resolved photoelectron spectroscopy (ARPES) and energy filtred X-ray photoelectron emission microscopy (XPEEM) investigations of the electron band structure confirm that after hydrogenation the single -band characteristic of monolayer graphene is replaced by two -bands that represent bi-layer graphene. Annealing an interca-lated sample, representing bi-layer graphene, to a tempera-ture of 1123 K or higher, re-establishes the monolayer gra-phene with a buffer layer on SiC(0001).
The dehydrogenation has been performed by subse-quently annealing (for a few minutes) the hydrogenated samples at different temperatures, from 1023 to 1273 K. Af-ter each annealing step, the depletion of hydrogen has been probed by PES and ARPES.
From the data, using Eqs. (8, 9), the following tentative quantities have been determined: 0.63(des.) (at 1023 K and 1123 K), ΔH(des.) 3.6 eV and K0(des.) 21014 s-1 (Table 3). These results can be interpreted so that the model of the in-teraction of hydrogen and silicon atoms at the graphene-SiC interface result in Si-C bonds at the intercalated islands. Ob-viously, the quantities of K0(des.) and ΔH(des.) correspond to those of the Polanyi-Wigner equation [14] relevant for the Si-C bonds [17].
3.7. Analysis of TDS and STM data on HOPG treated by hydrogen
In [15], atomic hydrogen accumulation in HOPG samples and etching their surface on hydrogen thermal desorption (TD) have been studied by using a scanning tunneling mi-croscope (STM) and atomic force microscope (AFM). STM investigations revealed that the surface morphology of un-treated reference HOPG samples was found to be atomically flat (Fig. 2 (a)), with a typical periodic structure of graphite (Fig. 2 (b)). Atomic hydrogen exposure (treatment) of the reference HOPG samples (30-125 min at atomic hydrogen pressure PH 10-4 Pa and a near-room temperature ~300 K) to different atomic hydrogen doses (D), has drastically changed the initially flat HOPG surface into a rough surface, covered with nanoblisters with an average radius of 25 nm and an average height of 4 nm (Figs. 2 (c) and 2 (d)).
Thermal desorption (TD) of hydrogen has been found in heating of the HOPG samples under mass spectrometer con-trol. As shown in Fig. (3 a), with the increase of the total hydrogen doses (D) to which HOPG samples have been ex-posed, the desorbed hydrogen amounts (Q) increase and the
32 The Open Fuel Cells Journal, 2013, Volume 6 Nechaev and Veziroglu
percentage of D retained in samples (Q) approaches towards a saturation stage. After TD, no nanoblisters were visible on the HOPG surface, the graphite surface was atomically flat, and covered with some etch-pits of nearly circular shapes, one or two layers thick (Fig. (3 b)). This implies that after release of the captured hydrogen gas, the blisters become empty of hydrogen, and the HOPG surface restores to a flat surface morphology under the action of corresponding forces.
According to [15], nanoblisters found on the HOPG sur-face after atomic hydrogen exposure are simply monolayer
graphite (graphene) blisters, containing hydrogen gas in mo-lecular form (Fig. 4). As suggested, atomic hydrogen interca-lates between layers in the graphite net through holes in gra-phene hexagons, because of the small diameter of atomic hydrogen, compared to the hole’s size, and is then converted to a H2 gas form which is captured inside the graphene blis-ters, due to the relatively large kinetic diameter of hydrogen molecules. However, such interpretation is in contradiction with that noted in Item 1 (Introduction) results [8, 32], that it is almost impossible for a hydrogen atom to pass through the six-membered ring of graphene at room temperature. It is reasonable to assume that in HOPG [15] samples atomic
Fig. (2). STM images of the untreated HOPG sample [15] (under ambient conditions) taken from areas of (a) 60.8 x60.8 nm and (b) 10.9x10.9 nm (high resolution image of the square in image (a)). (c). AFM image (area of 1x1 nm) of the HOPG sample subjected to atomic hydrogen dose (D) of 1.8·1016 H0/cm2. (d) Surface height profile obtained from the AFM image reported in (c). The STM tunnel Vbias and current are 50-100 mV and 1-1.5 mA, respectively.
Fig. (3). (a) Hydrogen storage efficiency of HOPG samples [15], desorbed molecular hydrogen quantity (Q) versus dose (D) of atomic hy-drogen exposure. (b) STM image for 600x600 nm area of the HOPG sample subjected to atomic hydrogen dose of 1.8·1016 H0/cm2, followed by hydrogen thermal desorption.
On Thermodynamic Stability of Hydrogenated Graphene Layers, Relevance to the Hydrogen The Open Fuel Cells Journal, 2013, Volume 6 33
hydrogen passes into the graphite near-surface closed nano-regions (the graphene nanoblisters) through defects (perhaps, mainly through triple junctions of the grain and/or subgrain boundary network) in the surface graphene layer. It is also expedient to note that in Fig. (3 b), one can imagine some grain boundary network decorated by the etch-pits.
The average blister has a radius of 25 nm and a height 4 nm. Approximating the nanoblister to be a semi-ellipse form, results in the blister area Sb ≈ 2.0·10-11 cm2 and its vol-ume Vb ≈ 8.4·10-19 cm3. The amount of retained hydrogen in this sample becomes Q ≈ 2.8·1014 H2/cm2 and the number of hydrogen molecules captured inside the blister becomes n ≈ (Q Sb) ≈ 5.5·103 [15]. Thus, within the ideal gas approxima-tion, and accuracy of one order of the magnitude, the internal pressure of molecular hydrogen in a single nanoblister at near-room temperature (T 300 K) becomes PH2 ≈ {kB (Q Sb) T / Vb} ≈ 108 Pa. The hydrogen molecular gas density in the blisters (at T 300 K and PH2 ≈ 1·108 Pa) can be esti-mated as ≈ {(Q MH2 Sb)/Vb} ≈ 0.045 g/cm3, where MH2 is the hydrogen molecule mass. It agrees with data [60] consid-ered in [18-21], on the hydrogen (protium) isotherm of 300 K.
These results can be quantitatively described, with an accuracy of one order of magnitude, with the thermodynamic approach [44, 46], by using the condition of the thermo-elastic equilibrium for the reaction (2H(gas) → H2(gas_in_blisters)) of intercalation of atomic gas hydrogen (H(gas)) of low pres-sure (PH ) to the graphene blisters, resulting in transformation of the atomic hydrogen to molecular gas (H2(gas_in_blisters)) of a high pressure (PH2) inside the blisters, as follows [18]:
(PH2 /P0H2) ≈ (PH /P
0H)2 exp{[∆Hdis - T∆Sdis - P*H2 ∆V )] / kB
T} (15)
where P*H2 PH2 1108 Pa is related to the blister “wall” back pressure (caused by PH2) - the so called surface pressure [44], PH 110-4 Pa is the atomic hydrogen pressure corre-
sponding to the atomic flux [15], P0H2 = P0
H = 1 Pa are the standard pressures [44, 46], ∆Hdis = 4.64 eV is the experi-mental value [45] of the dissociation energy (enthalpy) of one molecule of gaseous hydrogen (at room temperatures), ∆Sdis = 11.8 kB is the dissociation entropy [45], ∆V ≈ (Sb rb / n) is the apparent volume change, rb ≈ 30 nm is the radius of curvature of nanoblisters (at the nanoblister edge, Fig. (4 b)), NA is the Avogadro number, and T ≈ 300 K. The quantity of (P*H2∆V) is related to the work of the nanoblister surface increasing with an intercalation of 1 molecule of H2.
The value of the tensile stresses σb (caused by P*H2) in the graphene nanoblister "walls" with a thickness of db and a radius of curvature rb can be evaluated from another condi-tion (equation) of the thermo-elastic equilibrium of the sys-tem in question, which is related to Eq. (15), as follows [44, 18]:
σb (P*H2 rb / 2 db) (b Eb). (16)
where b is a degree of elastic deformation of the graphene nanoblister walls, and Eb is the Young’s modulus of the gra-phene nanoblister walls. Substituting the quantities of P*H2 1108 Pa, rb 30 nm and db 0.15 nm in the first part of Eq. (16) results in the value of σb 11010 Pa.
The degree of elastic deformation of the graphene nano-blister walls, apparently reaches b[15] 0.1. Hence, with Hooke’s law of approximation, using the second part of Eq. (16), one can estimate, with the accuracy of one-two orders of the magnitude, the value of the Young’s modulus of the graphene nanoblister walls: Eb (σb/b) 0.1 TPa. It is close (within the errors) to the experimental value [48] of the Young’s modulus of graphene (Egraphene = 1.0 TPa). There-fore, it is consistent with the results of analysis in the ex-perimental value of the degree of elastic deformation (fix.membr. 0.1) of the hydrogenated fixed graphene mem-branes, and the assumed stretching stress value (σfix.membr.
Fig. (4). Model showing the hydrogen accumulation (intercalation) in HOPG, with forming blister-like nanostructures. (a) Pre-atomic hydro-gen interaction step. (b) H2, captured inside graphene blisters, after the interaction step. Sizes are not drawn exactly in scale [15].
34 The Open Fuel Cells Journal, 2013, Volume 6 Nechaev and Veziroglu
(fix.membr. Egraphene) 0.1 TPa) in the expanded regions (do-mains or grains) of the material [5].
The experimental data [15, 59] on the thermal desorption of hydrogen from graphene nanoblisters in pyrolytic graphite can be approximated by three thermodesorption (TDS) peaks, i.e., # I [59] with Tmax#I 1123 K, # II [59] with Tmax#II
1523 K, and # III [59] with Tmax#III 1273 K. But their treatment, with using the above mentioned methods [14], is difficult due to some uncertainty relating to the zero level of the desorption flux quantity. Nevertheless, TDS peak # I can be characterized by the activation desorption energy ΔH(des.)#I
= 2.4 0.5 eV, and by the per-exponential factor of the reac-tion rate constant of K0(des.)#I 21010 s-1 (Table 3). Analyses have shown that TDS peak I is related to TDS peak (process) III in [14, 18-21], for which the apparent diffusion activation energy is Qapp.III = (2.6 0.3) eV and D0app.III 310-3 cm2/s. Hence, one can obtain (with accuracy of one-two orders of the magnitude) a reasonable value of the diffusion character-
istic size of LTDS-peak#I (D0app.III / K0(des.)#I)1/2 4 nm, which is
related to the separating distance between the graphene nanoblisters or (within the errors) to the separation distance between etch-pits (Fig. 3(b)) in the HOPG specimens [15, 59]. Thus, TDS peak (process) I is related to TDS peak (process) III in [14, 18-21], which is related to model “F*” (Fig. 1) considered in Item 2.4. Model “F*” is characterized by the quantity ∆H(C-H)“F*” = (2.5 0.3) eV (Qapp.III) that coincides with the similar quantities for graphanes (Table 1).
Finally, it is reasonable to assume that the inner surfaces “walls” in the graphene nanoblisters in HOPG are hydrogen-ated, and that the graphene “walls” situation is related to some hydrogenated graphenes (Table 1). Obviously, such hydrogenation of the inner graphene surfaces in the nanoblis-ters occurs under action of the gaseous molecular hydrogen of a high pressure (PH2) intercalated into the stressed (ex-panded) hydrogenated graphene nanoblister “walls” possess-ing of a high Young’s modulus [15, 59].
Fig. (5). Isentropes (at entropies S/R = 10, 12 and 14, in units of the gas constant R) and isotherms (at T = 300 K) of molecular and atomic deuterium [60]. The symbols show the experimental data, and curves fit calculated dependences. The density (ρ) of protium was increased by a factor of two (for the scale reasons). Thickened portion of the curve is an experimental isotherm of solid form of molecular hydrogen (H2). The additional red circle corresponds to a value of the twinned density ρ 1 g/cm3 of solid H2 (at T 300 K) and a near-megabar value of the external compression pressure P 50 GPa [18].
Fig. (6). Phase diagram, adiabats, and isentropes of deuterium calculated with the equation of state: 1 and 2 are a single and a doubled adia-bat, ● – the experimental data, 3 – melting curve, thickened portion of the curve – the experimental data. The additional red circle corre-sponds to a value of temperature T 300 K and a near-megabar value of the external compression pressure P 50 GPa [18, 60].
On Thermodynamic Stability of Hydrogenated Graphene Layers, Relevance to the Hydrogen The Open Fuel Cells Journal, 2013, Volume 6 35
As considered in the next Section, a similar (to some ex-tent) situation may occur in hydrogenated graphite nanfibers (GNFs).
4. A POSSIBILITY OF INTERCALATION OF SOLID H2 INTO HYDROGENATED GRAPHITE NANOFI-BERS, RELEVANCE TO THE HYDROGEN ON-BOARD STORAGE PROBLEM
The possibility of intercalation of solid H2 into hydro-genated graphite nanofibers (considered in [18-21]) is based on the following facts:
1). According to the data from Figs. (5 and 6) (from [60]), a solid molecular hydrogen (or deuterium) of density of H2 = 0.3-0.5 g/cm3(H2)
can exist at 300 K, and an external pressure of P = 30-50 GPa.
2). As followed from the above presented results of analysis of data [15, 59] (Figs. 2-4) and Eqs. (15) and (16), the external surface pressure of P = P*H2 = 30-50 GPa at T 300 K may be provided, at the expense of the free association energy of atomic hydrogen (T∆Sdis - ∆Hdis), inside some closed hydrogenated (in gaseous atomic hydrogen with the corresponding pressure PH) graphene nanostructures possessing of a high Young’s modulus (E 1 TPa).
3). As shown in [18], the treatment of the data (Fig. 7) on hydrogenation of graphite nanofibers (GNFs) resulted in the experimental value of the hydrogen density H2 = (0.5 0.2) g(H2)/cm3(H2) (or (H2-C-system) 0.2 g(H2)/cm3(H2-C-system)) of the intercalated high-purity reversible hydrogen (17 mass.% H2) corre-sponding to the state of solid molecular hydrogen at a surface pressure of P = P*H2 50 GPa and T 300 K, according to data from Figs. (5) and (6) [60-62].
4). Substituting in Eq. (16) the quantities of P*H2 PH2 51010 Pa, b 0.1 (Fig. 7), the largest possible Young’s modulus value [48] of Eb 1012 Pa, the larg-est possible value of the tensile stresses (σb 1011 Pa) in the edge graphene “walls” (of a thickness of db and a radius of curvature of rb) of the slit-like closed nanopores of the lens shape, one can obtain the quan-tity of (rb / db) 4. It is reasonable to assume rb 20 nm; hence, a reasonable value follows of db 5 nm (Fig. 7). A similar result can be obtained, supposing the quantity of Eb 1011 Pa (as it is for the hydrogen-ated graphene nanoblisters in HOPG, Item 3.7) [15].
5). As noted in [18-21], a definite residual plastic defor-mation of the hydrogenated graphite nano-regions is observed in Fig. (7). Such plastic deformation of the nanoregins during hydrogenation of GNFs, may be accompanied with some mass transfer resulting in such thickness (db[61]) of the walls in [61].
6). As shown in [18-21], a very important role of the spillover effect [63-69] is the relevance to hydrogena-tion of GNFs [61, 62].
7). The related data presented in [70-73], and allow us reasonably to assume a break-through character of re-sults [18-21], relevant for solving of the current prob-
lem [74, 75] of the hydrogen on-board storage in fuel cell powered vehicles.
5. CONCLUSIONS
1. Consideration of some of the most cited works [3-9, 17, 25, 51-59, 62] and the least non-cited works [18-21, 61] on the thermodynamic stability of a number of hydrogenated graphene layers systems (Tables 1-3) has shown expediency of further related (mainly ex-perimental) studies for the determination of a com-plete and compatible set of thermodynamic character-istics of such systems.
2. It confirms the validility of the alternative view point of authors that their experimental graphane (a free-standing membrane) may have a more complex hy-drogen bonding than the one suggested by theory [3], and that their epitaxial graphane may be a different material, rather than the theoretical graphane [3, 5].
3. Show a thermodynamic probability of existence of hydrogenated graphenes - graphanes* [18-21] pos-sessing of a considerably higher binding (cohesive) energy, in comparison with the theoretical graphanes [3, 25].
4. It has been reasonably assumed [70-73] and (Figs. 8 and 9) a break-through character of analytical results
Fig. (7). Micrographs of hydrogenated graphite nanofibers (GNFs) after release from them (at 300 K for 10 min ) of intercalated (obviously, reversible) high-purity hydrogen (17 mass.% - the gravimetrical reversible hydrogen capacity). It occurs under a sharp decrease of the external (locking-like) pressure of H2 (from 10 MPa to 1 MPa, at 300 K) [61, 62]. The arrows in the picture indicate some of the slit-like closed nanopores of the lens shape (between hydrogenated graphite nano-regions), where the interca-lated reversible high-purity hydrogen was localized. Dehydrogena-tion of the hydrogenated graphite nano-regions, relevance to the covalent bonded “non-reversible” hydrogen in them, occurs during thermodesorption annealing at elevated temperatures. Two TDS peaks (I, II) were observed; peak I [61,62] is related to TDS peak III in [14,18-21], (Table 3). It allows us to realize a multi-cycle process of charging-discharging of the same samples, relevance to the intercalated reversible hydrogen, with the permanently hydro-genated graphite (graphene) nanoregions.
36 The Open Fuel Cells Journal, 2013, Volume 6 Nechaev and Veziroglu
[18-21] on the solid hydrogen intercalated in hydro-genated graphite nanofibers (Fig. 7), relevant for solving the current problem [74, 75] of hydrogen on-board storage in fuel cell powered vehicles.
5. A constructive open discussion and, may be, a related International project and/or cooperation on the above considered thermodynamic aspects of the hydrogen-ated graphene layer systems seems expedient, rele-
Fig. (8). It is shown [71] (in the face of known achievements) U.S. DOE targets [74], relevant to gravimetric and volumetric hydrogen on-board storage densities for 2010 (6.0 mass.% H2, 45 kg(H2)/m
3(system)) and for 2015 (9.0 mass.% H2, 81 kg(H2)/m3(system)). The addi-
tional red circle is related to the solid hydrogen intercalated into the hydrogenated graphite nanofibers (GNFs) [18-21].
Fig. (9). Shown the known data on volumetric and gravimetric energy densities for different energy carriers [70]. The additional symbol is related to the solid hydrogen intercalated into the hydrogenated GNFs [18-21].
On Thermodynamic Stability of Hydrogenated Graphene Layers, Relevance to the Hydrogen The Open Fuel Cells Journal, 2013, Volume 6 37
vant to the promotion of further developments, par-ticularly in the developing of basic grounds in thedis-cussion of a possible break-through in nanotechnol-ogy for hydrogen on-board storage [18-21].
STM = scanning tunneling mi-croscopy
STS = scanning tunneling spec-troscopy
LEED = low-energy electron dif-fraction
HREELS = high-resolution electron energy loss spectroscopy
TDS = thermal desorption spec-troscopy
TPD = temperature programmed desorption (i.e., TDS)
XPEEM = energy filtred X-ray pho-toelectron emission mi-croscopy
TEM = transmission electron microscopy
AFM = atomic force microscopy
HOPG = highly oriented pyrolytic graphite
SWCNTs = single-walled carbon nanotubes
GNFs = graphite nanofiber
SSHG = the single-side hydro-genated graphene of composition CH
Eg = the energy gap
∆Hbind.(graphane) = the binding energy of graphane, i.e., the differ-ence between the total energy of the isolated at-oms and the total energy of the compounds
∆H0f298(graphane) = ∆H1 = the standard energy of
formation of the com-pounds (CH(graphane)) from crystalline graphite and gaseous molecular hydrogen at the standard pressure and temperature conditions
∆H(C-H)graphane = -∆H2 = the break-down energy of C-H sp3 bond in grap-hane, relevant to the
breaking away of one hydrogen atom from the material
∆Hcohes.(graphene) = the cohesive (binding) energy for graphene, which characterizes the break-down energy of 1.5 C-C sp2 bond in gra-phene, and which is relevant to the breaking away of one carbon atom from the material
∆H(C-C)graphene = the break-down energy of C-C sp2 bonds in gra-phene
∆H(C-C)graphite ≈ ∆H(C-C)graphene = the break-down energy of C-C sp2 bonds in graphite
∆H(C-C)diamond = the break-down energy of C-C sp3 bonds in dia-mond
∆Hsubl.(diamond) = the diamond sublimation energy
∆Hsubl.(graphite) = the graphite sublimation energy;
0.63 = (1/K) = the time of the removal of ~ 63 % of the initial hydrogen concentration C0 (i.e., -ΔC/C0 0.63), K being the desorption rate constant
ΔHdes. = the desorption activation energy
K0 = the per-exponential (or frequency) factor of the reaction rate constant (K).
ACKNOWLEDGMENTS
The author is grateful to H.G. Xiang, M.-H. Whangbo, D.C. Elias, C. Casiraghi, A. Eckmann, N. Tombros, B.J. Van Wees, A. Castellanos-Gomez, R. Bisson, T. Yu, L. Horne-kaer and Z. Waqar for helpful discussions, valuable complet-ing and/or reading of the related parts of the present analyti-cal results.
REFERENCES
[1] Geim, A.K.; Novoselov, K.S. The rise of graphene. Nat. Ma-ter., 2007, 6 (3), 183-191.
[2] Palerno, V. Not a molecule, not a polymer, not a substrate…the many faces of graphene as a chemical platform. Chem. Commun, 2013, 49 (28), 2848-2857.
[9] Podlivaev, A.I.; Openov, L.A. On thermal stability of graphone. Semiconductors, 2011, 45 (7), 958-961.
[10] Nikitin, A.; Li, X.; Zhang, Z.; Ogasawara, H.; Dai, H.; Nilsson, A. Hydrogen storage in carbon nanotubes through the formation of stable C-H bonds. Nano Lett., 2008, 8 (1), 162-167.
[11] Nikitin, A.; Näslund, L.-A.; Zhang, Z.; Nilsson, A. C-H bond for-mation at the graphite surface studied with core level spectroscopy. Surf, Sci., 2008, 602 (14), 2575-2580.
[12] Bauschlicher, C.W. (Jr.); So, C.R. High coverages of hydrogen on (10.0), (9.0) and (5.5) carbon nanotubes. Nano Lett., 2002, 2 (4), 337-341.
[13] Pimenova, S.M.; Melkhanova, S.V.; Kolesov, V.P.; Lobach, A.S. The enthalpy of formation and C-H bond enthalpy hydrofullerene C60H36. J. Phys. Chem. B., 2002, 106 (9), 2127-2130.
[14] Nechaev, Yu. S. Carbon nanomaterials, relevance to the hydrogen storage problem. J. Nano Res., 2010, 12, 1-44.
[15] Waqar, Z. Hydrogen accumulation in graphite and etching of graphite on hydrogen desorption. J. Mater. Sci., 2007, 42 (4), 1169-1176.
[16] Nechaev, Yu.S.; Alexeeva, O.K.; Oechsner, A. Analytical review on the hydrogen multilayer intercalation in carbonaceous nanos-tructures: Relevance for development of super-adsorbents for fuel-cell-powered vehicles. J. Nanosci. Nanotechnol., 2009, 9 (6), 3949-3958.
[18] Nechaev, Yu.S. Solid hydrogen in multigraphane nanostructures. Int. Sc; J. Fundament. Appl. Phys., 2012, 1, 38-60 (in Russian).
[19] Nechaev, Yu.S. On the solid hydrogen intercalation in multilayer graphane-like nanostructures, relevance to the storage applications. J. Nano Res., 2011, 15, 75-93.
[20] Nechaev, Yu.S. On the solid hydrogen carrier intercalation in grap-hane-like regions in carbon-based nanostructures. Int. J. Hydro. Ener., 2011, 36, 9023-9031.
[21] Nechaev, Yu.S. The high-density hydrogen carrier intercalation in graphane-like nanostructures, relevance to its on-board storage in fuel-cell-powered vehicles. Open Fuel Cell J., 2011, 4, 16-29.
[22] Xiang, H.; Kan, E.; Wei, S.-H.; Whangbo, M.-H.; Yang J. “Nar-row” graphene nanoribbons made easier by partial hydrogenation. Nano Lett., 2009, 9 (12), 4025-4030.
[23] Lebegue, S.; Klintenberg, M.; Eriksson, O.; Katsnelson, M.I. Accu-rate electronic band gap of pure and functionalized graphane from GW calculations. Phys. Rev. B – Condens. Matter. Mater. Phys., 2009, 79 (24), article # 245117.
[25] Dzhurakhalov, A.A.; Peeters, F.M. Structure and energetics of hydrogen chemisorbed on a single graphene layer to produce grap-hane. Carbon, 2011, 49, 3258-3266.
[26] Ruffieux, P.; Gröning, O.; Bielmann, M.; Mauron, P.; Schlapbach, L.; Gröning, P. Hydrogen adsorption on sp2-bonded carbon: influ-ence of the local curvature. Phys. Rev. B., 2002, 66, 245416-1-8.
[27] Sha, X.; Jackson, B. First-principles study of the structural and energetic properties of H atoms on graphite (0001) surface. Surf. Sci., 2002, 496, 318-330.
[28] Sluiter, M.H.F.; Kawazoe, Y. Cluster expansion method for adsorp-tion: application to hydrogen chemisorption on graphene. Phys. Rev. B., 2003, 68, 085410-1-7.
[29] Yazyev, O.V.; Helm, L. Defect-induced magnetism in graphene. Phys. Rev. B, 2007, 75, 125408-1-5.
[48] Lee, C.; Wei, X.; Kysar, J.W.; Hone, J. Measurement of the elastic properties and intrinsic strength of monolayer graphene. Sci., 2008, 321 (5887), 385-388.
[49] Eckmann, A.; Felten, A.; Mishchenko, A.; Britnell, L.; Krupke, R.; Novoselov, K.S.; Casiraghi, C. Probing the nature of defects in graphene by Raman spectroscopy. Nano Lett., 2012, 12 (8), 3925-3930.
[50] Yang, F.H.; Yang, R.T. Ab initio molecular orbital study of adsorp-tion of atomic hydrogen on graphite: Insight into hydrogen storage in carbon nanotubes. Carbon, 2002, 40, 437-444.
[51] Wojtaszek, M.; Tombros, N.; Garreta, A.; Van Loosdrecht, P.H.M.; Van Wees, B.J. A road to hydrogenating graphene by a reactive ion etching plasma. J. Appl. Phys., 2011, 110 (6), article # 063715.
[52] Castellanos-Gomez, A.; Wojtaszek, M.; Arramel; Tombros, N.; Van Wees, B.J. Reversible hydrogenation and bandgap open-ing of graphene and graphite surfaces probed by scanning tunneling spectroscopy. Small, 2012, 8 (10), 1607-1613.
[53] Castellanos-Gomez, A.; Arramel; Wojtaszek, M.; Smit, R.H.M.; Tombros, N.; Agraït, N.; Van Wees, B.J. Rubio-Bollinger, G. Electronic inhomogeneities in graphene: the role of the substrate
On Thermodynamic Stability of Hydrogenated Graphene Layers, Relevance to the Hydrogen The Open Fuel Cells Journal, 2013, Volume 6 39
interaction and chemical doping. Boletin Grupo Español Carbón, 2012, 25, 18-22.
[54] Castellanos-Gomez, A.; Smit, R.H.M.; Agraït, N.; Rubio-Bollinger, G. Spatially resolved electronic inhomogeneities of graphene due to subsurface charges. Carbon, 2012, 50 (3), 932-938.
[55] Bocquet, F.C.; Bisson, R.; Themlin, J.-M.; Layet, J.-M.; Angot, T. Reversible hydrogenation of deuterium-intercalated quasi-free-standing graphene on SiC(0001). Phys. Rev. B – Condens. Matter. Mater. Phys., 2012, 85 (20), article # 201401.
[57] Hornekaer, L.; Šljivančanin, Ž.; Xu, W.; Otero, R.; Rauls, E.; Stensgaard, I.; Lægsgaard, E.; Hammer, B.; Besenbacher, F. Metastable structures and recombination pathways for atomic hy-drogen on the graphite (0001) surface. Phys. Rev. Lett., 2006, 96, article # 156104.
[58] Balog, R.; Jørgensen, B.; Wells, J.; Lægsgaard, E.; Hofmann, P.; Besenbacher, F.; Hornekær, L. Atomic hydrogen adsorbate structures on graphene. J. Am. Chem. Soc., 2009, 131 (25), 8744-8745.
[59] Waqar, Z.; Klusek, Z.; Denisov, E.; Kompaniets, T.; Makarenko, I.; Titkov, A.; Saleem, A. Effect of atomic hydrogen sorption and de-sorption on topography and electronic properties of pyrolytic graphite. Electrochem. Soc. Proceed., 2000, 16, 254-265.
[60] Trunin, R.F.; Urlin, V.D.; Medvedev, A.B. Dynamic compression of hydrogen isotopes at megabar pressures. Phys. Usp., 2010, 53, 605-622.
[61] Gupta, B.K.; Tiwari, R.S.; Srivastava, O.N. Studies on synthesis and hydrogenation behavior of graphitic nanofibers prepared through palladium catalyst assisted thermal cracking of acetylene. J. Alloys Compd., 2004, 381, 301-308.
[62] Park, C.; Anderson, P.E.; Chambers, A.; Tan, C.D.; Hidalgo, R.; Rodriguez, N.M. Further studies of the interaction of hydrogen with graphite nanofibers. J. Phys. Chem. B, 1999, 103, 10572-10581.
[63] Lin, Y.; Ding, F.; Yakobson, B.I. Hydrogen storage by spillver on graphene as a phase nucleation process. Phys. Rev. B – Condens. Matter. Mater. Phys., 2008, 78, article # 041402.
[64] Singh, A.K.; Ribas, M.A.; Yakobson, B.I. H-spillover through the catalist saturation: An AB initio thermodynamics study. ACS Nano, 2009, 3, 1657-1662.
[65] Wang, L.; Yang, R.T. New sorbents for hydrogen storage by hydrohen spillover – A review. Ener. Environ . Sci., 2008, 1, 268-279.
[66] Wang, L.; Yang, R.T. Hydrogen storage on carbon-based adsorbents and storage at ambient temperature by hydrogen spllover. Catal Rev – Sci. Eng., 2010, 52, 411-461.
[67] Gao, Y.; Zhao, N.; Li, J.; Liu, E.; He, C.; Shi, C. Hydrogen spillover storage on Ca-decorated graphene. Int. J. Hydro Ener., 2012, 37 (16), 11835-11841.
[68] Wang, L.; Yang, R.T. Molecular hydrogen and spiltover hydrogen storage on high surface area carbon sorbents. Carbon, 2012, 50 (9), 3134-3140.
[69] Han, S.S.; Jung, H.; Jung, D.H.; Choi, S.-H.; Park, N. Stability of hydrogenation states of graphene and conditions for hydrogen spillover. Phys. Rev. B – Condens. Matter. Mater. Phys., 2012, 85 (15), article # 155408.
[70] Zuettel, A. In Materials of Int. Hydrogen Research Showcase 2011, University of Birmingham, UK, April 13-15, 2011; http://www.uk-shec.org.uk/uk-shec/showcase/ShowcasePresentations.html (ac-cested May 15, 2011).
[71] Fruchart, D. In Materials of Int. Hydrogen Research Showcase 2011, University of Birmingham, UK, April 13-15, 2011; http://www.uk-shec.org.uk/uk-shec/showcase/ShowcasePresentations.html (accested May 15, 2011).
[72] Akuba, E. In Materials of Int. Hydrogen Research Showcase 2011, University of Birmingham, UK, April 13-15, 2011; http://www.uk-shec.org.uk/uk-shec/showcase/ShowcasePresentations.html (ac-cested May 15, 2011).
[73] Kim, J.W. In Materials of Int. Hydrogen Research Showcase 2011, University of Birmingham, UK, April 13-15, 2011; http://www.uk-shec.org.uk/uk-shec/showcase/ShowcasePresentations.html (ac-cested May 15, 2011).
[74] Satyapal, S.; Petrovic, J.; Read, C.; Thomas, G.; Ordaz, G. The U.S. Department of Energy’s national hydrogen storage project: progress towards meeting hydrogen-powered vehicle requirements. // Catal. Today, 2007, 120, 246-257. (www.eere.energy.gov/hydro-genandfuelcells).
[75] DOE targets for onboard hydrogen storage systems for light-duty vehicles, 2012. http://wwwl.eere.energy.gov/hydrogenandfuel-cells/storage/pdfs/targets_onboard_hydro_storage.pdf. (accested May 20, 2012).
Received: April 30, 2013 Revised: July 15, 2013 Accepted: July 31, 2013
This is an open access article distributed under the terms of the Creative Commons Attribution License (http://creativecommons.org/licenses/by/2.5/), which permits unrestrictive use, distribution, and reproduction in any medium, provided the original work is properly cited.


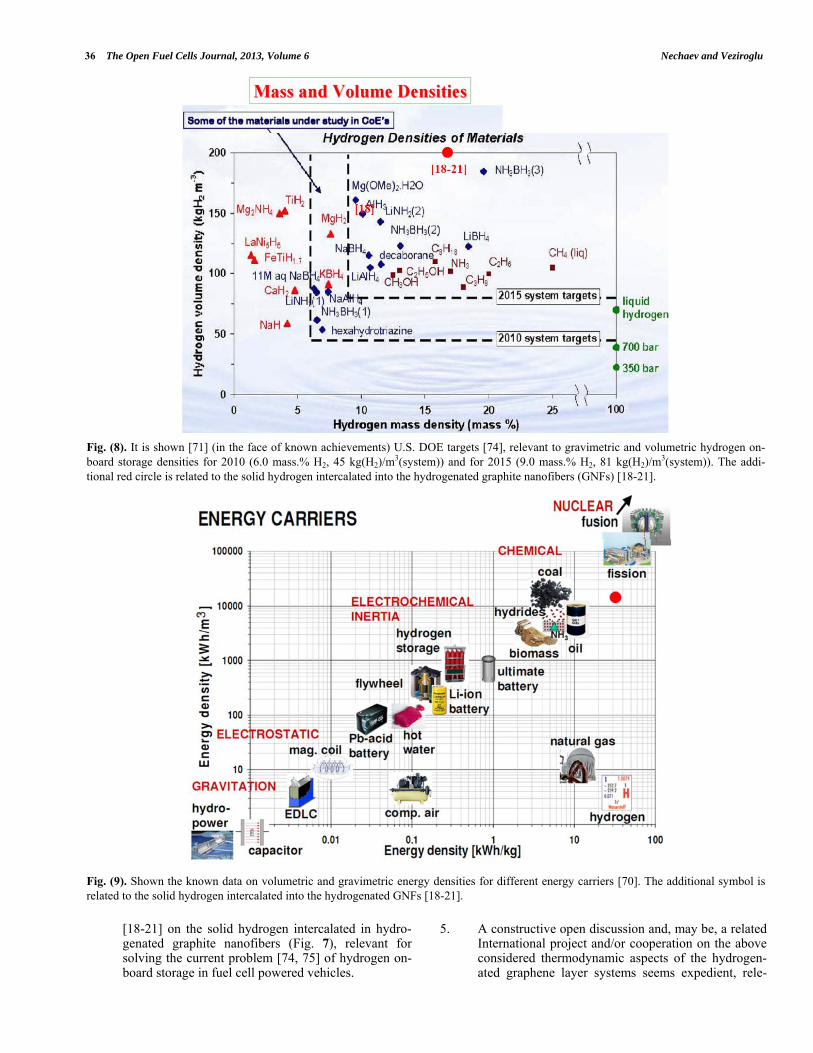
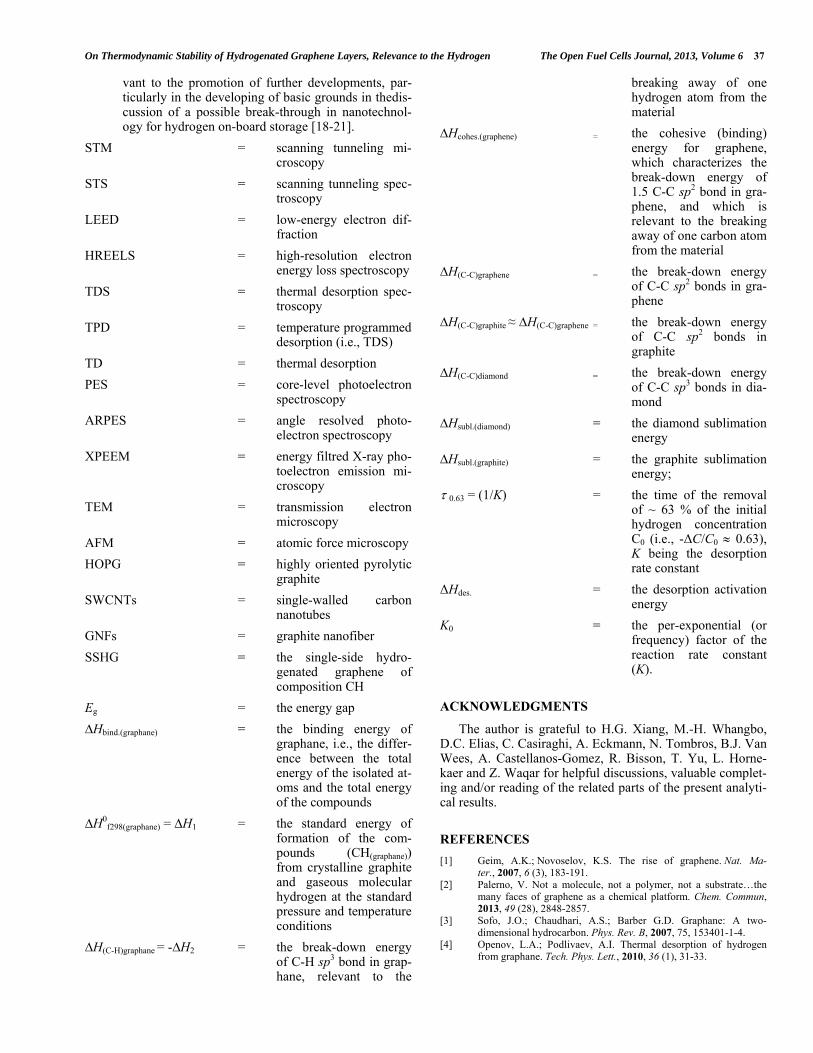


![Magnetic and Thermodynamic Properties of the …cond-mat/0001317v1 [cond-mat.dis-nn] 21 Jan 2000 Magnetic and Thermodynamic Properties of the Collective Paramagnet−Spin Liquid Pyrochlore](https://static.documents.pub/doc/80x56/5af837da7f8b9a44658c1798/magnetic-and-thermodynamic-properties-of-the-cond-mat0001317v1-cond-matdis-nn.jpg)


