70
the OREGON TALENT PLAN A Needs Assessment for Professional and Technical Occupations Developed for the Oregon Talent Council November 2015

the OREGON TALENT PLAN
A Needs Assessment for Professional and Technical Occupations
Developed for the Oregon Talent Council
November 2015
Table of Contents
EXECUTIVE SUMMARY ......................................................................................................................................... 1
INTRODUCTION ...................................................................................................................................................... 1
METHODOLOGY ...................................................................................................................................................... 7
PART I: OREGON TALENT NEEDS AND ENVIRONMENT ........................................................................... 9
OREGON’S EMPLOYMENT CHALLENGE ...................................................................................................................... 9 BUSINESS DYNAMICS THAT ARE CHANGING THE WORKPLACE ........................................................................... 10 TECHNOLOGY TRENDS INFLUENCING THE FUTURE OF INDUSTRIES .................................................................... 13 KEY OCCUPATIONAL CLUSTERS AND SKILLS .......................................................................................................... 17 CROSS-CUTTING SKILLS FOR TODAY’S AGILE WORKER ....................................................................................... 20 IMPLICATIONS & OPPORTUNITIES ......................................................................................................................... 22
PART II: INDUSTRY SECTOR REPORTS........................................................................................................ 25
TECHNOLOGY ............................................................................................................................................................ 25 ADVANCED MANUFACTURING ................................................................................................................................. 33 ENERGY TECHNOLOGIES & UTILITIES .................................................................................................................... 42 HEALTHCARE ............................................................................................................................................................ 49 BIOSCIENCE ............................................................................................................................................................... 60
GLOSSARY OF OREGON TALENT PLAN DEFINITIONS............................................................................. 67
This report was prepared by Patricia Scruggs and Beth Fitz Gibbon, Scruggs & Associates LLC Contributions to this report are included from the Oregon Employment Department, Oregon Healthcare Workforce Institute, Oregon Bioscience Association, Technology Association of Oregon, STEM Investment Council, Power Oregon, Engineering and Technology Industry Council and members of the Oregon Talent Council.
2015‐2017 Oregon Talent Plan – ADOPTED 11‐12‐2015 / rev. 01‐26‐2016

Oregon Talent Plan EXECUTIVE SUMMARY
Talent is a key driver of economic growth. Today’s desired professional and technical talent is a mix of educational credentials and applied experience that combine technical knowledge with skills such as project management, teamwork, diagnostic thinking and problem-solving capabilities. Remaining competitive means that new and experienced talent must continually learn new skills and technologies. When workers have a combination of educational credentials, applied skills and industry experience, they quickly become productive company assets. Without workers who have the right blend of skills our economy is at risk – companies grow more slowly, wages stagnate, and the best and brightest leave our communities for other opportunities. Enabling workers to gain this desired mix of education and applied experience is challenging, because the knowledge and technology base for the vast majority of professional and technical occupations is changing rapidly. In addition to the core knowledge required for each specific occupation, significant trends such as big data, cyber vigilance and the Internet of Things are changing the way we work. The information we gather, manage and analyze, regardless of industry, is a driving force for every enterprise. So too are the advances in engineering and science that result in new materials for manufacturing, smart grid systems for energy, advanced diagnostic and therapeutic devices for health care and bioscience, and smart mobile technologies. In addition, most professional and technical jobs are part of interdisciplinary teams, with consistent customer interactions requiring workers to have stronger communication and more professional interpersonal skills than ever before. Not only is our knowledge changing; the pace of transformation in the global work place is influencing how we learn. Disruptive trends, such as these, necessitate a reassessment of the systems and resources needed to effectively support our state’s talent:
Human knowledge is estimated to double every 13 months; making much of what we learn today out of date in just a few years.
Technology is automating tasks, yet also increasing the need for people to diagnose and rapidly respond to problems.
The Internet, social media and mobile apps give customers (including students and employees) more choices and influence than ever before. Students are increasingly turning to online, on demand and condensed solutions for education and skill development.
The average job tenure has decreased to 4.6 years, and younger workers change jobs about every three years.
More workers (~30-40%)1 are freelancers, self-employed or contract workers who must rely on their own resources to keep up-to-date. That trend is expected to grow.
To provide a voice and focus for these issues, the Oregon Talent Council was established by the legislature in 2015 to “advise and be a resource for state agencies and educational institutions on issues of talent development, and to promote the growth and competitiveness of Oregon’s traded sector and high growth industries.”
1 U.S. Bureau of Labor Statistics, 2012
2015‐2017 Oregon Talent Plan – ADOPTED 11‐12‐2015 / rev. 01‐26‐2016 1 | P a g e

The Oregon Talent Plan, a product of the Talent Council, has been developed in response to those challenges. The legislated purpose of the Plan is to be a resource for state agencies and education and training partners in their efforts to address Oregon’s critical gaps in professional and technical occupations. The Plan is a living document that will be continually updated to reflect changing needs. Creating Agile and Coordinated Solutions Talent is a critical issue in both good and bad economic times. Economic growth can exacerbate current job vacancies without a pipeline of qualified workers; and recessions tend to push those with marginal skills to the ranks of the unemployed. Talent is also a competitive advantage, enabling our workers and companies to grow and succeed. At the heart of traded sector and high growth industries is a core set of professional and technical occupations that are mission critical and directly influence the availability of other jobs. The combination of ever-changing knowledge, advancing technologies and fluid work environments demand more agile education and training systems. That requires greater alignment of programs among industry, education, workforce and government partners. Shorter, industry-led efforts are needed alongside longer term investments in higher education. Investments in incumbent worker training for higher skilled jobs are needed along with training that increases the skills of those with more limited education. Oregon’s professional and technical talent gaps can be classified in three ways: 1) lack of qualified applicants, 2) mismatched skills, and 3) uneven geographic distribution. Each of these requires the engagement of various organizations to create viable solutions. There are no one size fits all answers. Instead, solutions are likely to come from a combination of public and private sources. Findings of the Oregon Talent Plan suggest three key issues and opportunities:
MORE, meaning how many: Continuous and adequate higher education funding to develop the quantity of graduates and program completers needed for a healthy pipeline of professional and technical workers.
Continued state investment in STEM/CTE programs. The allocation of university and college resources to degrees and programs that align with
industry needs.
BETTER, meaning how prepared: Programs that augment degree credentials with applied skills for increased employability and have direct connections to employment opportunities.
More internships and work-based learning integrated with higher education, such as the MECOP/CECOP engineering co-op programs.
More industry-led efforts, such as the BioCatalyst and BioPro programs operated by the Oregon Bioscience Association, which help incumbent and under-employed workers gain new skills.
FASTER, meaning how quick: Scalable systems to deliver distance learning, on-demand and work-based programs that enable workers to more quickly reach needed proficiency and productivity, and that extend the geographic reach throughout the state. Examples include:
Collaborative and cross-institutional solutions such as the statewide reach of the radiology technician program operated from Linn-Benton Community College.
Apprenticeship and internship programs in a wide range of industries. Investments in IT tools such as those developed by Oregon’s OpenSesame to deliver on-
demand content for cross-cutting skills.
2015‐2017 Oregon Talent Plan – ADOPTED 11‐12‐2015 / rev. 01‐26‐2016 2 | P a g e

Occupations Key to Oregon’s Traded and High Growth Sectors The initial Oregon Talent Plan is a needs assessment that forms the foundation of the work of the Talent Council. The Plan focuses on five industry sectors2 and ten occupational clusters that provide a strong return on public investment. These occupations:
are classified as professional and technical in nature, pay at or above the state average wage, require some form of post-secondary training, have a demonstrated demand through 2022, and are identified by industry as high demand, hard-to-fill or mission critical.
The Talent Plan was developed using primary and secondary data sources from industry, government and academia. Data were analyzed for skills and occupations that cut across industries, as well as mission critical skills for specific traded and high growth industries. While each industry has additional professional and technical needs, the following represent an initial set of occupations with strong overall need. Key Professional and Technical Occupational Clusters
High growth, high demand occupations
Mission critical occupations
Emerging occupations
Significant new and replacement jobs with foreseeable demand and high growth rates that cut across industries and/or regions
Strong employment and above average projected growth; identified by industry as essential for core operations and often hard-to-fill
Relatively new and/or growing rapidly in support of multiple industries; critical to positioning the state as a leader in these skills
Systems and data specialists needed in all industries who design, connect, and manage big data systems. Data and business intelligence analysts who analyze big data to enhance operations, predict market demand, mitigate risk and control quality and standardization. Industrial machinists, millwrights and operators of highly computerized and/or automated processes requiring precision, quality control and strong diagnostic skills. Rehabilitation therapists and assistants (physical, occupational, respiratory, etc.) employed in hospitals, clinical and long-term care systems.
Technologically skilled mechanics and maintenance technicians who maintain and repair highly technical machines and equipment across industries including manufacturing, energy, healthcare and others. Mental and behavioral counselors who are a growing part of integrated health systems and who support the ability of residents to have productive lives. Interdisciplinary engineers who can integrate mechanics, electronics, and computer systems that comprise smart machines and connected devices. Primary health care practitioners including physician assistants, nurse practitioners and specialty nurses, who are at the heart of new health models, and are hard-to-fill, especially in rural areas.
Cyber and information security specialists who can develop, monitor and mitigate security risks for data and information systems. Advanced materials engineers and scientists enabling the development of products and devices that are smaller, tougher, lighter, more flexible and durable, less expensive and energy efficient.
2 Initial industries include advanced manufacturing, biosciences, energy, healthcare and information technology.
2015‐2017 Oregon Talent Plan – ADOPTED 11‐12‐2015 / rev. 01‐26‐2016 3 | P a g e
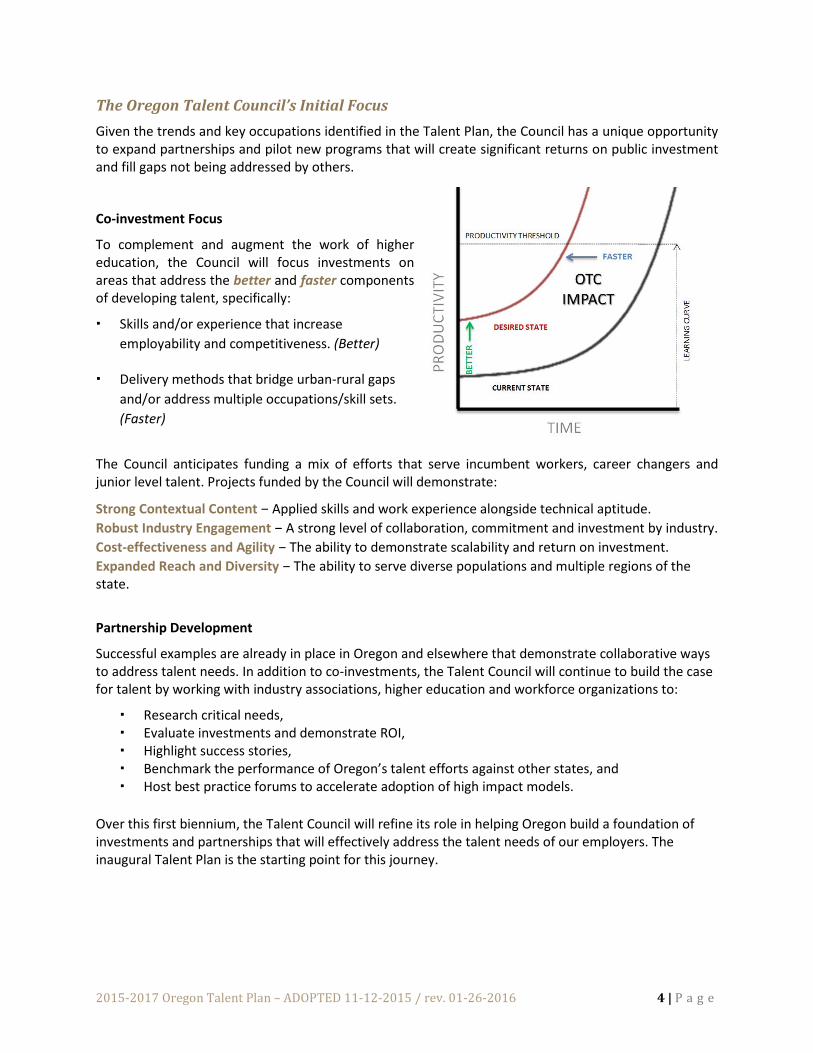
The Oregon Talent Council’s Initial Focus Given the trends and key occupations identified in the Talent Plan, the Council has a unique opportunity to expand partnerships and pilot new programs that will create significant returns on public investment and fill gaps not being addressed by others.
Co-investment Focus
To complement and augment the work of higher education, the Council will focus investments on areas that address the better and faster components of developing talent, specifically:
Skills and/or experience that increase employability and competitiveness. (Better)
Delivery methods that bridge urban-rural gaps and/or address multiple occupations/skill sets. (Faster)
The Council anticipates funding a mix of efforts that serve incumbent workers, career changers and junior level talent. Projects funded by the Council will demonstrate:
Strong Contextual Content – Applied skills and work experience alongside technical aptitude. Robust Industry Engagement – A strong level of collaboration, commitment and investment by industry. Cost-effectiveness and Agility – The ability to demonstrate scalability and return on investment. Expanded Reach and Diversity – The ability to serve diverse populations and multiple regions of the state.
Partnership Development
Successful examples are already in place in Oregon and elsewhere that demonstrate collaborative ways to address talent needs. In addition to co-investments, the Talent Council will continue to build the case for talent by working with industry associations, higher education and workforce organizations to:
Research critical needs, Evaluate investments and demonstrate ROI, Highlight success stories, Benchmark the performance of Oregon’s talent efforts against other states, and Host best practice forums to accelerate adoption of high impact models.
Over this first biennium, the Talent Council will refine its role in helping Oregon build a foundation of investments and partnerships that will effectively address the talent needs of our employers. The inaugural Talent Plan is the starting point for this journey.
2015‐2017 Oregon Talent Plan – ADOPTED 11‐12‐2015 / rev. 01‐26‐2016 4 | P a g e

INTRODUCTION The Oregon Talent Council and Oregon Talent Plan
The Oregon Talent Council (OTC) was established in 2015 by the Oregon legislature through House Bill 2728. According to the legislation, “The Oregon Talent Council shall advise and be a resource for state agencies and educational institutions on issues of talent development to promote the growth and competitiveness of Oregon’s traded sector and high growth industries.”
The Council’s mission is to help “make Oregonians the first choice of Oregon industry.” In doing so, the Council will measure success primarily by the placement and advancement of Oregon workers in Oregon jobs. This economic-based focus goes beyond graduation rates to help employers fill critical vacancies, while also enabling a strategic approach that provides stronger direct connections between education and industry.
According to the enabling legislation, the OTC is required to develop a talent plan each biennium that includes identification of talent issues and trends related to selected Oregon traded sector and high growth industries that are in strategic alignment with state and local workforce and economic priorities. The plan will also be used to guide recommendations to the Oregon Workforce Investment Board, STEM Investment Council and Higher Education Coordinating Commission on training and education enhancements aligned with identified talent issues and trends.
The Talent Plan is a needs assessment that also serves as a guide to the Oregon Talent Council in making decisions regarding investments. Funds invested by the OTC must address key talent gaps identified in the Plan, which will be further detailed in resulting requests for grant proposals. This initial plan also serves as a transition document building on what others have already identified as critical talent gaps. With limited public resources and a short time to put funds to work, this initial Plan will acknowledge and utilize the work of the Engineering and Technology Industry Council (ETIC) and industry associations, as well as reports that identified key talent gaps. This work is augmented with the latest business trends driving the need for future talent.
Defining Talent
As the concept for the Oregon Talent Council was being developed, the term talent was deliberately used to describe the qualifications of workers that go beyond just the right education credentials, and include the right skills (applied knowledge) and the right experience (contextual knowledge). This combination of education, skills and experience defines talent and will be used to guide how the Talent Council prioritizes opportunities within the Talent Plan.
Talent is dynamic. The skills, experiences and credentials that make someone marketable, especially in fast growing industries, extend well beyond that person’s initial post-secondary education. An important aspect of the Talent Plan will be to ensure that, in addition to producing a pipeline of new graduates, existing (incumbent) workers have opportunities to keep their skills current.
While key talent gaps exist at all skill and education levels, the Oregon Talent Council’s legislative mandate is to focus on professional and technical occupations critical to the competitiveness of Oregon’s traded sector and high growth industries. This mandate, along with the modest amount of investment funding provided, requires that the OTC further focus this initial Talent Plan on areas it believes will provide a strong return on investment in the short to medium term.
2015‐2017 Oregon Talent Plan – ADOPTED 11‐12‐2015 / rev. 01‐26‐2016 5 | P a g e

Therefore, the criteria for which occupations in this initial plan will be analyzed and prioritized include:
Occupations classified as professional and technical in nature, including skilled craft positions (management, sales, and other operational jobs are not covered in this initial plan)
Occupations that pay at or above the state average wage Occupations that require some form of post-secondary training Occupations that have a demonstrated demand through 2022 and have been identified by
industry as hard to fill or mission critical
Finally, for this initial Talent Plan, the OTC will focus the above criteria on five industry sectors that are of growing economic importance to the state, and/or that enable the growth or advancement of multiple industries. These are:
Advanced Manufacturing Bioscience Energy Technologies and Utilities Healthcare Information Technology
Outline of the Initial Oregon Talent Plan
Within the constraints described above, this initial Talent Plan is divided into two sections:
Section I: Oregon Talent Needs and Environment
This section provides an overview of state and national economic and workplace trends affecting where, how long, and under what conditions workers are likely to find employment. It highlights disruptive business trends that cut across national and global markets and that have a particular impact on Oregon’s high growth sectors.
This section also provides a summary of the top ten professional and technical occupational clusters that most closely align with the Oregon Talent Council’s mandate to address high growth, high demand and mission critical talent for traded sector industries. It contains highlights of applied and soft skills that employers note as critical to these and other key professional and technical occupations.
Finally, this section highlights factors that will be important to consider as the OTC and others turn the insights and information from this Plan into on-the-ground projects. It suggests opportunities for approaches that could place Oregon as a leader in talent development.
Section II: Professional and Technical Occupational Analysis by Key Industry Sectors
This section presents business and technical trends in each of the five selected OTC industries, and addresses their individual occupational requirements. The professional and technical occupation clusters chosen for analysis were derived from existing Oregon industry reports, as well as being identified as critical for meeting the disruptive trends highlighted in Section I.
2015‐2017 Oregon Talent Plan – ADOPTED 11‐12‐2015 / rev. 01‐26‐2016 6 | P a g e

METHODOLOGY The process for examining the occupations and talent requirements presented in this initial plan included researching and examining qualitative information and quantitative data that were then merged for further analysis. These findings were verified by industry representatives, including OTC members. The specific steps used to develop the plan include the following. Step I: Data & Information Synthesis
In the past several years, various industries and state agencies have conducted industry sector research that contained relevant information on talent trends and challenges. To be prudent with time and resources, over a dozen existing reports were used as a foundation for industry and occupational research. These are footnoted throughout the report and include: Current and relevant economic, industry and workforce reports that provided insights about
technology, business and workplace trends affecting occupational requirements and talent needs.
Data sets from national government sources such as the Bureau of Labor Statistics to identify national labor trends and to glean insights into how national labor force trends are influencing the future of traded sector and high growth industries.
STEP II: Industry Occupational Skills Analyses
Oregon occupational data was analyzed to determine groups of jobs that are or will have high demand, are hard to fill and may encounter significant challenges due to the need for significant replacements for retiring workers. To be consistent with information used by other state agencies, higher education and workforce experts, the Talent Plan used the latest available occupational data provided by the Oregon Employment Department. While the data is several years old, it is the most current in terms of information that can be compared or projected on a consistent basis. Therefore, trends in data were also backed by more recent qualitative industry research and surveys. STEP III: Occupational Cluster Analysis
Because titles for individual occupations can change over time, the Talent Plan grouped occupations by related skills and applications to create "occupational clusters" that could then be aligned with education and training. Current job listings were compared with projected demand to test the accuracy of needs assumptions. STEP IV: Alignment of Talent Needs Across Industries
Given resource constraints and the need to focus on Oregon’s highest priority talent requirements, further analysis was used to identify occupational needs common across all five target industries. The occupational clusters identified in Step III were evaluated based on five factors:
Level of employment (did they represent significant employment?) Demand projections (was there a clear and consistent need for new and replacement jobs?) Growth rate (were they projected to grow faster than other jobs in the state?)
2015‐2017 Oregon Talent Plan – ADOPTED 11‐12‐2015 / rev. 01‐26‐2016 7 | P a g e

Difficulty to fill (were there numerous openings compared to projected growth and were vacancies hard to fill?)
Reach (was the demand spread across multiple industry sectors or regions of the state?)
By analyzing these five factors, occupations could be classified into three major groupings. Each grouping represents a different set of characteristics and potential solution sets or optimization strategies.
High Growth, High Demand Occupations: Job clusters that have relatively high levels of current employment, high to very high growth rates, and significant demand for new and replacement jobs, are listed by employers as hard to fill, and reach across industries or regions. These can be considered as occupations where Oregon has to play catch-up. Mission Critical Occupations: Job clusters with moderate to high levels of current employment, above average growth rates, a steady projection of openings (primarily replacement jobs), and identified by employers as hard to fill and critical to operations. These can be considered as occupations at the core of the health and competitiveness of Oregon’s traded sector and high growth industries. Emerging Occupations: Job clusters with modest current employment, yet very high growth rates, with applications across the state and industries, or occupations of strategic importance in terms of developing new products and markets for traded sector companies. These can be considered as occupations where Oregon can be positioned ahead of the curve, to develop a national reputation for workforce excellence. STEP V: Implications and Opportunities
Once occupational clusters were analyzed against key criteria in Step IV, we were able to align occupational characteristics with approaches or opportunities needed to address targeted talent challenges. In this section, implementation issues such as program agility, cost-effectiveness, and impact metrics are introduced, to help the Oregon Talent Council and others understand the dynamics behind a framework for building effective solutions.
2015‐2017 Oregon Talent Plan – ADOPTED 11‐12‐2015 / rev. 01‐26‐2016 8 | P a g e
PART I: OREGON TALENT NEEDS AND ENVIRONMENT Talent is essential for the competitiveness of Oregon’s traded sector and high growth industries. Skilled, qualified workers have never been more important, given significant shifts in markets, the increased application of technology and changing business models. The new ways in which business operations are evolving have caused us to reconsider not only which occupations are important, but also what assistance workers will need to develop the skills, knowledge and experience required to support today’s companies.
Knowing what talent is core to businesses requires an understanding of the business environment in which we work; a context for why certain skills and educational credentials are important; and how talent is adapting to new workplace cultures and operations. It helps us think differently about ways to develop and maintain credentials in an era with rapidly changing needs.
Oregon’s Employment Challenge In August 2015, Oregon private sector companies employed 1,500,600 workers, an increase of 3.5% over the prior year. An estimated 680,600 jobs (45% of the total) could be found in manufacturing, information, professional and technical services, and utilities — sectors targeted in this plan. While the great recession hit Oregon hard, the state now appears to be poised for solid growth. The August 2015 economic forecast released by the Oregon Office of Economic Analysis (OEA) states that Oregon's economy continues on the upswing. Jobs are growing, and wages are on the increase.
Looking forward, OEA expects Oregon's economy will grow 3.4 percent this year, by 58,300 new jobs. They expect much of the same next year (+3.1%; 54,500 jobs). Growth will be dominated by service sector industries such as the large and diverse professional and business services sector (e.g., company headquarters, temp help, computer systems design); leisure and hospitality (e.g., restaurants, golf courses); and private health care.
The majority of this projected job growth is likely to come from small firms with fewer than 100 employees that have limited or no human resource staff and struggle with finding talent. In 2013, Oregon companies added 220,539 jobs;
94% came from companies with less than 100 employees, and only 6% from companies with more than100 employees.
Of the jobs gained, 62% were from new start-ups, 9.7% from start-up expansions (off-shoots of existing companies), 23% from expansion of existing companies and only 2.4% from recruitment efforts (or move-ins).
Of the jobs gained from expansion of existing companies, 93% of those jobs came from firms with less than 100 employees. By contrast in 2013, a total of 200,417 jobs were lost through closings, contractions and companies moving out.
Of the jobs lost, 18.6% came from companies with more than 100 employees (three times the rate for jobs gained).3
3 www.youreconomy.org
2015‐2017 Oregon Talent Plan – ADOPTED 11‐12‐2015 / rev. 01‐26‐2016 9 | P a g e

A growing economy means that qualified talent needs to be adequate and available. While the economy is growing, there were still over 117,000 unemployed workers in August 2015. Despite the number of unemployed, companies continue to state that they can’t find qualified talent. This is illustrated in the latest employer vacancy survey conducted by the Oregon Employment Department. It identified more than 53,300 vacancies statewide, the highest number recorded since the survey started in May 2008, and almost the same as the total number of new jobs expected in 2015. Relevant information from the vacancy survey indicates openings in OTC priority industries.
Industries No. of Job Vacancies (Spring 2015) Healthcare 11,157 Manufacturing 6,213 Information Services 2,269 Professional & Technical Services 1,372
Professional & Technical Occupations No. of Job Vacancies (Spring 2015) Healthcare Practitioners 3,813 Computers & IT 2,171 Architecture & Engineering 1,241 Business Operations 914
A growing economy presents a multitude of new opportunities, yet it may only exacerbate vacancies if our education and training systems are not aligned with industry needs. For professional and technical talent, vacancies tend to go unfilled because of a lack of qualified applicants (the quality of applicants), especially for jobs requiring a bachelor’s degree or higher. Employers also note they simply cannot find applicants for technician and skilled craft positions (the quantity of applicants).
Moreover, there will be future economic dips and recessions, which also present equally challenging talent development issues. Those with marginal skills are often the first to become unemployed and getting them back into the ranks of the working requires quick turnaround in bringing their skills up to speed. So resolving mismatches between talent needs and worker skills is an issue that transcends economic conditions.
Business Dynamics That Are Changing the Workplace Over the past decade, and especially in recent years, fundamental shifts in the workplace have affected our ability to educate, employ, and keep current a range of talented workers. New employer–worker relationships necessitate looking at talent development in different ways. As one business leader noted,
“How the generation of baby-boomers thinks about education and work—get a degree and then have one long career—is no longer the case. If we have moved to a dynamic, just in time model for how we deliver services or make products, why haven’t we done so for the way we develop our talent?”
The following trends highlight key shifts in business dynamics and workplace environments that may affect how the OTC and its partners address targeted talent issues.
2015‐2017 Oregon Talent Plan – ADOPTED 11‐12‐2015 / rev. 01‐26‐2016 10 | P a g e
The Growing Barbell Economy
Not long ago, medium-size firms were the fastest growing sector of our economy. Now, the economic trend in the U.S. is for employment to be concentrated in smaller and larger employers with a hollowing out of mid-size firms. Intuit’s 2020 Report4 notes that: “Today’s industries are moving to a barbell-like structure: a few global giant corporations on one end, a narrow middle consisting of mid-sized firms, and a large group of small, micro and even one-person businesses balancing on the other end.”
Trends resulting from this new economic structure include:
Global scale requirements will continue to drive industry consolidation. The average large corporation will increase revenue and, in most cases, assets.
Mid-sized businesses, the middle of the barbell, will continue to disappear, often acquired by global giants.
Small business numbers will increase, with the greatest growth found in personal and micro-businesses.
The average small business will be smaller due to agility requirements and the use of contingent workers.
The Rise of the Contingent Workforce
As small businesses begin to develop networks of contingent workers to provide greater flexibility and minimize fixed labor costs, and large companies turn to contingent workers as a way to transition to new markets and technologies, it should be no surprise that fewer workers will be classified as full-time permanent positions with a regular paycheck from a single employer. A U.S. Government Accountability Office report calculates that over 40% of the U.S. workforce is now made up of contingent workers who don’t have what were traditionally considered secure jobs.5 In 2005, contingent workers accounted for only 30.6% of the workforce. Contingent workers have alternative work arrangements that include:
Independent contractors/self-employed (16.2%) Standard part-time workers (16.2%) Contract company workers and agency temps (4.3%) On-call workers who work when needed (3.5%)
Contingent workers are not likely to receive formal training or financial support for training from employers, yet they will be required to keep up with new skills at a rate equal to or faster than their enterprise-employed counterparts.
The Shift in Job Tenure
The tenure of jobs has also changed. The Bureau of Labor Statistics reports that today’s graduates will have 10 to 14 jobs by the time they are 38 years old.6 The average job tenure is now 4.6 years and age, rather than education, is accounting for the biggest difference in tenure. According to U.S. government data on tenure7, older workers (55 or older) have job tenure of about 10 years, while younger workers 25 to 34 years of age tend to remain in a job for about three (3) years. This trend has been fairly consistent since 2004 (before, during and after the recession). It has created a new normal among
4 Inuit 2020 Report: Twenty Trends that Will Shape the Next Decade,2015 5 US Government Accountability Office, April 20, 2015 http://www.gao.gov/assets/670/669899.pdf 6 Bureau of Labor Statistics, US Government 7 http://www.bls.gov/news.release/pdf/tenure.pdf
2015‐2017 Oregon Talent Plan – ADOPTED 11‐12‐2015 / rev. 01‐26‐2016 11 | P a g e
young workers, and those hiring them, who think nothing of job-hopping, especially in rapidly changing industries. While the average tenure of the new workforce is significantly lower than a generation ago, cost and responsibilities of training and education have shifted among employers, workers and educational institutions.
Rapid Changes in Required Knowledge
Exponential increases in knowledge and ubiquitous access to information have the potential to fundamentally shift how we think about and deliver education and training. David Russell Shilling noted that by the end of World War II knowledge was doubling every 25 years.8 Today, nanotechnology knowledge is doubling every two years and clinical knowledge every 18 months. On average, human knowledge is doubling every 13 months.9 According to IBM, the build-out of the Internet of Things will lead to the doubling of knowledge every 12 hours. The rate at which technology and knowledge change means that a significant portion of information learned just a few years ago can rapidly become out of date. This will complicate how colleges and universities teach—and how four- and five-year degree programs become more modular, dynamic and responsive. This learning revolution will open new doors for educational institutions to be responsive to life-long learning and modular, stackable credentials.
Shifting Marketplace Power
Technology is not only changing the rate of new knowledge; it is changing who drives preferences. The Internet, social media and mobile apps have given customers/users much more influence on what and when something happens. An Intuit study10 predicts the Internet and connective technologies are creating a new dynamic between companies and their customers that will extend over the next 10 years. The report notes “Companies that once ‘pushed’ their product message to customers through traditional broadcasting and publishing channels are increasingly dependent on customers who evaluate products by pulling information beyond their control.” Customer-driven assessments and actions are predicted to increase even more, giving them more power in the marketplace. This trend is also happening in our education system.
The Growth of On-line Education
Given the rise in the contingent workforce, the shorter tenure of jobs, and the rate that knowledge and technology are advancing, the methods of delivering education and training are also changing. For almost a decade now, leaders in the education community have been moving toward more modular, stackable credentials11, and interdisciplinary programs that are reflective of today’s talent needs. Online degrees, certifications and courses are rapidly becoming a preferred learning channel for both workers and employers for increasing employability credentials.
In 2012, the National Center for Education Statistics conducted a survey of 5.4 million students, showing that one in four students completed at least part of their education online. Babson Survey Research Group has estimated that 6.7 million college students had taken at least one on-line course in 2012. In 2015, U.S. News evaluated over 1,200 programs, entirely or mostly taught online, offering bachelor's degrees, as well as online master's degrees in business, engineering, computer information technology, education and nursing. Their study found that many are using on-line courses to upgrade their
8 David Russell Shilling, Industry Tap, April 19, 2013 http://www.industrytap.com/knowledge-doubling-every-12-months-soon-to-be-every-12-hours/3950 9 Ibid 10 Intuit http://http-download.intuit.com/http.intuit/CMO/intuit/futureofsmallbusiness/intuit_2020_report.pdf 11 Center for Postsecondary and Economic Success: Scaling “Stackable Credentials”, Implications for Implementation and policy.
2015‐2017 Oregon Talent Plan – ADOPTED 11‐12‐2015 / rev. 01‐26‐2016 12 | P a g e
credentials; for instance, using an on-line program to move from an Associate of Science degree in Nursing (RN) to a Bachelor of Science in Nursing (BSN).
While online and distance education is an increasing preference among students, workers and employers, only about 30% of university faculty members "accept the value and legitimacy of online education."12 That may be inhibiting higher education’s more widespread use of online technologies. Institutions that are embracing online options are capturing about 50% of their students (and revenues) outside of their home state13 and building new revenue models to capture a geographically disbursed market. Others are targeting continuing education at alumni, to build on their existing relationships with graduates.
In addition to degree programs from individual universities, online courses focusing on the latest business tools, technology and industry-led certifications are increasing even faster. Universities face competition from Massive Open Online Courses known as MOOCs, and online e-learning marketplaces that aggregate courses from colleges and universities, industry groups and private for-profit training institutions. MOOCs and e-learning marketplaces dramatically lower the price of learning and make it more accessible. Two-thirds of MOOC users already have at least a Bachelor’s degree,14 indicating strong use by incumbent workers.
Technology Trends Influencing the Future of Industries Just as workplaces are rapidly evolving and the occupational learning curve is getting steeper, technology-driven change is affecting the need for new and integrated skills across industries. This section highlights four trends that industry leaders cite as disruptive and critical to the future of business and talent development for the initial five industries of the Oregon Talent Plan.
Big Data and Cybersecurity
Data is said to be the newest resource for global competitive advantage, enabling customer engagement, optimizing operations, preventing threats and fraud, and capitalizing on new sources of revenue.15 As technology has become ubiquitous for commerce and consumers, new ways of capturing, storing, transferring, and sharing data are needed across all industries. This is raising alarms about information privacy, data security, and the need for workers who understand cybersecurity technology and information ethics.
“Big data” refers to data sets so large and complex that traditional data processing applications are inadequate. A report by Ernst & Young summarizes this, stating: “Business has always wanted to derive insights from information in order to make better, smarter, real time, fact-based decisions: it is this demand for depth of knowledge that has fueled the growth of big data tools and platforms.” While 85% of companies collect and plan to use big data, only 17% say they have adequate capabilities for using it.
12 US News and World Report, 2013, http://www.usnews.com/education/online-education/articles/2013/01/08/online-course-enrollment-climbs-for-10th-straight-year 13 National Center for Education Statistics, https://nces.ed.gov/programs/digest/d14/tables/dt14_311.15.asp 14 The Economist: The Future of Universities, The Digital Degree, June 28, 2014 15 Ernst Young, Big Data Changing the Way Businesses Operate http://www.ey.com/Publication/vwLUAssets/EY_-_Big_data:_changing_the_way_businesses_operate/$FILE/EY-Insights-on-GRC-Big-data.pdf
2015‐2017 Oregon Talent Plan – ADOPTED 11‐12‐2015 / rev. 01‐26‐2016 13 | P a g e

Yet a study has shown that companies using big data have 4% more productivity and 6% more profitability than their peers.16
Big data is expected to increase the demand and skills level for an array of IT workers as new data warehousing systems and data processing platforms are introduced and adapted for industry specific applications. For instance, in healthcare the increase in big data, cyber attacks on health systems, and the move to electronic records means that Health IT jobs are projected to increase 15% to 37% by 2020—far faster than employment growth for other types of jobs.17
Cybersecurity and data privacy are critical for big data. Over the last decade, cyber breaches have gone up 780%,18 affecting both private and public sector organizations. From 2013 to 2014, cyber breaches rose 11% in the U.S. According to a 2014 study,19 when all these costs are considered, the average total cost of a U.S. data breach in 2014 was $3.5 million, 15% more than the cost in 2013. While media headlines focus on breaches at large companies, a Ponemon Institute study20 suggests that 71% of security breaches target small to medium businesses with 28,765 records stolen per data breach (at a business cost of up to $217 per record in the U.S.). It is estimated that 85% of those records contain personal information. 21
Market research firm Gartner reported global IT security spending of $71 billion in 2014, and predicted that will grow to $101 billion in 2018.22 An Ernst & Young survey23 reported that most respondents believe emerging big data technologies can play a key role in fraud prevention and detection; yet, only 7% of respondents were aware of any specific cyber technologies, and only 2% were actually using them.
The projection for cyber-savvy workers is significant. “The demand for the (cybersecurity) workforce is expected to rise to 6 million globally by 2019, with a projected shortfall of 1.5 million,” stated Michael Brown, CEO of Symantec, the world’s largest security software supplier. The Cisco 2014 Annual Security Report warns that the worldwide shortage of information security professionals is at 1 million openings already.24 A Stanford University analysis25 of data from the Bureau of Labor Statistics reports that more than 209,000 cybersecurity jobs in the U.S. are currently unfilled. Job postings are up 74% over the past five years and the demand for information security professionals is expected to grow by 53% through 2018. 26
Business Analytics and Intelligence
Translating large amounts of data into insights that drive effective decision making requires strong analytical skills. Business intelligence refers to the ability to transform data into useable knowledge that drives business planning. Business analytics focuses on developing new insights about business
16 Brynjolfsson, Hitt and Kim, “Strength in numbers: How does data-driven decision making affect firm performance?” Social Science Research Network, April 2011 17 Modern Healthcare, June 13, 2015 http://www.modernhealthcare.com/article/20150613/MAGAZINE/306139979 18 Advisen, 2015 19 http://www.ponemon.org/blog/ponemon-institute-releases-2014-cost-of-data-breach-global-analysis State of SMB Cyber Security Readiness: US Study, 20 http://cdn-ci22.actonsoftware.com/acton/cdna/2636/f-006a/0/0 21 Ernst & Young Global Forensic Data Analytics Survey, 2014, http://www.ey.com/GL/en/Services/Assurance/Fraud-Investigation---Dispute-Services/EY-Global-Forensic-Data-Analytics-Survey-2014 22 Gartner Group, http://www.gartner.com/newsroom/id/2828722 23 Global Forensic Data Analytics Survey 2014 24 Cyber Security Ventures Market report, 2015 http://cybersecurityventures.com/cybersecurity-market-report/ 25 Stanford University School of Journalism Peninsula Press Project 26 Demand to Fill Cybersecurity Jobs Booming, Peninsula Press, March 31, 2015 http://peninsulapress.com/2015/03/31/cybersecurity-jobs-growth/
2015‐2017 Oregon Talent Plan – ADOPTED 11‐12‐2015 / rev. 01‐26‐2016 14 | P a g e

performance based on statistical methods such as descriptive statistics, predictive modeling and optimization techniques for solving complex problems.27
Business analytics is growing rapidly in almost every industry sector. For instance, in healthcare it is advancing knowledge about how to optimize and customize patient treatment plans and outcomes while at the same time managing costs. In energy, it is being used to predict demand, manage production and distribute more effectively with reduced risk. In manufacturing, analytics is helping to predict market and consumer behaviors, maximize operational quality and financial performance, and optimize supply chains and transportation logistics.
The growth of business analytics has created rapidly increasing demand for workers in this field. According to a recent McKinsey Global Institute report28, the U.S. faces a shortage of 140,000 to 190,000 individuals who possess deep business analytics skills, coupled with the need for an additional 1.5 million managers with the skill set to implement the results of business analysis. This trend can be seen in both growth projections made by the Oregon Employment Department and current jobs openings at Oregon companies. For example, a recent analysis of the top energy companies in Oregon indicated more job openings for these types of analysts than for engineers and other technical specialists.
Internet of Things
The Internet of Things (IoT) is the network of devices and objects embedded with electronic sensors and software and connected through information networks that collect and exchange data.29 Already, many of our electronic devices are connected; and the projection for the future is not only more connectivity, but also for smarter networks that learn on their own. With machine-to-machine connections, remote access, and contextual data, the IoT is projected to enhance business operations, reduce risks, and help control costs in a variety of ways. Business examples include:
Manufacturing: IoT control and management of manufacturing equipment and processes is projected to enable dynamic response to product demands, improve real-time optimization of manufacturing processes and supply chain networks, enhance energy optimization, and reduce health and safety risks. Energy management at the grid level can be improved with automated and responsive information about the production and distribution of energy for areas and times of peak use. IoT devices can be integrated into home and commercial devices and communicate with the utility company to effectively balance power generation with energy usage, and allow users to remotely control and centrally manage their devices. Medical and healthcare systems: IoT devices can be used to enable more effective remote patient monitoring (blood pressure, heart implants, etc.) and provide place-based monitoring of living conditions, allowing seniors to age in place and people with disabilities to live better at home. Transportation: Logistics and systems for the physical movement of people and goods will become more efficient through fleet management, better traffic control systems and responsive road safety systems.
27 Wikipedia 28 Big Data, the New Frontier for Innovation, Competition and Productivity, March 2011 29 "Internet of Things Global Standards Initiative"
2015‐2017 Oregon Talent Plan – ADOPTED 11‐12‐2015 / rev. 01‐26‐2016 15 | P a g e
Environmental monitoring: Sensor data about air, water and soil quality conditions will enable dynamic management that improves agricultural output and reduces environmental degradation. Infrastructure: Monitoring and controlling operations of bridges, railway tracks, and on- and offshore- wind farms can alert managers, utilities and users to changes in structural conditions that compromise safety. They can also be used to schedule repair and maintenance activities in an efficient manner and coordinate tasks among various service providers.
More than 12 billion devices around the world, such as computers and smart phones, are currently connected to the Internet via sensors and actuators. Within the next 10 years that’s expected to be 50 billion or more devices.30 Proliferation of devices and applications will transform many business sectors, with 15% of companies reporting they have already implemented some Internet of Things solutions; 67% say they plan to within five years.31
A recent Internet Project survey by Pew Research reveals that 83% of the technology experts and engaged Internet users who responded agree with the notion that the Internet/Cloud of Things, including embedded and wearable computing, will have widespread and beneficial effects by 2025.32 The IoT will have a serious impact on the skills and knowledge required of engineering, materials science and other professional and technical jobs described in the industry-focused sections of this Plan.
Materials Science and Engineering
New materials will have a radical impact on the products of tomorrow in the very near future. Whether they are unmanned aerial vehicles, a mobile communications device or a prosthetic arm, strong, long-lasting, efficient new products will be made from engineered materials. New materials enable tiny, flexible, lightweight components that can withstand harsh environments, operate on low power and last a long time. Recent advances in materials science include:
low cost carbon fibers for composite manufacturing high energy density materials for batteries and fuel cells high performance materials for extreme environments functional surface technologies like new photovoltaic films that use a broader spectrum of light
Already, advanced materials are providing manufacturing, bioscience, energy and healthcare with state of the art products. Graphene, a derivative of the graphite in pencils, is one atom thick. It’s light, flexible, strong and flawless. It can be bent into any shape and won’t oxidize. It’s already being used in high quality semiconductors. It can be mixed with polymers, ceramics and metals. It’s used in coatings that prevent rust, solar cells that darken when the sun is strongest and in lithium-ion batteries. New uses include flexible solar cells, membranes for fuel cells and membranes that remove salt from water. Flexible nanotube thread is ten times stronger than steel and as conductive as copper. Electric Ink, also known as conductive ink, will advance 3D printing by enabling integration of flexible electrical circuits on 3D printed objects, allowing people to print circuit boards, antennas, solar cells and LED screens.
30 Trillions: Thriving in the Emerging Information Ecology. Lucas, Ballay and McManus. John Wiley & Sons Inc. NJ, 2012. 31 Ibid 32 Pew Research Center: Data Life in 2025, May 14. 2014 http://www.pewinternet.org/files/2014/05/PIP_Internet-of-things_0514142.pdf
2015‐2017 Oregon Talent Plan – ADOPTED 11‐12‐2015 / rev. 01‐26‐2016 16 | P a g e
Occupations in materials science run the gamut from Ph.D. scientist, to engineer, to lab technician. While their numbers are not projected to be as large as other occupations, these jobs are at the forefront of innovation and research, and can contribute to the competitiveness of multiple industries.
Key Occupational Clusters and Skills This section summarizes the professional and technical occupation clusters analyzed in the five industry reports in Section III and narrows them down to 10 occupation clusters grouped into three categories. While additional occupations were analyzed, these occupations represent those that, through a combination of key factors identified through research and supported by the Oregon Talent Council, made the list of “top 10.” As cited in the Methodology, these categories include:
High Growth, High Demand Occupations: Those with significant employment that have high demand (new and replacement job openings), high growth, numerous hard to fill vacancies, and that cut across industries and/or regions of the state.
Mission Critical Occupations: Those with more moderate employment and projected growth levels, yet they have been identified by industry as essential to core operations or competitiveness and can be extremely hard to fill.
Emerging Occupations: Those with modest employment, yet they are growing rapidly, or are projected to grow rapidly based on business and market trends and/or to position multiple Oregon industries for growth in new products and markets.
Industry reports and initial conversations with Oregon businesses cite the fact that many workers and graduates lack “applied” skills. Also included in this section is a list of these applied skills that were commonly mentioned as critical (and often missing) attributes and considered key differentiators among job applicants.
It is also important to note why some occupations did not make this list. There are a number of occupations with high growth rates or with significant employment that are important to the initial OTC industries, yet the occupational data, employers’ vacancy surveys, and other research point to a smaller gap or fewer challenges in supplying or recruiting workers for these occupations. Examples include software and web developers, electrical engineers, medical and biological scientists. These occupations remain critically important to Oregon. Section IV of this report contains information about industry specific critical skills and trends to provide a broader array of essential professional and technical occupations.
High Growth, High Demand Occupations
1. Systems and Data Specialists: More than 60% of network and computer systems positions are outside of tech companies, embedded in energy, healthcare, manufacturing, financial services, transportation and other enterprises. Knowledge of new data warehousing and information security protocols are enhancing the demand for network and system positions as well as IT based occupations that design and implement technical solutions to meet business requirements. Examples of these occupations include:
Network and Computer Systems Administrators Database Managers Systems and Network Analysts and Engineers
2015‐2017 Oregon Talent Plan – ADOPTED 11‐12‐2015 / rev. 01‐26‐2016 17 | P a g e
Computer Systems Analysts Solution Architects
2. Data and Business Intelligence Analysts: These high demand jobs merge data analytic
capabilities with business knowledge. They use enhanced data tools and business process protocols to analyze new markets and consumer behavior, control costs, mitigate risk and improve/standardize business processes. Examples of these occupations include:
Business Operations Specialists Market Research Analysts Operations Research Analysts Business Intelligence Officers Management Analysts Process Architects and Business Process Engineers
3. Industrial Machinists, Millwrights and Operators: Thanks to increased levels of automation,
operators running precision machinery and production systems are required to have acute computer, diagnostic and quality control skills. Across the state, these jobs are classified as hard to fill; the recession caused many companies to postpone hiring people to replace those who retired, and more retirements are on the immediate horizon. Examples of these occupations include:
Computer-controlled Machine Operators Numerical Tool and Process Control Programmers Machinists Power Plant Operators Millwrights
4. Rehabilitation Therapists: Therapists who provide rehabilitation services are experiencing
increased demand across clinical, hospital, home and long-term care settings. The growth is most prevalent in at-home and senior care, with critical shortages in rural areas. Increasingly, these workers are contract employees who need not only technical knowledge of their field, but also an understanding of the business models in which they work. Examples of these occupations include:
Physical Therapists and Physical Therapy Assistants Respiratory Therapists Occupational Therapists Speech Pathologists
Mission Critical Occupations
5. Technologically Skilled Mechanics and Maintenance Technicians: From the most advanced manufacturing floor, to power plants, to hospitals, people who can maintain and repair highly computerized and/or precision machinery are in high demand, yet both apprentice and journeymen level workers are in short supply. Add to that decades of fewer students going into technical-vocational fields and the result is a chronic shortage of skilled craft workers. Examples of these occupations include:
Industrial Machinery Mechanics Electrical Equipment Repairers
2015‐2017 Oregon Talent Plan – ADOPTED 11‐12‐2015 / rev. 01‐26‐2016 18 | P a g e

Precision and Medical Equipment Repairers Commercial and Industrial Electronic Equipment Repairers
6. Mental and Behavioral Counselors: Patient-centered coordinated care has increased the connections between mental and physical health services. Shortages of workers to fill these jobs are seen in all parts of Oregon, with chronic needs in rural communities. Examples of these occupations include:
Substance Abuse and Behavioral Disorder Counselors Mental Health Counselors Rehabilitation Counselors Family Therapists
7. Interdisciplinary Engineering: Smart machines and devices are driving high growth rates in interdisciplinary engineering that merge fields such as electrical, mechanical, computer and industrial engineering. A variety of manufacturing sectors, energy and utility firms, and medical devices/bioscience companies are requiring more interdisciplinary engineering skills. Examples of these occupations include:
Industrial and Systems Engineers Mechatronics Engineers (integrated electrical-mechanical-computer engineering) MEMS (microelectromechanical systems) Engineers Biomedical Engineers
8. Primary Healthcare Practitioners: New service models and health policies have driven the demand for primary care practitioners who are at the center of patient care. These shortages are especially acute in rural areas. Examples of these occupations include:
Primary Care Physicians Nurse Practitioners Specialty RNs Physician Assistants
Emerging Occupations
9. Cyber and Information Security: This job cluster incorporates the full spectrum of cybersecurity needs including the ability to assess and develop risk management plans and protocols, mitigate risk, repair breaches, and develop multi-faceted security interfaces. The rate of change within the industry and the rapid deployment of big data across industries makes this one of the fastest growing occupational categories. Examples of job titles include:
Security Analysts or Architects Cyberintelligence Analysts IT Security Consultants Information Assurance Analysts
10. Advanced Materials Engineers & Scientists: New materials are at the heart of what enables
technology advancements to be embedded in different devices. In Oregon, the application to advanced manufacturing, medical devices and energy could be significant and builds on inherent
2015‐2017 Oregon Talent Plan – ADOPTED 11‐12‐2015 / rev. 01‐26‐2016 19 | P a g e

Oregon industry assets. These occupations are key to new product development and will play an instrumental role in the Internet of Things:
Materials Engineers and Scientists Biochemical Engineers Chemists
Summary of Key Professional and Technical Talent Needs
High growth, high demand occupations
Mission critical occupations
Emerging occupations
Significant new and replacement jobs with foreseeable demand and high growth rates that cut across industries and/or regions
Strong employment and above average projected growth; identified by industry as essential for core operations and often hard-to-fill
Relatively new and/or growing rapidly in support of multiple industries; critical to positioning the state as a leader in these skills
Systems and data specialists needed in all industries who design, connect, and manage big data systems. Data and business intelligence analysts who analyze big data to enhance operations, predict market demand, mitigate risk and control quality and standardization. Industrial machinists, millwrights and operators of highly computerized and/or automated processes requiring precision, quality control and strong diagnostic skills. Rehabilitation therapists and assistants (physical, occupational, respiratory, etc.) employed in hospitals, clinical and long-term care systems.
Technologically skilled mechanics and maintenance technicians who maintain and repair highly technical machines and equipment across industries including manufacturing, energy, healthcare and others. Mental and behavioral counselors who are a growing part of integrated health systems and who support the ability of residents to have productive lives. Interdisciplinary engineers who can integrate mechanics, electronics, and computer systems that comprise smart machines and connected devices. Primary health care practitioners including physician assistants, nurse practitioners and specialty nurses, who are at the heart of new health models, and are hard-to-fill, especially in rural areas.
Cyber and information security specialists who can develop, monitor and mitigate security risks for data and information systems. Advanced materials engineers and scientists enabling the development of products and devices that are smaller, tougher, lighter, more flexible and durable, less expensive and energy efficient.
Cross-Cutting Skills for Today’s Agile Worker Valuable talent requires a blend of interdisciplinary technical aptitude, well-honed soft skills and business acumen that enriches the skill sets required for what many refer to as “T-Shaped” workers. The need for business and soft skills are typically described in very general terms, such as critical thinker, team player, and good communicator. Yet, overlaying recent industry trends with detailed job
2015‐2017 Oregon Talent Plan – ADOPTED 11‐12‐2015 / rev. 01‐26‐2016 20 | P a g e

descriptions reveals a richer picture. Following are some of the personal and professional attributes required of in-demand workers today.
Diagnostic Thinking: More and more jobs, from data analytics to mechanical technicians, require applied critical thinking skills to assess evidence, diagnose situations and choose appropriate and timely responses. This will become more critical with smart machines and the Internet of Things when workers are providing the human interface with electromechanical equipment. They must be able to very quickly assess a system and respond accordingly. Visual Communication and Learning: Today’s technologies enable huge amounts of data that require visual interpretation and communication. Workers must be able to translate complex information into useable, bite-sized chunks. CNC machines, healthcare systems, and product marketing all depend on interfaces that are graphic, interactive, and easy to use. This affects not just those designing the technology, but those using the technology. For occupations in areas such as computer science, it means being able to understand and incorporate the basics of visual design with learning styles. For business operations specialists, engineers and other professionals it means having associative thinking skills to assess and assemble information into a coherent and visual picture to communicate the results.
Cost-Benefit Thinking: Companies frequently report they want workers who have basic business knowledge and the ability to apply common sense to business practices. This “applied cost-benefit thinking” involves assessing the cost, quality, and outcome trade-offs incurred by decision making.
Project and Time Management: Working in a collaborative environment means more than just being a good team player. Businesses are looking for people who understand the fundamentals of project management, whether or not they are the team leader. Understanding how one’s role fits into the overall picture, recognizing the interdependencies of scheduling, and respecting how quality work affects outcomes, are fundamental for all players on the team. As in sports, to play a certain position well, and contribute to the team’s success, you must understand the other positions in the game.
Well-honed interpersonal skills: The greatest job increases over the past 20 years have occurred in healthcare, professional and business services, and leisure and hospitality. The occupations in these sectors are based on personal interaction, which requires empathy. At the same time, college student’s empathy skills reportedly have declined every year from 1990 to 2009.33 Fortune magazine cites a survey by the Oxford Economics research firm that found employers’ top skill priorities included “relationship building, teaming, co-creativity, brainstorming, cultural sensitivity and the ability to manage diverse employees – right-brain skills of social interaction."34 In his book, Talent Is Overrated, Geoff Colvin notes that engineers will stay in demand; but, tomorrow’s most valuable engineers, coders and programmers, “won’t be geniuses in cubicles … they’ll be those who can build relationships, brainstorm, collaborate and lead.”35 Students need to learn those skills before they graduate, as part of every course they take, along with reading, writing and ethics.
33 Fortune, August 1, 2015 34 ibid 35 Geoff Colvin, Talent is overrated: What Really Separates World-Class Performers from Everybody Else. Penguin Group, New York, NY 2008
2015‐2017 Oregon Talent Plan – ADOPTED 11‐12‐2015 / rev. 01‐26‐2016 21 | P a g e

Clearly reflected in these crosscutting skills is the need for interdisciplinary education and training in a highly applied learning environment. That includes work experience in the field to hone soft skills, as well as an understanding and appreciation of business practices. It is clear from the research for this plan, that companies will increasingly seek graduates with strong blended and applied skills.
Implications & Opportunities Investing in Oregon talent is essential to the economic stability of our state and the economic wellbeing of all Oregonians. Today’s lean business models mean companies have fewer resources for training; new graduates no longer have the luxury of long learning curves; and existing workers must retool their skills to remain employable. It is critical that talent is able to hit the ground running – to quickly come up to speed and become a productive asset. Employers are seeking workers with significant contextual and applied skills who can learn quickly. Add to this, rapid changes in knowledge and technologies and it becomes more difficult to rely on static or one-dimensional education and training models. If Oregon is to be known as the state with competitive, on-demand talent, then several conditions must exist:
Graduates and completers of education and training programs must have strong, employable skills and experience.
Incumbent workers must have greater access to cost-effective, just in time training and skill development.
Industry must be able to more easily access the talent they need. A Framework for Investment
The Oregon Talent Council has a unique opportunity to expand partnerships and pilot new programs that will create significant returns on public investments and help employers find the right talent at the right time. Reaching these desired outcomes will require policies and programs that:
Provide a Competitive Product: education and training efforts that turn knowledge into employable skills through applied contextual learning and hands-on work experience.
Increase Value and ROI: education and training programs with agile, cost-effective delivery modalities that accelerate successful completion and can scale quickly.
Enhance Customer Usability: making it easier for companies to connect to education and training resources, industry groups to more easily convey needs and opportunities, and workers to find and access programs.
Providing a competitive product implies that education and training programs not only incorporate the desired skills that industry is seeking; they also must address the ratio or relative balance of those skills. What research and industry input reveals is that more emphasis needs to be placed on cross-cutting applied and critical thinking skills such as those outlined earlier in this plan. The importance of graduates having work experience is driven not only by the benefit of honing technical skills, but also by building the soft skills and team-based aptitude students gain through exposure to the workplace. Increasing the value and ROI of programs addressing talent needs requires rethinking and refining how we provide programs to develop a robust delivery infrastructure. Oregon’s professional and technical talent gaps can be classified in three ways: 1) lack of qualified applicants, 2) mismatched skills, and 3) uneven geographic distribution. Each of these requires the engagement of various organizations to create viable solutions. There are no one size fits all answers. Instead, solutions are likely to come from a combination of public and private sources.
2015‐2017 Oregon Talent Plan – ADOPTED 11‐12‐2015 / rev. 01‐26‐2016 22 | P a g e
Findings of the Talent Plan suggest three key issues and opportunities:
MORE, meaning how many: Continuous and adequate higher education funding to develop the quantity of graduates and program completers needed for a healthy pipeline of professional and technical workers.
Continued state investment in STEM/CTE programs. The allocation of university and college resources to degrees and programs that align with
industry needs.
BETTER, meaning how prepared: Programs that augment degree credentials with applied skills for increased employability and have direct connections to employment opportunities.
More internships and work-based learning integrated with higher education, such as the MECOP/CECOP engineering co-op programs.
More industry-led efforts, such as the BioCatalyst and BioPro programs operated by the Oregon Bioscience Association, which help incumbent and under-employed workers gain new skills.
FASTER, meaning how quick: Scalable systems to deliver distance learning, on-demand and work-based programs that enable workers to more quickly reach needed proficiency and productivity, and that extend the geographic reach throughout the state.
Collaborative and cross-institutional solutions such as the statewide reach of the radiology technician program operated from Linn-Benton Community College.
Apprenticeship programs in industries a wide range of industries. Investments in IT tools such as those developed by Oregon’s OpenSesame and used by
workforce efforts to deliver on-demand content for cross-cutting skills.
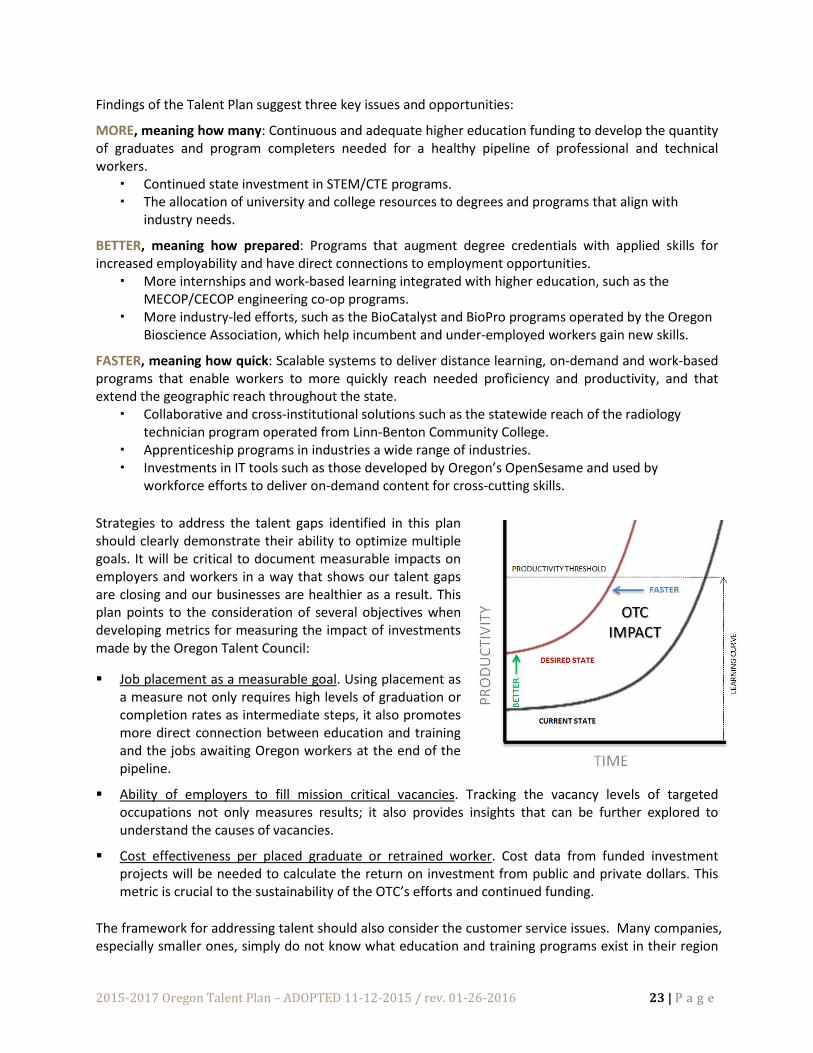
Strategies to address the talent gaps identified in this plan should clearly demonstrate their ability to optimize multiple goals. It will be critical to document measurable impacts on employers and workers in a way that shows our talent gaps are closing and our businesses are healthier as a result. This plan points to the consideration of several objectives when developing metrics for measuring the impact of investments made by the Oregon Talent Council:
Job placement as a measurable goal. Using placement as a measure not only requires high levels of graduation or completion rates as intermediate steps, it also promotes more direct connection between education and training and the jobs awaiting Oregon workers at the end of the pipeline.
Ability of employers to fill mission critical vacancies. Tracking the vacancy levels of targeted occupations not only measures results; it also provides insights that can be further explored to understand the causes of vacancies.
Cost effectiveness per placed graduate or retrained worker. Cost data from funded investment projects will be needed to calculate the return on investment from public and private dollars. This metric is crucial to the sustainability of the OTC’s efforts and continued funding.
The framework for addressing talent should also consider the customer service issues. Many companies, especially smaller ones, simply do not know what education and training programs exist in their region
2015‐2017 Oregon Talent Plan – ADOPTED 11‐12‐2015 / rev. 01‐26‐2016 23 | P a g e

or state. Enhancing customer usability makes it easier for companies to connect to education and training resources, for industry groups to more easily convey needs and opportunities, and for workers to find and access programs. We must also improve the customer service aspects by: Making it easier for businesses to know which colleges and universities have programs that best
align with their needs, and quickly find the right person at the institution who can assist them. Coordinating the input sought by education and training organizations – enabling industry to
communicate its needs in a timely, efficient manner. Enhancing the usability of training programs for incumbent and contingent workers that allow
them to more easily balance desired training with their work schedules.
Moving Forward
Oregon has extensive and immediate talent needs, and time is not on our side. With limited funds OTC investments need to respond to market demands in the near term. The number of vacancies for priority occupations and the high percent requiring experience means that incumbent worker training for professional and technical talent is a critical component along with longer-term education programs. To target companies that are adding new talent to their payroll, OTC needs to reach smaller firms that are the job creation engine of the state. While these smaller companies may each have a limited number of openings, their combined numbers and potential growth rates should compel the Talent Council to find ways to better serve them. Closely engaging industry associations and business groups will help aggregate demand to more effectively serve an array of company sizes.
Making advancements for both large and small companies necessitates building on already successful programs in Oregon and using national best practices to jumpstart efforts. Examples of programs that fit the profile of the desired outcomes described in this plan include efforts that:
Utilize industry professionals to co-create and co-teach programs that can retool graduates, contingent, and underemployed workers for high demand jobs in a variety of industries.
Expand work-based models (e.g. apprenticeships) that integrate work experience alongside education in a cost-effective manner.
Provide students with early and multiple exposures to industries through job shadowing, capstone industry projects, and internships to ensure “fit,” and to increase the likelihood that students complete their educational pursuit with realistic expectations for their careers.
Utilize multi-modal education and training delivery infrastructure that can be applied across multiple degree and training programs and reach rural as well as urban areas.
Standardize and share content for priority occupations that can be delivered through multiple institutions and educational channels.
Oregon’s economic future is only as strong as our talent. Making the significant changes required to optimize our strengths today and maximize our opportunities tomorrow requires the combined commitment of state-wide partners united in their determination to achieve success. Collaborative efforts among business, public and private higher education institutions, state agencies and workforce organizations can create laser-focused initiatives that produce dynamic results in the short term, and achieve strategic goals for the long term.
2015‐2017 Oregon Talent Plan – ADOPTED 11‐12‐2015 / rev. 01‐26‐2016 24 | P a g e

PART II: INDUSTRY SECTOR REPORTS
Technology Every company today, from multinational corporations to small local businesses, relies on technology. Faster processing speed, greater storage capacity, bigger data sets and more advanced software are transforming business products, services and operations. New combinations of computing and networking capabilities with sensing, monitoring, and transmitting devices are creating smart products in an array of markets. This automation of knowledge is quickly creating36:
New tools for better operating efficiency New ways to touch customers New methods for collaborating with partners and suppliers In many ways, technology is an enabling platform for all industries rather than a distinct market sector; and Oregon’s technology assets cut across an array of industries. This section highlights technology occupations in Information Technology (IT) and computer hardware and systems, as well as product engineering that support traditional technology industries. These positions are increasingly employed in industries such as healthcare, finance, manufacturing, and natural resources. For example, in the last ten years, IT related activities accounted for over one third of U.S. productivity gains while only employing 2.5% of the workforce.37
In Oregon, the leading industry sectors with technology-centric workforces include both services and manufacturing. A few of these examples include:
Table T-1: Highlights of Technology-Centric Industry Sectors in Oregon
Industry Establishments Employment Wages Computer and electronics product mfg. 337 37,009 $64,284 Computer systems design and services 2,620 14,619 $152,452 Software 733 10,301 $52,428 Media production 525 3,968 $103,788 ISPs & data processing 306 3,728 $96,816 Medical equipment and supplies mfg. 232 3,656 $76,140 Technical consulting services 1,368 3,569 $49,528 Physical/Engineering/Biological research 347 3,397 $38,456 Electronic equipment mfg. 96 2,471 $59,828 Design services 542 2,125 $99,136 Other information services 327 1,192 $72,196
36 Gartner Research, September 2015 37 Brookings Institute, America’s Advanced Industries: What they Are and Why They Matter. February 2015.
2015‐2017 Oregon Talent Plan – ADOPTED 11‐12‐2015 / rev. 01‐26‐2016 25 | P a g e

Industry Trends Affecting the Supply and Demand of Technology Workers
The Oregon technology sector and the application of technology to other industries are being driven by global and national trends. Some of the key trends cited by industry leaders include:38
Mobile commerce. With mobile devices acting as pocket-sized supercomputers, more companies in an array of industries are developing mobile ways to generate revenue and conduct business. As Eric Schmidt of Google stated, "If you don't have a mobile strategy, you don't have a future strategy."39 More companies are learning how to mobilize their revenue-generating processes. The retail and banking sectors led this charge, and the trend will continue to expand into other industries as smartphones and tablets replace PCs as the primary personal computing device. This is creating demand for workers with mobile expertise inside large companies and in companies that offer mobile strategies as a service.
Cloud-based business operations. Cloud computing provides infrastructure to businesses that can reduce overhead costs by relying on software as a service providing low-cost, on-demand, scalable capacity for data storage and retrieval.40 Skills such as agile programming and continuous delivery are highly sought after, along with software-defined security. 41
Context-aware computing. This style of computing takes situational and environmental information about people, places and things and uses it to anticipate immediate needs and proactively offer situation-aware and usable content. Benjamin Robbins, co-founder of Palador, predicts that context-aware apps will be one of the biggest technology trends over the next few years with, “huge implications for both consumers and enterprise users. For consumers, apps and services will be tailored to meet needs in the moment; for instance, a mobile concierge service that provides spot-on recommendations based on your past behaviors. For businesses, this means better coordination within teams and their clients by surfacing information that makes sense in the moment.”42
Smart Machines. The Internet of Things will drive the development of more “smart” machines that can learn and respond accordingly, using embedded artificial intelligence and smart materials that can react to their environment. Sensing hardware that uses artificial intelligence software and flexible electronics will enable technology to be embedded in many objects. This will strengthen the demand for materials scientists and engineers, mechatronics engineers (combining mechanical, electrical and computer engineering skills) and engineers who work with devices powered by light instead of electricity. Computer scientists with knowledge of artificial intelligence will also be in demand.
3D printing. Also known as additive manufacturing, it is getting cheaper, and production is predicted to grow significantly over the next three years. It’s used most extensively in scale model production, prototyping, art and fashion. Lower costs for desktop printers are expanding in-home use for hobbies and do-it-yourself projects. 43 Expansion is expected to be biggest in industrial, biomedical, and consumer applications. As the industry evolves, companies are having trouble finding the right people to fill job openings; job postings increased by 103% in 2014. 3D skills include industrial and commercial design, software development, engineering and manufacturing.
38 Ibid 39 Wired magazine, October 3, 2013 40 2015 State of the Cloud Report, RightScale 2015 41 Information Week, 9 Cloud Trends for 2015 42 Five Highlights to Come at the Mobile 2015 World Congress. The Guardian, March 2015 43 3D Hub Trend Report, September 2015
2015‐2017 Oregon Talent Plan – ADOPTED 11‐12‐2015 / rev. 01‐26‐2016 26 | P a g e
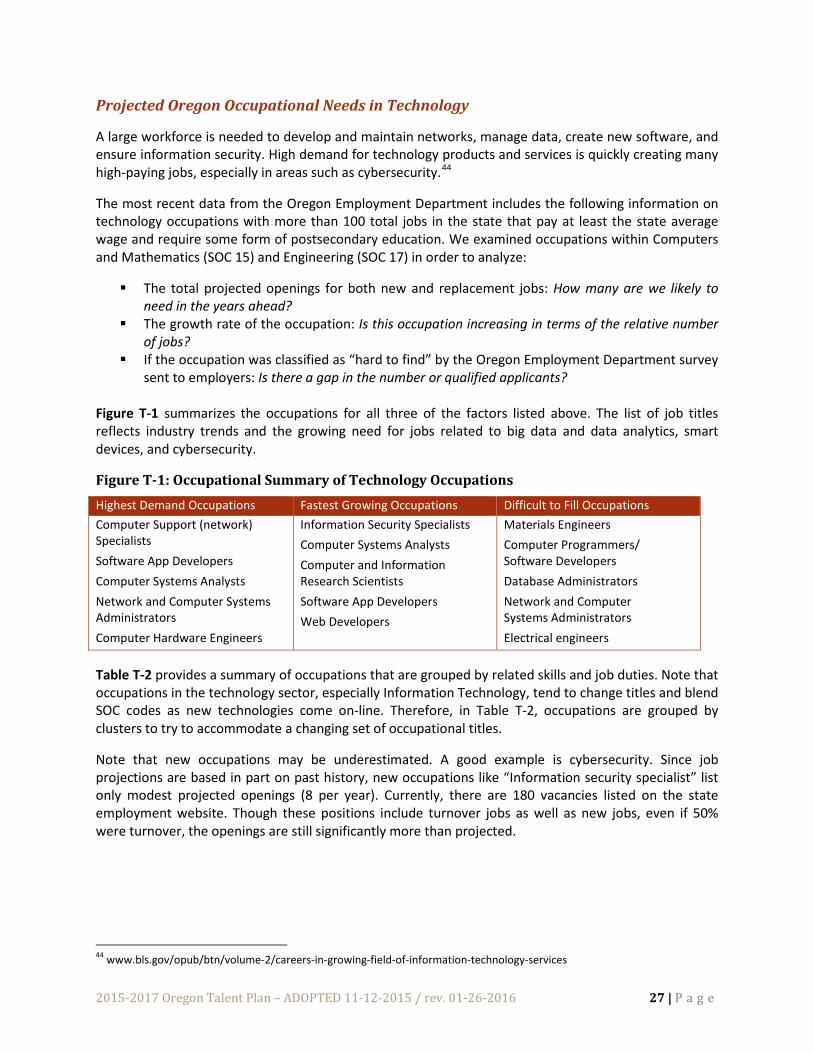
Projected Oregon Occupational Needs in Technology
A large workforce is needed to develop and maintain networks, manage data, create new software, and ensure information security. High demand for technology products and services is quickly creating many high-paying jobs, especially in areas such as cybersecurity.44
The most recent data from the Oregon Employment Department includes the following information on technology occupations with more than 100 total jobs in the state that pay at least the state average wage and require some form of postsecondary education. We examined occupations within Computers and Mathematics (SOC 15) and Engineering (SOC 17) in order to analyze:
The total projected openings for both new and replacement jobs: How many are we likely to need in the years ahead?
The growth rate of the occupation: Is this occupation increasing in terms of the relative number of jobs?
If the occupation was classified as “hard to find” by the Oregon Employment Department survey sent to employers: Is there a gap in the number or qualified applicants?
Figure T-1 summarizes the occupations for all three of the factors listed above. The list of job titles reflects industry trends and the growing need for jobs related to big data and data analytics, smart devices, and cybersecurity.
Figure T-1: Occupational Summary of Technology Occupations Highest Demand Occupations Fastest Growing Occupations Difficult to Fill Occupations Computer Support (network) Specialists Software App Developers Computer Systems Analysts Network and Computer Systems Administrators Computer Hardware Engineers
Information Security Specialists Computer Systems Analysts Computer and Information Research Scientists Software App Developers Web Developers
Materials Engineers Computer Programmers/ Software Developers Database Administrators Network and Computer Systems Administrators Electrical engineers
Table T-2 provides a summary of occupations that are grouped by related skills and job duties. Note that occupations in the technology sector, especially Information Technology, tend to change titles and blend SOC codes as new technologies come on-line. Therefore, in Table T-2, occupations are grouped by clusters to try to accommodate a changing set of occupational titles.
Note that new occupations may be underestimated. A good example is cybersecurity. Since job projections are based in part on past history, new occupations like “Information security specialist” list only modest projected openings (8 per year). Currently, there are 180 vacancies listed on the state employment website. Though these positions include turnover jobs as well as new jobs, even if 50% were turnover, the openings are still significantly more than projected.
44 www.bls.gov/opub/btn/volume-2/careers-in-growing-field-of-information-technology-services
2015‐2017 Oregon Talent Plan – ADOPTED 11‐12‐2015 / rev. 01‐26‐2016 27 | P a g e

Table T-2: Technology Occupations in Oregon SOC Title 2012
Employment 2012-2022 Percent Change
2012-2022 Employment Change (growth openings)
2012-2022 Replacement Openings
2012-2022 Total Openings
Annual Wage
Analysts & Architects Computer and Information Research Scientists
85 27.1% 23 13 36 $135,125
Computer Systems Analysts 4,794 27.5% 1,316 753 2,069 $83,641 Information Security Analysts 170 30.0% 51 27 78 $89,088 Total 5,049 27.5% 1,390 793 2,183 Programmers & Developers Computer Programmers 2,999 11.5% 345 783 1,128 $72,152 Software Developers, Applications 7,563 27.1% 2,047 970 3,017 $89,057 Software Developers, Systems Software 3,471 15.7% 544 445 989 $102,400 Web Developers 1,011 26.7% 270 159 429 $69,250 Total 15,044 21.3% 3,206 2,357 5,563 Network and Database Specialists Database Administrators 1,273 16.1% 205 241 446 $85,482 Network and Computer Systems Administrators
4,670 17.2% 804 734 1,538 $70,639
Computer Network Architects 714 12.6% 90 112 202 $126,227 Computer User Support Specialists 7,779 24.0% 1,868 1,222 3,090 $48,620 Computer Network Support Specialists 997 4.1% 41 157 198 $59,983 Total 15,433 19.5% 3,008 2,466 5,474 Hardware & Product Engineers Biomedical Engineers 115 24.4% 28 29 57 $94,428 Chemical Engineers 253 26.1% 66 59 125 $86,001 Computer Hardware Engineers 3,445 15.9% 548 743 1,291 na Electrical Engineers 1,324 17.1% 226 289 515 $86,966 Electronics Engineers, Except Computer 1,781 14.2% 253 389 642 $102,045 Materials Engineers 404 13.1% 53 127 180 $86,985 Mechanical Engineers 2,610 15.2% 396 891 1,287 $81,138 Total 9,932 15.8% 1,570 2,527 4,097
Many occupations have high projected openings as well as a significant number of unfilled vacancies. Table T-3 illustrates occupations where the total number of openings (new jobs needed to fill positions, and current vacancies (new jobs plus job churning caused from turnover) are high. This combination may indicate occupations that might be underestimated in terms of future growth, especially when recent technology trends are factored into projections.
2015‐2017 Oregon Talent Plan – ADOPTED 11‐12‐2015 / rev. 01‐26‐2016 28 | P a g e

Table T-3: Current Job Listings Compared to Projections 2012-2022
projected growth rate
Total annual projected openings
Current Job listings on State site
Current job listings on other employment sites*
Computer Systems Analyst 27.5% 207 467 526 Software Developer, Applications 27.1% 302 514 978 Web Developer 26.7% 43 140 422 Operations Research Analyst 27.7% 20 47 81 *Job listings posted by Oregon Employment Department are automatically extracted from various sites across the Web. Difficult to Fill Technology Occupations
The final data analysis evaluates the 2014 Annual Vacancy Survey in which employers identified occupations that were hard to fill. The list below continues to underscore a consistent set of IT-related occupations.
Oregon, especially Portland, has long attracted young tech workers. Therefore, tech occupations in high demand within the Portland/Vancouver metropolitan region are not always difficult to fill. Those that were noted by employers as hardest to fill positions are more disbursed outside of the region.
Table T-4: Difficult to Fill Technology Occupations Occupational Title Difficult-to-Fill
Vacancies Total Vacancies
% Difficult to Fill
Materials Engineers 41 49 84% Computer Programmers 71 89 80% Database Administrators 10 13 77% Network and Computer Systems Administrators 22 34 65% Electrical Engineers 15 24 63% Computer User Support Specialists 149 370 40% Computer Systems Analysts 42 114 37% Web Developers 93 259 36% Computer Occupations, All Other 107 325 33% Software Developers, Applications 102 325 31% Software Developers, Systems Software 59 228 26% Information Security Analysts 4 17 24% Operations Research Analysts 9 49 18%
Key Technology Occupational Clusters
Information Technology job postings have increased 12% on indeed.com alone in the past year; and Computer World estimates IT jobs will increase 20% over the next few years. There is a shortage of data scientists, making it one of the fastest growing and most in-demand professions.45 It is estimated that there is a current global need for 300,000 to one million new cybersecurity workers. The Internet
45 Information Age, January 2015
2015‐2017 Oregon Talent Plan – ADOPTED 11‐12‐2015 / rev. 01‐26‐2016 29 | P a g e

Systems Security Association (ISSA) has identified the need for internationally accepted standards46 defining the cybersecurity career, to ensure incumbent professionals can advance their careers, and to attract new workers.
Combining the analysis of total expected openings, growth rates, and difficult to fill vacancies with technology trends and recent industry reports, five primary technology occupational clusters were identified.
Figure T-2: Key Technology Occupational Clusters
Cluster Occupation /SOC Titles Summary Stats Analysts and Architects Computer and Information
Research Scientists Computer Systems Analysts Systems Architects
5,000-7,500 current jobs
Very high growth rate
More than 2,200 projected openings through 2022
Programmers and Developers
Computer Programmers, Software and Applications
Developers Web Developers
15,000-20,000 current jobs
High growth rate
More than 5,000 projected openings though 2022
Hardware and Product Engineers
Computer Hardware Engineers Materials Engineers Electrical Engineers
Approximately 10,000 current jobs
Growth rate slightly above state average
4,100+ projected openings through 2022 Network and Database Specialists
Database Administrators Network and Computer Systems
Administrators Computer Network Architects Computer User Support Specialists Computer Network Specialists
15,000-17,500 current jobs
Above average growth rate
Almost 5,500 projected openings through 2022
Cybersecurity Specialists
Information Security Analysts Cybersecurity Specialists Information Protection Specialists
Job data incomplete Highest growth rate
Figure T-2 compares how these five key clusters relate to each other in terms of their size (number of current jobs and projected openings) as represented by the size of the cluster; their projected growth rate as represented by their position on the vertical axis; and the ability of Oregon employers to find qualified workers as represented by their position on the horizontal axis.
46 www.issa.org/?page=November2010&hhSearchTerms="need+and+standards"
2015‐2017 Oregon Talent Plan – ADOPTED 11‐12‐2015 / rev. 01‐26‐2016 30 | P a g e
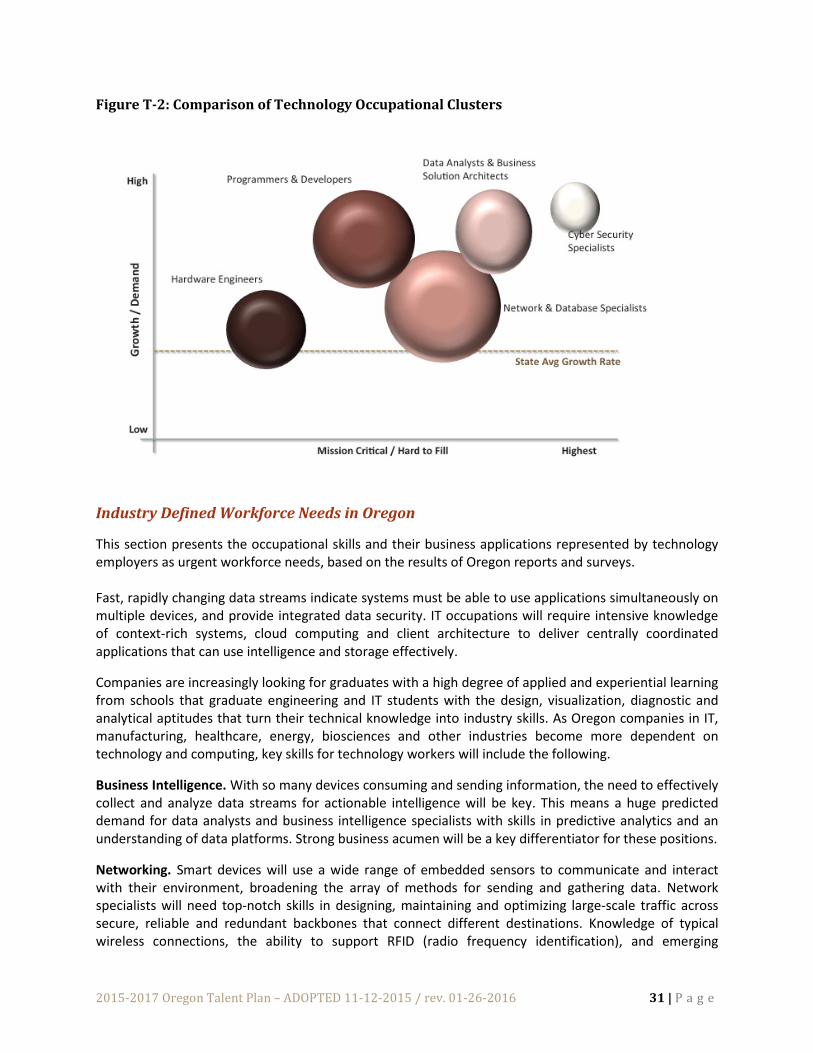
Figure T-2: Comparison of Technology Occupational Clusters
Industry Defined Workforce Needs in Oregon
This section presents the occupational skills and their business applications represented by technology employers as urgent workforce needs, based on the results of Oregon reports and surveys. Fast, rapidly changing data streams indicate systems must be able to use applications simultaneously on multiple devices, and provide integrated data security. IT occupations will require intensive knowledge of context-rich systems, cloud computing and client architecture to deliver centrally coordinated applications that can use intelligence and storage effectively.
Companies are increasingly looking for graduates with a high degree of applied and experiential learning from schools that graduate engineering and IT students with the design, visualization, diagnostic and analytical aptitudes that turn their technical knowledge into industry skills. As Oregon companies in IT, manufacturing, healthcare, energy, biosciences and other industries become more dependent on technology and computing, key skills for technology workers will include the following.
Business Intelligence. With so many devices consuming and sending information, the need to effectively collect and analyze data streams for actionable intelligence will be key. This means a huge predicted demand for data analysts and business intelligence specialists with skills in predictive analytics and an understanding of data platforms. Strong business acumen will be a key differentiator for these positions.
Networking. Smart devices will use a wide range of embedded sensors to communicate and interact with their environment, broadening the array of methods for sending and gathering data. Network specialists will need top-notch skills in designing, maintaining and optimizing large-scale traffic across secure, reliable and redundant backbones that connect different destinations. Knowledge of typical wireless connections, the ability to support RFID (radio frequency identification), and emerging
2015‐2017 Oregon Talent Plan – ADOPTED 11‐12‐2015 / rev. 01‐26‐2016 31 | P a g e
protocols such as Bluetooth Low Energy will also be needed. Supplying diversity of content and understanding the underlying application flow will be vital for networkers to support critical data ranging from text messages to audio and video.
Cyber/Information Security. Already one of the largest talent gaps in the IT workforce, cybersecurity specialists will be even more sought-after as large data sets are constantly transferred among multiple devices. New levels of risk assessment and risk mitigation will push security away from simple perimeter defense toward multi-faceted built-in approaches. External protection will require dynamic security testing and monitoring. There will be a critical need for IT security specialists with skills in vulnerability assessments, planning and mitigation, public key infrastructure (PKI) security, and wireless network security. Software and web developers and data/network administrators will need to know cyber security standards and protocols, and be familiar with data ethics and privacy policies.
Data visualization, user interface (UI), and user experience (UX) skills. With more data at our fingertips, information must be visually attractive to break though the noise and be adapted to screens of various shapes and sizes. Talented user interface (UI) and user experience (UX) designers are predicted to be hot commodities, as ease of use, efficiency, and general experience with system interfacing becomes a key differentiating factor. Marketable skills include Responsive Web Design (wherein visuals dynamically adjust to screen-size, platform and orientation) and Service Design (a human-centered design approach that intuitively guides users through complex services). This need to visualize data and simplify interfaces is required of web designers and software application developers.
Mobile Development. Many smart objects, including wearables, will be controlled by mobile devices; that will drive demand for mobile application developers who will mostly use Apple iOS and Android platforms. Those with experience developing mobile apps that communicate with external hardware and sensors will be especially sought-after.
Hardware Engineering. Computer hardware engineers design and build the actual electronics at the heart of the Internet of Things. Engineers who can develop and install Wi-Fi, Bluetooth and other connectivity solutions will be in great demand. Other valuable hardware skills for the IoT include AutoCAD drafting, micro-electromechanical systems (MEMS) engineering, wireless sensor design, and quality assurance.
2015‐2017 Oregon Talent Plan – ADOPTED 11‐12‐2015 / rev. 01‐26‐2016 32 | P a g e

Advanced Manufacturing Thirty-one percent of Americans were employed in manufacturing in 1950. By 2013, only 8.8% of Americans were manufacturing workers.47 Manufacturing supports the entire industrial value chain and is also responsible for 69% of all U.S. business research and development spending.48 It is far and away the most important sector of the U.S. economy in terms of total output.49 Over the next ten years, three and a half million U.S. manufacturing jobs will need to be filled; however, a skills gap is projected to leave two million of them unfilled.50 Baby boomer retirements will eliminate an estimated 2.7 million jobs. Economic expansion is predicted to add 700,000 jobs created by business growth. The shortage of skilled workers will be exacerbated by the loss of embedded knowledge from experienced workers, a negative image of manufacturing among younger generations, a lack of STEM skills, and a continuing decline in technical education programs in public schools.
Modern manufacturing is becoming more and more complex, inter-weaving computers, electronics, software, firmware, hardware and artificial intelligence. It relies on highly automated production processes with robotics and networked equipment, along with product design processes using modeling and simulation. It employs monitors and optic sensors; and it uses continuous process improvements and ISO certified quality controls.51 These processes require worker familiarity with mathematics, electronics, materials science and systems thinking. This has led to an average wage of $70,492 per year, as “non college-educated” workers in manufacturing earn 10.9% more than similar workers in the rest of the economy.”52
During the first quarter of 2015, manufacturing employed 180,719 workers in 5,868 establishments across the state of Oregon. In 2014, manufacturing produced $17.8 billion worth of export goods – 85% of all Oregon exports.53 The state’s Advanced Manufacturing sector is projected to grow 19% by 2022 (+16,900 jobs.)54 These manufacturing sectors generate 27.8% of Oregon GDP with high tech accounting for 47%, metals, machinery and transportation 40% and food processing 13% of this total.
Table M-1: Top Manufacturing Sectors by Jobs
Manufacturing Sector Jobs (1Q 2015) Computers and electronic products 37,009 Food and beverage 29,923 Primary and fabricated metals 23,888 Wood products 22,037 Machinery 12,403 Transportation equipment , including Aerospace 12,254
47The Myth of Industrial Rebound, NY Times, Business Section, Feb. 2, 1914 and Factory Jobs Are Gone. Bloomberg Business Week, p.12, Feb. 2, 2014 48 The Manufacturing Footprint and the Importance of U.S. Manufacturing Jobs. Robert Scott, Economic Policy Institute. January 22, 2015 49 Bureau of Economic Analysis, 2014. 50 The skills gap in U.S. manufacturing in 2015 and beyond. The Manufacturing Institute and Deloitte. 2015 51 Report to the President on Advanced Manufacturing, July 2012 52 The Manufacturing Footprint and the Importance of U.S. Manufacturing Jobs. Robert Scott, Economic Policy Institute. January 22, 2015 53 Ibid 54 WorkSystems Inc. Advanced Manufacturing Sector Report, 2014
2015‐2017 Oregon Talent Plan – ADOPTED 11‐12‐2015 / rev. 01‐26‐2016 33 | P a g e

Key Industry Trends Affecting the Supply and Demand of Manufacturing Workers
As talent-driven innovation is the number one enabler of competitiveness, the talent shortage can have a significant impact on the growth and profitability of manufacturers. It will impact process innovation, new product development, productivity, customer service and international expansion.55 In addition to the shortfall of skilled workers, technology trends indicate the need for workers talented in engineering, skilled trades and production, who can navigate a new world of technologically advanced manufacturing. Highlights of key trends projected by manufacturing leaders to be of significant importance include the following.
Advanced Materials. Advanced manufacturing uses new age materials such as graphene, unique composites, and micro-latticed metal 1000 times thinner than a human hair. Shape memory metal or “smart” alloys remember their shapes; they can be deformed and then returned to their original shape by applying heat. They have the ability to sense and respond to environmental changes. These new materials are based on multiple sciences, such as nanotechnology, metallurgy, physics, applied mathematics and information technology. The use of advanced manufacturing materials cuts across industries, including electronics, machinery, energy, transportation, healthcare and bioscience.
Mechatronics and Smart Devices. Mechatronics unites the principles of mechanics, electronics, and computing to generate a simpler, more economical and reliable system. Robotics, sensing and control systems, and medical imaging technology are applications of mechatronics. Smart machines and the emergence of the Internet of Things will increase the need for truly interdisciplinary and applied technical skills. With electronics and mechanics mediated by software and middleware, devices and machines will become smarter. For example:
Transportation > Smart Cars, self-driven public transit Health Care > Responsive prosthetics and advanced diagnostics Energy > Smart electricity grids and utility meters Bioscience > Digitized synthetic genomics and implantable drug delivery systems
Manufacturing now requires workers to read blueprints and operate complex precision equipment. In-demand skilled workers will have competencies in engineering systems, computer science and math, as well as communications and teamwork.
3D Printing (Additive Manufacturing). 3D printing, also known as additive manufacturing or digital fabrication, creates objects using computer generated design and control tools. From prototypes to mobile phone cases, teeth implants to life-like prosthetic devices, 3D will enable do-it-yourself as well as industrial production. It works with plastics, gypsum, carbon, graphite and even food materials. Food scientists are researching how to layer amino acids and proteins for foods with longer shelf life and optimal nutritional mix. On the horizon is 4D Printing that will soon enable self-replication and self-assembly.56 MIT is experimenting with complex physical substances called “programmable materials” that build themselves. They will be used to “make life using life’s own building blocks, DNA.”57 Digital manufacturing requires effective use of modeling tools, and the understanding of thermodynamics and materials, in addition to traditional manufacturing skills and knowledge.
56 Biology’s Brave New World, Foreign Affairs, pp. 28-46. November/December 2013 57 Ibid, p. 29
2015‐2017 Oregon Talent Plan – ADOPTED 11‐12‐2015 / rev. 01‐26‐2016 34 | P a g e

Projected Oregon Occupational Needs in Manufacturing
In a national survey of manufacturers by the Manufacturing Institute and Deloitte, 82% of respondents reported serious gaps in the availability of manufacturing candidates; 56% anticipated the shortage to worsen over the next three to five years. That skills gap has resulted in 5% of all manufacturing jobs going unfilled.58
Data from the Oregon Employment Department includes the following information on high wage manufacturing occupations in engineering (SOC 17) and production (SOC 49 and 51). These occupational clusters were examined for:
The total projected openings of both new and replacement jobs: How many are we likely to need in the years ahead?
The growth rate of the occupation: Is this occupation increasing in terms of the relative number of jobs?
If the occupation was classified as “hard to find” by employers: Is there a gap in the number or qualifications of applicants?
Table M-2 summarizes the occupations for all three of the factors listed above. The list of job titles reflects industry trends and the growing need for jobs related to the development of smart devices as well as the consistent need for strong basic skills.
Table M-2: Occupational Summary of Manufacturing Occupations
Highest Demand Occupations Fastest Growing Occupations Difficult to Fill Occupations Industrial Machinery Mechanics Machinists Industrial and Process Engineers Computer Hardware Engineers Mechanical Engineers
Medical Equipment Repairers Industrial Machinery Mechanics Machinists Chemical Engineers Aerospace Engineers
Industrial Machinery Mechanics Machinists CNC and Numerical Control Operators Skilled Maintenance Workers Materials Engineers
Engineers & Engineering Technicians
As shown in Table M-3, there is consistent demand for electrical, industrial, computer and mechanical engineers, growing at or slightly above the state average projected for all jobs. Technicians, especially process or industrial technicians responsible for quality, productivity and lean operations remain in steady demand. Higher growth rates can be seen in more specialized areas such as Aerospace, Chemical and Biomedical Engineering that reflect industry growth in expanding markets such as unmanned aerial systems, 59 medical devices, and the Internet of Things. Materials engineering is the one exception to state projections that does not correspond with national industry reports highlighting materials engineers and materials scientists as being instrumental for markets related to the Internet of Things.
58 WorkSystems Inc. Advanced Manufacturing Sector Report, 2014, page 14 59 Flying Into the Future with Aerospace & Defense, Beth Fitz Gibbon. U.S. Department of Commerce, December 2014
2015‐2017 Oregon Talent Plan – ADOPTED 11‐12‐2015 / rev. 01‐26‐2016 35 | P a g e

Table M-3: Engineering & Technician Occupations in Manufacturing by Total Employment SOC Code
SOC Title 2012 Employment
2012-2022 Percent Change
2012-2022 Employment Change/ new openings
2012-2022 Replacement Openings
2012-2022 Total Openings
2015 Annual Average Wage
17-2112 Industrial Engineers 3,447 11.2% 385 1,008 1,393 $95,547 17-2061 Computer Hardware
Engineers 3,445 15.9% 548 743 1,291 na
17-3023 Electrical and Electronics Engineering Technicians
2,777 7.6% 212 575 787 $61,446
17-2141 Mechanical Engineers 2,610 15.2% 396 891 1,287 $81,138 17-3026 Industrial Engineering
Technicians 2,371 0.7% 16 491 507 na
17-2199 Engineers, All Other 2,244 12.9% 289 413 702 $96,292 17-2072 Electronics Engineers,
Except Computer 1,781 14.2% 253 389 642 $102,045
17-2071 Electrical Engineers 1,324 17.1% 226 289 515 $86,966 17-2081 Environmental
Engineers 458 18.8% 86 112 198 $82,839
17-3027 Mechanical Engineering Technicians
437 18.1% 79 91 170 $48,614
17-2131 Materials Engineers 404 13.1% 53 127 180 $86,985 17-3024 Electro-Mechanical
Technicians 280 10.4% 29 58 87 $54,132
17-2041 Chemical Engineers 253 26.1% 66 59 125 $86,001 17-2111 Health and Safety
Engineers, Except Mining
182 11.0% 20 53 73 $81,259
17-3025 Environmental Engineering Technicians
182 10.4% 19 38 57 $59,366
17-2011 Aerospace Engineers 123 24.4% 30 29 59 $90,575 17-2031 Biomedical Engineers 115 24.4% 28 29 57 $94,428 Skilled Production and Maintenance Occupations
As shown in Table M-4, high-paying production and craft occupations with computer, electronics and mechatronics skills have the highest demand matched by the greatest difficulty to fill. As the current aging workforce retires, the biggest replacement openings will be for Industrial Machinery Mechanics, Maintenance and Repair Workers, and Specialty Welders, along with Supervisors of Production and Operating Workers. The demand for some skilled occupations, such as Machinists, is outpacing supply.60 The fastest growing production occupations are those requiring integrated computer skills and those with precision production and craft skills. Both will likely experience new and replacement job openings as advanced manufacturing markets grow.
60 EMSI
2015‐2017 Oregon Talent Plan – ADOPTED 11‐12‐2015 / rev. 01‐26‐2016 36 | P a g e

Table M-4: Production Occupations with a Combination of High Wage, High Demand and Difficult-to-Fill Characteristics (by Weighed Score of All Factors) SOC Code
SOC Title 2012 Employment
2012-2022 Percent Change
2012-2022 Employment Growth/new Openings
2012-2022 Replacement Openings
2012-2022 Total Openings
2015 Annual Average Wage
49-9041 Industrial Machinery Mechanics
3,723 32.9% 1,223 1,075 2,298 $54,883
51-4041 Machinists 3,044 26.8% 817 697 1,514 $47,329 51-4011 Computer-Controlled
Machine Tool Operators, Metal and Plastic
2,019 34.0% 687 565 1,252 $39,309
49-9071 Maintenance and Repair Workers, General
12,619 14.2% 1,792 2,424 4,216 $39,575
51-4121 Specialty Welders, Cutters, Solderers, and Braziers
4,402 14.3% 630 1,080 1,710 $40,368
49-1011 Supervisors and Managers of Mechanics, Installers, and Repairers
4,472 10.7% 478 1,209 1,687 $64,541
51-1011 Supervisors and Managers of Production and Operating Workers
6,960 11.5% 797 979 1,776 $54,967
49-3041 Farm Equipment Mechanics
1,123 18.3% 205 324 529 $39,158
51-2041 Structural Metal Fabricators and Fitters
1,617 17.6% 284 650 934 $38,510
49-3042 Mobile Heavy Equipment Mechanics, Except Engines
1,822 15.2% 277 526 803 $49,303
49-9062 Medical Equipment Repairers
592 36.3% 215 165 380 $58,649
51-4012 Numerical Tool and Process Control Programmers
462 47.2% 218 129 347 $58,881
49-9044 Millwrights 762 19.3% 147 118 265 $49,523 49-2094 Electrical and Electronics
Repairers, Commercial and Industrial Equipment
933 15.2% 142 188 330 $62,193
49-3011 Aircraft Mechanics and Service Technicians
1,085 4.8% 52 291 343 $56,537
51-4111 Tool and Die Makers 354 17.2% 61 21 82 $54,423 49-9069 Precision Instrument and
Equipment Repairers, All Other
461 11.3% 52 128 180 $56,590
51-8099 Plant and System Operators, All Other
229 9.6% 22 85 107 $51,601
Difficult to Fill Manufacturing Occupations
Analysis of the 2014 Annual Vacancy Survey conducted by the Oregon Employment Department, in which employers identified hard to fill occupations, underscores a consistent set of hard to fill positions. Manufacturers have the greatest difficulty finding good technician-level engineering workers, materials
2015‐2017 Oregon Talent Plan – ADOPTED 11‐12‐2015 / rev. 01‐26‐2016 37 | P a g e

engineers and mechanical engineers, as well as production and maintenance workers with combined mechanics, diagnostic and computer skills. Engineers were difficult to fill because of a lack of qualified skilled workers, while skilled operators and maintenance workers were hard to fill because of a lack of applicants.
Table M-5: Difficult to Fill Manufacturing Engineering Positions SOC Occupational Title Difficult-to-Fill
Vacancies Total Vacancies
% Difficult to Fill
17-3023 Electrical and Electronics Engineering Technicians 24 26 92% 17-2131 Materials Engineers 41 49 84% 17-3029 Engineering Technicians, Except Drafters, All Other 20 23 87% 17-2141 Mechanical Engineers 41 57 72% 17-2071 Electrical Engineers 15 24 63% 17-2112 Industrial Engineers 31 67 46% 17-2199 Engineers, All Other 28 192 15% 17-2072 Electronics Engineers, Except Computer 4 44 9% Table M-6: Difficult to Fill Manufacturing Production and Maintenance Positions SOC Occupational Title Difficult-to-Fill
Vacancies Total Vacancies
% Difficult to Fill
49-9041 Industrial Machinery Mechanics 72 72 100% 51-4011 Computer-Controlled Machine Tool Operators, Metal and
Plastic 72 76 95%
49-9043 Maintenance Workers, Machinery 75 81 93% 51-1011 First-Line Supervisors of Production and Operating Workers 222 246 90% 51-2041 Structural Metal Fabricators and Fitters 104 118 88% 49-3042 Mobile Heavy Equipment Mechanics, Except Engines 20 23 87% 51-4041 Machinists 184 217 85% 49-9044 Millwrights 42 51 82% 49-1011 First-Line Supervisors of Mechanics, Installers, and
Repairers 22 33 67%
49-9096 Riggers 28 42 67% 51-4121 Specialty Welders, Cutters, Solderers, and Braziers 167 308 54% 51-2031 Engine and Other Machine Assemblers 7 38 18% Key Occupational Clusters
Combining analysis of total expected openings, growth rates, and difficult to fill vacancies with manufacturing trends and recent industry reports, there are four primary occupational clusters for Manufacturing that meet preliminary criteria for the Oregon Talent Plan for high demand jobs with chronic and growing needs.
2015‐2017 Oregon Talent Plan – ADOPTED 11‐12‐2015 / rev. 01‐26‐2016 38 | P a g e

Table M-7: Key Professional and Technical Manufacturing Occupational Clusters
Cluster Occupations Summary Stats Applied Materials Materials Engineers
Materials Scientists Chemical Engineers Biochemical Engineers Aerospace Engineers
1,000-1,500 employed in 2012 Higher than average growth rate 619 projected positions through 2022; many new openings
Interdisciplinary Engineering
Industrial & Systems Engineers Computer Hardware Engineers Mechanical Engineers Electrical and Electronics Engineers
and Technicians Mechanical Engineering
Technicians
~15,000 employed in 2012 Slightly above average growth rates Over 6,600 projected positions through 2022; high percentage are replacement jobs
Industrial Machinists and Operators
Computer Controlled and Numerical Controlled Machine Operators
Structural Metal Fabricators and Fitters
Industrial Machinists Millwrights
Between 7,500-10,000 employed in 2012 Very high growth rate Over 4,600 projected openings through 2022; both new and replacement jobs
Technologically Skilled Maintenance and Repair Workers
Industrial Machinery Mechanics Skilled Maintenance Workers Medical Equipment Repairers Heavy Equipment Mechanics Electrical and Electronic
Equipment Repairers
Between 20,000-25,000 employed in 2012 Higher than average growth rates Almost 8,500 projected openings through 2022; high retirement rates and replacement
Figure M-1 compares how these four key manufacturing clusters and the need for data and systems analysts relate to each other in terms of their size (number of current jobs and projected openings) as represented by the size of the cluster; their projected growth rate as represented by their position on the vertical axis, and the ability of Oregon employers to find qualified workers as represented by their position on the horizontal axis.
2015‐2017 Oregon Talent Plan – ADOPTED 11‐12‐2015 / rev. 01‐26‐2016 39 | P a g e
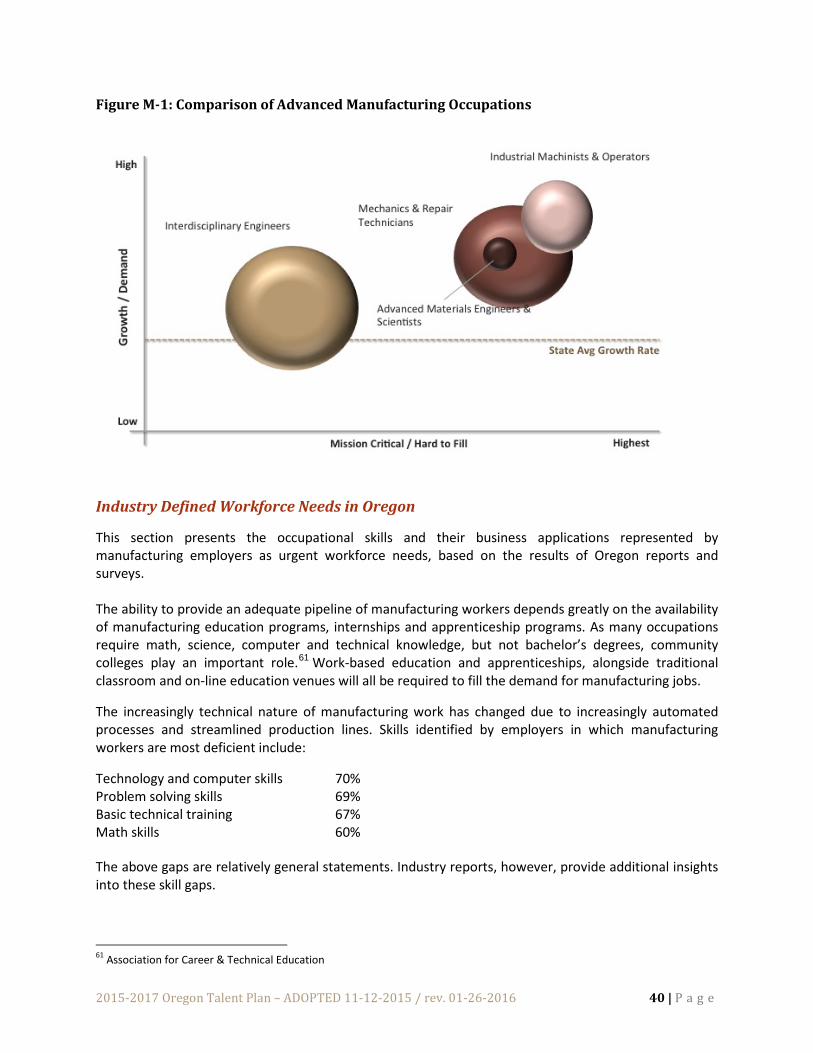
Figure M-1: Comparison of Advanced Manufacturing Occupations
Industry Defined Workforce Needs in Oregon
This section presents the occupational skills and their business applications represented by manufacturing employers as urgent workforce needs, based on the results of Oregon reports and surveys. The ability to provide an adequate pipeline of manufacturing workers depends greatly on the availability of manufacturing education programs, internships and apprenticeship programs. As many occupations require math, science, computer and technical knowledge, but not bachelor’s degrees, community colleges play an important role.61 Work-based education and apprenticeships, alongside traditional classroom and on-line education venues will all be required to fill the demand for manufacturing jobs.
The increasingly technical nature of manufacturing work has changed due to increasingly automated processes and streamlined production lines. Skills identified by employers in which manufacturing workers are most deficient include:
Technology and computer skills 70% Problem solving skills 69% Basic technical training 67% Math skills 60% The above gaps are relatively general statements. Industry reports, however, provide additional insights into these skill gaps.
61 Association for Career & Technical Education
2015‐2017 Oregon Talent Plan – ADOPTED 11‐12‐2015 / rev. 01‐26‐2016 40 | P a g e

Interdisciplinary and systems skills: Advanced manufacturing requires workers to be cross-functional. For example, mechanical engineers working on smart machines must also have strong electrical and computer engineering knowledge. All engineers need systems skills to evaluate existing processes and reconfigure manufacturing systems to reduce cost, improve sustainability, and develop best practices for production.
Rapid prototyping: Workers will develop new products with shorter lead times, using virtual prototyping and rapid fabrication processes. This knowledge must also be steeped in the “economics” of engineering, understanding and being able to apply business practices alongside technical knowledge.
Analytic and diagnostic skills: With more automation, diagnostic skills for determining why a machine or process malfunctioned and how to prevent it in the future will become essential. Being able to analyze information from different sources and identify patterns and causal effects will be important for operators, mechanics, technicians and engineers.
Applied business knowledge: Being able to conduct diagnostics or make critical decisions is enhanced when workers understand and can apply cost considerations and risk-mitigation thinking to their jobs.
Oregon manufacturers report having more jobs than they can fill, because too few applicants have the skills required.62 In addition to the need for qualified workers, there are simply not enough applicants for many key jobs. This points to broader community and educational challenges that include:
Poor image of manufacturing Insufficient outreach to women, veterans, ethnic minorities, and unemployed people who could
provide a deep pool of manufacturing labor Need for more apprenticeship and training programs to attract and prepare workers Better coordination among manufacturers, and public and private educational programs
62 Oregon Manufacturing Extension Partnership and Southwest Washington Workforce Development Council Forum, June 11, 2015
2015‐2017 Oregon Talent Plan – ADOPTED 11‐12‐2015 / rev. 01‐26‐2016 41 | P a g e

Energy Technologies & Utilities The U.S. Energy Information Administration reports that 70% of Oregon’s electricity generation is from hydroelectric and other renewable sources; Oregon is second only to the State of Washington in net electricity generation from hydro. 63 A 2015 Report from Oregon Tech and Renewable America calculated that 75% of Oregon energy comes from renewable resources. Of that, 70% of renewable power is generated from hydro and 26% from wind; biomass accounts for 3.3% and solar, geothermal and waste-to-energy accounts for less than 1%.64 While much of Oregon’s energy workforce is related to hydro, new projects such as the Jordon Cove liquefied natural gas project, may be expanding the skill sets required for the energy sector in Oregon.
The focus of energy workforce needs for this initial Talent Plan include utilities (power engineering, technicians and linemen), targeted energy technologies (materials and smart grid) and professional services (engineering services and data/market analytics). It does not include energy related to transportation or building innovations. Supporting sectors such as software app development are covered within the technology section.
The energy sector is represented by a variety of industry codes, and includes employment in the public sector as well as the private sector. According to a study by Portland State University65, 61% of energy jobs are in the private sector while 39% are in the public sector. Many estimates of energy jobs, especially in renewables include initial construction jobs, which are not sustained once a project comes online. Calculations using the Oregon Employment Department data indicate 22,738 jobs in the energy sectors most directly related to this initial plan:
8,628 jobs in 473 utility establishments 8,725 jobs in 200 manufacturing sectors producing energy equipment and systems 5,365 of the 39,503 professional and technical jobs in engineering, surveying, geological,
software, and data management services66
Key Trends Affecting the Supply of and Demand for Energy Workers
Many factors influence the demand for energy workers; those most recently cited as having significant or disruptive impact include:
Advanced Materials. Movement towards an energy-efficient and low-carbon economy will require advances in materials science and engineering. Advancements in fuel cells, high energy density batteries, high performance materials in extreme environments, and functional surface technologies such as new solar voltaic materials that use broader light spectrums are just a few areas of materials science focused on energy.67 These R&D focused occupations may not be numerous, but they may be critical in positioning Oregon as a leader in low-carbon energy production.
63 U.S. Energy Information Administration, http://www.eia.gov/state/?sid=OR 64 Oregon Tech and Renewable America, Powering Up Oregon, http://arenewableamerica.org/wp-content/uploads/2014/11/Oregon-Economic-Development-Report.pdf 65 PSU ACEEE Summer Study on Energy Efficiency in Buildings, 2012 66 Estimates using calculations from Power Oregon 67 U.S. Department of Energy and Oakridge National Laboratory, Linking Transformation Materials And Processing For an Energy-Efficient Low-Carbon Economy http://energy.tms.org/docs/pdfs/Opportunity_Analysis_for_MSE.pdf
2015‐2017 Oregon Talent Plan – ADOPTED 11‐12‐2015 / rev. 01‐26‐2016 42 | P a g e

Smart Grid Technologies and Business Intelligence. Continued advances in smart technology and computing power are projected to increase the Smart Grid market significantly. Oregon’s 10-year energy plan calls for meeting 100% of new growth load through energy efficiency and conservation which will require the use of technology in addition to consumer conservation. Smart grid advancements are expected in an array of energy related applications including substation automation, communications, asset management and condition monitoring, as well as demand response. According to a new report from Navigant Research, annual utility spending on smart grid as a service technology will grow from $1.7 billion in 2014 to $11.2 billion in 2023—totaling $57.6 billion over that period.68 For many smaller utilities, however, the lack of access to adequate financial and human resources may limit their ability to invest in smart grid solutions.
Big data and the analytics behind smart grids are projected to be two of the most significant advancements in energy, reducing demand through more effective smart grid management, saving money for utilities and customers, and lowering greenhouse emissions. A McKinsey & Company study estimated that by 2020 energy savings will be worth more than $1.2 trillion, and end-use consumption will be reduced by 9.1 quadrillion BTUs.69 The National Institute of Standards and Technology estimates that data from smart grids could generate energy cost savings of up to $2 trillion by 2030.70
Regulatory Influence on the Workforce. The Energy industry is a highly regulated environment requiring a compliance function to manage and communicate changes. Challenges of meeting renewable portfolio standards (RPS) requirements, FERC Orders, PUC mandates and carbon limits mean that every state is under pressure to comply with changing mandates. States that develop the talent to address these issues will have a national advantage. These regulations affect energy sources in wind, hydro, wave, tidal, solar, biomass, combined heat and power, and micro-renewable technologies. While the percentage of energy derived from sources outside of hydro is still relatively small, it is growing; and, the inclusion of these sources does influence the basic knowledge that power engineers and others should have to be competitive in the marketplace. As these sources grow, occupations such as hydrologists, geologists, and atmospheric scientists may also increase. Within all of these occupations, an understanding of public policy and energy economics is critical.
An Aging Workforce. The energy sector, perhaps more so than other sectors in the Oregon Talent Plan, is facing a significant rate of retirement among professional and technical positions. Researchers from the Washington State University Energy Program examined the workforce needs of electric utilities in five Northwest states that employed almost 28,000 workers. Data were collected on five craft occupations (Operator, Mechanic, Electrician, Technician, and Line Worker) and four professional utility occupations (Power Systems Operator, Power Engineer, Customer Service Representative, and Energy Efficiency Program Manager). These positions account for almost 9,000 workers or one-third of all employment in these companies.
Findings indicate that more than 60% of the electric power workforce in the Pacific Northwest is age 45 or older with 17% of the current workforce expected to retire by 2018. Additionally, employers reported having to work much harder than in the past to fill available positions.71 Other studies in Oregon and nationally project 38%-52% of electrical and power engineers will retire before 2020.
68 Navigant Research May 2014, http://www.navigantresearch.com/newsroom/utility-spending-on-smart-grid-as-a-service-will-total-57-6-billion-from-2014-through-2023 69 Wharton School of Business, Big Data and Energy: A Clear Synergy, September 12, 2014 70 National Institute of Standards & Technology, Strategic R&D Opportunities for the Smart Grid http://www.nist.gov/smartgrid/upload/Final-Version-22-Mar-2013-Strategic-R-D-Opportunities-for-the-Smart-Grid.pdf 71 Alan Hardcastle and Sally Zeiger Hanson When 20% of Your Workforce is Retiring: Employment Challenges for Electric Power, Hydro Review, January 25, 2014
2015‐2017 Oregon Talent Plan – ADOPTED 11‐12‐2015 / rev. 01‐26‐2016 43 | P a g e

Linemen and technician positions may face even greater challenges — with an estimated two linemen and 2.85 technicians retiring for every engineer.72 These dynamics suggest that the supply of less-experienced workers will not match the demand generated by future retirements for more-experienced workers; this will require a mix of new graduates and incumbent worker training to fill demand.
Projected Oregon Occupational Needs in Energy
The Center for Energy Workforce Development’s most recent employer survey of Northwest utilities showed that 26% of electricians and more than 20% of power engineers are expected to retire by 2018. Companies in the Northwest expect they will need to replace nearly all of the positions vacated through retirement. By contrast, net new jobs will be very modest with only a handful of utility employers expecting to increase the total number of jobs in these occupations. An estimated 2.2% increase in power engineers and 2% growth in mechanics are consistent with state employment data.
The following summary of Oregon Employment Department data projections for energy include Scientists and Engineers found in SOC 17 & 19, along with Operator, Craft and Technician level jobs within SOC 47, 49 and 51. SOC codes for data analysts, cybersecurity and other high demand IT occupations are described in the Technology Section. Materials Engineers and Scientists are analyzed in the manufacturing section.
The employment department data was analyzed for:
The total projected openings of both new and replacement jobs: How many are we likely to need in the years ahead?
The growth rate of the occupation: Is this occupation increasing in terms of the relative number of jobs?
If the occupation was classified as “hard to find” by employers: Is there a gap in the number or qualifications of applicants?
Table E-1 summarizes the occupations for all three of the factors listed above. The list of job titles reflects industry trends and the growing need to fill jobs related to smart devices, as well as the continuing need for strong basic skills.
Table E-1: Summary of Occupational Analysis for Energy High Demand Jobs (in order of total projected openings)
High Growth Or Emerging Jobs (in order of growth rate)
Hard to Fill Jobs
Electricians Specialty Welders Energy/Electrical Technicians Linemen Electrical/Power Engineers Demand Analysts/ Business Intelligence* Cybersecurity specialists*
Wind Turbine Service Technicians Industrial Machine Mechanics* Geoscientists Machinery Maintenance Technicians* Electrical Engineers Materials Engineers*
Industrial Machinery Mechanics* Electronics Technicians Materials Engineers * Electricians Electrical Engineers Specialty Welders*
* Occupations found to have high demand or be hard to fill in other OTC sectors
72 Center for Energy Workforce Development, Get into Energy http://www.cewd.org/mem_resources/CEWDGetIntoEnergyBooklet.pdf
2015‐2017 Oregon Talent Plan – ADOPTED 11‐12‐2015 / rev. 01‐26‐2016 44 | P a g e

Similar to industry reports, state employment data projects that energy occupations associated with maintaining energy infrastructure will have higher than average growth rates, while field or plant operating positions are projected to grow much slower than the state average of 15%. With an aging workforce in energy, however, there will be a need for replacement jobs, especially in skilled areas that require training and industry certifications. Table E-2 summarizes employment data for selected energy occupations.
Table E-2: Employment Data for Targeted Energy Occupations SOC Code
SOC Title 2012 Employ-ment
2012-2022 Percent Change
2012-2022 Employment Change (growth openings)
2012-2022 Replacement Openings
2012-2022 Total Openings
2015 Annual Average Wage
Plant & Field Operations 51-8021 Stationary Engineers and
Boiler Operators 461 -0.7% 0 140 140 $53,295
51-8093 Petroleum Pump System Operators, Refinery Operators
87 1.2% 1 32 33 $60,581
51-8099 Plant and System Operators, All Other
229 9.6% 22 85 107 $51,601
51-8013 Power Plant Operators 139 -5.0% 0 43 43 $70,223 17-3023 Electrical and Electronics
Engineering Technicians 2,777 7.6% 212 575 787 $61,446
49-2095 Electrical and Electronics Repairers, Powerhouse, Substation, and Relay
209 6.7% 14 42 56 $78,664
47-2231 Solar Photovoltaic Installers 51 17.7% 9 9 18 $39,352 49-9081 Wind Turbine Service
Technicians 100 34.0% 34 17 51 na
49-9051 Electrical Power-Line Installers and Repairers
1,478 9.7% 143 512 655 $87,867
Skilled Trades and Craft Positions 47-2111 Electricians 7,270 17.7% 1,289 1,370 2,659 $68,687 47-2152 Plumbers, Pipefitters,
Steamfitters 3,631 16.9% 614 452 1,066 $72,441
49-9041 Industrial Machinery Mechanics
3,723 32.9% 1,223 1,075 2,298 $54,883
49-9043 Machinery Maintenance 689 24.4% 168 87 255 $43,875 51-4121 Specialty Welders, Cutters,
Solderers, and Braziers 4,402 14.3% 630 1,080 1,710 $40,368
51-4122 Welders, Operators, & Tenders
355 36.3% 129 87 216 $36,468
Scientists and Engineers (Other engineers covered in manufacturing)) 19-2042 Geoscientists, Except
Hydrologists and Geographers
351 25.4% 89 103 192 $74,995
19-2043 Hydrologists 243 15.2% 37 72 109 $83,580 51-8012 Power Distributors and
Dispatchers 274 4.7% 13 85 98 $89,803
17-2071 Electrical Engineers* 1,324 17.1% 226 289 515 $86,966 * Currently 5% of Electrical Engineers are employed by utility companies
2015‐2017 Oregon Talent Plan – ADOPTED 11‐12‐2015 / rev. 01‐26‐2016 45 | P a g e

Energy Technologies and Utilities Occupational Clusters
Combining analysis of total expected openings, growth rates, and difficult-to-fill vacancies with energy trends and recent industry reports, Table E-3 summarizes five primary occupational clusters for energy that meet preliminary criteria for the Oregon Talent Plan for high demand jobs with chronic and growing needs. Two of these clusters are also critical to manufacturing and one cluster crosses all OTC sectors.
Table E-3: Energy Occupational Clusters
Occupational Cluster Examples of jobs Summary Data Energy and Demand Management
• Data Analysts • Business Intelligence Analysts • Demand Analysts • Risk Analysts
Very high growth rates Significant current and projected openings, many hard to fill due to the need for data analytics plus knowledge of energy industry
Plant and Field Technicians
• Plant Operators • Linemen • Electrical/Electronics Technicians • Service Technicians
5,000-6,000 jobs in 2012 Slower than average growth rates Almost 2,000 replacement jobs projected through 2022, many of which require industry certifications
Skilled Trades and Mechanical Occupations (also a key cluster for manufacturing)
• Electricians • Plumbers & Pipefitters • Specialty Welders • Industrial Machine Mechanics • Industrial Maintenance Workers
High growth rates New and replacement jobs projected, many requiring licensing or industry certifications
Power Engineers and Scientists
• Electrical/Power Engineers • Mechanical Engineers • Hydrologists and Geologists • Systems Engineers
Growth rates for engineers slightly above average and growth rates for scientists well above average 900+ projected job openings through 2022 which include other industries employing these occupations
Energy Enabling R&D (also a key cluster for manufacturing)
• Materials Scientists • Materials Engineers • MEMS Engineers • Chemical Engineers
<1,000 jobs statewide in all industries High growth rates, especially in R&D and product development settings Combination of new and replacement openings
Figure E-1 compares how these key energy clusters relate to each other in terms of their size (number of current jobs and projected openings) as represented by the size of their cluster; their projected growth rate as represented by their position on the vertical axis, and the ability of Oregon employers to find qualified workers as represented by their position on the horizontal axis.
2015‐2017 Oregon Talent Plan – ADOPTED 11‐12‐2015 / rev. 01‐26‐2016 46 | P a g e

Figure E-1: Comparison of Energy Technology & Utility Occupations
Industry Defined Workforce Needs in Oregon
This section presents the occupational skills and their business applications represented by energy technology and utility firms as urgent workforce needs, based on the results of Oregon reports and surveys. The fastest growing jobs require data analytics and business intelligence. Smart grid operations, integrated data for demand management and energy planning, and other uses of large and complex data sets are driving a rapid increase in IT specialists, information security positions and business analysts. These jobs are in high demand in energy companies, as well as in professional service companies offering analytics as a service. The current job openings for companies such as Portland General Electric, Bonneville Power Administration and Pacific Power indicate as many open positions for these IT and business intelligence jobs as for engineers.73
Replacing retiring engineers is critical. According to the Bureau of Labor Statistics (BLS), 3.7% of current energy sector employees in the U.S. are electrical engineers, and one in five workers is estimated to retire in the next few years. The need for replacement workers in occupations critical to the supply and transmission of electricity to homes and businesses is significant. New technologies and regulations will push replacement workers to have the most current knowledge and skills in their field. Competitive energy engineers will require more interdisciplinary knowledge that combines electrical and power systems with IT and computer engineering, public policy, and market economics.74 This integration of knowledge often requires a Master’s level education. A large portion of these replacement jobs are
73 Analysis of posted open positions listed on company websites, September 21, 2015 74 Professional Resources to Implement the Smart Grid http://www.ieee-pes.org/images/pdf/Heydt_Professional_Resources_Smart_Grid_2009_Adobe7.pdf
2015‐2017 Oregon Talent Plan – ADOPTED 11‐12‐2015 / rev. 01‐26‐2016 47 | P a g e

anticipated to require previous industry experience; therefore, incumbent worker training options may be as important as the pipeline of new graduates.
The need for Linemen and Technicians is significant. Talent gaps go beyond engineering, with a large pool of skilled trade and craft workers retiring, including journeymen and linemen, in addition to the need for electricians and mechanics who are required to have industry certifications along with post-secondary training. These are skilled trades where employability is enhanced by hands-on experience. Several employers reported that while apprenticeships are an obvious pipeline for new talent, the recession caused many companies to reduce the number of participants in their programs, resulting in a 33% drop in apprenticeships between 2008 and 201375. Craft occupations tend to rely on on-the-job training; therefore, the reduced capacity to accommodate this type of training will require rebuilding and using other approaches to fill talent gaps. The use of smart grid technologies, drones to monitor transmission and distribution systems, and other technological advances mean that technicians and linemen will need increasing data analytic and diagnostic skills.
Talent in energy technologies is poised for growth. The biggest growth in talent potential appears to be in the research and professional services that support energy: developing new materials and products (e.g. fuel cells); developing technologies and software for smart grid applications; analyzing demand data; and, establishing energy management systems. Many of these occupations cross into other advanced manufacturing and technology sectors and are covered in more detail in Section II. The top occupational clusters in this group include materials scientists and engineers, IT network systems developers, cybersecurity specialists and business analysts.
Up-skilling existing workers using cost-effective, responsive means. Energy employers primarily offer training that is developed in-house or by product suppliers; they do not rely on colleges and universities as sources of training and skills upgrades, especially for existing employees.76 Online educational options are expanding for topics such as project management, communications and leadership. Budget constraints have led many employers to reduce support for off-site training or lengthy academic programs, relying instead on training delivered at their facility or online to control costs.
75 IBID 76 Washington State University Energy Program, www.energy.wsu.edu/ResearchEvaluation/WorkforceDevelopment.aspx.
2015‐2017 Oregon Talent Plan – ADOPTED 11‐12‐2015 / rev. 01‐26‐2016 48 | P a g e
Healthcare Healthcare is a $3 trillion industry in the U.S. It is the largest employment sector in the Oregon Talent Council portfolio. In the first quarter of 2015, Oregon’s healthcare and social service industry employed over 217,000 workers in 12,817 establishments, not including contract workers or self-employed workers. Ambulatory care accounted for 32% of jobs; hospitals 25%, long-term care 22%, and social services 15%. A study conducted by the Oregon Healthcare Workforce Institute in 2011 estimated that the state’s health care workforce contributed $23.3 billion, or roughly 14%, to the state’s GDP and $1.98 billion to state and local taxes in 2008.
Despite that huge impact on Oregon’s economy, many parts of the state’s healthcare workforce is in short supply. The Kaiser Family Foundation ranks Oregon 34th in terms of the number of active physicians per 100,000 residents. Oregon’s ratio of nurses is also below the national average. In rural parts of the state the shortage is even more significant for specialty nurses in particular. Nationally, only 10% of physicians and 18% of nurse practitioners (NPs) practice in rural locations, yet one-fourth of America’s population resides in rural areas.77 There is no indication that this trend is any different in Oregon. Additionally, as the system shifts to team-based coordinated healthcare, the projected demand for nurse practitioners, physician assistants, and other front-line health care providers (e.g., registered nurses; pharmacists; physical therapists; mental health providers; and health educators) will increase significantly.
Building on recent work by Oregon’s healthcare industry and higher education partners, the Talent Plan examines trends that are altering the demand and skills for healthcare workers in order to identify a set of high demand, hard to fill occupations, and the key factors for addressing these workforce gaps.
Key Industry Trends Affecting the Supply and Demand of Healthcare Workers
National and state studies78 point to a set of trends with a significant impact on the Healthcare workforce, ranging from new federal regulations to rapidly growing technologies and the use of complex data in managing care. Those noteworthy to Oregon include:
A shift to coordinated care. According to the Agency for Healthcare Research, “Care coordination involves deliberately organizing patient care activities and sharing information among all of the participants concerned with a patient's care to achieve safer and more effective care.” Patient-centered, coordinated care requires proactive patient care plans, and a team environment to provide medical and health services across providers, including community and social service resources. This is a fundamental shift in how healthcare has been provided; and it is perhaps the number one concern of most healthcare providers. This transition requires strong teamwork, timely communications, accurate electronic record keeping, and proactive follow-through; those critical skills apply across the broad array of health providers and administrative staff. How these skills are applied to specific occupations is still being examined and to a large extent will be a “learn by doing” process.
High-touch and high-tech. Clinicians need to experience the team-based environment of an operating room or an emergency room; but they also need the benefit of learning in a simulation lab where they can receive scenario-based training. The equipment and simulation experts to teach that are very costly and rarely available in community colleges and smaller university settings.
77 National Rural Health Association, The Future of Rural Health Policy Brief. 78 Oregon University Systems Healthcare Workforce Initiative Milestone Reports, 2014; Top Healthcare Industry Issue of 2015: Outlines of a market emerge. PriceWaterhouse Coopers.
2015‐2017 Oregon Talent Plan – ADOPTED 11‐12‐2015 / rev. 01‐26‐2016 49 | P a g e

Telehealth and telemedicine. The use of telecommunication and information technologies to provide health care from a distance helps eliminate geographic barriers and can improve access to medical services not always available in rural communities. It is also used in critical care and emergency situations. However, regulatory barriers such as licensing across states and potential lack of reimbursement by government payers and insurance companies can limit its use. As these issues are resolved, the skills associated with telehealth will become more pervasive and will need to be included in education programs for new graduates, along with training to help existing workers effectively utilize telehealth technologies and practices.
Provision of health services in rural regions. While telemedicine can help augment some health services, there is an identified shortage of occupations such as primary care physicians, registered nurses, medical assistants, dentists and pharmacists in rural areas. This not only affects the delivery of basic health services, it also makes it difficult for traded sector companies to recruit and retain professional and technical workers if such basic services are not within a reasonable distance. The lack of clinical rotations and distance to schools offering medical and health education compounds the situation in rural regions. The Oregon Office of Rural Health Policy has been identifying and working with communities and health organizations to address these issues and would serve as a valuable partner in identifying targeted strategies for the Talent Plan.
Aging population and aging in place services. The Center for Disease Control defines aging in place as "the ability to live in one's own home and community safely, independently, and comfortably, regardless of age, income, or ability level.” One-third of American households are home to one or more residents 60 years of age or older, with 90% of adults over the age of 65 reporting that they would prefer to stay in their current residence as they age.79 As the baby-boomer generation retires, more aging-in-place technology will be used by health workers, residents/patients and their families. In states like Oregon with a significant rural population, aging in place can be a necessity as well as a preference. Universities and industry are working together to model smart homes for aging in place, opening markets for healthcare jobs such as occupational therapists, and developing and manufacturing devices, sensors and software. This benefits technology and manufacturing firms as well as consumers and healthcare providers.
Big data. By capturing and using medical histories and real-time patient information, big data is projected to take healthcare to new levels. This enables better analysis of medical options, more responsive treatment plans for patients, predicting public health epidemics, and/or managing costs. Large companies such as IBM, Apple, Kaiser Permanente, WellPoint and others are making significant investments; and specialized health analytics companies are growing rapidly to serve large health systems as well as small clinics and practices. Workers in the field of healthcare will need strong analytical and computing skills to overlay their healthcare and epidemiology knowledge.
3D Printing. 3D printing has taken procedures that were tedious, expensive and imperfect to new levels of speed and precision, and costs are declining rapidly. It is used for surgical planning and personalized medical solutions such as pre-surgical modeling and customized implants. In the future, 3D printing of new organs and tissues that are perfect matches for each patient could eliminate the need for donors, and ensure that no transplant is rejected by a patient's body. As more bioscience and healthcare workers are trained in 3D printing, many industry leaders expect a “revolution.”80
79 A Report to the National Livable Communities: Creating Environments for Successful Aging" 80 CIT, How 3D printing is Taking Healthcare to a Whole New Dimension, February 2015, http://www.cit.com/middle-market/common-interests/3d-printing-healthcare/index.htm
2015‐2017 Oregon Talent Plan – ADOPTED 11‐12‐2015 / rev. 01‐26‐2016 50 | P a g e

Aging Healthcare workers. Health care occupations involving direct patient care are growing in number, but the average age of workers is well above the industry average. For example 43% of nurse practitioners and 39% of physicians are over the age of 55 (compared to just over 20% for other industries).81 As a result, there is the potential for a bubble in retirement over the next ten years; and there will be a need to alter the workplaces and roles of older workers. For instance, the physical demands of nursing become harder with age, yet the experience of nurses is invaluable to patient care. Retraining them for less-strenuous healthcare occupations will fill a need and keep existing workers employed.
Projected Oregon Occupational Needs in Healthcare
In 2014, there were 8,591 reported vacancies for healthcare and social assistant jobs—19% of all reported vacancies and the highest number among all industries. A joint study by the Oregon Health Authority, Oregon Health Science University, and the Oregon Healthcare Workforce Institute identified a 16% increase in full-time equivalent (FTE) demand for physicians, nurse practitioners, and physician assistants in Oregon between 2013 and 2020.64
Employment projections from 2012–2022 estimate the need for 10,907 additional registered nurses, 3,726 physicians, 3,712 social workers, 1,475 pharmacists, 1,470 medical and health services managers, and 1,244 physical therapists to fill new jobs and to replace those permanently leaving the labor market (e.g. retiring). These employment estimates exclude data on workers who are self-employed or independent contractors.
An overview of these needs is summarized in a recent Oregon report82 that notes “Shifting the focus of the health care systems to health promotion, disease prevention, chronic care management, and population health through lean, effective organizational systems places greater emphasis on the need for more primary care and mental health clinicians, data analysts, and systems and process improvement specialists. Oregon’s health care industry members, particularly those representing long-term care, have also expressed difficulty in recruiting physical therapists, occupational therapists, and speech-language pathologists.” In rural areas, nurse practitioners, nurses, and medical assistants are also reported as being in chronically short supply, especially in areas where there are few higher education institutions producing graduates. Licensing Board requirements exacerbate rural shortages by limiting the flexibility health care workers need to do more hands-on patient care. Lack of certified standards for use among hospitals also limits the mobility of health care workers.
The most recent data from the Oregon Employment Department includes the following information on Healthcare occupations with more than 20 total jobs in the state that pay at least the average state wage and require some form of postsecondary education. We examined occupations in Social Services (SOC 21) and Healthcare (SOC 29 & 31) in order to analyze:
The total projected openings of both new and replacement jobs: How many are we likely to need in the years ahead?
The growth rate of the occupation: Is this occupation increasing in terms of the relative number of jobs?
If the occupation was classified as “hard to fill” by employers: Is there a gap in the number or qualifications of applicants?
81 Oregon Healthcare Workforce Institute, Oregon’s University System’s Healthcare Workforce Initiative; Milestone Two Report, 2014 82 Ibid
2015‐2017 Oregon Talent Plan – ADOPTED 11‐12‐2015 / rev. 01‐26‐2016 51 | P a g e

Table H-1 lists the top Healthcare occupations when employment, growth rate, openings, and hard to fill vacancies are combined. This list corresponds to the trends and qualitative data from Oregon industry and education partners, noting critical demands in occupations related to primary care delivery, mental health integration, enhanced medical information and medical therapy.
Table H-1: Healthcare Occupations by Weighted Score (Demand, Growth & Number of Jobs) SOC Title 2012
Employment 2012-2022 Percent Change
2012-2022 Change (growth openings)
2012-2022 Replacement Openings
2012-2022 Total Openings
Competitive Education (Degree)
Registered Nurses 30,677 16.2% 4,959 5,948 10,907 Bachelor's Degree Physicians and Surgeons 8,185 20.5% 1,677 2,049 3,726 Doctoral/professional Physical Therapists 2,362 28.1% 663 581 1,244 Doctoral/professional Physician Assistants 931 38.7% 360 167 527 Master's Degree Dental Hygienists 3,356 18.4% 619 859 1,478 Bachelor's Degree Pharmacists 3,506 18.2% 638 837 1,475 Doctoral/professional Medical Records & Health Information Technicians
3,014 20.4% 616 797 1,413 Associate's Degree
Mental Health Counselors 1,916 19.1% 336 407 773 Master’s Degree Nurse Practitioners 958 26.8% 257 186 443 Master's Degree Pharmacy Technicians 4,699 18.1% 851 465 1,316 Postsecondary
training Licensed Practical and Vocational Nurses
2,705 19.9% 537 660 1,197 Postsecondary training
Substance Abuse and Behavioral Counselors
1,527 21.9% 335 325 660 Master’s Degree
Radiologic Technologists 1,979 17.4% 344 279 623 Bachelor's Degree Opticians, Dispensing 1,030 27.8% 286 296 582 Postsecondary
training Medical and Clinical Laboratory Technicians
1,098 25.3% 278 288 566 Associate's Degree
Veterinarians 1,069 20.5% 219 343 562 Doctoral/professional Health Technologists and Technicians, All Other
1,546 21.2% 327 153 480 Postsecondary training
Occupational Therapists 1,084 23.3% 252 147 399 Doctoral/professional Medical and Clinical Laboratory Technologists
1,683 12.8% 216 441 657 Bachelor's Degree
Veterinary Technologists and Technicians
1,429 20.6% 294 141 435 Associate's Degree
Calculations from Oregon Employment Department data provided August 2015 Mental and Behavioral Health and Related Social Service Occupations
Social service occupations related to Healthcare have been divided into two primary groups:
1. Counselors and therapists working with individuals; and 2. Social service workers and counselors working primarily through public organizations.
This group of mental and behavioral counselors is projected to grow faster than the average state job (19% compared to 15.4%) with significant new and replacement openings. The net growth for social
2015‐2017 Oregon Talent Plan – ADOPTED 11‐12‐2015 / rev. 01‐26‐2016 52 | P a g e

worker jobs is projected to be less; however, an aging workforce in this field will lead to a significant number of replacement jobs.
Table H-2: Social Services Occupations: Mental and Behavioral Health Related SOC Title 2012
Employment 2012-2022 Percent Change
2012-2022 Change (growth openings)
2012-2022 Replacement Openings
2012-2022 Total Openings
Competitive Education
Substance Abuse / Behavioral Disorder Counselors
1,527 21.9% 335 325 660 Master's degree
Mental Health Counselors 1,916 19.1% 366 407 773 Master's Degree Rehabilitation Counselors 1,397 14.4% 201 297 498 Master's Degree Mental Health and Substance Abuse Social Workers
2,172 17.6% 383 460 843 Master's Degree
Family Therapists 458 29.0% 133 97 230 Master's Degree Counselors, All Other 224 15.6% 35 48 83 Master's Degree Total 7,694 18.9% 1,453 1,634 3,087 Table H-3: Social Services Occupations: Community and Family Service Related SOC Title 2012
Employment 2012-2022 Percent Change
2012-2022 Change (growth openings)
2012-2022 Replacement Openings
2012-2022 Total Openings
Competitive Education
Child, Family, and School Social Workers
3,448 12.8% 440 730 1,170 Master's Degree
Social and Human Service Assistants
6,474 15.9% 1,030 1,692 2,722 Associate's Degree
Community Health Workers 287 14.3% 41 75 116 Postsecondary training
Social Workers, All Other 1,573 12.3% 194 333 527 Master's Degree Community and Social Service Specialists, All Other
1,138 13.6% 155 298 453 Associate's Degree
Educational, Guidance, School, and Vocational Counselors
2,781 13.8% 383 591 974 Master's Degree
Total 15,701 14.3% 2,243 3,719 5,962
Emerging and specialized healthcare occupations do not have large numbers of employment or projected openings, but their significant growth rates may indicate a change in demand and a need for a greater pipeline of new graduates. The following two tables summarize the top occupations by education level for those jobs projected to have the greatest growth from 2012–2022. These are Healthcare jobs only; social service occupations are listed separately.
2015‐2017 Oregon Talent Plan – ADOPTED 11‐12‐2015 / rev. 01‐26‐2016 53 | P a g e

This list underscores industry reports83 noting an increase in primary and preventive care occupations, occupations that serve an aging population, and specialty and alternative care occupations that are an increasing part of a coordinated care system.
Table H-4: Top Healthcare Occupations with Bachelor’s Degree or higher by Growth Rate SOC Title 2012
Employment 2012-2022 Percent Change
2012-2022 Change (growth openings)
2012-2022 Replacement Openings
2012-2022 Total Openings
Competitive Education (degree)
Podiatrists 64 39.1% 25 13 38 Doctoral or professional Physician Assistants 931 38.7% 360 167 527 Master's Degree Diagnostic Medical Sonographers
469 38.2% 179 66 245 Bachelor's Degree
Nurse Midwives 171 37.4% 64 33 97 Master's Degree Optometrists 404 36.1% 146 117 263 Doctoral or professional Audiologists 220 33.2% 73 45 118 Doctoral or professional Health Diagnosing and Treating Practitioners, Other
383 30.3% 116 79 195 Doctoral or professional
Orthotists and Prosthetists 106 29.3% 31 10 41 Bachelor's Degree Physical Therapists 2,362 28.1% 663 581 1,244 Doctoral or professional Nurse Practitioners 958 26.8% 257 186 443 Master's Degree Nurse Anesthetists 178 26.4% 47 35 82 Master's Degree Chiropractors 459 23.3% 107 90 197 Doctoral or professional Occupational Therapists 1,084 23.3% 252 147 399 Doctoral or professional Therapists, All Other 99 22.2% 22 12 34 Master's Degree Table H-5: Top Occupations Requiring Less Than a Bachelor’s Degree by Growth Rate SOC Title 2012
Employment 2012-2022 Percent Change
2012-2022 Change (growth openings)
2012-2022 Replacement Openings
2012-2022 Total Openings
Competitive Education
Opticians, Dispensing 1,030 27.8% 286 296 582 Postsecondary training
Cardiovascular Technologists and Technicians
630 26.4% 166 89 255 Associate's Degree
Medical and Clinical Laboratory Technicians
1,098 25.3% 278 288 566 Associate's Degree
Ophthalmic Medical Technicians 243 25.1% 61 24 85 Postsecondary training
Psychiatric Technicians 478 22.6% 108 47 155 Associate's Degree Surgical Technologists 990 21.6% 214 98 312 Associate's Degree Health Technologists and Technicians, All Other
1,546 21.2% 327 153 480 Postsecondary training
Dietetic Technicians 175 20.6% 36 17 53 Postsecondary training
Veterinary Technologists and 1,429 20.6% 294 141 435 Associate's Degree
83 Oregon University Systems Healthcare Workforce Initiative Milestone Reports, 2014; Top Healthcare Industry Issue of 2015: Outlines of a market emerge. PriceWaterhouse Coopers.
2015‐2017 Oregon Talent Plan – ADOPTED 11‐12‐2015 / rev. 01‐26‐2016 54 | P a g e
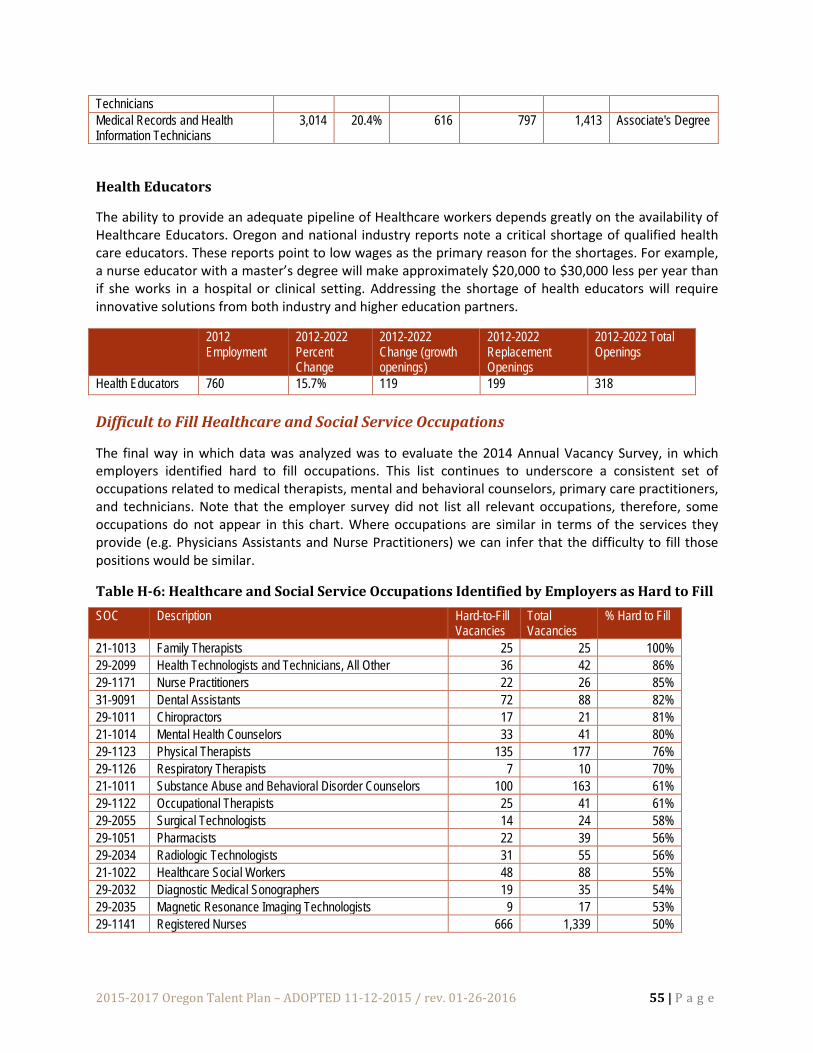
Technicians Medical Records and Health Information Technicians
3,014 20.4% 616 797 1,413 Associate's Degree
Health Educators
The ability to provide an adequate pipeline of Healthcare workers depends greatly on the availability of Healthcare Educators. Oregon and national industry reports note a critical shortage of qualified health care educators. These reports point to low wages as the primary reason for the shortages. For example, a nurse educator with a master’s degree will make approximately $20,000 to $30,000 less per year than if she works in a hospital or clinical setting. Addressing the shortage of health educators will require innovative solutions from both industry and higher education partners.
2012 Employment
2012-2022 Percent Change
2012-2022 Change (growth openings)
2012-2022 Replacement Openings
2012-2022 Total Openings
Health Educators 760 15.7% 119 199 318 Difficult to Fill Healthcare and Social Service Occupations
The final way in which data was analyzed was to evaluate the 2014 Annual Vacancy Survey, in which employers identified hard to fill occupations. This list continues to underscore a consistent set of occupations related to medical therapists, mental and behavioral counselors, primary care practitioners, and technicians. Note that the employer survey did not list all relevant occupations, therefore, some occupations do not appear in this chart. Where occupations are similar in terms of the services they provide (e.g. Physicians Assistants and Nurse Practitioners) we can infer that the difficulty to fill those positions would be similar.
Table H-6: Healthcare and Social Service Occupations Identified by Employers as Hard to Fill SOC Description Hard-to-Fill
Vacancies Total Vacancies
% Hard to Fill
21-1013 Family Therapists 25 25 100% 29-2099 Health Technologists and Technicians, All Other 36 42 86% 29-1171 Nurse Practitioners 22 26 85% 31-9091 Dental Assistants 72 88 82% 29-1011 Chiropractors 17 21 81% 21-1014 Mental Health Counselors 33 41 80% 29-1123 Physical Therapists 135 177 76% 29-1126 Respiratory Therapists 7 10 70% 21-1011 Substance Abuse and Behavioral Disorder Counselors 100 163 61% 29-1122 Occupational Therapists 25 41 61% 29-2055 Surgical Technologists 14 24 58% 29-1051 Pharmacists 22 39 56% 29-2034 Radiologic Technologists 31 55 56% 21-1022 Healthcare Social Workers 48 88 55% 29-2032 Diagnostic Medical Sonographers 19 35 54% 29-2035 Magnetic Resonance Imaging Technologists 9 17 53% 29-1141 Registered Nurses 666 1,339 50%
2015‐2017 Oregon Talent Plan – ADOPTED 11‐12‐2015 / rev. 01‐26‐2016 55 | P a g e

Cross-Cutting Occupations
Data and network administrators, and security specialists (collecting, managing and protecting data) and data and business analysts (analyzing data and translating how data impacts health services, costs and quality) are among the most sought after occupations in healthcare. These two cross-cutting occupational clusters have a combined estimated total of over 3,000 jobs and a projected growth rate of over 22%.
Approximately 6-8% of IT network and data base administration jobs are in healthcare. Using the employment data, we can estimate that there are over 1,450 IT related jobs in healthcare today (making it the 14th largest occupation in healthcare).
Healthcare accounts for 4-11% of the employment base for occupations related to data and business analysts. Using Oregon Employment Department data for these occupations we can assume another 1,500-1,600 specialized business operations jobs in healthcare.
In addition, industry experts have identified a need for data management and analytical skills among nurses, technicians and others who do not have a robust statistical/data background unless they have specialized training or advanced degrees that include data analytics.
Key Occupational Clusters
Combining analysis of total expected openings, growth rates, and difficult to fill vacancies with healthcare trends and recent industry reports, there are seven occupational clusters for healthcare that meet preliminary criteria for the Oregon Talent Plan. As indicated in Table H-8, these include:
Table H-8: Key Healthcare Occupational Clusters Cluster Occupations Summary Stats Rehabilitation Therapists
• Physical Therapists and Physical Therapist Assistants
• Occupational Therapists • Speech Language Pathologists • Respiratory Therapists
~6,000-6,500 employed in 2012
Very high growth rate
1,440 new openings 1,171 replacement openings projected for 2012-2022
Care Practitioners • Nurse Practitioners (NP) • Physician Assistants (PA) • Primary Care Physicians
~2,000 PAs and NPs in 2012
Highest growth rate
Over 1,000 openings projected through 2022; high retirement rates, strong rural need
Primary care physicians are classified within the 8,185 physicians and surgeons, specific data not available
Mental and Behavioral Health
• Mental Health Counselors • Substance Abuse Counselors • Family Therapists • Mental Health Social Workers
~7,500-8,000 workers in 2012
Above average growth rate
3,000+ openings through 2022; new and retirement jobs, hard to fill in rural areas
2015‐2017 Oregon Talent Plan – ADOPTED 11‐12‐2015 / rev. 01‐26‐2016 56 | P a g e

Medical Records and Information Management
• Medical Records Specialists • Database Administrators • Network Systems Analysts • Computer Analysts • Information Security Specialists
~ 5,000 jobs in 2012
Very high growth rate
2,500+ projected openings (2012-2022); most will be new jobs
Business Analysts and Operations Specialists*
• Business Process/ Operations Specialists
• Management Analysts • Financial Operations Analysts
~ 1,550 jobs* (2012)
Above average growth rate
550+ projected openings through 2022; critical for cost containment
Nursing
• Registered Nurses • Licensed Practical Nurses • Nurse Anesthetists and other
Nursing Specialists
~ 35,000 workers in 2012
Average growth rate
12,000 projected openings through 2022
Healthcare Educators
• Healthcare Educators 760 Health educators in 2012
Average growth rate
250 projected openings through 2022; critical to fill for expansion of education programs that train other priority healthcare occupations
* Estimated based on calculations using data from Oregon Employment Department Figure H-1 compares how these key healthcare occupations cluster and relate to each other in terms of their size (number of current jobs and projected openings) as represented by the size of their cluster; their projected growth rate as represented by their position on the vertical axis; and the ability of Oregon employers to find qualified workers as represented by their position on the horizontal axis.
Figure H-1: Comparison of Healthcare Occupational Clusters
2015‐2017 Oregon Talent Plan – ADOPTED 11‐12‐2015 / rev. 01‐26‐2016 57 | P a g e

Industry Defined Workforce Needs in Oregon
This section presents the occupational skills and their business applications represented by healthcare employers as urgent workforce needs, based on the results of Oregon reports and surveys. In the past several years Oregon’s healthcare industry and higher education partners have developed a series of reports outlining ways to address workforce and talent needs in the state. These efforts examined both healthcare providers and administrative/business occupations needed to enhance the supply of qualified and just-in-time workers. This partnership effort resulted in the establishment of a statewide Healthcare Workforce Initiative.84
The healthcare partnership identified a set of conditions that should be addressed to meet growing and changing demands of the industry. The highlighted recommendations below include those that most closely meet the intent of the Oregon Talent Plan. Additional input from this partnership included recommendations to the Higher Education Coordinating Commission for the expansion of high demand healthcare programs and the establishment of new healthcare programs as identified through the industry-education partnership.
Providing adequate industry-based experiences. Clinical training such as clinical rotations, internships, and practicums, are required by nearly all the universities’ health profession education programs to meet accreditation, licensing or certification, or graduation requirements. Without more industry sites around the state, Oregon’s ability to increase the supply of clinically trained graduates is limited. Most of these experiences are coordinated at the program level, and some at an institutional level; however, there is little coordination statewide and across institutions. Since most higher education institutions are west of the Cascades, clinical rotations in rural areas can be even more limited. Universities and industry experts support the need for a single clearinghouse effort for clinical and organizational placements.
Cost of maintaining and expanding health and medical programs. New technologies can enhance healthcare delivery, yet the costs to keep up-to-date on new equipment and technology can limit the breadth and depth of higher education programs. This equipment is often “place-based” and difficult to share among institutions. In addition to equipment, there are other program costs that can be unique to healthcare programs. For instance, to help place industry-based experiences (e.g. clinical rotations) throughout the state, student stipends for housing and other expenses are useful, yet are often not available or are limited in size.
Transitioning jobs to fit new delivery models. Understanding the workforce implications of new care delivery models entails redefining roles and job descriptions, and helping universities and community colleges adapt education programs to new roles in the workplace. Unlike other industries that can develop new processes and services off-line before introducing them to consumers, healthcare workers have to make this transition while continuing to provide healthcare to patients. This process is often uncoordinated across organizations or occupational clusters and could be well served by a collaborative and systematized approach that focuses on two key issues:
1. Promoting inter-professional education where health and medical programs provide cross-discipline exposure
2. Providing work in a team environment that simulates new workplace models.
84 Oregon University System’s Health Care Workforce Initiative Milestone Reports, 2014
2015‐2017 Oregon Talent Plan – ADOPTED 11‐12‐2015 / rev. 01‐26‐2016 58 | P a g e

Retraining the incumbent healthcare workforce, including licensed and non-licensed occupations, is needed to teach workers to better understand and implement new health policies and delivery structures that have a greater focus on preventive care, team care and community/population health. Providing additional business and management skills. Industry has identified a significant need for training the existing workforce to increase skills needed to operate in a coordinated and cost-effective fashion. This includes project management, change management, systems thinking, process improvement and lean management skills. These skills, along with financial and budget management skills, are needed in university curricula for new graduates.
Soft skills such as maturity, customer service and professional behavior have also been identified as missing from many health graduates’ repertoire. As one industry source stated, “Nonchalance is not acceptable when people’s lives are at stake.”
A coordinated approach to developing badges or certificates for these skills has been recommended by the Oregon healthcare industry and educational partners.
2015‐2017 Oregon Talent Plan – ADOPTED 11‐12‐2015 / rev. 01‐26‐2016 59 | P a g e
Bioscience Bioscience supports a broad array of sectors including medical devices and food processing as well as human, animal and environmental health.85 As a key driver of U.S. innovation, it accounts for more than 1.6 million jobs86 primarily in research, manufacturing, and professional and scientific service companies, and government agencies.
Bioscience requires a highly skilled workforce and has provided high-paying jobs with consistent pay increases since 2001, valued at 13.1% in real terms, vs. only 4.4% for other industries.87 Nationally, state sponsored programs for investment in bioscience research and education are key to continued success in this highly competitive global industry.88 While not yet large on a national scale, Oregon’s bioscience community is growing rapidly:89
Directly contributed over $3.5 billion to Oregon’s economy Directly employed over 13,500 biotech workers in private and public sectors Paid an average wage of over $55,000 to biotech workers Spent over $459,900,000 on bioscience research (mostly federal grant funding) Has over 600 private biotech companies and research institutions Has a total economic impact of over $6 billion and 37,000 jobs
Disruptive market trends and regional environmental advantages offer Oregon an opportunity to secure future market share.90
Shift to small molecule therapeutic drugs from “blockbusters” Consumer electronics giants pushing into healthcare markets (e.g. Intel) Growing importance of personalized medicine and targeted therapeutics Increasing bioscience research capacity with Oregon universities and institutes Oregon’s innovative, technology-centric entrepreneurial culture Stable social and political environment
Bioscience is heavily dependent on research. Oregon enjoyed a 6% net increase in federal grants in 2014, from the National Institutes of Health (NIH), the Small Business Technology Transfer Program (STTR), the Small Business Innovation Research (SBIR) Program, the Department of Defense, and the National Science Foundation.91 R&D efforts of Oregon’s Signature Research Centers engage a wide variety of biotechnology-based applications. Sensors, monitors, and prosthetics all require a unique combination of biology, software, middleware, electronics and nanotechnology. Oregon industry leaders such as Intel, Nike, Cambia and Kaiser Permanente are all advancing healthcare’s digitally enabled future through bioscience research.
Oregon already has significant bioscience assets. Genentech plans a $1.25 million expansion of its Hillsboro based pharmaceuticals manufacturing plant. OTRADI is opening a second bioscience incubator in Bend. OHSU has $1 billion to launch the Knight Cancer Research Center – a catalyst that can draw
85 Brookings Institute. Bioscience will accelerate East-West convergence in the century ahead. July 30, 2015 86 Battelle/BIO State Bioscience Jobs, Investments and Innovations, 2014 87 Biotechnology Industry Organization, April 2013. 88 Council of State Bioscience Associations, 2015 89 Battelle/BIO State Bioscience Jobs, Investments and Innovations, 2014 90 Oregon BioScience Roadmap, 2016, page 1 91 Oregon Bioscience Association, 2015
2015‐2017 Oregon Talent Plan – ADOPTED 11‐12‐2015 / rev. 01‐26‐2016 60 | P a g e

precision medicine research companies to Oregon. OHSU has also established the Center for Regenerative Medicine. The University of Oregon has received $74.5 million to expand programs in genetic and molecular biology, neuroscience and brain research. And Oregon State University’s College of Agriculture put Oregon in the top five states for agricultural bioscience patents.92
Currently, Oregon has significant strength in these bioscience subsectors:
Medical and micro devices Biotherapeutics Medical foods and nutrition Bioagriculture Biofuels
The Oregon Bioscience Association is working toward its mission of creating 4,500 new high-paying bioscience jobs by 2020. Oregon is the first state to offer an applied STEM bioscience certificate program93 and it has industry-education partnerships to help existing workers translate skills and experience from other industries into bioscience. Oregon universities also collaborate to provide talented graduates from the Multiple Engineering Co-Op Program (MECOP). Unique industry-education partnerships such as these will be key to addressing bioscience talent gaps now and in the future.
Key Trends Affecting the Supply and Demand of Bioscience Workers
Trends in Bioscience reflect the integration of science, data, and new materials to enable smarter devices, more precise and faster computational and diagnostic methods, and more effective use or protection of resources. “The combination of biology and engineering virtually dictates growth in bioscience occupations.” 94 Innovation trends important to the Oregon bioscience industry include:
Information Technology & Genomics. Rapid advances in computing speed help researchers work with massive, comprehensive databases to create fast, targeted analyses that translate research findings into new products. Computational bioscience and bioinformatics use biological data to develop algorithms and relations among biological systems. Genomics, the study of the structure, function and mapping of life systems is generating knowledge for advances in human and animal health and agriculture. The recent deluge of genomic data provides material for discoveries in the treatment of cancer and infectious diseases, therapeutics, food and biofuel production and conservation management.
Nano+Bio+Micro. Nanotechnology and Microbiology are being combined to create Nanobiotechnology, which can be enabled by microelectronics. This convergence of three technologies enables sensing, therapeutics and medical devices that are implantable for health monitoring, diagnostics and drug dispensing. They can interact with the body to fight cancer, infection, cardiac and neurodegenerative diseases. The discipline combines expertise from chemistry, physics and biology with engineering and flexible electronics, and uses new materials 95 that are absorbable or disposable. This unique combination of technologies will play a vital role in drug delivery, gene therapy, molecular imaging, biomarkers and biosensors. It will be used for diagnostics and treatments, drug development, detection of proteins, tumor destruction, tissue engineering, and biomedical devices.96
92 Battelle/BIO State Bioscience Initiatives 2010 93 Oregon Bioscience Association BioPro Workforce Training Program 94 Douglas Crawford, Assoc. Director of California Institute for Quantitative Biosciences, San Francisco 95 Surface Design: Applications in Bioscience and Nanotechnology. Forch, Schonherr and Jenkins. Wiley, 2009 96 Impact of Nanotechnology on Biomedical Sciences: Current Concepts on Convergence of Nanotechnology with Biology
2015‐2017 Oregon Talent Plan – ADOPTED 11‐12‐2015 / rev. 01‐26‐2016 61 | P a g e

Advances in Agbioscience. From food safety to human nutrition and renewable energy products, agricultural bioscience is critical to the world’s future. It is also an industry that can be especially valuable to Oregon’s rural regions. Four key areas are emerging in this multi-disciplinary sector.
1. Microbial Agbioscience includes bio security, crop protection, genomics, biotechnology, animal science and diagnostics. These are important for ensuring adequate food production and food security.
2. Resilient and Renewable Agricultural Systems include green chemicals, renewable materials, climate change adaptation and soil preservation.
3. Biobased industrial Products such as biofuels, biobased materials, forest products and use of agricultural by-products.
4. Value-Added Food and Health Products including health supplements, animal feed and flavorful reduced calorie foods.
Bioelectronics in medical devices. New medical product development will combine biology, electronics and semiconductors in medical devices and prosthetics, preventive, diagnostic and treatment devices using sensors and monitors, and digital communications. “Quantified self” sensors already monitor physical activity and personal health such as blood pressure, heart rate and sleep patterns.
Manufacturing Automation and Robotics. The cost of error is very high in scientific papers and drug development as well as in surgery. The use of robotics in bioscience is enabling greater precision and control, while also automating redundant tasks. For example, labs working with genomics and DNA sequencing have an intensive need for robotics, as that science involves large numbers of repetitive steps on huge numbers of samples.97 Clinical diagnostics labs, pharmaceutical labs, and hospitals can now process samples in hours instead of days or weeks; which improves patient outcomes and controls costs.98
Projected Oregon Occupational Needs in Bioscience
Oregon has a higher percentage of its bioscience workforce engaged in manufacturing than either California or Washington.
Bioscience occupations examined in this initial plan include those central to Oregon’s markets in agriculture and food, medical devices and therapeutics; primarily among the lab, science and bioengineering occupations. Big data and data analytic needs also cut across these sectors, yet the occupational analysis for those positions are found in the Technology section. Occupations such as micro-electronics and materials engineers cut across an array of advanced manufacturing sectors and are analyzed within the Manufacturing sector.
According to the Oregon Bioscience Association, the sector employed approximately 13,500 people in 2013.99
The most recent data from the Oregon Employment Department includes the following information on bioscience occupations with more than 20 total jobs each, which pay at least the state average wage and require some form of postsecondary education. We examined bio-based occupations in order to analyze:
97 www.sciencemag.org, Lab Automation and Robotics, Gwynne and Heebner. September, 2015 98 Ibid 99 Oregon Bioscience Roadmap, 2016, page 4
2015‐2017 Oregon Talent Plan – ADOPTED 11‐12‐2015 / rev. 01‐26‐2016 62 | P a g e

The total projected openings of both new and replacement jobs: How many are we likely to need in the years ahead?
The growth rate of the occupation: Is this occupation increasing in terms of the relative number of jobs?
If the occupation was classified as “hard to fill” by employers: Is there a gap in the number or qualifications of applicants?
Table B-1 summarizes the occupations for all three of the factors listed above. The list of job titles reflects industry trends and the growing need for jobs related to key segments of Oregon’s bioscience industry.
Table B-1: Summary of Occupational Analysis for Bioscience
High Demand Jobs (in order of total projected openings)
High Growth Or Emerging Jobs (in order of growth rate)
Hard to Fill Jobs
Biological Technicians* Life & Physical Science Technicians Medical Scientists* Ag & Food Science Technicians Medical and Clinical lab Technicians
Chemical Technicians Biomedical Engineers Biochemists and Biophysicists Food Scientists
Materials Engineers
* These occupations have the majority of their employment in the public sector.
Table B-2 summarizes employment, projected growth, and job openings for core bioscience occupations. Cross-cutting scientists and engineers (those that support bio as well as other industries) are projected to grow the fastest of all occupations analyzed for bio. Bio-based agriculture and food scientists are projected to grow slightly above the state average of 15.4%, while medical scientists and other life science positions are projected to grow at the same rate as other occupations. These projections are in line with industry trends that note the increased use of technology is driving significant changes in work output, but much will be automated, so the increase in employment will be more modest.
Table B-2: Projection Data for Selected Bioscience Occupations SOC Code
SOC Title 2012 Employ-ment
2012-2022 Percent Change
2012-2022 Growth (new openings)
2012-2022 Replacement Openings
2012-2022 Total Openings
Competitive Education (Degree)
Ag-Bio Related 19-1012 Food Scientists and
Technologists 215 21.9% 47 72 119 Master's
19-1013 Soil and Plant Scientists 622 14.5% 90 207 297 Master's 19-4011 Agricultural and Food
Science Technicians 611 16.9% 103 221 324 Associate's
Core Life Sciences
19-1042 Medical Scientists, Except Epidemiologists
1,068 16.9% 180 225 405 Doctoral or professional
19-1099 Life Scientists, All Other 199 13.1% 26 42 68 Master's 19-4099 Life, Physical, and Social
Science Technicians 1,245 16.6% 207 489 696 Bachelor's
19-1022 Microbiologists 109 11.9% 13 31 44 Master's
2015‐2017 Oregon Talent Plan – ADOPTED 11‐12‐2015 / rev. 01‐26‐2016 63 | P a g e

19-1029 Biological Scientists 879 8.8% 77 251 328 Master's 19-4021 Biological Technicians 2,626 14.3% 376 787 1,163 Bachelor's 17-2031 Biomedical Engineers 115 24.4% 28 29 57 Master's Cross-Cutting Scientists & Engineers 19-2012 Physicists 94 16.0% 15 23 38 Doctoral or
professional 19-2031 Chemists 683 18.9% 129 177 306 Master's 19-2032 Materials Scientists 58 10.3% 6 15 21 Master's 19-1021 Biochemists and
Biophysicists 109 22.0% 24 31 55 Doctoral or
professional 19-4031 Chemical Technicians 482 27.2% 131 119 250 Bachelor's 19-4092 Forensic Science
Technicians 203 7.4% 15 80 95 Master's
Laboratory Support Occupations 29-2011 Medical and Clinical
Laboratory Technologists 1,683 12.8% 216 441 657 Bachelor's
29-2012 Medical and Clinical Laboratory Technicians
1,098 25.3% 278 288 566 Associate's
A significant portion of core medical and life science jobs are found in the public sector, including core research positions. This is backed by the large amount of federally funded research for biosciences that flows to Oregon universities. Table B-3 illustrates the distribution of bioscience occupations within the public sector.
Table B-3: Concentration of Bioscience-based occupations in the public sector All employment Private
Jobs Public Jobs
% Public Jobs
Biological Scientists 879 109 770 87.6% Biological Technicians* 2626 564 2062 78.5% Medical Scientists, Except Epidemiologists* 1068 271 797 74.6% Life Scientists, All Other 199 64 135 67.8% Biochemists and Biophysicists* 109 40 69 63.3% Environmental & Health Scientists and Specialists 1146 523 623 54.4% Life, Physical, and Social Science Technicians 1245 648 597 48.0% Soil and Plant Scientists 622 349 273 43.9% Agricultural and Food Science Technicians 611 476 135 22.1% Physicists 94 74 20 21.3% Chemists 683 582 101 14.8% Chemical Technicians 482 451 69 14.3% Food Scientists and Technologists 215 209 6 2.8% Key Occupational Clusters
Combining analysis of total expected openings, growth rates, and difficult-to-fill vacancies with bioscience trends and recent industry reports, there are four primary occupational clusters for bioscience that meet preliminary criteria for the Oregon Talent Plan. These are included in Table B-4.
2015‐2017 Oregon Talent Plan – ADOPTED 11‐12‐2015 / rev. 01‐26‐2016 64 | P a g e

Table B-4: Key Bioscience Occupational Clusters
Cluster Occupations Summary Stats Bio-based Product Development
Bioengineers Chemists Chemical Technicians Materials Scientists Biochemists Biophysicists
Over 1,500 distributed among bioscience and other industries
High growth rates
727 projected opening through 2022
Ag-Bio
Food Scientists Formulation Scientists Agriculture and Food Science
Technicians Soil and Plant Scientists
Approximately 1,500 jobs
Above average growth rate
740 projected openings through 2022, with new and replacement jobs
Medical and Life Sciences
Medical Scientists Life Scientists Life and Physical Science Bioscience
Technicians Medical & Clinical Lab Technicians
and Technologists
Over 5,000 jobs (shared with Healthcare)
Slightly above average growth rate
2,392 projected openings through 2022
Core Biology Biological Scientists Microbiologists Biological Technicians
Over 3,600 jobs
Average growth rate
1,535 projected openings through 2022
Figure B-1 compares how these key Bioscience clusters relate to each other in terms of their size (number of current jobs and projected openings) as represented by the size of their cluster; their projected growth rate as represented by their position on the vertical axis; and the ability of Oregon employers to find qualified workers as represented by their position on the horizontal axis.
Figure B-1: Comparison of Bioscience Occupational Clusters
2015‐2017 Oregon Talent Plan – ADOPTED 11‐12‐2015 / rev. 01‐26‐2016 65 | P a g e

Industry Defined Workforce Needs in Oregon
This section presents the occupational skills and their business applications represented by bioscience employers as urgent workforce needs, based on the results of Oregon reports and surveys.
Applied Skills. In 2014, the Coalition of State Bioscience Institutes released a report on workforce trends. In addition to core science knowledge in chemistry, biology, biochemistry, molecular biology and microbiology, applied skills were in high demand. Of the 19,500 bioscience job postings in the Pacific Northwest that were evaluated in this report, the following skills were most prevalent during 2014:100
Lab skills such as assaying, spectroscopy, medium preparation, testing, imaging, centrifugation, and microscopy
Knowledge of current good laboratory practices and quality control processes The ability to frame a research proposal, including knowledge of protocols, and experience
designing, conducting and validating studies101 Data management and informatics including data entry, queries, quality control and correction Regulatory and ethics knowledge and application Teamwork and project management skills Cross-functional communication skills
Business Acumen. In areas such as medical devices and food science, there is a strong need for professionals who can link science with the ability to make good judgments and quick decisions; who consider costs, productivity and profitability throughout their work.
Industry Knowledge. As with other industries in this Talent Plan, some of the greatest unfilled needs are for workers with basic talent in cross-cutting fields such as IT and engineering, who also have applied industry experience. Specific examples of these include:
Design and User Interface Skills: Bioscience-based health manufacturers need user experience designers (See Technology section for detailed description) who can translate technical needs into visual user interfaces on machines and devices, and data analysts who understand applied contexts.
Regulatory and Reimbursement Knowledge: For instance, medical device manufacturers need workers who understand the clinical adoption factors that affect doctors and patients, and who have the skills and experience to handle regulatory affairs. They need workers who understand reimbursement – how medical devices and drugs get paid for. Employers report that most students do not currently receive adequate training for these skills.
Cybersecurity is also a growing need in medical bioscience, as pacemakers and other implanted medical devices must be designed so they cannot be “hacked.” These industry overlays and applied work experience needs point to education and training that provides considerable work-based learning components.
Lifelong learning is crucial in bioscience. To that end, Oregon Bio launched BioPro to create curricula for all levels of the of the bioscience workforce. It has trained more than 1,900 workers for research, manufacturing, quality control and analytical labs.
100 Coalition of State Bioscience Institutes Life Sciences Workforce Trends Report 2014 101 Perspectives in Clinical Research, National Center for Biotechnology Information, October 2010
2015‐2017 Oregon Talent Plan – ADOPTED 11‐12‐2015 / rev. 01‐26‐2016 66 | P a g e

GLOSSARY of OREGON TALENT PLAN DEFINITIONS Agility – For OTC purposes agile has two meanings. First, it refers to workers who are nimble and responsive to changes in their environment. They can think and draw conclusions quickly. For education and training programs it refers to flexibility and/or scalability and their ability to be used across industries, geographic regions, and/or delivery mechanisms or media. Applied Skills – Skills that help increase the value or productivity of basic and technical knowledge through applications of business processes such as project or time management, quality control, and applied cost management. These are skills that employers report as differentiating factors among candidates. Apprenticeship Training – A work-based education program combining on-the-job training alongside classroom instruction where students earn income and education credential simultaneously. They are sponsored by employers, unions and/or associations and are a cost-effective education modality. Badge/Digital Badge – An online representation of an earned skill or credential that verifies skills, interests or achievements through credible organizations. The open standard system allows workers to combine multiple badges from different sources – both online and off – to share with employers and educational institutions. Certificate – A recognition of an individual’s attainment of measurable technical or occupational skills necessary to gain employment, or to advance within an occupation. A certificate can be awarded through: professional/industry organization, registered apprenticeship program, state educational agency or institution, government/regulatory agency and tribes. Contextual Learning – The honing of skills through work experience, industry projects and other exposure that allows students and workers to apply context to what they learn in the classroom. Contingent Workers – Workers who are self-employed, freelancers, temporary, or contracted to earn income from a company but are not considered payroll employees. Credentials – A credential is a nationally recognized degree or certificate, or state recognized validation of educational attainment. Credentials include, but are not limited to, a high school diploma, GED, or other recognized equivalents; post-secondary degrees/certificates; recognized skill standards; licensure or industry-recognized certificates, and all state education agency recognized credentials. Cross-cutting Occupational Skills – Abilities required by or that apply to more than one industry and more than one occupation High Performance Workforce – Collective talent that consistently produces outstanding outcomes at the right cost. Job Tenure – The length of time workers have been in their current job or with their current employer. According to the Bureau of Labor Statistics, the median number of years that wage and salary workers were with their current employer in 2014 was 4.6 years (unchanged from 2012.) Workers in manufacturing had the highest tenure among major industries; workers in leisure and hospitality had the lowest median tenure.
2015‐2017 Oregon Talent Plan – ADOPTED 11‐12‐2015 / rev. 01‐26‐2016 67 | P a g e

Modality – A particular way in which something exists or is done or experienced. A learning modality is the style, way or manner in which something is taught, shared or communicated. For purposes of the Talent Plan, “modality” is defined as the various existing and new channels and/or infrastructure by which worker training and student education can be delivered. For example: on-line or in the workplace, in addition to in the classroom. Occupation Prioritization Classifications:
High Demand – Identified as having higher than average projected job openings. High Growth – Identified by data sources and industry projections as experiencing higher than
average growth rates. Hard to Fill – Identified by employers as critical to company operations but difficult to fill due to
lack of qualified applicants. Mission Critical – Of significant and growing importance to core operations of a company or
industry. Emerging – Showing rapid growth and poised for future market demand, but without current
high demand. Reach – The ability to serve or reach diverse populations, multiple geographic regions, and various business sizes. Scale – For purposes of the Talent Plan, scale is defined as more than growth; it is the ability of a program or project to react bi-directionally as needed to adjust to changes in the environment and adapt operations or business models to fit the local demand. Soft Skills – Personal attributes, characteristics and skills that enable workers to interact effectively with others. They include:
People skills such as good verbal communication and adequate written communications, networking skills, teamwork, emotional intelligence, supervisory skills and leadership potential
Self-management skills such as awareness, emotional control, confidence, resilience and patience
Work attitude such as loyalty, accountability and willingness to learn Professionalism such as proper appearance, basic courtesy, arriving on time and being drug free
Talent – Workers who have the skills to be productive and nimble assets. Talent as defined by the OTC is a combination of the right educational credentials with the right skills (applied skills/knowledge) and the right experience (contextual skills/knowledge). Traded Sector – an industry or group of companies that sell many of their products and services to people and businesses outside of Oregon. Workforce – The total group of people who are employed or employable, including employees of businesses and public organizations, self-employed and contract workers.
2015‐2017 Oregon Talent Plan – ADOPTED 11‐12‐2015 / rev. 01‐26‐2016 68 | P a g e


