Open AcceResearch articleThe p53HMM algorithm: using profile hidden markov models to detect p53-responsive genesTodd Riley*1,2, Xin Yu4, Eduardo Sontag2,3 and Arnold Levine1,4
Address: 1The Institute for Advanced Study, Princeton, New Jersey, USA, 2The BioMaPS Institute at Rutgers University, Piscataway, New Jersey, USA, 3The Mathematics Department, Rutgers University, Piscataway, New Jersey, USA and 4The Cancer Institute of New Jersey, New Brunswick, New Jersey, USA
AbstractBackground: A computational method (called p53HMM) is presented that utilizes Profile HiddenMarkov Models (PHMMs) to estimate the relative binding affinities of putative p53 responseelements (REs), both p53 single-sites and cluster-sites. These models incorporate a novel"Corresponded Baum-Welch" training algorithm that provides increased predictive power byexploiting the redundancy of information found in the repeated, palindromic p53-binding motif. Thepredictive accuracy of these new models are compared against other predictive models, includingposition specific score matrices (PSSMs, or weight matrices). We also present a new dynamicacceptance threshold, dependent upon a putative binding site's distance from the TranscriptionStart Site (TSS) and its estimated binding affinity. This new criteria for classifying putative p53-binding sites increases predictive accuracy by reducing the false positive rate.
Results: Training a Profile Hidden Markov Model with corresponding positions matching acombined-palindromic p53-binding motif creates the best p53-RE predictive model. The p53HMMalgorithm is available on-line: http://tools.csb.ias.edu
Conclusion: Using Profile Hidden Markov Models with training methods that exploit theredundant information of the homotetramer p53 binding site provides better predictive modelsthan weight matrices (PSSMs). These methods may also boost performance when applied to othertranscription factor binding sites.
BackgroundThe p53 protein plays a crucial role in cancer suppressionin the human body. In response to cancer-inducing, DNA-damaging stress conditions, the tetrameric p53 proteinscan activate different pathways that lead to DNA repair,cell cycle arrest, inhibition of angiogenesis, and apoptosis[1]. A highly degenerative, palindromic consensus DNAbinding site, consisting of a half-site RRRCWWGYYY, fol-
lowed by a variable length spacer, then followed (almostalways) by a second half-site RRRCWWGYYY sequence,has been discovered for the protein, where R is a purine, Ya pyrimidine, W is either A or T (adenine or thymine) andG is guanine and C is cytosine (see Figure 1) [2,3]. By labe-ling each quarter-site RRRCW as → and its reverse-com-plement WGYYY as ←, the first discovered p53 consensussequence can be graphically represented by → ← spacer →
←. This configuration of the four quarter-sites is oftenreferred to as the head-to-head (HH) orientation, and rep-resents the vast majority of experimentally-validated p53binding sites to date.
The degeneracy of the p53-REIn the influential paper "Definition of a Consensus bind-ing Site for p53", by El-Deiry et al., 7 of the 20 DNA targetsites (35%) used to form the head-to-head (HH) p53 con-sensus sequence had at least one nucleotide insertion ordeletion relative to the discovered 20 bp consensus afterproper alignment (see Figure 1) [3]. Alignments of theroughly 160 experimentally-validated p53 binding sites todate also show that approximately 30% of presentlyknown sites have at least one nucleotide insertion or dele-tion relative to the consensus matrix [4]. Discovery of p53binding sites with such degeneracy cannot be reliablymade with a PSSM approach, since prevalent insertionsand deletions in the consensus sequence misalign thePSSM reading frame, and lead to improper scoring. There-
fore, PSSM binding site discovery algorithms inherentlymis-score at least 30% of the known p53 binding sites.
PHMMs can model nucleotide insertions and deletionsProfile Hidden Markov Models provide a coherent theoryfor probabilistic modeling of degenerate binding siteswhere random nucleotide insertions into and deletionsfrom the motif are tolerated at certain positions [5,6]. Nat-ural selection suggests that critical nucleotides are con-served over evolutionary time, while non-criticalnucleotides (including tolerated insertions in the motif)are not conserved. The match-state emissions of thePHMM serve to model the critical positions in the motifwith their observed nucleotide frequencies. The addi-tional hidden deletion and insertion states at each posi-tion enable the model to train for (relatively rare)observed deletions and insertions at different positions inthe motif (see Figure 2). Although the probability of anyparticular insertion or deletion of a nucleotide at a certainposition in a functional motif may be rare, the accumu-
Original Data from El-Deiry et al., Used To Define The p53 Consensus Binding SiteFigure 1Original Data from El-Deiry et al., Used To Define The p53 Consensus Binding Site. The original DNA fragments collected from a genome-wide, p53-antibody immunoprecipitation, that were used to define the head-to-head (HH) p53 Con-sensus Binding Site, are graphically presented [3]. The yellow columns corresponding to the 1st and 2nd half-sites were used to define the consensus p53 motif. The p53 binding site is highly degenerative. Within the yellow columns, notice that 7 of the 20 DNA target sites (35%) had at least one nucleotide insertion (green), deletion (red), or both (magenta) relative to the discov-ered 10 bp-spacer-10 bp consensus. Since insertions and deletions throw off the reading frame of a weight matrix, any PSSM approach will inherently mis-score at least 35% of these 20 sites. Alignments of the 160 experimentally validated p53 binding sites also reveal that any PSSM approach would inherently mis-score at least 30% of them as well. Another observation is that additional p53 half-sites are immediately adjacent (in yellow) to the ones used to define the consensus in 15 of the 20 target sites (75%). Since the genome-wide immunoprecipitation study was designed to pull down the highest affinity sites, the fact that 75% of the target sites are actually p53 cluster-sites is the first indication that cluster-sites of 3 or more half-sites confer higher binding affinity [22].
Page 2 of 13(page number not for citation purposes)
Page 3 of 13(page number not for citation purposes)
The Topologies of p53 Single-site and Cluster-site ModelsFigure 2The Topologies of p53 Single-site and Cluster-site Models. (a) A Profile Hidden Markov Model (PHMM) contains three hidden states for each position in a sequence motif of length n: a match state (green squares), an insertion state (orange dia-monds), and a delete state (gray circles). The arrows represent allowed transitions between states and have associated proba-bilities. The match and insertion states also have associated nucleotide emission probabilities. The first and last insertion states (I-0 and I-n) and associated transitions (in red) are shown for completeness. However, they are not present in the p53 models since they are replaced by FIM and FEM models. (b) The topology of the Finite Emission Module (FEM) of length N allows the ability to model any distribution of spacer-lengths between 1 and N. For the p53 models, the model and background probabili-ties within the FEM modules are identically uniform so that there is no-cost for spacer-lengths between 1 and N, and are referred to as "no-cost FEMs". (c) The topology of the Free Insertion Module (FIM) allows for the ability to model an exponen-tially decaying distribution of spacer-lengths. However, by setting the model and background probabilities to identically uni-form, the FIM can model any sequence of infinite length with no associated cost to the overall score (hence the word "Free"). (d) The main components of the p53 single-site model are the left and right half-site PHMMs, which potentially contain corre-sponding positions between them. These two half-site models are separated by a no-cost FEM model that limits the length of any intervening spacer sequence to 20 bp. The half-site models are also wrapped by two FIMs that allow the Viterbi algorithm to find the best matching motifs anywhere in the candidate sequences. (e) The topology of the p53 cluster-site model consists of a single PHMM that models a general half-site, and two back-transitions that allow for modeling an infinite number of half-sites within the cluster-site. The back-transition through the no-cost FEM-14 model limits the spacer-sequence between the half-sites to lengths ≤ 14 bp.
lated probability over all the positions in the motif that aninsertion or deletion event may occur can be significant.The training set of observed insertions and deletionsserves to fine-tune the model to be properly sensitive totolerated deviations from the most prevalent consensusmotif. The main strength of the PHMM is this trained flex-ibility to properly model variable length motifs. The majordrawback is that more data is required to train the extraparameters not found in weight matrices (PSSMs).
Using PHMMs to estimate binding affinitiesLike weight matrices (PSSMs), Profile Hidden MarkovModels can be used to estimate the relative binding affin-ity of a protein for a particular binding site sequence [7].Under ideal conditions, the log-odds scores Gs(x) that aProfile Hidden Markov Model (trained on training set S)calculates for any candidate site x is directly proportionalto the free energy -ΔG(x) of the TF-protein binding to thatcandidate site [see Additional file 1 for details] [7-9]. Thelog-odds scores are given by:
where we define:
With these definitions, and assuming independence ofpositions, we have:
The dynamic programming forward and backward algo-rithms are used to calculate the probabilities Phmm(x) andPhmm(j, b). These two probabilities are calculated by sum-ming up the probability of observing the sequence x, andthe base b at position j, for all the paths through the linearPHMM, respectively. The dynamic programming Viterbialgorithm is used to find the best alignment of the candi-date site x to the binding-site motif modeled by thePHMM. The best (optimal) alignment of the sequence x isobtained by finding the path through the PHMM thatgives the highest log-odds score for the sequence [8]. Inthe case of transcription factor binding sites, the log-oddsscore of this optimal path (also called the Viterbi score) is
commonly used to provide adequate approximations tothe probabilities Phmm(x) and Phmm(j, b) [see Additionalfile 1 for details]. When using the Viterbi score for the prob-ability Phmm(x) we are assuming that there is generallyonly one major set of binding interactions between spe-cific nucleotides and amino acids for a given protein-DNAcomplex, and that all other possible binding locations inthe response element can be ignored.
Training a PHMM with validated binding sitesBefore a PHMM can be used to estimate the relative bind-ing affinity for any putative binding site, the PHMM mustbe trained to properly model a functional binding site ofinterest. When training a PHMM for a particular motif, thegoal is to choose the parameters of the model in order tomaximize the likelihood of the sequences in the training
G xPhmm x
Pbackground xs( ) ln
( )( )
( )=⎛
⎝⎜⎜
⎞
⎠⎟⎟ Site Log-odds Score
===
∑ G bjs
j
x
( )( )
1
length
G bPhmm j b
Pbackground j bjs( ) ln
( , )( , )
(=⎛
⎝⎜⎜
⎞
⎠⎟⎟ Nucleotide Log-oodds Score
position in the sequence length
)
, { ... (j x j x= ∈ 1 ))}
, { , , , }
( , )
b b A C G T
P j bhmm
= ∈=
observed nucleotide base
probabiility of base at position in the PHMM modelb j
Pbackgroundd j b b j( , ) (= probability of base at position in the null baackground model)
(1)
P x x
Phmm( ) = probability of candidate site in the PHMM model
bbackground x x( ) = probability of candidate site in the null background model( )
The Four p53 Correspondence MotifsFigure 3The Four p53 Correspondence Motifs. The four corre-spondence motifs for the repeated, palindromic p53 RE are graphically represented. In the top three motifs, each line corresponds 2 synonymous positions. In the bottom motif, the previously independent half-sites are made correspond-ing (tied) by the yellow connecting lines so that now 4 synon-ymous positions are corresponded. The completely un-tied motif (not shown) has no correspondence, and thus no con-necting lines, between any of the positions in the motif. (R = A or G, W = A or T, and Y = C or T. Position ã has the com-plement nucleotide emission distribution of a.)
Page 4 of 13(page number not for citation purposes)
set, without over-fitting. Again, under ideal conditions thelog-odds score (log-likelihood ratio) Gs(x) to be maximizedfor the collection of binding sites in the training set is pro-portional to the estimated binding free energy -ΔG(x) ofthese binding sites. When the state paths for the trainingsequences are not known, no known closed form solutionexists for the parameter estimations [8]. The Baum-Welchalgorithm is the most commonly used iterative Expecta-tion Maximization (EM) method to train the parametersof the model. The Baum-Welch algorithm always climbsthe gradient (to increase the combined scores of the train-ing set) and uses the optimized dynamic programmingforward and backward algorithms [8].
Results and discussionA novel training method that boosts predictive powerTo increase the predictive power of our p53-motifPHMMs, we attempt to exploit the a priori knowledge thatwhen proteins bind as homodimers or homotetramers,their corresponding binding sites typically have a palindro-mic, repeat, and/or reverse complement structure (see Figure3). This prior knowledge can be used to correspond (fullyor partially tie) the parameters between positions in orderto exploit the inherent redundancy in the information ofthe motif. Within a set of corresponding positions, theupdating of emission and transition probabilities can bor-row strength from each other by sharing information. Inaddition, the degree of sharing of information for any setof corresponding positions can be optimized during train-ing. The process of corresponding parameters can greatlyreduce the parameter search-space during the training ofthe model, and provide the ability to train for rare occur-rence insertion and deletion events. This general tech-nique has been effectively used when HMMs have beenapplied to speech and handwriting recognition problems,and has been referred to as parameter tying [10]. We intro-duce an extension to this method that allows for the set-ting or training for an optimal level of partial or fullparameter tying. In the domain of protein-DNA bindingsites, even if a palindromic, repeat, or reverse complementstructure of a binding site is not known a priori, all theknown structural motifs can be tested, and the structurecan be discovered (inferred) from the ROC curve that max-imizes predictive accuracy. For example, of the six struc-tural models tested for the p53 binding motif, thecombined-palindromic motif that completely corre-sponds the four quarter-sites is the discovered motif, sinceit is the best classifier (see Figure 4).
The Corresponded Baum-Welch algorithm
In order to include the prior knowledge of the structuralmotif (or in an attempt to discover it), a novel "Corre-sponded Baum-Welch" algorithm is proposed to enforceor learn the optimal correspondence between expecta-tions of parameters for corresponding positions after eachiteration of the Baum-Welch algorithm (see Methods). Forexample, assume that we have prior knowledge that atranscription factor protein binds to the DNA inhomodimer form, where each monomer interacts with 5DNA base pairs. Then a corresponding palindromic motiffor the nucleotide positions would be: 1 2 3 4 5 5 4 3 2 1,while a reverse-complement palindromic motif would be:
1 2 3 4 5 (where ã has the complement nucleotideemission distribution of a). All the emission distributionsfor each of the five sets of synonymous positions would bemade corresponding, as well as all the transition probabil-ities between synonymous positions. In this example, if
54321
Cross Validation with Receiver Operating Characteristic (ROC) curves reveals increased predictive power over weight matricesFigure 4Cross Validation with Receiver Operating Character-istic (ROC) curves reveals increased predictive power over weight matrices. 1000 iterations of 10-fold random-split cross validation reveal that the most predictive models utilize the correspondence structures. The com-bined-palindromic model is the best model since it contains roughly half as many parameters as the other three corre-spondence models. The positive set contains 160 experimen-tally validated p53 binding sites, and the negative set contains 40 bp random samples from the mononucleotide content of the training set. The true positive and false positive rates are calculated and plotted for all possible threshold values for each model. The predictive measure for comparing the curves is the AUC (Area Under the Curve). In all the PHMM models the insert-state emissions are fixed to the A, G, C, T nucleotide distribution of the training set. The best classifier uses the combined-palindromic training motif. (Position ã has the complement nucleotide emission distribution of a).
Page 5 of 13(page number not for citation purposes)
all the parameters between synonymous positions werefully corresponding (tied), then the parameter searchspace would be roughly cut in half. The level of corre-spondence between the parameters for synonymous posi-tions can be given a priori, or trained for if the training setis sufficiently large. One optimal level of correspondence,c, can be calculated for the whole motif (for all the corre-sponding positions), or a separate one can be found foreach set of corresponding positions. (See Methods fordetails.)
Comparing the different p53 corresponding (structural) motifs
Since the 20 bp-tetrameric p53 binding site has a repeatedand nested palindromic structure, different correspond-ence motifs can be constructed to train the PHMM mod-els, and cross validation can be used to compare theirpredictive properties. The motifs that are compared are:the repeat or T-coupled motif (1 2 3 4 5 6 7 8 9 10 1 2 3 45 6 7 8 9 10), the (reverse-complement) palindromic or
motif (1 2 3 4 5 1 2 3 4 5 ), and the com-pletely un-tied motif with no correspondence betweenany positions (see Figure 3) [11]. We perform 1000 itera-tions of ten-fold random-split cross validation on eachmodel to gain statistics on their predictive accuracy. Thepositive set contains 160 experimentally validated p53binding sites from [4], and the negative set contains 40 bprandom samples from the mononucleotide content of thetraining set. Then we utilize Receiver Operating Character-istic (ROC) curves in order to compare the predictivepower of the classifiers in an unbiased, threshold-inde-pendent (non-parametric) manner. This is achieved bycalculating the true positive and false positive rates for allpossible threshold values for each model. The summarystatistic for comparing the ROC curves is the AUC (AreaUnder the Curve). AUC values lie somewhere between 1.0and 0.5 (where an AUC of 1.0 would correspond to a per-fect classifier, and an AUC of 0.5 would correspond to aclassifier that is no better than random coin flipping.)
Training Insert-State EmissionsA major consideration when training Profile HiddenMarkov Models (PHMMs) is which parameters to train forat each position, and which parameters to fix at each posi-tion to the over-all average. The more non-fixed parame-ters that must be trained for at each position in the motif,
the more data that is needed to properly train the model.Ideally, a sufficiently large training set is available to beable to train for all the parameters in the PHMM at eachposition. Unfortunately, in the case of transcription factorbinding sites, this is rarely the case. Typically, when usingPHMMs to model DNA binding sites, both the insertprobabilities and insert state nucleotide emissions proba-bilities are set to the binding site averages, since there arerarely enough examples of these rare occurrence events ata particular position to train those parameters for thatposition alone [12]. By corresponding (fully or partiallytying) positions and in effect increasing the training data
10 987654321
54321 10 9876
54321 54321
Cross Validation with Receiver Operating Characteristic (ROC) curves reveals increased predictive power when training insert-state emissionsFigure 5Cross Validation with Receiver Operating Character-istic (ROC) curves reveals increased predictive power when training insert-state emissions. All the PHMM models in this comparison train the insert-state emis-sion distributions based on positional insertions occurring in the training set. Again, 1000 iterations of 10-fold random-split cross validation reveal that the most predictive models utilize the correspondence structures. The positive set con-tains 160 experimentally validated p53 binding sites, and the negative set contains 40 bp random samples from the mono-nucleotide content of the training set. The true positive and false positive rates are calculated and plotted for all possible threshold values for each model. The predictive measure for comparing the curves is the AUC (Area Under the Curve). The AUC values improve for all the PHMM models com-pared to Figure 4, but not for the weight-matrix model (which does not use the insert states). The best classifier (with the combined-palindromic training motif) was used for the p53HMM algorithm. (Position ã has the complement nucleotide emission distribution of a).
Page 6 of 13(page number not for citation purposes)
for each position, it may be possible to train the insertion-state emissions distributions for these correspondingpositions. This could possibly boost predictive power ofthe models, if the p53 protein is selective as to whichnucleotides can be inserted into the motif at certain posi-tions without compromising the binding affinity of thesite. A common example of such selective sequence inser-tions can be found in functional protein families,whereby hydrophobic or hydrophilic amino acid inser-tions may be tolerated at certain positions, provided thatthe insertions are present either in the core or at the sur-face of the protein, respectively, after folding. Notice thatfixing the insertion-state emission distributions at everyposition to the amino-acid average for the wholesequence would be very inappropriate in this example.
The final results
The combined-palindromic motif (1 2 3 4 5 1 2 3
4 5 ) performs on par with or better than all otherstructural motifs, although it contains comparably halfthe degrees of freedom (see Figures 4 and 5). In addition,all four of the structural motifs perform on par with eachother. These results suggest that there exist correlationsbetween the positions in the repeat, independently palin-dromic, and palindromic motifs, and that the combined-palindromic motif leverages the correlations found in allof them. Furthermore, it can be seen that training theinsert-state emissions per corresponding position alsoboosts the predictive power of all the models (see Figures4 and 5). Analysis of the AUC measurements reveals someinteresting features. Adding insert-state emission trainingto the base PHMM (with no motif-corresponded posi-tions) has an AUC improvement of .923 - .919 = .004, butwith motif training has one of .937 - .929 = .008. Addingmotif training (motif-corresponded positions) to thePHMM when not insert-state emission training has anAUC improvement of .929 - .919 = .010, but with insert-state emission training has one of .937 - .923 = .014.Therefore the improvements are not additive. There is"positive synergy" when performing both motif trainingand insert-state emission training together that furtherboosts the predictive accuracy of the model. This observa-tion confirms our hypothesis that training insert-stateemissions can significantly boost the accuracy of themodel after corresponding positions in the PHMMaccording to a binding-site motif.
54321
54321The p53HMM Match and Insert EmissionsFigure 6The p53HMM Match and Insert Emissions. (a) The match-state sequence logo for the combined-palindromic
p53 motif: 1 2 3 4 5 1 2 3 4 5 . (Motif position ã has the complement nucleotide-emission distribution of a.) The height of each letter is made proportional to its fre-quency at each position, and the letters are sorted in descending frequency order. The height of the entire stack at each position is then adjusted to signify the information con-tent (in bits) of that position [25]. The match-state nucle-
otide positions 4, 7, 14, and 17 (motif positions 4, 7, , and
respectively) are the most conserved and are the main points of contact with the p53 protein. (b) The insert-state sequence logo for the same combined-palindromic p53-model. These nucleotide insertions occur in-between the nucleotide positions shown in part a. The specificity motif of the insert-state emissions is different from that of the match-state emissions. (c) The HMM logo that combines parts a and b and state transition information into one graph. The wide, white-background stacks correspond to the match states in part a, while the narrow, red-background stacks correspond to the insert states in part b. (A weakness of this HMM logo is that the insert-state stacks are so narrow that it is difficult to accurately see the stack specificity depicted in part b.) The y-axis is the same for all three graphs. However, the width of a stack in the HMM Logo is proportional to the expected contribution of that match or insert state to an emitted sequence of the model [26].
54321 54321
7
4
Page 7 of 13(page number not for citation purposes)
In addition, the more correspondence placed between thesynonymous positions during each training iteration, thebetter the resulting classifier at that point in the training(results not shown). For this training set, all the com-bined-palindromic models with fixed correspondence fac-tors between c = 0.4 and c = 1.0 eventually converged tothe same predictive model, although lower correspond-ence factors required more iterations to do so. All themodels converged on correspondence factors between c =.98 and c = .999 when training for optimum correspond-ence. Therefore the best predictive model completely cor-responds (ties) the four quarter-sites in a combined-palindromic structure during each iteration of the train-ing. Our published p53HMM algorithm is this best pre-dictive model: trained on the dataset of 160 functionalp53 REs, fully corresponding the data per position basedon the combined-palindromic structural motif, and train-ing the insert-state emissions (see Figure 6).
Validation of the p53HMM algorithmThe new p53HMM algorithm was used to screen for puta-tive p53 binding sites in the endosomal compartmentgenes, which led to the discovery of a functional p53 siteand a new p53-regulated gene, CHMP4C [13]. The puta-tive p53RE sequence AAACAAGCCC agtagcagcagctgctccGAGCTTGCCC was predicted in the promoter region (-497 to -460 bp) of the CHMP4C gene. The data from thechromatin immunoprecipitation and the luciferasereporter assays showed that p53 protein can bind to thissequence and induce CHMP4C gene expression. Addi-tionally, analysis by p53HMM found an alternative puta-tive p53 binding site in the LIF gene that corresponds to a6 bp upstream shift of the downstream half-site relative tothe recently published putative site in intron 1 [14]. Thep53HMM algorithm predicted the site GGACATGTCG-GGACA-GCTC, which matches the consensus RRRCWW-GYYYRRRCWWGYYY perfectly except for the low-conserved position 10 and the gap ("-", deletion) at posi-tion 16. A PSSM approach predicted the shifted site GGA-CATGTCGggacagCTCCCAGCTC, which is the best "gap-less" p53 site in the region conferring p53 regulation, butit still matches the consensus very poorly with five mis-matches (the putative spacer sequence is in lowercase)[14]. A few genes in the dataset of 160 functional p53binding sites have a deletion relative to the consensusexactly between the well-conserved C and G as seenabove, including the genes: EGFR, TYRP1, EEF1A1,HSP90AB1, and BAI1. This discovery of an alternative p53binding site that better matches known functional sites,by modeling for observed insertions and deletions, high-lights some of the advantages of the new p53HMM algo-rithm.
Special considerations for the p53HMM algorithmAlthough the spacer within a p53 RE has been shown togreatly affect the binding affinity for p53 protein, the abil-ity to properly quantify this effect for all possible spacersof lengths 0–21 base pairs has been elusive. Therefore likeprevious algorithms, we have chosen to initially ignorethe spacers of the training set and putative REs [15]. Weare able to ignore arbitrary-length spacers by inserting ano-cost Free Insertion Module (FIM) between the two half-sites of the single-site PHMM [16,17]. Similarly, we can
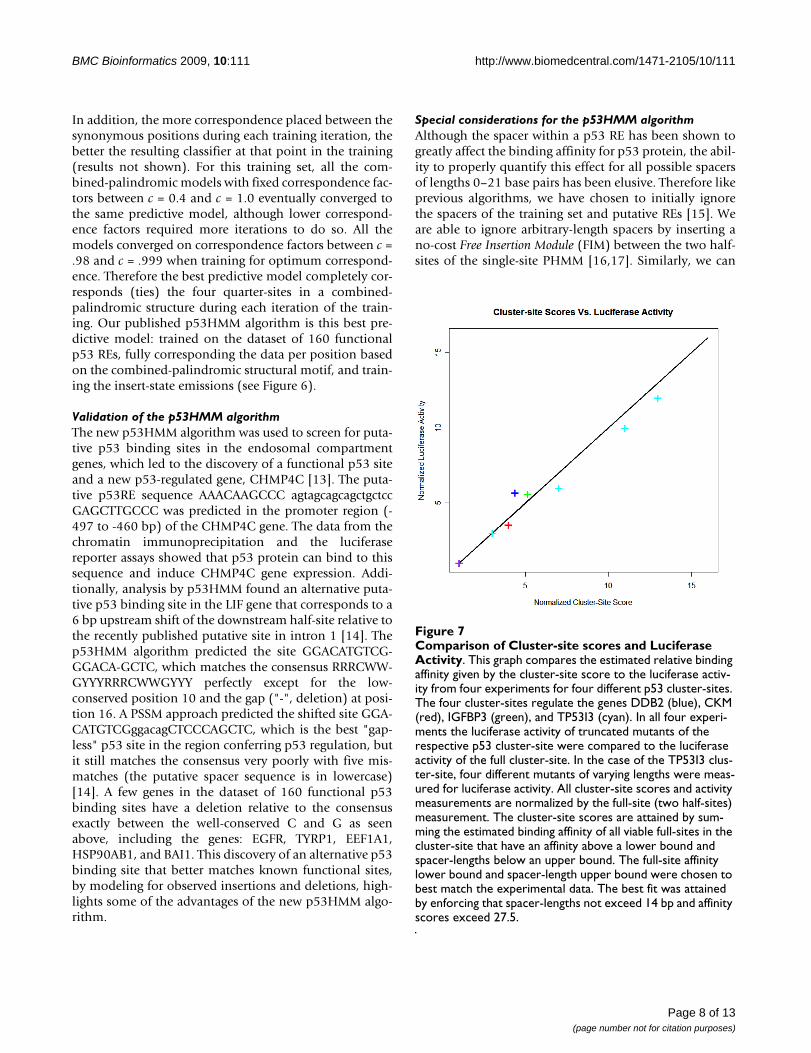
Comparison of Cluster-site scores and Luciferase ActivityFigure 7Comparison of Cluster-site scores and Luciferase Activity. This graph compares the estimated relative binding affinity given by the cluster-site score to the luciferase activ-ity from four experiments for four different p53 cluster-sites. The four cluster-sites regulate the genes DDB2 (blue), CKM (red), IGFBP3 (green), and TP53I3 (cyan). In all four experi-ments the luciferase activity of truncated mutants of the respective p53 cluster-site were compared to the luciferase activity of the full cluster-site. In the case of the TP53I3 clus-ter-site, four different mutants of varying lengths were meas-ured for luciferase activity. All cluster-site scores and activity measurements are normalized by the full-site (two half-sites) measurement. The cluster-site scores are attained by sum-ming the estimated binding affinity of all viable full-sites in the cluster-site that have an affinity above a lower bound and spacer-lengths below an upper bound. The full-site affinity lower bound and spacer-length upper bound were chosen to best match the experimental data. The best fit was attained by enforcing that spacer-lengths not exceed 14 bp and affinity scores exceed 27.5.
Page 8 of 13(page number not for citation purposes)
ignore spacers with lengths between 1 and N base pairs byinserting a no-cost Finite Emission Module (FEM-N)between the two half-sites (see Figure 2). A prior p53 REsearch algorithm (p53MH) was based upon a PSSMapproach and a novel filtering matrix [15]. Unfortunately,the tables were not symmetric and the filtering table over-fit the available data at the time. The combined result wasthat the p53MH method completely rejects 58 of the 160experimentally validated sites to date (receiving a score of0 out of 100, where 100 represented the maximum rela-tive binding affinity). Additionally, some sites receivedvery high scores approaching 100, while the reverse-com-plement received a score of 0, and vice-versa. Due to theseobservations, we have purposely designed the p53HMMalgorithm to be symmetric, so as to give identical scoresfor putative sites and their reverse complements. Sec-ondly, we chose to abandon the filtering matrix to avoidover-fitting the available data. A feature that we preservedfrom p53MH is the normalizing of scores by the highestpossible affinity for the motif (×100), so that the highestpossible normalized score is 100.
Modeling dependencies between positionsPSSMs assume that all nucleotide positions within themotif contribute independently to the binding affinity ofthe binding site, which has been shown experimentally tonot always be the case [7]. Recent research has focused onmodeling dependencies between positions in protein-DNA binding sites [18,19]. Typically Tree Bayesian Net-works and Mixtures of trees have been used to attempt to
model these dependencies between positions, which havebeen shown through cross validation to increase the pre-dictive power of these models [18]. Our PHMM modelsdo not attempt to model dependencies between the posi-tions, however they can be extended to do so by usinghigher-order Profile Hidden Markov Models. Unfortu-nately, the ability to train for positional dependencies,and boost predictive power, is dependent upon the sam-pling size of the training set and requires larger trainingsets to train the extra parameters.
A novel p53 cluster-site algorithmBinding affinity measurements have been obtained forcertain p53 cluster-sites of different lengths by mutatingor truncating known p53 cluster-sites in the genes: DDB2,TP53i3, CKM, IGFBP3, and RGC (see Table 1 and Figure7) [20-23]. Based on the relative binding affinities of thesep53 cluster-sites, we propose a new p53 cluster-site algo-rithm that utilizes the trained PHMM to calculate and sumup the relative estimated binding-affinities, above a cer-tain threshold, of all viable full-sites in the cluster with aspacer of ≤ 14 bp or less (see Methods). This model pre-dicts a linear increase in p53 binding affinity dependentupon the number of half-sites in the cluster-site and thelength of spacers between them. For example, for p53cluster-sites with 2, 3, 4, 5, or 6 adjacent p53 half-sites, thenumber of possible full-sites with spacer-lengths = 14 bpwould be 1, 3, 5, 7, and 9, respectively. Let N be thenumber of half-sites in the cluster-site, then the number offull-sites (to calculate binding affinities for and sum up) is
Table 1: Normalized Experimental Affinity of Cluster-sites
Number of Half-sites
2 3 4 5 5.5 6 7 7.5 8 8.5 9 10 11 12
Cluster Site Relative Binding Affinity
DDB2 1 5
TP53I3 3 6 10 12 16
Theoretical Affinity Approximations
# of Full-sites with spacers ≤ 14 bp 1 3 5 7 8 9 11 12 13 14 15 17 19 21
# of Full-sites with spacers ≤ 24 bp 1 3 6 9 10.5 12 15 16.5 18 19.5 21 24 27 30
# of Full-sites with any size spacer 1 3 6 10 15 21 28 36 45 55 66
This table contains the normalized experimental affinities of different cluster-sites dependent upon the number of half-sites contained in the RE. These affinity measurements were obtained by mutating or truncating p53 cluster-sites in the genes DDB2, and TP53i3 [20,21]. These two p53 cluster-sites are chosen because they match the assumption of the theoretical models that no spacer sequences are present between the half-sites. All affinities are normalized by the 2 half-site (full-site) affinity respective of the RE. The theoretical models assume that all the half-sites in each cluster-site are identical, which is not the case for either of the two cluster-sites. Experimental results support a linear affinity growth model based upon the number of full-sites with spacers no longer than 14 bp (in italics).
Page 9 of 13(page number not for citation purposes)
given by the expression 2N - 3 (N ≥ 2). Although thereexist functional sites with spacers ≥ 15 bp, experimentssuggest that their contribution to the overall bindingaffinity within a cluster-site is negligible.
These p53 cluster-site scores are attained through a twostep process. The first step uses the cluster-site modelwhich contains a generalized p53 half-site PHMM and aback-transition that limits any spacer between two half-sites to no more than 14 bp (see part e of Figure 2). The
dynamic programming Viterbi algorithm is used to findthe highest scoring p53 half-sites in the sequence (that areseparated by no more then 14 bp). The second step thenparses the state-path generated from step 1 and generatesviable p53 full-sites with any spacers removed, while con-serving the property that the half-sites in the cluster-sitewere not separated by more than 14 bp. Now we use themore flexible p53 single-site model to score these viablefull-sites using the Viterbi algorithm (see part d of Figure2). We maintain a running sum of the log-odds scores ofthe candidate full-sites that are above a certain threshold.The log-odds score threshold and spacer-length limit (14bp) are chosen so as to best fit the experimental data (seeFigure 7).
Additionally, this p53 cluster-site model follows statisticalmechanics, in that the overall binding affinity for thecomplete RE is proportional to the probability of any p53protein binding to any of the allowed motifs found in thecluster-site. (See Methods for more details.)
Dynamic acceptance thresholds as a function of the distance from the TSSAn interesting finding from the analysis of our dataset of160 functional p53 binding sites is that the low relativeaffinity scores from our model are significantly correlatedwith short distances from the Transcription Start Site(TSS). We find that low affinity sites exist only in a tightband around the TSS (see part a of Figure 8). Therefore adynamic binding-affinity acceptance threshold, depend-ent upon the putative site's distance from the TSS, cangreatly reduce the false positive rate of our classifier. Witha dynamic acceptance threshold, putative sites will requirehigher calculated binding affinities as their distance fromthe TSS increases in order to be accepted as potentiallyfunctional. For example, consider the linear dynamicacceptance threshold .00107·ΔX + 65.16 shown in Figure8, with the additional restriction that the putative sitesmust be within 5,000 bp upstream and 1,000 bp down-stream of the gene. Let the static acceptance threshold beall normalized scores above 70 with the same restrictionthat the putative sites must be within 5,000 bp upstreamand 1,000 bp downstream of the gene. Even though therestricted dynamic threshold has a false negative rate of 22out of 158 validated p53 sites (13.9%), and the restrictedstatic threshold 32 out of 158 (20.3%), the restricted staticthreshold generates over 3.2 times as many positive hitswhen scoring all 39,288 isoforms of known genes in thehuman genome (hg18). Thus, the dynamic acceptancethreshold has a lower known false negative rate and a con-siderably lower false positive rate. Different dynamicacceptance thresholds can be chosen to match desired lev-els of the known false negative rate and the genome hitrate (see part b of Figure 8). An important considerationwhen choosing an acceptance threshold is that a decrease
Normalized affinity scores versus distances from the TSSFigure 8Normalized affinity scores versus distances from the TSS. (Upper) This plot presents the normalized affinity scores returned from the p53 single-site model versus the distance from the Transcription Start Site (TSS) for 158 experimentally validated p53-binding sites. Low affinity sites exist in a tight band around the TSS (cyan vertical line). p53 activation-sites are plotted in green, repression-sites in red, and both activation and repression in black. All sites ≥ 11 Kb from the TSS have relative affinity scores above the average of ≈ 78 (purple horizontal line). (Lower) This plot presents the estimated normalized affinity scores versus the positive distance (absolute value) from the TSS. Three dynamic acceptance thresholds are shown for scoring for putative p53 binding sites. The blue linear threshold corresponds to the formula .00107·ΔX + 65.16 and has a false negative rate of 18 out of 158 validated p53 sites (11.4%). The orange logarith-mic threshold corresponds to the formula 9.6854·log(ΔX + 593.31) - 15.308 and has a false negative rate of 5 out of 158 validated p53 sites (3.2%). Finally, the black square-root threshold corresponds to the formula .23186·sqrt(ΔX + 7.5231) + 45.6 and has a false negative rate of 1 out of 158 validated p53 sites (0.63%). (ΔX = distance from TSS)
Page 10 of 13(page number not for citation purposes)
in the threshold will in general produce an exponentialincrease in the number of positive hits.
ConclusionProfile Hidden Markov Models (PHMMs) can boost pre-dictive power over weight matrices (PSSMs) when thebinding motif is highly degenerative and tolerates inser-tions and/or deletions at various positions. The increasein predictive power for the p53-binding motif can be seenin Figures 4 and 5. When the RE has a known repeatedand/or palindromic motif, this prior knowledge can beused to correspond parameters in the model to exploit theredundancy in the information in the motif. We proposea novel "Corresponded Baum-Welch" training algorithmthat significantly boosts the predictive power of the p53-RE model, as seen in Figures 4 and 5. When the motif isnot known, all possible motifs for the given size can besampled and cross-validation techniques leveraged toinfer the correct motif that maximizes predictive power.For example, Figure 5 reveals that the maximally predic-tive p53-binding motif corresponds the four quarter-sitesin a combined-palindromic structure.
Our algorithms demonstrate the best predictive capabilityto date in classifying putative p53 binding sites. One algo-rithm uses a novel "Corresponded Baum-Welch" trainingmethod that exploits the repeated, palindromic structureof the p53 motif to train for allowed insertions and dele-tions relative to the consensus. The second algorithmproperly models the relative increase in binding affinityfor p53 cluster-sites (REs with ≥ 3 adjacent half-sites) byusing a two step process that scores all viable full-sites inthe cluster-site while restricting the spacer-length to 14 bp.This new cluster-site algorithm best matches the experi-mental data (see Figure 7).
Functional low-affinity p53-sites only exist near the TSS.Therefore the binding affinity threshold for accepting aputative site should be dependent on the putative site'sdistance from the TSS. By this method, putative sites withrelatively low calculated binding affinities that are nearthe TSS may be accepted, while those sites with equalscores but more distant from the TSS will be rejected. Adynamic threshold, as a function of the distance from theTSS, can greatly reduce the false positive rate when search-ing for putative p53-sites in genes.
MethodsThe Corresponded Baum-Welch algorithm
In order to exploit the redundancy of information in ahomodimer or homotetramer binding motif, we wish toshare information between corresponding positions. Thelevel of sharing of information for any set of correspond-ing positions is given by a correspondence factor c such
that 0 ≤ c ≤ 1. At the end of each round of the iterativeBaum-Welch algorithm we calculate the average values of
each of the newly updated emission probabilities
and transition probabilities for all k and l in the set of
corresponding positions, represented as and
respectively. Each of these average values represents theexpected probability if the corresponding positions arefully tied (c = 1), and are referred to as the "correspondingaverage". Then we update the new emission and transitionprobabilities within the set of corresponding positions,using the current correspondence factor and correspond-ing average, according to:
If we wish to train for the optimum correspondence fac-tor, then we calculate a new c' for each emission and tran-sition probability at each position in the set ofcorresponding positions:
Now, we can calculate a new correspondence factor c' by
averaging over sets of the and values. The one
optimum correspondence factor for the whole motif orseparate correspondence factors for sets of correspondingpositions are obtained by averaging over different sets:
The Corresponded Baum-Welch algorithm will convergeat (local) optimum emission and transition probabilitiesand correspondence factors that maximize the likelihoodof observing the training set with possible pseudo-counts.Please see the Additional file 1 for further details.
The p53 cluster-site algorithmThe p53 cluster-site algorithm is a two step processdesigned to sum the estimated relative binding affinitiesof all viable full-sites within a cluster-site. The first stepuses the cluster-site model that contains a generalized p53
′e bk( )
′akl
′e b( ) ′a
′′ = ′ + ′ − ′
′′ = ′ + ′ − ′⎡⎣
⎤⎦
a a c a a
e b e b c e b e b
kl kl kl
k k k
[ ]
( ) ( ) ( ) ( )(2)
′ = ⋅ ′′ + ′− ′
= ⋅ ′′′
′ = ⋅ ′′ + ′
cc a
akl c a akl
c aakl
c bc e b
ek b c e
kl
k
[ ]
( )( )
( ) (( ) ( )
( )( )b ek b
c e bek b− ′⎡
⎣⎤⎦
= ⋅ ′′′
(3)
′ckl ′c bk( )
′ = ′c c b bk( ) (over all bases and all emissions and transitionns
or
over all bases and corresponding emissions and
k
b
)
( ttransitions k)
(4)
Page 11 of 13(page number not for citation purposes)
half-site PHMM and a back-transition through a no-costFEM-14 module (see part e of Figure 2). The no-cost FiniteEmission Module (FEM) of length 14 can match anysequence of length ≤ 14 bp with no contribution to theover-all score. We score the entire putative cluster-siteusing the p53 cluster-site model and the Viterbi algorithmto find the best-supported path through the cluster-site.This path provides the strongest affinity half-sites that arenot separated by more than 14 bp. If we use the notation"14" for any spacer sequence of length 0 to 14 and H fora half-site sequence, then we can represent the cluster-sitesequence path as:
Step 2 now parses the cluster-site sequence path and gen-erates a list of all viable full-sites, which are concatena-tions of any two half-sites such that they are not separatedby more than 14 bp:
Now we use the more flexible (and more accurate) single-site model with the Viterbi algorithm to estimate the rela-tive binding affinity of all the viable full-sites in the clus-ter-site. The cluster-site affinity score is the sum of allviable full-site scores that exceed a certain threshold. If Fdenotes a viable full-site then:
The spacer-length upper bound and the affinity-scorelower bound were fit to best match the experimentalresults. In the case for p53-binding sites, the best fit is aspacer-length of no more than 14 bp and a log-odds scoreof at least 27.5 (see Figure 7).
The p53HMM implementationThe p53HMM algorithm is implemented in Java and isavailable on-line at http://tools.csb.ias.edu. The imple-mentation makes extensive use of the BioJava Toolkit[24].
Authors' contributionsTR participated in the design of the algorithms, wrote thecode, performed the computational analysis, and draftedthe manuscript. XY performed all experiments. ES partici-pated in the design of the algorithms and helped to draftthe manuscript. AL conceived of the study and helped todraft the manuscript. All authors read, edited, andapproved the final version of the paper.
Additional material
AcknowledgementsWe thank Michael Krasnitz, Amar Drawid, Anirvan Sengupta, Sean Eddy, Jiri Vanicek, and Raúl Rabadán for helpful discussions.
References1. Levine AJ: p53, the cellular gatekeeper for growth and divi-
sion. Cell 1997, 88(3):323-331.2. Funk WD, Pak DT, Karas RH, Wright WE, Shay JW: A transcrip-
tionally active DNA-binding site for human p53 protein com-plexes. Mol Cell Biol 1992, 12(6):2866-2871.
3. el Deiry WS, Kern SE, Pietenpol JA, Kinzler KW, Vogelstein B: Defi-nition of a consensus binding site for p53. Nat Genet 1992,1:45-49.
4. Riley T, Sontag E, Chen P, Levine A: Transcriptional control ofhuman p53-regulated genes. Nat Rev Mol Cell Biol 2008,9(5):402-412.
5. Krogh A, Brown M, Mian IS, Sjölander K, Haussler D: HiddenMarkov models in computational biology. Applications toprotein modeling. J Mol Biol 1994, 235(5):1501-1531.
7. Stormo G, Fields D: Specificity, free energy and informationcontent in protein-DNA interactions. Trends in Biochemical Sci-ences 1998, 23(5):109-113.
8. Durbin R, Eddy S, Krogh A, Mitchison G: Biological sequence analysis1st edition. Cambridge University Press; 1998.
9. Djordjevic M, Sengupta AM, Shraiman BI: A Biophysical Approachto Transcription Factor Binding Site Discovery. Genome Res2003, 13(11):2381-2390.
10. Lee J, Kim J, Kim J: Data-driven design of hmm topology for on-line handwriting recognition. 2000 [http://citeseer.ist.psu.edu/lee00datadriven.html].
11. Ma B, Pan Y, Zheng J, Levine AJ, Nussinov R: Sequence analysis ofp53 response-elements suggests multiple binding modes ofthe p53 tetramer to DNA targets. Nucleic Acids Res 2007,35(9):2986-3001.
12. Marinescu VD, Kohane IS, Riva A: MAPPER: a search engine forthe computational identification of putative transcriptionfactor binding sites in multiple genomes. BMC Bioinformatics2005, 6:79.
13. Yu X, Riley T, Levine AJ: The regulation of the endosomal com-partment by p53 the tumor suppressor gene. FEBS Journal2009, 276(8):2201-2212.
14. Hu W, Feng Z, Teresky AK, Levine AJ: p53 regulates maternalreproduction through LIF. Nature 2007, 450(7170):721-724.
15. Hoh J, Jin S, Parrado T, Edington J, Levine AJ, Ott J: The p53MHalgorithm and its application in detecting p53-responsivegenes. Proc Natl Acad Sci USA 2002, 99(13):8467-8472.
16. Hughey R, Krogh A: Hidden Markov models for sequence anal-ysis: extension and analysis of the basic method. Comput ApplBiosci 1996, 12(2):95-107.
Additional File 1Supplementary Material. The Supplementary Material contains more theory behind modeling TF-binding sites with PHMMs, details of the Cor-responded Baum-Welch algorithm, and a proof that the PHMM log-odds score of a TF-binding site estimates its relative binding affinity given cer-tain assumptions.Click here for file[http://www.biomedcentral.com/content/supplementary/1471-2105-10-111-S1.pdf]
Page 12 of 13(page number not for citation purposes)
Publish with BioMed Central and every scientist can read your work free of charge
"BioMed Central will be the most significant development for disseminating the results of biomedical research in our lifetime."
Sir Paul Nurse, Cancer Research UK
Your research papers will be:
available free of charge to the entire biomedical community
peer reviewed and published immediately upon acceptance
cited in PubMed and archived on PubMed Central
yours — you keep the copyright
Submit your manuscript here:http://www.biomedcentral.com/info/publishing_adv.asp
BioMedcentral
seventh annual international conference on Research in computationalmolecular biology New York, NY, USA: ACM Press; 2003:28-37.
19. Zhou Q, Liu JS: Modeling within-motif dependence for tran-scription factor binding site predictions. Bioinformatics 2004,20(6):909-916.
20. Tan T, Chu G: p53 Binds and activates the xeroderma pigmen-tosum DDB2 gene in humans but not mice. Mol Cell Biol 2002,22(10):3247-3254.
21. Contente A, Dittmer A, Koch MC, Roth J, Dobbelstein M: A poly-morphic microsatellite that mediates induction of PIG3 byp53. Nat Genet 2002, 30(3):315-320.
22. Bourdon JC, Deguin-Chambon V, Lelong JC, Dessen P, May P,Debuire B, May E: Further characterisation of the p53 respon-sive element-identification of new candidate genes for trans-activation by p53. Oncogene 1997, 14:85-94.
23. Kern SE, Pietenpol JA, Thiagalingam S, Seymour A, Kinzler KW,Vogelstein B: Oncogenic forms of p53 inhibit p53-regulatedgene expression. Science 1992, 256(5058):827-830.
24. Holland RCG, Down TA, Pocock M, Prlić A, Huen D, James K, FoisyS, Dräger A, Yates A, Heuer M, Schreiber MJ: BioJava: an open-source framework for bioinformatics. Bioinformatics 2008,24(18):2096-2097.
25. Schneider TD, Stephens RM: Sequence logos: a new way to dis-play consensus sequences. Nucleic Acids Res 1990,18(20):6097-6100.
26. Schuster-Böckler B, Schultz J, Rahmann S: HMM Logos for visuali-zation of protein families. BMC Bioinformatics 2004, 5:7.
Page 13 of 13(page number not for citation purposes)