66
1 The Panoramic Study of the Informal Economy in Jordan Amman-Jordan August, 2012

1
The Panoramic Study of the Informal Economy
in Jordan
Amman-Jordan
August, 2012
2
Preface
The concept of informal economy, which is also referred to as gray/shadow
economy, unorganized economy, hidden economy, and underground
economy, is a phenomenon which remains to be an important and
ambiguous part, not only for developing and transitional countries, but also
for developed countries, for many of which this concept is of limited
relevance. In the past few years, a renewed interest in the informal economy
phenomenon worldwide has appeared. In part, this stems from the fact that
the informal economy has not only grown, but also emerged in new guises
and in unexpected places. It represents a significant, but largely over-looked,
share of the global economy and workforce, a fact that has become more
apparent in the recent global downturn. That renewed interest in the
informal economy also stems from the recognition of the links between
informality, growth, poverty and inequality.
This study comes in as a second step that follows producing the diagnostic
study “The Informal economy in the Jordanian Economy” which was
concluded as part of the collaboration work between the Ministry of
Planning, Economic and Social Council and the UNDP. The study
measures the informal economy in the Jordanian economy based on the
Jordan Labor Market Panel Survey 2010. The study indicates that the size of
the informal economy stand at 44 percent as well as it showcases the main
activities that have a large concentration of informality.
The diagnostic study was able to distinguish between five types of
employment, namely: (i) government employment, (ii) formal private wage
worker which includes wage and salary employment with either a legal

3
employment contract or a social insurance coverage in either private sector
or state owned enterprises, (iii) informal private wage work which includes
wage and salary work in the private sector with neither a contract nor social
insurance coverage, (iv) employers and self employed individuals in the
private sector (v) and finally unpaid family workers in the private sector.
Based on that, the last three mentioned forms of employment are
considered to be the informal employment.
The diagnostic study was able to measure the size of the informal sector in
Jordan as well as it showcased the different methodologies and approaches
of informal employment measurement. It gave the main activities that
employ the largest numbers of informal employment in the Jordanian
economy, therefore the main objective of the panoramic study is to provide
a qualitative dimension to informality in Jordan and elaborate on the factors
for the existence of the informal sector and the result of this sector on;
unemployment (male and female), the relation of informality with SMEs and
it will concentrate on both youth and women factors. Additionally, the study
will shed light on the relationship between poverty/poor people and the
informal sector.
This study aims to serve different goals as follows: (i) Providing a qualitative
dimension to informality in Jordan, (ii) Defining the factors that drive and
motivate the informal economy, (iii) Defining whom from the various
segments of society are most affected by informality (iv) Focusing on the
relation between informality and both youth and women, (v) Testing the
links and relations between informality and SMEs operation, (vi) Showing
which sectors are most effected by informality, how and why,
(viii)Showcasing the regions in Jordan that demonstrate high rates of
informality.
4
The panoramic study methodology was based on three main approaches;
first the study will link the main findings of the diagnostic study with
different statistics and surveys available for Jordan such as; the
Establishment Census, Employment and Unemployment Survey, the
National Accounts and the Social Accounting Matrix. The second approach
is conducting focus groups to cover issues of region and informality, youth
and informality and women and informality. The focus groups included
different people who work informally in different fields from various ages
with special emphasis on youth and women. Finally the third approach is
conducting a comprehensive research that includes interviewing specialists
from both sides (the government and the private sector/employers), in
addition to surveying the existing studies for Jordan and some other
countries.

5
Chapter One
Literature Review
Literature Review:

6
In the past few years, a renewed interest in the informal sector phenomenon
worldwide has appeared. In part, this stems from the fact that the informal
economy has not only grown, but also emerged in new guises and in
unexpected places. It represents a significant, but largely over-looked, share
of the global economy and workforce, a fact that has become more apparent
in the recent global downturn. That renewed interest in the informal
economy also stems from the recognition of the links between informality,
growth, poverty and inequality. In addition, there is a heated debate in this
regards; some observers view this economy in positive terms, as a “pool” of
entrepreneurial talent or a “cushion” during economic crises. Others view it
more problematically, arguing that informal entrepreneurs deliberately avoid
regulation and taxation. Still others see the informal economy as a source of
livelihood for the working poor. Each of these perspectives is right in regard
to specific components or aspects of the informal economy. Contrary to
early predictions, the informal economy has continued to grow and has
appeared in new forms. Today, it represents a significant share of the global
economy and workforce.
The concept of informal economy, which is also referred to as gray/shadow
economy, unorganized economy, and underground economy, is a
phenomenon which remains to be an important and ambiguous part, not
only for developing and transitional countries, but also for developed
countries, for many of which this concept is of limited relevance
(Hussmanns, 2004). W. Arthur Lewis was the first to use the term ‘informal
sector’ in his economic development model which was used to describe
employment or livelihood generation primarily within the developing world.
The above-mentioned term was used to describe a type of employment that
was falling outside the modern industrial sector (Lewis, 1958).
7
However, in order to be able to collect statistics on the informal economy,
one needs to have a definition of the informal economy. Nonetheless, such
definition as well as the appropriate measurement of informal economy
have been a dilemma facing experts and schools of thought that measure
and define informality who employed different methodologies towards this
end. However, it was emphasized in this regards, that in order to obtain an
internationally agreed definition of the informal sector, which was
acceptable to labor statisticians as well as national accountants, the informal
sector had to be defined in terms of characteristics of the production units
(enterprises) in which the activities take place (enterprise approach), rather
than in terms of the characteristics of the persons involved or of their jobs
(for example, labor approach), (Hussmanns, 2004).
The International Labor Conference (ILC) defines informal economy as “all
economic activities by workers and economic units that are, in law or in
practice, not covered or insufficiently covered by formal arrangements”
(ILO 2002a). Further, the ILO report on ‘Decent work and the Informal
Economy’ defined employment in the informal economy as comprising two
components: (i) employment in the informal, and (ii) other forms of
informal employment (i.e. informal employment outside the informal
sector). (ILO, 2002b).
Furthermore, some define the informal economy as "diversified set of
economic activities, enterprises, and workers that are not regulated or
protected by the state" (WIEGO, 2012). Others define the informal
economy as the economy which "consists of unincorporated household
enterprises which differ from formal enterprises in terms of technology,
economies of scale, use of labor intensive processes, and virtual absence of
well maintained accounts" (Kulshreshtha, 2011). In addition, the Expert
Group on Informal Sector Statistics (Delhi Group) concluded that “the

8
definition and measurement of employment in the informal sector need to
be complemented with a definition and measurement of informal
employment” (CSO/India 2001). It was emphasized that ‘employment in
the informal sector’ and ‘informal employment’ are concepts, which refer to
different aspects of the ‘informalisation’ of employment and to different
targets for policy-making. One of the two concepts cannot replace the
other. They are both useful for analytical purposes and, hence, complement
each other. However, the two concepts need to be defined and measured in
a coherent and consistent manner, so that one can be clearly distinguished
from the other. Statistics users and others often tend to confuse the two
concepts because they are unaware of the different observation units
involved: enterprises on the one hand, and jobs on the other.
Consequently, it can be argued that the definition and measurement(s) of
the informal economy are yet to be agreed upon. However, with the
progress research it seems that economists are closer today to define and
measure the informal economy than they were few decades ago when the
concept was still fresh. Although informal economy definition varies, as
demonstrated above, the simplest and most agreed upon definition would
be; any market-based production of goods and services, whether legal or
illegal, that escapes detection in the official estimates of GDP or is not
registered into any national measurements. Informality includes both
employers and employees. People can be employed informally; definition is
not exclusive to unregistered self-employed individuals. Any individual
working with any institution without being registered or contracted or
covered by any form of social protection is considered to be informally
employed; noting that defining and understanding the informal economy is
of vital importance for countries as this comprehension has significant
9
implication for any strategy and policy intervention aiming at alleviating
poverty and improving well being.
Albeit the fact that, so far, having exact statistics on informality is somewhat
difficult and un-attainable in most countries, the existing studies appear to
reckon that the size of this economy is expanding. For example, it has been
estimated that the informal economy in Asia is accounting for about 30
percent of nonagricultural gross domestic product and making up more than
50 percent of nonagricultural employment (ADB, 2010).
In India it was estimated that the contribution of the informal sector to the
total net domestic product (NDP) accounted for over 57 percent of total
NDP. The statistics also show that there is considerable variation in the
share of the informal sector in various economic activities. For example, the
share of the informal sector in agriculture was over 90 percent, compared
with less than 6 percent in the activity of electricity, gas & water supply. The
shares of informal sector were also high in the activities trade, transport,
construction, and manufacturing (Kulshreshtha, 2011).
In Indonesia a country report which was published in 2010 on informality in
two main separate provinces found that the average percentage of
informality in the two areas was ranging from 37 percent to 27 percent.
Further, the sectors that mainly employ informally were; agriculture,
accounting, manufacturing, wholesale, retail trade and services. Moreover,
the main contributors to informal employment were with weak educational
background and poverty, to which is similar to most informal economies
around the world. Percentages between males and females working
informally was almost the same. In addition, the results of the 2009
Informal Sector Survey (ISS) in both provinces showed that informal
employment was an integral part of the labor market, accounting for 81.9

10
percent and 75.9 percent. These numbers appeared to indicate the size of
informality in the country as a whole (ADB, 2010).
In Turkey, the growth of the informal labor market has been deemed
inevitable by demand-and supply side factors simultaneously. On the
demand side, increasing integration of Turkey into global markets has
intensified price competition and the pressures to minimize production
costs in the tradable sectors. This has led to a demand-led growth in the
informal employment. On the supply side, massive rural-to-urban migration
patterns, combined with privatization and declining share of public sector
employment, has provided a work force ready to work under the dire
conditions of informal sector employment. The informal sector continues to
account for a substantial and growing segment of the labor market, as high
as 56 percent non-agricultural employment and 36 per cent of non-
agricultural wage earners in 2007. The volume of the informal economy in
Turkey is predicted to be around 32.1percent. Turkey’s informal phenomena
actually is a result of mostly the same issues in other countries; high
unemployment in rural areas, rigid tax and labor laws. Turkey however has
included awareness and media campaigns as part of the solution to the
problem, (Tansel 2000).
Moreover, some sources estimate the share of informal employment in total
employment in some countries in South Asia and Sub-Saharan Africa to be
as high as 90 percent Further, although comparable estimates are not
available for developed countries, evidence suggests that non-standard jobs
and self-employment represent a sizeable and growing share of total
employment in Western Europe and North America; standing at more than
25 percent (WIEGO, 2012).

11
In the Arab world, a detailed Lebanese study was conducted on the informal
economy in 2010. The study goes into all specifics of the informal economy
in Lebanon. It actually depicts reasons behind an overgrowing informal
sector in the economy. The study shows that one of the main reasons for
informality in Lebanon is the political unrest and the continuous wars that
overtook the country. Similar to other informal economies around the
world, Lebanon faces the paradox of informality. On the one hand it can be
assumed that informality in Lebanon has facilitated the economic downfall
especially during the various phases of unrest and turmoil, and on the other
hand it can be assumed that it assisted the country in attempting to
reconstruct its economy after those tough periods. The aforementioned
study shows that the Lebanese informal economy can include a large
component of remittances which is considered to be of the higher
remittances in the world. Another major contributor to informality in
Lebanon is corruption; the fathomless levels of corruption in the country
comprise a serious restraint to sustainable development and an obstacle to
the investment opportunities which do not wish to adopt bribery practices,
hence creating an open window for working informally. A significant
number of the Lebanese workforce works and functions in the informal
sector according to the ILO, 61 percent of Lebanese workers work
informally, the ILO envisions that self-employment in Lebanon is the major
contributor to informality in the country. The large issue of the Palestinian
refugee camps in Lebanon is another component of increased informal
employment in Lebanon. The refugees work and contribute to the informal
economy and are a competition to low paying informal jobs as well. The
study contributes another component of informality to illegal work in
Lebanon and has considered it to be another important factor of it. Illegal
activities include; money-laundering and drug trafficking along with
smuggling, and prostitution. (Rossis, 2011).

12
Another Arab complex economy characterized with different deficiencies is
the Egyptian economy. According to this definition some estimates indicate
that the informal sector in Egypt includes about 82 percent of the small and
micro-enterprises or 70 percent if we exclude the activities conducted
outside establishments. Egypt’s informal economy, or all unlicensed and
unregistered capital and real estate, constitutes at least 34 percent of GDP.
The informal economy in Egypt is comprised of millions of Egyptians who
have decided to operate outside the realm of official bureaucratic formal
economy. Similar to many countries, the primary reason for Egypt’s
unofficial enterprises’ lack of interest in entering the formal economy is the
weakness of legal and institutional framework governing enterprises.
According to the study, the exaggerated taxation system has been another
major component leading to the large percentages of Egyptian informal
sector. The study indicates that both males and females share working
informally closely and no gender is characterized in this economy more.
It is envisioned that the biggest solution to informality in Egypt would be
the structuring and developing of the micro-finance industry. Most of the
informality in Egypt is in the micro-finance corporations and the main
problems faced include; high cost of market entry, the high cost of
maintaining the formal nature due to the high cost of adhering to the tax,
insurance and labor laws. Solutions to such obstacles are part of the reform
needed in Egypt in order to formalize the informal sector. In Egypt’s case,
formalizing the informal sector is a major component of poverty alleviation
initiatives that donor agencies and the Egyptian government are working on,
(Refaat, 2010)
13
Finally, it is estimated that the informal economy around the world is worth
about $10 trillion a year". "That's an astounding figure because what it
means, basically, is that if the informal economy was combined in one
country, it would be the second-largest economy on Earth, rivaling the
United States economy." (Neuwirth. 2010).
Therefore, after reviewing different examples of informality in different
countries, it is important to add the example of studies that mention
Jordan’s informal sector. A World Bank study issued in 2011, resulted that
the informal sector size varies in the Middle East and particularly in the non-
Gulf countries. The estimated the size of the informal sector in the
Jordanian economy to be around 20-25 percent. The IMF in its last report
“Regional Economic Outlook, Middle East and Central Asia” estimated the
size of the informal sector in the Jordanian economy at 26 percent.
As for the reasons for informality, the existing studies argue that some these
reasons are country-specific; thus they vary from country to another and
others are similar in all economies and sectors around the world. The
reasons cited for the growth of the informal economy during the last
decades, often interrelated and to some extent overlapping. These can be
summed up as follows:
Limited absorption of surplus labor: the limited capacity of informal agriculture
activities and the formal economy to absorb surplus labor, together with
increasing numbers of job seekers, has boosted the size of the informal
economy. In countries with high rates of population growth or urbanization,
the informal economy tends to absorb most of the growing labor force in
the urban areas when the manufacturing industry and off-farm activities in
general do not grow at the same pace.

14
Barriers of entry into the formal economy: excessive costs and government
regulations as well as corruption in areas such as business start-up, granting
of business permits and land titles, according to scholars such as Hernando
de Soto (a renowned Peruvian development economist), have forced people
to remain informal.
Weak institutions and redundancies: this includes (i)weak capability of public
institutions to provide education, training and infrastructure as well as other
incentives for structural reforms has contributed to the growth of the
informal economy, and (ii) structural adjustment programs during the
eighties and nineties have fuelled the growth of the informal economy in
developing countries. The disappearance of public sector jobs and the
closure of uncompetitive businesses have forced many laid-off workers to
find other ways to survive.
Capital is favored over labor: global integration privileges companies who can
move easily and quickly across borders to the disadvantage of workers. The
globalization of the world economy as well as global trade and investment
patterns thus tends to privilege capital and disadvantage labor, especially
lower-skilled workers that cannot migrate easily or at all.
Demand for low-cost goods and services: the informal economy has been boosted
by rural to urban migration in conjunction with the demand for low-cost
goods and services from those employed in the formal and informal
economies.
Uncommitted or unaware governments: many governments are unaware of the
economic contributions of the informal economy and the problems found
in it and have therefore found it unnecessary to intervene because of the
belief that the informal economy would die out. The informal economy has
often been left unattended and has thus had few obstacles for its growth.

15
Economic hardship and poverty: poor people do not have access to decent jobs
and do not have the luxury of looking for a job for a long time, therefore
working in the informal sector is a more appropriate decision for them.
More women entering labor markets: there are growing numbers of women that
enter the labor markets outside of agriculture. However, although many
women own or run micro enterprises, only a small number of women
entrepreneurs actually enter the formal economy. In addition, women’s
participation within the informal economy tends to be even higher when the
access and the right to control and own property or land are denied to them.
Mainly because of the lack of appropriate mechanisms that would have
contributed to the absorption of the labor force into the national economy,
the bulk of new employment in recent years in many countries has taken
place in the informal economy. Moreover, all segments of the informal
workforce – self-employed, casual, sub-contract, temporary and part-time
workers and micro entrepreneurs – also appear to be growing.
To conclude, the informal economy can no longer be considered as a
temporary phenomenon. Moreover, it is clear that the informal economy
has a significant job and income generation potential and that the existence
of the informal economy also helps to meet the needs of poor consumers by
providing accessible and low-priced goods and services. Therefore, in order
to intervene in the best way to stimulate sustainable economic growth and
job creation, the informal economy needs to be better understood both by
governments and donors.

16
Chapter Two
The Dynamics of Jordanian Labor Market

17
The Dynamics of Jordanian Labor Market
Introduction:
Despite the fact that Jordan has experienced high economic growth rates in
the past decade, it continues to suffer from persistently high unemployment
rates, especially among educated youth. In further details, the economy
enjoyed an average annual growth rate of 6 percent from 1999 to 2010,
nonetheless the unemployment rate has hovered somewhere between 12
and 16 percent during this period. Unemployment is growing rapidly, in
particular, among educated youth whose numbers are growing swiftly due to
the rapid expansion of education in Jordan. This pattern of “jobless” growth
was exacerbated with the recent slowdown of growth due to the world
financial and economic crisis. GDP growth rates in 2009 decelerated
markedly to stand at around 3 percent; down from 8.2 percent in 2007. This
slowdown appears to have disproportionately affected educated workers
who are increasingly finding themselves in informal employment. Formal
private sector jobs are growing, but from a very low base and therefore
unable to make up for the significant recruitment in public sector hiring that
began in the early 1990s.
In this chapter we employ original data set, the Jordan Labor Market Panel
Survey of 2010 (JLMPS 2010) to study changes in the structure and
evolution of employment in Jordan over the past quarter century. The
JLMPS 2010 offers significant advantages over the regular Employment and
Unemployment Survey (EUS) conducted quarterly by the Department of
Statistics (DOS). Although it is only the first wave of what is to be a
longitudinal survey, it contains a number of retrospective questions that
allow us to reconstruct entire employment trajectories rather than simply get
a snapshot of a single point in time. The main advantage of this approach is
18
that it allows for the examination of flows into various segments of the
labor market and not simply stocks over time. Since flows are much more
sensitive to changes than stocks, it is a powerful tool to study the developing
trends in the labor market.
Economic Growth and Unemployment:
Economic growth rates accelerated significantly in Jordan over the second
half of the past decade, before slowing significantly during the period 2008-
2010 at the heels of the global financial and economic crisis. GDP growth
rates went up from a healthy 4-6 percent in 2000-2003 to an impressive 8-
8.5 percent per annum from 2004 to 2007. Despite this tremendous
acceleration in the growth rates, unemployment rates, which were over 14
percent in the early part of the decade, crept down slightly to over 12
percent, then increased again to over 14 percent in 2005 before falling
slowly to stand around 12 percent at the end of the decade. This level of
responsiveness of the unemployment rate to overall economic growth
appears particularly weak given the very healthy growth rates achieved from
2004 to 2007.
While unemployment rate was particularly sluggish in its response to
economic growth, the employment to population ratio, which indicates how
employment is growing was more responsive, but with a significant lag.
While the acceleration in growth occurred between 2003 and 2004, the
employment to population ratio rose from around 35 percent to around
38.5 percent only two years later. The 2009 slowdown in growth was not yet
reflected much in the employment to population ratio again because of this
lagged response.
The contrasting trend in the unemployment rate and the employment to
population ratio suggests that the labor force was growing rapidly during the
period under consideration and its composition was changing toward groups

19
that tend to have higher unemployment rates, such as educated people. This
can be easily ascertained from an examination of the composition of the
working age and employed populations by educational attainment. The
proportion of illiterates and those who can only read and write in the
working age population has declined from about 18 percent to around 12
percent over the decade, at the same time as that of those with basic
education has been stable at about 50 percent and the proportions of those
with secondary and post-secondary education have either been rising slowly
or stable. With contrast, "university graduates" was the one group whose
proportion has increased rapidly from about 8 percent to 13 percent of the
working age population in only ten years.
The composition of new entrants in Jordan has changed dramatically since
the 1960s. In the 1960s, there was a precipitous decline in the proportion of
illiterates and a rapid increase in the share of those with basic and secondary
education. This rapid progress was stalled somewhat in the 1970s, but the
decline in illiterates resumed its fast decline since the 1980s, so that now
fewer than 5 percent of new entrants are illiterate. In the 1980s and early
1990s, the improvement in education essentially translated in the rapid
growth of the share of those with basic education. However, since the mid
1990s, that share stabilized and the share of those with university degrees
took off. The share of those with university degrees rose from 15 percent of
new entrants to over 30 percent in less than two decades. The notable
increase in the share of university graduates among new entrants is reflected
in the share of university graduates among the unemployed, who tend to be
young new entrants, and hence a better reflection of the flow into the labor
market than the stock of workers. The share of those with the first
university degree and above among the unemployed hiked from about 12
percent in 2000 to over 30 percent in 2010.

20
The inability of the Jordanian economy to absorb the growing number of
university graduates is linked to the shifts that were occurring in the
structure of employment away from the public sector and in favor of more
private sector employment. This is an issue which will be explored in a
greater detail below. For now, we can ascertain this fact from Employment
and Unemployment Survey data, which tracks the stock of workers over
time by sector. The share of the government in total employment fell in the
mid 1990s from 38 percent to about 32 percent and then remained at that
level thereafter. Even with a fixed proportion of overall government
employment and a growing share of educated workers, the probability that a
given educated worker will get a government job declines significantly.
The Dynamics of the Labor Market:
Public sector employment contributes about a third of total employment in
Jordan. Just over 20 percent of employment is in formal private wage work
and over 25 percent is in informal private wage work despite significant
efforts in recent years to increase the coverage of the social security system.
Under 20 percent of employment is in own account work, as employers and
self-employed workersm and a tiny fraction is in unpaid family work.
Female workers in Jordan are more likely to be working for the government
and more likely to be in formal wage work than males. They are significantly
less likely to be employers and self-employed workers.
JMPLS shows that nearly all government workers (97 percent) have
permanent contracts, whereas only 70 percent of formal private sector wage
workers are permanent. On another hand, almost all employers/self-
employed workers (97 percent) are informal in the sense that they do not
have social security coverage, as are all unpaid family workers.
21
The fluctuations in government employment were mirrored almost perfectly
into the second largest component of the Jordanian labor market, namely
informal private wage employment. The share of that segment increases
whenever that of government jobs declined and vice versa. The share of
formal private sector employment rose slowly from a very low base through
the 1960s, 1970s and 1980s and accelerated significantly in the 1990s and
2000s; increasing from less than 10 percent of new entrant jobs in 1990 to
about 22 percent by 2010.
To assess whether the changing structure of employment is something that
only affects new entrants and their pattern of insertion into the labor market
or is a deeper change in the structure of employment, we examine the share
of each type of job 5 years and 10 years after entry in comparison to what it
was at entry. Figures show that most people who got government jobs up to
the 1990s got them as their first job and remained in them. Starting in the
1990s, there was significant delay in obtaining government jobs after entry.
We can see that from the fact that the proportion of government jobs at
entry fell from about 45 percent in the late 1980s to 25 percent in the late
1990s, but many of these new entrants who failed to get such jobs at first
got them five and ten years after entry. The recovery in government
employment in the 2000s was also pronounced five and ten years after entry.
With regards to informal private wage employment segment, as suggested
earlier, the sector rises whenever government employment falls and vice
versa, but there appears to be a dynamic of formalization over workers’
careers. Although the proportion of informal works rose sharply at entry
starting in the late 1980s, five years into workers’ careers, it had hardly risen
at all and ten years after entry it has even fallen over time. This suggests that
the surge in informal employment observed in the late 1980s was in formal

22
private enterprises that eventually registered their workers with the Social
Security Corporation.
A closer examination of the trend in formal employment in Jordan in recent
years reveals, however, that the growth of permanent formal private jobs
stalled in the 2000s and that of jobs with temporary or no contracts
accelerated. The share of first jobs that were permanent formal in the
private sector stabilized at around 10 percent of all first jobs since the mid
1990s, but the share of temporary formal jobs jumped from around 7
percent to 13 percent in the same period. Essentially Jordan managed to
curb the growth of informality by creating more flexible, but also more
precarious, forms of formal private employment.
Private Wage Employment
Nearly one third of the private wage employment is in establishments of
fewer than 5 workers and just under one half in enterprises of fewer than 10
workers. If non-wage workers are included, the proportion of workers in
establishments of fewer than 10 workers rises to 57 percent. Enterprises of
more than 100 workers employ about a quarter of total private wage
employment; leaving about 30 percent in small and medium enterprises of
10 to 99 workers.
Workers in enterprises of fewer than 5 workers are almost entirely informal
(92 percent). This is partly due to the fact that previous social security law
exempted enterprises of fewer than five workers from registration for the
social insurance coverage. The share of informal workers then drops steadily
from 68 percent in the 5-9 category to 10 percent in the 100+ worker
category.

23
Within formal wage work, the proportion of permanent workers hovers
between 60 percent and 65 percent for the intermediate size categories (5-9
workers to 50-99 workers), but increases to 77 percent for the 100+ worker
category. This suggests that while the largest firms can provide the most
stable and protected forms of employment, they still like to maintain a
margin of flexibility by either hiring workers informally (10 percent of their
employment) or using temporary contractual forms (21 percent). Overall,
only 45 percent of private sector wage workers in Jordan are formal and
only 31 percent have permanent formal contractual arrangements.
Formal employment in Jordan is associated with the scale of non-wage
benefits that is likely to make it attractive to educated workers. Our
definition of formal employment is based on the presence of social security
coverage, but a question still remains whether it comes with other non-wage
benefits, such as various types of paid leaves or medical insurance. We have
also distinguished between permanent formal work and other formal work
based on the availability of an indefinite duration contract.
Most permanent formal jobs come with either full paid leave (72 percent) or
some other kind of paid leave (20 percent). However, other formal
employment, which tends to be more precarious is much less likely to be
accompanied by paid leave, with up to 24 percent of these jobs not having
any kind of leave. As expected, informal jobs, which make up 55 percent of
wage and salary jobs in the Jordanian private sector, are most typically not
accompanied by paid leaves. Overall, only 36 percent of Jordanian private
sector wage workers get full paid leave and up to 44 percent don’t get any
kind of paid leave.
Finally, it can be concluded that the main problem facing the Jordanian
labor market appears to be the mismatch between the kinds of jobs that are
being created in the private sector and the expectations of the very rapidly

24
growing supply of educational system graduates. Temporary and informal
jobs in small private sector enterprises generally do not come with the kinds
of non-wage benefits and stability that university graduates in Jordan have
come to expect. This mismatch is currently being accommodated by
continued high unemployment rates among graduates and the employment
of large numbers of foreign workers to take the jobs that are shunned by the
increasingly educated Jordanian workforce.
Characteristics of the Informal Sector
It is evident that the practices of business startup and business licensing are
not encouraging to reduce the informal sector size. The results and findings
concluded from focus group, with youth, women, people with different
occupations in the center, north and south regions and the one on one
interviews with experts, civil society representatives, officials, and specialists
in the academia showed that individuals who work in the informal sector are
unwilling to register their businesses due to various reasons; including, but
not limited to, the feeling that the services provided to them by related
government institutions as well civil society institutions, such as
municipalities and chambers of commerce and industry, do not balance
what needs to be paid while registering. Others are completely unaware of
the benefits they would get from the social security and from the labor law.
This lack of awareness was evident throughout the segments and in all the
different regions of the Kingdom. The issue of high taxes enforced on
registered establishments kept showing throughout researching for this
study. The lack of awareness has generally contributed to increasing the
informal sector. Many individuals who operate in the informal sector are not
aware that this is an informal sector, they don’t know that they should be

25
registered, and if they know about the registration then they don’t know
where to head or why, others just don’t register due to the cost of
registering, which is considered to be useless as nothing is given in return to
what is being paid.
Further, one of the reasons of the widening informal sector can be due to
the lack to the access of finance issue. This issue is divided into more than
one component; some citizens are unaware of the whereabouts of the
sources of funding, whether the government funds and programs or the
national microfinance enterprises. On another hand, there is a feeling of
infeasibility, due to the high interest rates, required collaterals, and short
grace periods. In addition, some individuals avoid microfinance institutions
(MFIs) because the belief that their operations go against Sharia; unaware of
the possibility to get funds based on Sharia rules from several MFIs. These
issues make the access to finance difficult especially to youth entrepreneurs.
Generally speaking, youth are directed towards informal employment due to
different reasons. In the governorates, youth referred their lack of finding a
decent job in the formal sector to the fact that private sector establishments
are few and limited in their specialization. Many of them attributed that their
skill or line of education does not match what is offered in the private
sector. Others attributed their lack of finding a job due to distance to
workplace, lack of reasonable benefits, long working hours and low salaries.
Working in the informal sector gave them the opportunity to work, obtain
needed cash and customize their own working environment. Additionally, it
was evident that youth not only face problems in finding decent jobs, but
also have no faith in the private sector; manly its job sustainability. They also
feel that if they have a specific business idea, they are unable to reach to the
right entity that would support and nurture this idea into a business.

26
On the female front, both the interviews and the focus groups indicated that
women are directed to the informal sector due to reason that in some cases
are similar to the youth and in other cases specific to the females
themselves. Females, especially married ones with families, find it easier to
work from home or informally in order to meet their families’ needs and
requests. Women with babies are unable to leave them alone and cannot
afford the cost of daycare or paying someone to watch over them. This
seemed to be a constant obstacle facing females seeking work. Another
common issue that in some cases females are not comfortable working in
certain environments with long working hours. Others mentioned that their
family and traditions still prevents them from getting a job at certain sectors.
The lack of part-time jobs in the country was also mentioned. Having part
time jobs with decent working criteria would help increasing female
employment overall
Another general aspect that was general amongst focus groups, was that
individuals have no trust when it comes to employment initiatives and
programs. They additionally, do not trust the government and its
facilitations, exemptions and announced programs. There is a common
belief that NGOs and current employment programs are not sustainable and
therefore are not completely trust worthy. As mentioned above, there is also
a lack of trust in the private sector. It is envisioned that working in the
private sector is not sustainable, will be faced with different kinds of
harassments and is not fair financially.
Interestingly enough, the informal sector is no longer seen as a low skilled
sector. Currently additional sectors add on to the informal low skilled
sectors. The existing freelance consultancies that now operate in the main
cities are to be included in the informal sector. A new caliber of individuals
now operate in informal sector including highly educated individuals.
Another form of educated people’s informality exists in individuals working
27
as IT technicians who operate from their homes. This being said, the
addition of skilled individuals working informally shows the extent of
needed amendments to the labor laws and market in order to formalize the
informal.
Chapter Three

28
The Dynamics of the Informal Sector

29
The Dynamics of the Informal Sector
Introduction:
This chapter aims at showcasing the reality and the size of the informal
sector in Jordan, in addition to its geographic distribution between the
Kingdom’s governorates. It will also demonstrate the relationships between
this sector and SMEs and the legal status of informal establishments and the
relation between the informal sector.
Informal employment stood at around 44 percent of the total employment
in the Jordanian economy in 2010, whereby the percentage of informal
employment in the private sector has reached 55 percent of the total
employment in this sector. Furthermore, the percentage of informal
employment amongst working males stood at around 23 percent compared
with about 15 percent of informal employment amongst working females in
2010.
Certain economic activities employed around 71 percent from the total
employment in the informal private sector. These activities were; crafts (30
percent), services and sales (24 percent), and machinery technicians
(17percent). By contrast, the percentage of informal employment in higher
administrative activities was very modest; standing at merely 0.4 percent
from the total informal employment in the private sector in 2010.
On the sectoral level, 30 percent of the informal employment was
concentrated in "retail and motor bike and vehicle maintenance", 18.6
percent in manufacturing, 11.7 percent in "transportation and storage", and
11.1 percent in construction. On the other hand, it was found that three
sectors and economic activities employed only 0.6 percent from the total
informal labor in the private sector; namely "electricity, gas, steam, and air

30
conditioning supply", "water, sewage and waste management" and
"promotion and entertainment". In further detail, the wholesale and retail
sector and the vehicle maintenance sector were the primary employers of
male informal employment (32.4 percent of total males working in the
informal private sector), on the other hand the primary sector that employs
female informally was medical and social services with a percentage of
(17percent) of the total female employment in the private sector. Moreover
agriculture, forestry and fishing came in third place composing
(16.4percent), followed by the education sector (16.1percent).
Despite the previous percentages, Jordan’s informal sector size holds a
middle spot if compared with the Arab countries according to the
“percentage of labor force not covered by social security from total labor
force” criteria. This percentage comes at (67.2 percent) in Jordan, while it
skyrocket to (90 percent) in Yemen composing the highest of the Arab
countries, with the lowest was registered in Libya; composing (34.5 percent).
(Asaad, 2011). As for the “Schneider Index” of estimating the size of the
informal sector as a percentage of GDP, the statistics reveal that the
aforementioned ratio totaled (20.9 percent) in the Jordanian economy
which is at the low ranks between the Arab countries; for instance this ratio
stood at (39.2 percent) in Tunisia. (Schneider, 2002)
The relative distribution for informal labor force reflected the nature of
population density between rural and urban areas in Jordan; whereby around
83 percent of Jordanian labor are concentrated in the urban areas versus 17
percent, only, in the rural areas. Moreover, it was revealed that 47.5 percent
working at the urban areas are informally employed and 28.3 percent are
informally employed from the total labor in the rural areas.

31
The same percentage can be applied on the gender distribution of
employment in Jordan, while males compose around 83 percent of the
Jordanian labor force, 47.8 percent of them are considered to be working
informally compared with 26.7 percent of working females.
The statistics appear to indicate that there are no linkages between the
distribution of labor force in Jordan according to the different age groups
and the percentage of informal employment amongst each age category. For
instance; the age category (55-64 years) composes only 5 percent of the
Jordanian work force but of which around 64 percent are informally
employed. This is most probably caused by the fact that most of workers in
this age group have already left the social security system coverage or other
pension systems; i.e. working after retirement. On another hand, informal
employment within the age group (25-34 years) amounted to 36.9 percent;
noting that this category composes 35.8 percent of the total Jordanian work
force.
The striking finding was the low levels of education of the informally
employed individuals in the Jordanian labor market; it is estimated that
around 72 percent of this segment are of basic education level or lower.
Additionally, the majority (81.7 percent) of the informal employment fell
under the category of paid workers. The percentage of informal
employment from the total workers was higher in the following categories:
self-employed workers (98.5 percent), employers (94.6), and unpaid workers
(100 percent).
Informal Sector and SMEs
It is noted that there is disparity which exists regarding the participation of
the informal sector in the economic activities in the Jordanian economy.
32
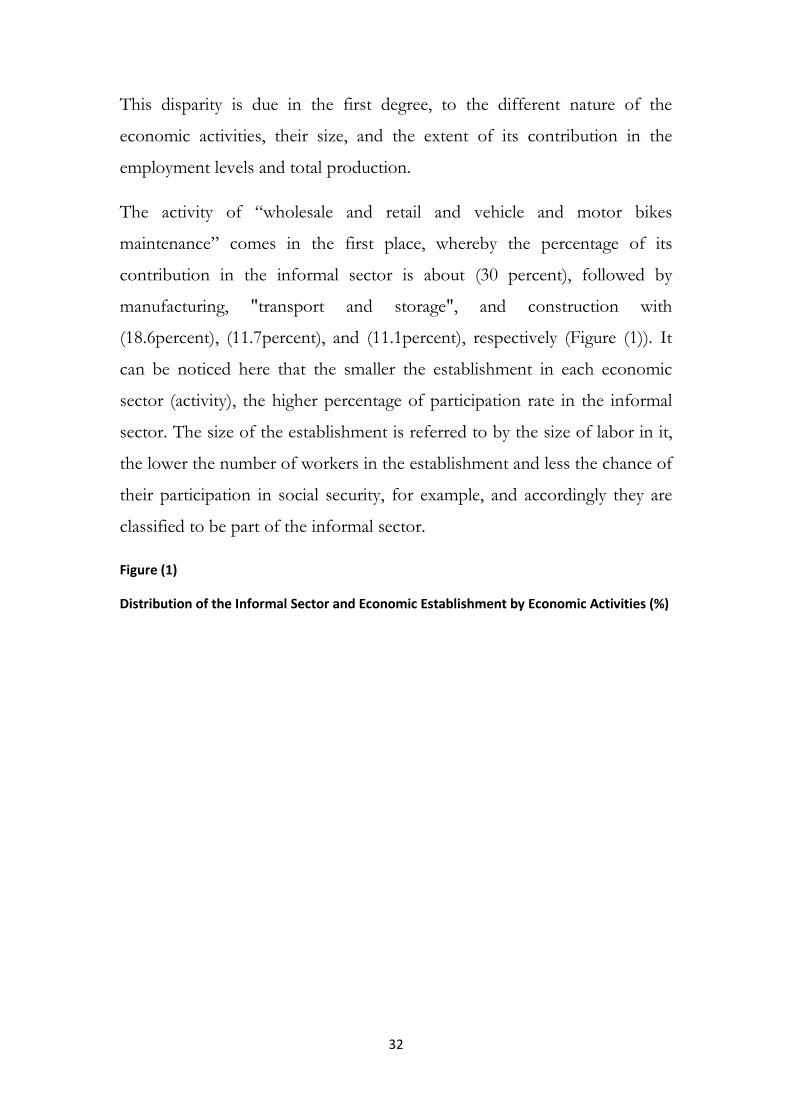
This disparity is due in the first degree, to the different nature of the
economic activities, their size, and the extent of its contribution in the
employment levels and total production.
The activity of “wholesale and retail and vehicle and motor bikes
maintenance” comes in the first place, whereby the percentage of its
contribution in the informal sector is about (30 percent), followed by
manufacturing, "transport and storage", and construction with
(18.6percent), (11.7percent), and (11.1percent), respectively (Figure (1)). It
can be noticed here that the smaller the establishment in each economic
sector (activity), the higher percentage of participation rate in the informal
sector. The size of the establishment is referred to by the size of labor in it,
the lower the number of workers in the establishment and less the chance of
their participation in social security, for example, and accordingly they are
classified to be part of the informal sector.
Figure (1)
Distribution of the Informal Sector and Economic Establishment by Economic Activities (%)

33
0.9
18.6
0.1 0.2
11.1
30
11.7
3.51.4 0.4 0.4 1.3 0.9 0.4
3.92.6
0.3
5.2
0.8 0.70.1
14.3
0.0 0.0 0.8
57.5
0.8
6.2
0.6 0.31.7
3.6
0.6 0.0 1.53.2
0.7 2.0
6.2
0.00
5
10
15
20
25
30
35
40
45
50
55
60
65
Distribution of the Informal Sector and Economic Establishment by Economic Activities
Informal Sector % Active Economic Establishment by Economic Sector
On another hand, the contribution of the informal sector is low in many
sectors and economic activities. The lowest participation rates are shown in
the following activities: “electricity, gas, steam and air conditioning supply"
(0.1 percent), “water, sewage and waste management supply" (0.2 percent),
and “arts, promotion and entertainment" (0.3 percent). In consequence, it
can be concluded that the percentage of informal sector participation in
economic activities is inversely proportional with the concentration ratios in
the sector and its market power. The percentages specific to the informal
sector participation in economic activities came in to be in agreement, to a
large extent, with “the percentages of number of establishments in each
activity to the total number of establishments”, whereby the percentage of
the number of establishments in each activity to the total number of
34
establishments was the highest in: “wholesale and retail and vehicle and
motor bike maintenance”; totaling (57.5 percent) which goes in line with the
highest percentage in the informal sector for the same activity; standing at
(30 percent).
Manufacturing came in second place in relation to percentage of the number
of establishments in each activity to the total number of establishments
(14.3 percent), in addition it came in second place for the rate of informal
sector participation in it (18.6 percent), this can be clarified more by
calculating the correlation coefficient between the two mentioned
percentages of the 20 economic activities; which was estimated to reached
around (0.85).
On another front, the percentage of the participation of the informal sector
in economic activities is directly proportional with the percentage of SMEs
in these activities. The highest participation rate of the informal sector,
which was in “wholesale and retail and vehicle and motor bike maintenance"
(30 percent), was accompanied with the highest rate to the number of SMEs
to the total of establishments (100 percent). This consistency between the
two percentages applies mostly to the rest of the economic activities,
whereby the correlation coefficient for the previous percentages reached
(0.174), (Figure (2)). These percentages reflect an inability of establishments
regarding registering their employees in the social security system and this
applies to the rest of the services that these establishments provide to their
workers. Many SMEs do not provide social and health insurances to their
workers, even if this led to direct violations with the labor and social security
laws.
On another level, this is not applicable on large establishments; in this case
it was found that the percentage of these establishments to each economic
activity is inversely related with the informal sector participation in each

35
activity. For example, the highest percentage to the number of large
establishments to the total number of establishments was (55.6 percent) in
the "water, gas, steam and air conditioning supply" activity which is the
same activity that witnessed the lowest informal sector participation; coming
in at (0.1 percent), where the correlation coefficient for the mentioned
percentages amounted to (-0.174), ((Figure (2)).
Figure (2)
Distribution of Small Medium and Large Establishment by Economic Activities (%)
95.7 99.6
44.4
100.0 99.0 100.0 99.5 99.8 99.4 95.1100.0 99.9 99.9
92.798.8 99.7 99.9 99.9 100.0 100.0
0.9
18.6
0.1 0.2
11.1
30
11.73.5 1.4
0.4 0.4 1.3 0.9 0.4 3.9 2.6 0.3 5.20.8 0.70.0
20.0
40.0
60.0
80.0
100.0
120.0
Small and Medium Establishment % Large Establishment % Informal Sector %
Distribution of Small Medium and Large Establishment by Economic Activities
As for the informal sector participation in the establishments in terms of the
number of establishments specific to this sector to the total number of
establishments in the Jordanian economy, the participation rates varied

36
between SMEs, on the one hand, and large establishments, on the other.
SME’s informal percentage to the total number of establishments stood at
(57.6 percent); the highest in "wholesale and retail and vehicle and motor
bike maintenance". With contrast, some economic activities did not have
any SMEs such as: "electricity, gas, steam and air conditioning supply",
"water, sewage and waste management supply". It is noticed here that the
above-mentioned percentage is positively associated with the informal
sector participation rate in economic activities; reaching 30 percent.
Further, the percentage of large informal establishments in each economic
activity to the total number of establishments in it stood at 36.6 percent,
while some activities remained the highest.
Regarding the percentage of large informal establishments in each economic
activity to all establishments, it was the highest in manufacturing with a
percentage of (36.6 percent). On the other side, some economic activities
did not contain large size establishments such as "water, sewage supply",
"waste management" and household. Figure (3) shows that the
manufacturing sector has a high percentage of informality (18.6 percent) and
at the same time had the highest percentage of large size establishments
(36.3 percent). This can be explained by the nature of the manufacturing
industry whereby its needs of capital, labor and intermediate inputs differ
according to the nature of the establishment. For example, some
manufacturers need one worker while other kinds need a large number of
workers similar to the cement industry.
Figure (3)

37
Distribution of Informal Sector and Small and Medium Establishment by Economic Activities (%)
0.1
14.2
0.0 0.0 0.8
57.6
0.86.2
0.6 0.2 1.7 3.6 0.6 0.0 1.5 3.2 0.7 2.06.2
0.01.6
36.6
2.00.0
4.98.5
2.49.3
2.48.1
0.4 2.8 0.4 1.2
11.46.5
0.4 0.8 0.0 0.0
0.9
18.6
0.1 0.2
11.1
30
11.7
3.5 1.4 0.4 0.4 1.3 0.9 0.4 3.9 2.6 0.3
5.2
0.8 0.70.0
10.0
20.0
30.0
40.0
50.0
60.0
70.0
Small and Medium Establishment To the total of SMEs Large Establishment To the Total Large Establishment Informal Sector %
Distribution of Informal Sector and Small and Medium Establishment by Economic Activities
Informal Sector and Geographic Distribution
The most important characteristic of establishments in Jordan lies in the fact
that most of them are SMEs; in 2010 around 99.8 percent of establishments
employed less than 250 workers. Further, it is noticed that some
governorates such as Madaba, Ajloun, Karak, Ma’an and Tafileh do not
have establishments with more than 250 workers, Figure (4).
Figure (4)
Distribution of Economic Establishment by Employees Category and Governorate (%)

38
99.7
99.9
99.9
100.0
99.9
99.999.9
100.0
100.0
100.0
100.0
99.9
Distribution of Small and MediumEconomic Establishment by Employees Category and Governorate
Amman
Balqa
Zarqa
Madaba
Irbid
Mafraq
Jarash
Ajlun
Karak
Tafiela
Ma'an
Aqaba
As for the relative distribution of establishments according to work and
governorate categories, the capital (Amman) incubates around 45 percent of
establishments that employ less than 250 workers and 73.6 percent of
establishments that employ 250 workers or more. The Governorate of Irbid
comes in second place; hosting 17.2 percent of establishments of less than
250 workers and 6.5 percent of establishments of 250 workers or more,
followed by Zarqa Governorate in which the two percentages mentioned
above stood at 15.2 percent and 10.6percent, respectively. Additionally,
there are three other Governorates; namely Ajloun, Tafileh and Ma’an that
do not incubate more than 1.7 percent, 1.1 percent and 1.6 percent of
establishments that employ less than 250 workers, respectively. It can be
inferred from figure (5) that the middle region of the Kingdom (Amman,
Balqa, Zarqa and Madaba Governorates) hosts 67.6 percent of
establishments that employ less than 250 workers and 88.7 percent of
establishments that employ more than 250 workers. As for the northern
region of the Kingdom (Irbid, Mafraq, Jerash and Ajloun Governorates) the

39
mentioned above percentages totaled 24.1 percent and 8.9 percent,
accordingly. The same percentages for the southern region of the Kingdom
(Karak, Ma’an, Tafileh and Aqaba Governorates) were 8.3 percent and 2.4
percent, respectively. These percentages go hand in hand with size of the
economic activity in each region as well as the population density in those
regions where their relative distribution according to regions in 2011 in the
middle, northern and southern regions stood at 72 .8percent, 27.8 percent
and 9.4 percent, consequently.
Figure (5)
Distribution of Economic Establishment by Employees Category and Governorate out of Total Establishment in each Category (%)
44.9
5.2
15.2
2.3
17.2
3.0 2.2 1.7 3.4 1.1 1.6 2.2
73.6
4.110.6
0.4
6.51.2 1.2 0.4 2.0
0.0
10.0
20.0
30.0
40.0
50.0
60.0
70.0
80.0
Amman Balqa Zarqa Madaba Irbid Mafraq Jarash Ajlun Karak Tafiela Ma'an Aqaba
Distribution of Economic Establishment by Employees Category and Governorate out of Total Establishment in each Category
Employees Category 1-249 Employees Category ≥ 250
As for the relative distribution of the SMEs in the informal sector according
to governorates and economic activity, it was estimated that majority of
these establishments was located in Amman and in most economic
activities. The percentage of the capital’s control over economic activity is
characterized with the percentage of the number of establishments to the
total establishment count in the Kingdom; ranging between 34 percent in

40
“mining and quarrying” sector and 89 percent in “organizations and foreign
agencies activities” sector. Furthermore Zarqa Governorate comes in
second place in terms of the number of economic establishments located in
it; hosting 20 percent of establishments in “water and sewage supply” sector,
22 percent of "transportation and storage" sector establishments and 5
percent in each of "financial and insurance" and "public administration and
defense" sectors. The Governorate of Irbid takes the third rank in terms of
number of informal establishments; the percentage of establishments in this
Governorate amounted to 18 percent in the "wholesale and retail and
vehicle maintenance activity", 19 percent in the education sector and 19
percent in the manufacturing sector; noting that it did not host any
establishments in the specialization of "organizations and foreign agencies
activities". Figure (6).
Figure (6)
Distribution of Informal Sector and Small and Medium Establishment by Economic Activities and Nationality of Establishment (%)
0.00
10.00
20.00
30.00
40.00
50.00
60.00
70.00
Informal Sector Jordanian Non Jordanian
Distribution of Informal Sector and Small and Medium Establishment by Economic Activities and Nationality of Establishment
As for the rest of governorates, there are informal sector establishments in
very modest and few numbers, for example all of those governorates did not
have establishments for the "organizations and foreign agencies activities"

41
sector. Interestingly enough, Mafraq Governorate had 24 percent of the
total informal sector establishments in the mining and quarrying activity and
this is a relatively high percentage which is probably due to the geographic
nature of the Governorate. Other than that, the percentages ranged for the
rest of governorates (except Amman, Zarqa, and Irbid) between 0 percent
and 11percent.
Informal Sector and Establishments’ Nationality
It can be concluded that most establishments operating in the informal
sector are Jordanian establishments and very few actually are non-Jordanian.
Moreover, there are some differences in the relative distribution for the
informal sector’s SMEs according to economic activity and nationality of the
establishments; the nationality of the establishments in some economic
activities were completely Jordanian; namely "gas and electricity supply",
"water and sewage supply", "public administration and defense" and "arts,
promotion and entertainment" activities. On another hand, the
"organizations and foreign agencies" sector composed 33.3percent of non-
Jordanian establishments. Moreover, the "mining and quarrying" sector
came in the second in terms of non-Jordanian establishments with a
percentage of 2.1 percent, followed by the "financial and insurance"
activities with a percentage of 1.5 percent. Figure (7).

42
Figure (7)
Distribution of Informal Sector and Small and Medium Establishment by Economic Activities and Nationality of Establishment in Each Sector (%)
97.87
99.91
100.00
100.00
99.67
99.94
99.68
99.93
99.37
98.5299.89
99.89
99.88
100.00
99.83
99.92
100.00
99.90
99.9566.67
Distribution of Informal Sector and Small and Medium Establishment by Economic Activities and Nationality of Establishment in Each Sector
Mining and quarrying
Manufacturing Industries
Electricity, gas, steam and air condition
Water supply; sewage, waste management
Construction
Wholesale and retail trade; repair of motor vehiclesTransportation and storage
Accommodation and food service activities
Information and communication
Financial and insurance activities
Real estate activities
Professional, scientific and technical activities
Administrative and support service activities
Public administration and defense activities
Education
Human health and social work activities
Arts, entertainment and recreation activities
other service activities
Activities of Households
Activities of extraterritorial organization
Informal Sector and Establishments’ Bookkeeping:
There seems to be a dominant trait on the informal sector and its
establishments, the trait is that the lack of use book-keeping and this seems
rational and logical, where such establishments are not registered and have
no industrial or commercial records. To restructure the previously
mentioned sectors and economic activities (as shown in previous tables) into
five sectors only (figure 8), we find that the informal sector composed 30
percent of the foreign trade sector, 21.7 percent of the services sector, 19.5
percent of the manufacturing sector, 11.7 percent for the transport sector,
and 11.1 percent in the construction sector. It is noticed that in reference to

43
the relative distribution for the informal sector and the SMEs according to
economic activity and keeping accounting records, that whenever the
informal sector participation rate in the economic activity rises the more the
establishments in the informal sector that do not keep accounting records.
For example, if the informal sector’s high participation in the internal trade
activity of 30 percent and on the other hand the percentage of
establishments that do not use accounting records is the highest in the same
sector, i.e. 94.8 percent, it is found that the "finance, banking and insurance"
sector registered the lowest participation of the informal sector (0.4 percent)
and the highest to use accounting records (73.9 percent).
Figure (8)
Distribution of Informal Sector and Small Medium Establishment by Economic Activity and Use of Regular Register of Accounting (%)
19.511.1
30
11.721.7
0.48.1
30.1
5.2
29.0
11.4
73.9
91.9
69.9
94.8
71.0
88.6
26.1
0
20
40
60
80
100
Industry Construction Internal Trade Transportation Services Financial & Banks & Insurance
Distribution of informal sector and small medium establishment by economic Activity and the Use of Regular register of accounting
Informal Sector % Use Do not Use
Legal Status of Establishments in Informal Sector:

44
Most existing establishments in the informal sector were distributed mainly
into three forms according to its legal status: individual establishments,
solidarity establishments and limited liability establishments.
The figures indicate that 95.8 percent of establishments in "household
activities" sector were individual establishments, 89.4 percent of the
"wholesale and retail and vehicle maintenance" sector, 84.8 percent of
establishments in the "manufacturing" sector, and 84.3 percent in the
"vocation, technical and scientific activities" sector. The lowest percentage
of individual establishments was in the "financial and insurance" sector;
where it reached (20.9 percent). However, there was no single establishment
in the "electricity, gas, steam and air conditioning supply" sector.
Figure (9) clarifies that the most existence for solidarity establishments was
concentrated in the "transportation and storage" with a percentage of
(35.2percent), followed by the "public administration and defense activities"
sector with a percentage of (34.1percent), and the "financial and insurance
activities" sector with a percentage of (23.4percent). Finally, the lowest
percentages of sectors that have solidarity establishments were concentrated
in the "household activities" sector with a percentage of (3.8 percent). As for
the limited liability establishments, it was estimated that around one third of
existing establishments were concentrated in "electricity, gas, steam and air
conditioning supply" with a percentage (33.3 percent), "financial and
insurance activities" sector with a percentage of (25.9 percent), "public
administration and defense activities" sector with a percentage of
(24.4percent). Further, the lowest percentage of solidarity establishments
was concentrated in the "household activities" sector; amounting to (0.30
percent).

45
Figure (9)
Distribution of Informal Sector and Small and Medium Establishment by Economic Activity and Legal Status (%)
56.4
84.8
60.0
60.2
89.4
46.8
84.2
69.5
20.9
76.2
84.3
72.7
31.7
67.0
83.6
72.3
88.3
95.8
22.3
10.6
11.1
20.0
21.6
8.3
35.2
10.5
9.5
23.4
13.1
8.0
11.3
34.1
17.9
3.0
13.0
3.8
3.8
11.7
3.6
33.3
11.1
14.7
1.8
13.0
4.4
17.6
25.9
8.0
6.4
12.5
24.4
6.2
1.3
5.7
1.3
0.3
0.0
0.1
0.0
2.2
0.1
0.0
0.0
0.0
0.3
0.7
0.1
0.3
1.2
2.4
5.7
10.8
7.1
5.8
0.0
100.0
0.0 20.0 40.0 60.0 80.0 100.0 120.0
Mining and quarrying
Manufacturing Industries
Electricity, gas, steam and air condition
Water supply; sewage, waste management
Construction
Wholesale and retail trade; repair of motor vehicles
Transportation and storage
Accommodation and food service activities
Information and communication
Financial and insurance activities
Real estate activities
Professional, scientific and technical activities
Administrative and support service activities
Public administration and defense activities
Education
Human health and social work activities
Arts, entertainment and recreation activities
other service activities
Activities of Households
Activities of extraterritorial organization
Individual Partnership Limited Liability Limited Partnership Public Joint Stock Private Joint Stock Cooperative Society Active Foreign Branch Non-Profit Other
Distribution of Informal Sector and Small and Medium Establishment by Economic Activity and Legal Status
The percentages regarding the legal status of the informal sector
establishments can be demonstrated as follows:
1. 4.9 percent of the "public administration and defense activities" are
solidarity establishments
2. Regarding the "electricity, gas, steam and air conditioning supply"
sector it was shown that 55.6 percent of its establishments are public
shareholding establishments. However, this form of establishments
accounted for 15.5 percent of the financial and insurance activities.

46
3. The public shareholding establishments made up around 4.3 percent
of the establishments in the "mining sector", additionally; the private
shareholding establishments accounted for the same percentage of
the same sector.
4. 3.7 percent of establishments in the "financial and insurance" sector
and 2.4 percent establishments in the "public administration and
defense" activities took the form of cooperative association.
5. The existing establishments that are branches of foreign companies
made up 3.0 percent of the total informal sector establishments in the
"financial and insurance activities" sector and 2.2 percent of the
establishments of the "water, sewage and waste management supply"
sector.
6. The non-profit trait applied to 10.8 percent of establishments of the
"human health and social services activities" sector and 7.1 percent of
the establishments in the "arts, promotion and entertainment
activities" sector.
7. It was shown that all the establishments of the "organizations and
foreign agencies activities" sector were in the form non for profit
establishments.
Informal Sector and Establishments Revenues:
Overall it was evident that the annual revenues created by most
establishments in the informal sector don’t exceed JD 40 thousand, which is
reasonable given the size of such establishments.
In relation to the establishments that create annual revenues of less than JD
5 thousand, they accounted for a third of the "organization and foreign
47
agencies activities" sector, and 54.4 percent of the establishments of the
"household activities" sector and 36.1 percent of establishments of the "real
estate activities" sector. On the other hand, the establishments which create
annual revenues between JD 5 – 10 thousand made up 36.9 percent of
establishments in the "human health and social services activities" sector
and 35.5 percent in the "establishments of the vocational, technical and
scientific activities" sector.
The percentage of the establishment distribution comes in the two revenue
categories, i.e. between JD (10001-20000) and JD (20001-40000). These two
categories account for most of the average revenue in the informal sector
establishments. The highest percentage for the first category was (25
percent) for the "electricity, gas, steam and air conditioning supply" sector
followed by "health and social services activities" sector (22.3 percent), and
the education sector (20.2 percent). As for the second revenue category, it
was highest in the "electricity, gas, steam and air conditioning supply
sector"; amounting to (25percent), followed by "public administration and
defense" with (18.4 percent) as well as "transportation and storage sector"
with (18.1percent), Figure (10)

48
Figure (10)
Distribution of Informal Sector and Small and Medium Establishment by Economic Activity and Annual Revenues Category (%)
3.3
31.1
0.0
17.8
30.9
35.5
13.3
33.2
25.5
9.8
36.1
30.5
42.5
13.2
20.2
22.5
30.2
62.1
54.4
66.7
4.4
25.0
0.0
15.6
16.5
23.8
19.8
23.4
25.9
8.0
22.7
35.5
21.6
10.5
23.1
36.9
25.6
21.3
30.1
11.1
7.8
16.8
25.0
13.3
8.8
16.8
19.0
16.9
18.7
11.9
13.4
16.3
14.1
15.8
20.2
22.3
18.6
8.8
10.7
0.0
14.4
12.9
25.0
17.8
7.7
12.8
18.1
11.9
13.2
11.1
9.7
9.0
10.3
18.4
14.6
11.3
12.2
3.8
3.8
0.0
14.4
5.2
0.0
6.7
6.5
4.7
7.9
5.6
4.1
6.7
5.2
3.2
4.7
7.9
6.4
3.3
5.1
1.3
0.0
24.4
3.3
25.0
6.7
9.7
2.5
8.7
3.6
5.2
21.2
6.3
2.2
2.4
21.1
6.5
1.0
2.9
1.0
0.1
11.1
20.0
2.20.0
2.2
11.0
0.8
4.0
1.4
3.7
22.8
2.2
1.0
1.7
5.3
2.7
1.3
0.5
0.0
11.1
0.0 20.0 40.0 60.0 80.0 100.0 120.0
Mining and quarrying
Manufacturing Industries
Electricity, gas, steam and air condition
Water supply; sewage, waste management
Construction
Wholesale and retail trade; repair of motor …
Transportation and storage
Accommodation and food service activities
Information and communication
Financial and insurance activities
Real estate activities
Professional, scientific and technical activities
Administrative and support service activities
Public administration and defense activities
Education
Human health and social work activities
Arts, entertainment and recreation activities
other service activities
Activities of Households
Activities of extraterritorial organization
Less Than 5000 JD 5000-10000 10001-20000 20001-40000 40001-60000 60001-100000 100001-500000 More than 500001
Distribution of Informal Sector and Small and Medium Establishment by Economic Activity and Annual Revenues Category
In further details, some percentages are highlighted here specific to the
relative distribution for the informal sector and its establishments according
to the annual revenues:
1. Around 70 percent of the establishments of the mining sector created
annual revenues exceeding JD 40 thousand. Further, in "electricity,
gas, steam and air conditioning supply", "financial and insurance
activities", and "public administration and defense activities" sectors

49
the percentage was around 50 percent, 59 percent, and 42.2 percent,
accordingly.
2. The annual revenue category of JD 5-10 thousand for establishments
made up a high percentage of total establishments; "electricity, gas,
steam and air conditioning supply" sector has 25 percent of such
establishments, the mining sector has 24.4 percent, the "financial and
insurance activities" sector has 21.2 percent and finally the "public
administration and defense activities" sector has 21.2 percent. These
percentages are relatively high and reflect the large size of the
establishments in these sectors and the low participation for the
informal economy in those activities. This conclusion is assured by
having the "financial and insurance activities" sector take the lead
with 22.8 percent of this sector’s revenues exceed JD 50 thousand,
followed by mining sector with a percentage of 20 percent.

50
Chapter Four
Policy recommendations

51
Policy recommendations:
The informal sector’s main issue remains with the sector’s inability, or
unwillingness, of registering the employees in any form of social security and
insure that they have their basic working rights, therefore it is crucial to find
a legal mechanism that forces these establishments, regardless if they were
SMEs or large corporations, to cover their employees with social security
and give them their full rights and protection. This can be achieved to by
activating the new Social Security Law and introducing, as soon as possible,
the SME Law that the Government is currently drafting. It is also of vital
importance for the chambers of industry and commerce to encourage their
members to be covered in social security and health insurance, and to
extend more efforts to widen the registration of respective establishments in
these chambers. Increasing inspection programs and specific establishment
visits to make sure that employees are covered by basic employee rights is
also needed. Inspection should target social security issues and labor law
issues.
On the other hand, the government institutions have a huge role and
responsibility in making the informal sector formal. The aforementioned
institutions should work on facilitating business startup and providing tax
incentives to entrepreneurs. Additionally, they should support expanding the
private sector, especially in small business, but make sure that social security
and health insurance, and other labor rights, are applied to workers. By
doing so, the government will indirectly encourage youth to work and
eventually take away the vibe that the private sector is not stable or
sustainable. This by default will allow youth to work in the private sector
and decrease the rate of unemployment; thus contribute in poverty
alleviation.

52
On another front, the Government in cooperation with the private sector
should enhance its public – private sector partnership in vocational and
technical training, whereby producing qualified workers is an incentive for
the private sector to employ them and expand their businesses. To
complement providing the private sector with qualified personnel, the
synchronization between the supply and demand in the labor force can
contribute to preventing job seekers from working in the informal sector.
Many youth, or job seekers, end up working in jobs with no contract, social
security or health insurance because their specialization is either saturated
with employees or is not valuable for the private sector, therefore synching
the supply and demand between the labor market and the education
providers will allow job seekers to find jobs with better working conditions.
The availability of appropriate financing, in terms of size and conditions,
was one of the issues that have been raised in almost all focus group and
interviews with the experts, officials, and civil society representatives.
Further, the lack of awareness about various microfinance programs,
institutions, and initiatives was a common issue in focus group. Therefore,
initiating and expanding the awareness campaigns in this regards is very
important, including raising awareness about the availability of financing
through schemes in compliance with Sharia. Not only this, but the high cost
of microfinance was also raised, an issue which needs to be revisited by
public and private MFIs.
It was evident that a large segment of informally employed individuals work
from home and therefore it is crucial to accept giving licenses to those
individuals who operate from their homes. This will not only allow more
women participation in the labor force but will also encourage youth to start
up simple ideas from their homes. To achieve that, legislations need to be
amended and awareness on the new regulations needs to be introduced to
encourage home businesses to register.

53
Last, but not least, the study and the literature review indicated sectors that
have high informal employment within them, therefore it is of utmost
importance to focus on such sectors and study each sector individually in
detail in order to solve the informality issue within.

54
References
A. C. Kulshreshtha (2011). Measuring the Unorganized Sector in India, Review of Income and Wealth, volume 57. Asaad, Rajui (2011): the Jordanian Labor Market in the Millennium Economic Research Forum. Asian Development Bank (2010). The Informal Sector and Informal Employment in Indonesia, ADB Country Report. Central Statistical Organization/India (2001): Expert Group on Informal Sector Statistics (Delhi Group), Report of the Fifth Meeting (New Delhi, 19-21 September 2001); New Delhi.
Hussmanns, Ralf (2004). Measuring the informal economy: From employment in the informal sector to informal employment. ILO, Working paper No. 53. International Labour Office (2002a): Effect to be Given to Resolutions Adopted by the International Labour Conference at its 90th Session (2002), (b) Resolution concerning decent work and the informal economy; Governing Body, 285th Session, Geneva. International Labour Office (2002b): Decent Work and the Informal Economy; Report of the Director-General; International Labour Conference, 90th Session; Report VI; International Labour, Geneva.
Lewis, William (1955). The Theory of Economic Growth. London: Allen and Unwin. Neuwirth, Robert (2011). The 'Informal Economy' Driving World Business, Uwww.npr.orgU.
Refaat, Amal (2010).The Informal Sector in Egypt: Problems and Attempts for Reform, The Egyptian Center for Economic Studies. Rossis, Nichola (2011). The Informal Economy in Lebanon: Dangers and Benefits, Doctoral Thesis, Durham University. Schneider, F (2002): The Size and Development of the Shadow Economy and Shadow Economy Labour Force of 22 Transition and 21 OECD Countries, Bulgaria.
55
Tansel, Aysit (2000). Wage Earners, Self-Employment and Gender in the Informal Sector in Turkey, Policy Research Report on Gender and Development, World Bank Working Paper Series No. 24.
Women in Informal Employment: Globalizing and Organizing. (2012), About
the Informal Economy, Uhttp://wiego.org/U.

56
Annexes

57
Table (1)
Distribution of the Informal Sector and Economic Establishment by Economic Activities (%)
Economic Sector Informal Sector percent
Active Economic Establishment by Economic Sector
Mining and quarrying 0.9 0.1 Manufacturing Industries 18.6 14.3 Electricity, gas, steam and air condition 0.1 0.0 Water supply; sewage, waste management a 0.2 0.0 Construction 11.1 0.8 Wholesale and retail trade; repair of motor vehicles 30 57.5 Transportation and storage 11.7 0.8 Accommodation and food service activities 3.5 6.2 Information and communication 1.4 0.6 Financial and insurance activities 0.4 0.3 Real estate activities 0.4 1.7 Professional, scientific and technical activities 1.3 3.6 Administrative and support service activities 0.9 0.6 Public administration and defense activities 0.4 0.0 Education 3.9 1.5 Human health and social work activities 2.6 3.2 Arts, entertainment and recreation activities 0.3 0.7 other service activities 5.2 2.0 Activities of Households 0.8 6.2 Activities of extraterritorial organization 0.7 0.0 Total 94.4 100.0
Table (2)

58
Distribution of Small Medium and Large Establishment by Economic Activities (%)
Economic Sector Informal Sector percent
Small and Medium Establishment percent
Large Establishment percent
Total
Mining and quarrying 0.9 95.7 4.3 100 Manufacturing Industries 18.6 99.6 0.4 100 Electricity, gas, steam and air condition 0.1 44.4 55.6 100 Water supply; sewage, waste management 0.2 100.0 0.0 100 Construction 11.1 99.0 1.0 100 Wholesale and retail trade; repair of motor vehicles 30 100.0 0.0 100 Transportation and storage 11.7 99.5 0.5 100 Accommodation and food service activities 3.5 99.8 0.2 100 Information and communication 1.4 99.4 0.6 100 Financial and insurance activities 0.4 95.1 4.9 100 Real estate activities 0.4 100.0 0.0 100 Professional, scientific and technical activities 1.3 99.9 0.1 100 Administrative and support service activities 0.9 99.9 0.1 100 Public administration and defense activities 0.4 92.7 7.3 100 Education 3.9 98.8 1.2 100 Human health and social work activities 2.6 99.7 0.3 100 Arts, entertainment and recreation activities 0.3 99.9 0.1 100 other service activities 5.2 99.9 0.1 100 Activities of Households 0.8 100.0 0.0 100 Activities of extraterritorial organization 0.7 100.0 0.0 100
Table (3)

59
Distribution of Informal Sector and Small and Medium Establishment by Economic Activities (%)
Economic Sector Informal Sector percent
Small and Medium Establishment To the total of SMEs
Large Establishment To the Total Large Establishment
Mining and quarrying 0.9 0.1 1.6 Manufacturing Industries 18.6 14.2 36.6 Electricity, gas, steam and air condition 0.1 0.0 2.0 Water supply; sewage, waste management 0.2 0.0 0.0 Construction 11.1 0.8 4.9 Wholesale and retail trade; repair of motor vehicles 30 57.6 8.5 Transportation and storage 11.7 0.8 2.4 Accommodation and food service activities 3.5 6.2 9.3 Information and communication 1.4 0.6 2.4 Financial and insurance activities 0.4 0.2 8.1 Real estate activities 0.4 1.7 0.4 Professional, scientific and technical activities 1.3 3.6 2.8 Administrative and support service activities 0.9 0.6 0.4 Public administration and defense activities 0.4 0.0 1.2 Education 3.9 1.5 11.4 Human health and social work activities 2.6 3.2 6.5 Arts, entertainment and recreation activities 0.3 0.7 0.4 other service activities 5.2 2.0 0.8 Activities of Households 0.8 6.2 0.0 Activities of extraterritorial organization 0.7 0.0 0.0 Total 94.4 100.0 100.0
Table (4)
Distribution of Economic Establishment by Employees Category and Governorate (%)

60
Governorate Employees Category
Total 1-249 ≥ 250 Amman 99.7 0.3 100
Balqa 99.9 0.1 100
Zarqa 99.9 0.1 100
Madaba 100.0 0.0 100
Irbid 99.9 0.1 100
Mafraq 99.9 0.1 100
Jarash 99.9 0.1 100
Ajlun 100.0 0.0 100
Karak 100.0 0.0 100
Tafiela 100.0 0.0 100
Ma'an 100.0 0.0 100
Aqaba 99.9 0.1 100
Total 99.8 0.2 100

61
Table (5)
Distribution of Economic Establishment by Employees Category and Governorate out of Total Establishment in each Category (%)
Governorate Employees Category
1-249 ≥ 250
Amman 44.9 73.6 Balqa 5.2 4.1 Zarqa 15.2 10.6 Madaba 2.3 0.4 Irbid 17.2 6.5 Mafraq 3.0 1.2 Jarash 2.2 1.2 Ajlun 1.7 0.0 Karak 3.4 0.4 Tafiela 1.1 0.0 Ma'an 1.6 0.0 Aqaba 2.2 2.0
Total 100.0 100.0

62
Table (6)
Distribution of Informal Sector and Small and Medium Establishment by Economic Activities and Nationality of Establishment (%)
Economic Sector Informal Sector
Nationality of Establishment
Jordanian Non Jordanian
Mining and quarrying 0.90 0.1 1.4 Manufacturing Industries 18.60 14.2 14.8 Electricity, gas, steam and air condition 0.10 0.0 0.0 Water supply; sewage, waste management 0.20 0.0 0.0 Construction 11.10 0.8 2.9 Wholesale and retail trade; repair of motor vehicles 30.00 57.6 42.4 Transportation and storage 11.70 0.8 3.0 Accommodation and food service activities 3.50 6.2 5.2 Information and communication 1.40 0.6 4.4 Financial and insurance activities 0.40 0.2 4.2 Real estate activities 0.40 1.7 2.2 Professional, scientific and technical activities 1.30 3.6 4.5 Administrative and support service activities 0.90 0.6 0.7 Public administration and defense activities 0.40 0.0 0.0 Education 3.90 1.5 2.9 Human health and social work activities 2.60 3.2 3.0 Arts, entertainment and recreation activities 0.30 0.7 0.0 other service activities 5.20 2.0 2.2 Activities of Households 0.80 6.2 3.7 Activities of extraterritorial organization 0.70 0.0 2.2
Total 94.4 100 100
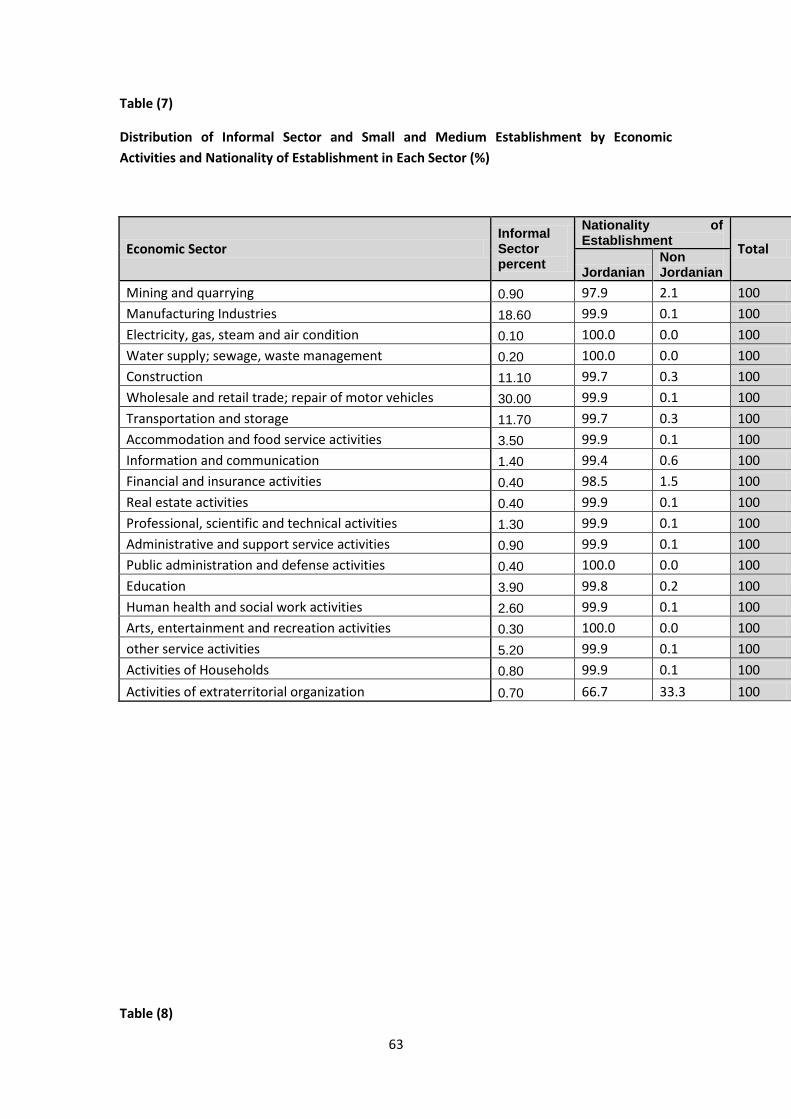
63
Table (7)
Distribution of Informal Sector and Small and Medium Establishment by Economic Activities and Nationality of Establishment in Each Sector (%)
Economic Sector Informal Sector percent
Nationality of Establishment
Total Jordanian
Non Jordanian
Mining and quarrying 0.90 97.9 2.1 100 Manufacturing Industries 18.60 99.9 0.1 100
Electricity, gas, steam and air condition 0.10 100.0 0.0 100 Water supply; sewage, waste management 0.20 100.0 0.0 100 Construction 11.10 99.7 0.3 100 Wholesale and retail trade; repair of motor vehicles 30.00 99.9 0.1 100
Transportation and storage 11.70 99.7 0.3 100 Accommodation and food service activities 3.50 99.9 0.1 100 Information and communication 1.40 99.4 0.6 100 Financial and insurance activities 0.40 98.5 1.5 100
Real estate activities 0.40 99.9 0.1 100 Professional, scientific and technical activities 1.30 99.9 0.1 100 Administrative and support service activities 0.90 99.9 0.1 100 Public administration and defense activities 0.40 100.0 0.0 100
Education 3.90 99.8 0.2 100 Human health and social work activities 2.60 99.9 0.1 100 Arts, entertainment and recreation activities 0.30 100.0 0.0 100 other service activities 5.20 99.9 0.1 100
Activities of Households 0.80 99.9 0.1 100
Activities of extraterritorial organization 0.70 66.7 33.3 100
Table (8)

64
Distribution of Informal Sector and Small Medium Establishment by Economic Activity and Use of Regular Register of Accounting (%)
Economic Activities
Informal Sector percent Use Do not Use Total
Industry 19.5 8.1 91.9 100.0 Construction 11.1 30.1 69.9 100.0 Internal Trade 30 5.2 94.8 100.0 Transportation 11.7 29.0 71.0 100.0 Services 21.7 11.4 88.6 100.0 Financial & Banks & Insurance 0.4 73.9 26.1 100.0

65
Table (9)
Distribution of Informal Sector and Small and Medium Establishment by Economic Activity and Legal Status (%)
Informal Sector %
Individual Partnership Limited Liability
Limited Partnership
Public Joint Stock
Private Joint Stock
Cooperative Society
Active Foreign Branch
Non-Profit Other
Mining and quarrying 0.90 56.4 22.3 11.7 0.0 4.3 4.3 0.0 1.1 0.0 0.0 100Manufacturing Industries 18.60 84.8 10.6 3.6 0.3 0.3 0.2 0.1 0.0 0.1 0.0 100Electricity, gas, steam and air condition 0.10 0.0 11.1 33.3 0.0 55.6 0.0 0.0 0.0 0.0 0.0 100Water supply; sewage, waste management 0.20 60.0 20.0 11.1 2.2 0.0 0.0 2.2 2.2 2.2 0.0 100Construction 11.10 60.2 21.6 14.7 2.0 0.2 0.6 0.0 0.6 0.1 0.1 100
Wholesale and retail trade; repair of motor vehicles 30.00 89.4 8.3 1.8 0.2 0.0 0.1 0.1 0.0 0.0 0.0 100Transportation and storage 11.70 46.8 35.2 13.0 2.9 0.6 0.9 0.4 0.2 0.0 0.0 100Accommodation and food service activities 3.50 84.2 10.5 4.4 0.3 0.2 0.3 0.0 0.1 0.0 0.0 100Information and communication 1.40 69.5 9.5 17.6 0.4 0.2 2.0 0.0 0.3 0.3 0.1 100Financial and insurance activities 0.40 20.9 23.4 25.9 2.5 15.5 2.7 3.7 3.0 0.7 1.7 100Real estate activities 0.40 76.2 13.1 8.0 0.7 1.0 0.6 0.3 0.0 0.1 0.0 100Professional, scientific and technical activities 1.30 84.3 8.0 6.4 0.4 0.1 0.4 0.1 0.1 0.3 0.1 100Administrative and support service activities 0.90 72.7 11.3 12.5 0.5 0.5 1.0 0.2 0.2 1.2 0.0 100Public administration and defense activities 0.40 31.7 34.1 24.4 4.9 0.0 0.0 2.4 0.0 2.4 0.0 100Education 3.90 67.0 17.9 6.2 0.6 0.5 0.6 1.1 0.0 5.7 0.3 100Human health and social work activities 2.60 83.6 3.0 1.3 0.0 0.1 0.1 1.0 0.0 10.8 0.1 100Arts, entertainment and recreation activities 0.30 72.3 13.0 5.7 0.2 0.1 0.4 1.0 0.0 7.1 0.3 100other service activities 5.20 88.3 3.8 1.3 0.2 0.0 0.1 0.2 0.0 5.8 0.3 100Activities of Households 0.80 95.8 3.8 0.3 0.0 0.0 0.0 0.0 0.0 0.0 0.0 100
Activities of extraterritorial organization 0.70 0.0 0.0 0.0 0.0 0.0 0.0 0.0 0.0 100.0 0.0 100
Economic Sectors
Legal Status
Total

66
Table (10)
Distribution of Informal Sector and Small and Medium Establishment by Economic Activity and Annual Revenues Category (%)
Informal Sector %
Less Than 5000 JD 5000-10000 10001-20000 20001-40000 40001-60000 60001-100000 100001-500000
Mining and quarrying 0.9 3.3 4.4 7.8 14.4 14.4 11.1 24.4
Manufacturing Industries 18.6 31.1 25.0 16.8 12.9 5.2 3.5 3.3
Electricity, gas, steam and air condition 0.1 0.0 0.0 25.0 25.0 0.0 25.0 25.0
Water supply; sewage, waste management 0.2 17.8 15.6 13.3 17.8 6.7 20.0 6.7
Construction 11.1 30.9 16.5 8.8 7.7 6.5 8.9 9.7
Wholesale and retail trade; repair of motor vehicles 30.0 35.5 23.8 16.8 12.8 4.7 3.1 2.5
Transportation and storage 11.7 13.3 19.8 19.0 18.1 7.9 9.1 8.7
Accommodation and food service activities 3.5 33.2 23.4 16.9 11.9 5.6 4.1 3.6
Information and communication 1.4 25.5 25.9 18.7 13.2 4.1 3.8 5.2
Financial and insurance activities 0.4 9.8 8.0 11.9 11.1 6.7 8.3 21.2
Real estate activities 0.4 36.1 22.7 13.4 9.7 5.2 4.3 6.3
Professional, scientific and technical activities 1.3 30.5 35.5 16.3 9.0 3.2 2.3 2.2
Administrative and support service activities 0.9 42.5 21.6 14.1 10.3 4.7 2.7 2.4
Public administration and defense activities 0.4 13.2 10.5 15.8 18.4 7.9 7.9 21.1
Education 3.9 20.2 23.1 20.2 14.6 6.4 6.2 6.5
Human health and social work activities 2.6 22.5 36.9 22.3 11.3 3.3 2.0 1.0
Arts, entertainment and recreation activities 0.3 30.2 25.6 18.6 12.2 5.1 4.1 2.9
other service activities 5.2 62.1 21.3 8.8 3.8 1.3 1.1 1.0
Activities of Households 0.8 54.4 30.1 10.7 3.8 0.6 0.3 0.1
Activities of extraterritorial organization 0.7 66.7 11.1 0.0 0.0 0.0 0.0 11.1
Small and Medium Establishment %
Economic Sectors


