Page 1
Mires and Peat, Volume 19 (2017), Article 22, 1–17, http://www.mires-and-peat.net/, ISSN 1819-754X
© 2017 International Mire Conservation Group and International Peatland Society, DOI: 10.19189/MaP.2016.OMB.264
1
The peatland map of Europe
F. Tanneberger1, C. Tegetmeyer1, S. Busse1, A. Barthelmes1,
S. Shumka2, A. Moles Mariné3, K. Jenderedjian4, G.M. Steiner5, F. Essl5, J. Etzold1,
C. Mendes6, A. Kozulin7, P. Frankard8, Đ. Milanović9, A. Ganeva10, I. Apostolova10,
A. Alegro11, P. Delipetrou12, J. Navrátilová13, M. Risager14, A. Leivits15, A.M. Fosaa16,
S. Tuominen17, F. Muller18, T. Bakuradze19, M. Sommer20, K. Christanis21, E. Szurdoki22,
H. Oskarsson23, S.H. Brink23, J. Connolly24, L. Bragazza25, G. Martinelli26, O. Aleksāns27,
A. Priede28, D. Sungaila29, L. Melovski30, T. Belous31, D. Saveljić32, F. de Vries33, A. Moen34,
W. Dembek35, J. Mateus36, J. Hanganu37, A. Sirin38, A. Markina38, M. Napreenko39, P. Lazarević40,
V. Šefferová Stanová41, P. Skoberne42, P. Heras Pérez43, X. Pontevedra-Pombal44, J. Lonnstad45,
M. Küchler46, C. Wüst-Galley47, S. Kirca48, O. Mykytiuk49, R. Lindsay50 and H. Joosten1
1 Institute of Botany and Landscape Ecology, Greifswald University, partner in the Greifswald Mire Centre, Germany
2–50 For other author affiliations, see Appendix 2
_______________________________________________________________________________________
SUMMARY
Based on the ‘European Mires Book’ of the International Mire Conservation Group (IMCG), this article
provides a composite map of national datasets as the first comprehensive peatland map for the whole of Europe.
We also present estimates of the extent of peatlands and mires in each European country individually and for
the entire continent. A minimum peat thickness criterion has not been strictly applied, to allow for (often
historically determined) country-specific definitions. Our ‘peatland’ concept includes all ‘mires’, which are
peatlands where peat is being formed. The map was constructed by merging national datasets in GIS while
maintaining the mapping scales of the original input data. This ‘bottom-up’ approach indicates that the overall
area of peatland in Europe is 593,727 km². Mires were found to cover more than 320,000 km² (around 54 %
of the total peatland area). If shallow-peat lands (< 30 cm peat) in European Russia are also taken into account,
the total peatland area in Europe is more than 1,000,000 km2, which is almost 10 % of the total surface area.
Composite inventories of national peatland information, as presented here for Europe, may serve to identify
gaps and priority areas for field survey, and help to cross-check and calibrate remote sensing based mapping
approaches.
KEY WORDS: drained peatland, GIS, Histosol, mire, organic soil, peat
_______________________________________________________________________________________
INTRODUCTION
Peatlands increasingly play a role in policy relating
to climate change, biodiversity and ecosystem
services. Spatially explicit information on peatland
distribution is needed to raise awareness of peatlands,
to assess their ecosystem values, functions and
losses, and to develop and implement strategies for
peatland protection and wise use (FAO 2017).
Surprisingly, no detailed and complete peatland map
yet exists for the continent with the longest history of
peatland study and exploitation - Europe.
During the last half-century or so, maps of Europe
have been produced showing mire regions (e.g., Kats
1971) or the general occurrence of peatlands (e.g.,
Lappalainen 1996). Jones et al. (2004, 2005)
presented the first map of organic carbon in topsoil
(OCTOP, 1 km × 1 km raster) but this did not include
many east European countries or European Russia. A
map of the European Soil Database (European Soil
Bureau 2004, 1:1,000,000) covered the entire
continent, but left out peat soils in various peatland-
rich areas (Sweden, Denmark, Lithuania) and almost
all south European countries. Montanarella et al.
(2006) produced a peatland map by combining the
OCTOP dataset and the European Soil Database,
again excluding a large part of Europe (e.g., Belarus,
Iceland, Moldova, Russian Federation, Svalbard and
Ukraine). In 2009, in response to the scarcity of
harmonised up-to-date organic carbon data, the
LUCAS (Land Use/Cover Area frame statistical
Survey) topsoil survey was implemented at European
Union (EU) level and was based on 20,000 soil
samples analysed centrally (Montanarella et al.
2011). De Brogniez et al. (2015) used the LUCAS
topsoil carbon data to create a map of predicted
Page 2
F. Tanneberger et al. THE PEATLAND MAP OF EUROPE
Mires and Peat, Volume 19 (2017), Article 22, 1–17, http://www.mires-and-peat.net/, ISSN 1819-754X
© 2017 International Mire Conservation Group and International Peatland Society, DOI: 10.19189/MaP.2016.OMB.264
2
topsoil organic carbon content, an approach which
Yigini & Panagos (2016) extended to predict present
and future soil organic carbon stocks in the EU using
climate and land cover change scenarios.
Some of the earlier pioneering work towards a
peatland map of Europe was severely hampered by
scarcity and heterogeneity of digital data. Until
recently, geographic information systems (GIS) were
not widely used across Europe, and much of the
national soil and vegetation inventory information
was stored in formats that were almost impossible to
combine and harmonise between countries, and
seldom fully accessible. Harmonisation has improved
considerably in the last decade, but only at EU level.
Therefore, until now there has been no peatland map
for the entire geographical extent of Europe.
In recent years, information on peatland
distribution within the countries of Europe has been
compiled by the Greifswald Mire Centre (GMC) in
the process of producing the book Mires and
Peatlands of Europe (Joosten et al. 2017a) for the
International Mire Conservation Group (IMCG). The
history of this ‘European Mires Book’ dates back to
1990, when IMCG decided to compile a
comprehensive report on the mires of Europe. Earlier
less complete attempts include the 1980 Council of
Europe review covering 17 ‘west’ European
countries (Goodwillie 1980) and the 1988 review of
peat resources in the European part of the Soviet
Union and 26 other European countries (Olenin
1988). The changing political situation in central and
eastern Europe in the late 1980s and early 1990s
provided the interest and opportunity to examine the
whole of Europe. Several major regional overviews
were produced (e.g., Minayeva et al. 2009; see
Joosten et al. 2017b for an overview) and eventually,
in 2017, the European Mires Book itself was finished.
During compilation of this book it became clear that
most countries nowadays possess either GIS data on
the distribution of peatlands or proxy data that give a
fair impression of national peatland distribution.
Thus, it is now possible to provide a composite map
of national datasets as the first comprehensive
peatland map for the whole of Europe. Along with the
map, this article presents best current estimates of the
extent of mires and peatlands in each European
country individually and for the entire continent.
METHODS
Europe as a continent is a historical and cultural
construct, defined only by convention. According to
the modern geographical definition the border
between Europe and Asia stretches along the Ural
Mountains, the Ural River and the Caspian Sea in the
east, and the Greater Caucasus range and the Black
Sea with its Bosporus and Dardanelles outlets in the
south-east. Fifty internationally recognised states (i.e.
United Nations member states and the Holy
See/Vatican City) have their territories within this
geographical definition of Europe and/or are
members of pan-European organisations (e.g.,
Council of Europe). Of these 50 countries, five
(Kazakhstan, Malta, Monaco, San Marino and
Vatican City) are omitted because no peatlands are
known to exist within (in the case of Kazakhstan, the
European part of) their territories. Three archipelagos
(Azores, Faroe Islands and Svalbard) are reported
separately because of their geographical positions
and distinct biogeographical features.
To obtain peatland distribution data we
approached mire scientists, geologists, botanists,
pedologists and other persons involved in mire
science and peatland management from the IMCG
network and beyond (usually 1–2 persons per
country) in 2014–2016. We requested data on the
distribution of ‘peatland’ as defined for the IMCG
European Mires Book: “A peatland is an area with a
naturally accumulated layer of peat at the surface”
(Joosten et al. 2017c, 2017d). Peat is defined as
sedentarily accumulated material of which at least
30 % (dry mass basis) is dead organic matter. The
presence or absence of vegetation is irrelevant to the
definition of peatland. No strict criterion for
minimum thickness of the peat layer has been
adopted, in line with the 2006 (Eggleston et al. 2006)
and 2014 (Hiraishi et al. 2014) IPCC definitions of
‘organic soil’, which follow the FAO (2006)
definition of Histosol but refrain from defining a
minimum thickness for the organic layer (cf. FAO
2006 and FAO 2015 for Histosols) to allow for
variety amongst country-specific definitions, which
are often historically determined. This ‘peatland’
concept includes all ‘mires’, i.e. peatlands where peat
is being formed (Joosten et al. 2017c, 2017d).
For each country, the available datasets and their
correspondence to the definition of peatland adopted
for our mapping purposes, as well as their
uncertainties, were discussed individually before
single or combined datasets were selected for
inclusion in the composite map. We had to use data
on soil or ecosystem types that may not exactly
comply with our ‘peatland’ concept, but in absence
of better data give a fair impression of the peatland
(= organic soil) distribution, for a few countries,
namely: Austria (“Moor”), Denmark (“mose”, “eng”,
and “strandeng” protected under §3 Danish Protection
Act), Finland (“suo”), Hungary (“láp”), Iceland
(“votlendi”), Norway (“myr”), Russian Federation
Page 3
F. Tanneberger et al. THE PEATLAND MAP OF EUROPE
Mires and Peat, Volume 19 (2017), Article 22, 1–17, http://www.mires-and-peat.net/, ISSN 1819-754X
© 2017 International Mire Conservation Group and International Peatland Society, DOI: 10.19189/MaP.2016.OMB.264
3
(“zabolochennye melkootorfovannye zemli” and
“boloto”), Sweden (“myr”), and Switzerland
(“Moor”). For eight countries, information on the
occurrence of peatlands was deduced from the
distribution of potentially peat-forming vegetation
types or peatland-associated habitat types only
(Andorra, Belgium, Luxembourg, Republic of
Moldova) or from vegetation/habitat information in
combination with peatland data (Bulgaria, Czech
Republic, Hungary, Italy). All of the national datasets
used in the map are described in Appendix 1.
The map was constructed in ArcGIS 10.3 by
merging national datasets (‘bottom-up approach’)
while maintaining the mapping scale of the original
input data. Polygon data for peatland borders (and
rarely for larger areas containing several smaller
peatlands) were used if available. For countries with
point data, all points were transformed into polygons
representing 50 ha and those for peatlands of size
> 50 ha identified by name in the national dataset
were enlarged to approximate the real shape and size
of the peatland based on comparison with satellite
imagery (Google Earth, cf. Connolly & Holden 2011).
The map layout was also produced in ArcGIS 10.3
(A3 format). For all countries except Russia, the data
were displayed in greyscale 60 %. For Russia we
distinguished areas with peat layers ≥ 30 cm thick
(greyscale 50 %) from paludified shallow-peat lands
(greyscale 30 %) (see Appendix 1). To improve
visibility of the biogeographically important small
peatlands in (mostly) southern Europe, polygons
were symbolised in ArcGIS with solid (width 0.4
point) outlines for the following countries: Albania,
Armenia, Azerbaijan, Bosnia and Herzegovina,
Bulgaria, Croatia, Cyprus, France (dataset 2 only; for
dataset 1 the outline width is 0.2 point; see
Appendix 1), Georgia, Greece, Italy, Liechtenstein,
Republic of Macedonia, Republic of Moldova,
Montenegro, Portugal, Serbia, Slovenia, Spain,
Svalbard, Turkey and Ukraine (dataset 2 only, see
Appendix 1). All other country data were depicted
with dotted polygon outlines (dashes of width 0.01
point and length 1 point, separated by 9-point gaps).
Very accurately mapped small peatlands (e.g., in
Andorra) could not be depicted. For the purposes of
this article, the map was exported from ArcGIS into
a tif raster format (300 dpi, 8-bit grey scale, LZW
compression; provided in Supplementary Material).
Our estimates of the total peatland area per
country rely either on the national GIS data or stem
from published inventories, soil maps, or detailed
lists of current peatland areas which were often
personally visited by the respective national authors.
Estimates of the total current mire area per country,
i.e. of the area of peatland where peat is currently
being formed (Joosten et al. 2017c, 2017d), are
provisional for most countries. Whereas there are
indicators for peatland degradation that can easily be
identified by remote sensing (e.g., low water levels,
ditches, specific vegetation and land uses), it is much
more difficult to reliably assess current peat
formation (Joosten et al. 2017c). Therefore, often
only a range of ‘educated guesses’ could be derived
from existing data. The approach to estimating mire
area varied substantially between countries. In many
cases expert judgement was applied to roughly
estimate the peat-forming fractions of areas assigned
to relevant vegetation or habitat types, perhaps for
EU Natura 2000 reporting purposes - for example,
100 % for active raised bog (EU Habitat 7110) and
10 % for alluvial forests with Alnus glutinosa and
Fraxinus excelsior (EU Habitat 91E0). Estimates for
mire areas not covered by Natura 2000 habitat types
(e.g., certain fens) were based on the expert
knowledge of national authors. Another approach
was to subtract the area of drained peatland from the
total area of peatland and take the remainder as the
estimate of mire area. This may have resulted in
either over-estimation (if types of degradation other
than drainage were present) or under-estimation (if
areas reported as ‘drained peatland’ had been
abandoned and undergone spontaneous or planned
rewetting). For a very few countries with low
peatland cover, in the absence of better data the total
peatland area had to be used as the estimate of total
mire area.
RESULTS
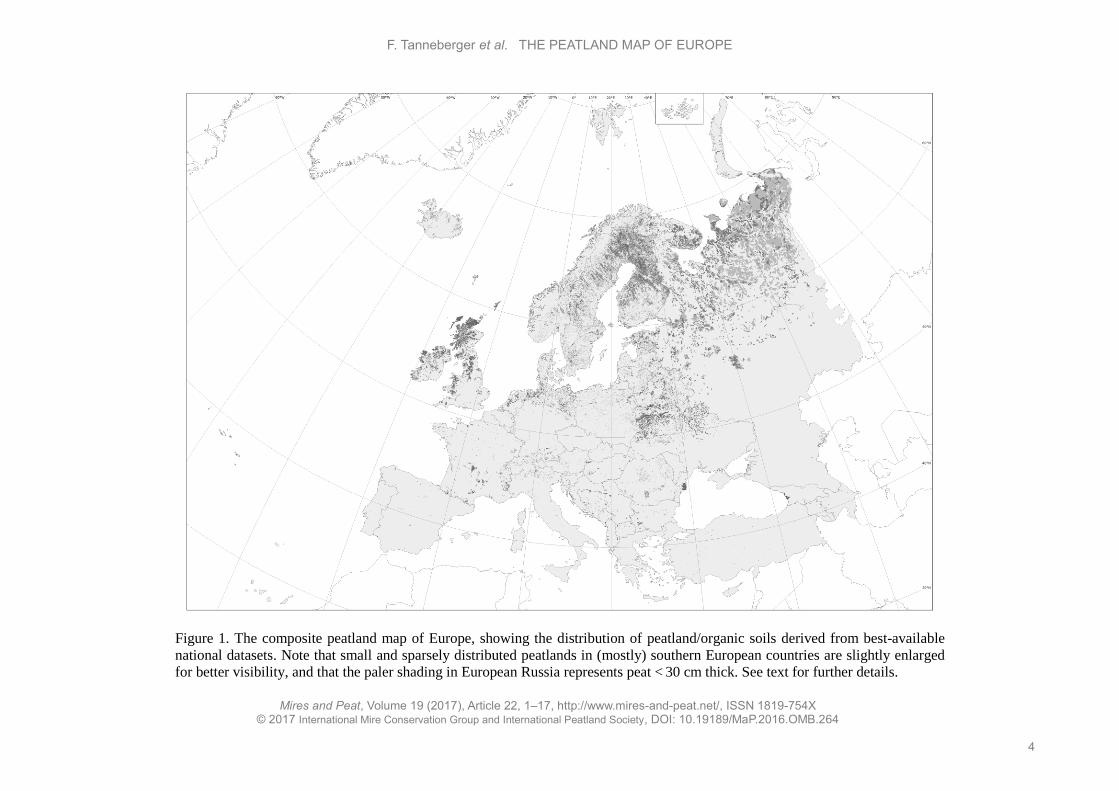
The distribution of peatland in Europe is strongly
imbalanced, with much more peatland occurring in
the north than in the south (Figure 1, Table 1). The
occurrence of peatland roughly reflects the influence
of rainfall and temperature, with less peatland
occurring where summer temperatures are higher and
rainfall is lower (Moen et al. 2017). The effect of
different definitions of peatland is visible, e.g., along
the Azov Sea coast, where “paludified shallow-peat
lands” are shown for the Russian Federation but not
for Ukraine. The diversity in mapping accuracy
among countries is visible, e.g., along the Finnish-
Russian border (peatlands being under-represented in
the Russian Federation because maps with different
scale were used - the discontinuity would disappear
when using regional peatland maps for Russian
provinces neighbouring Finland, e.g., Republic of
Karelia and Leningrad Oblast) and along the Polish-
Belarusian-Ukrainian borders (with peatlands being
over-represented in Ukraine).
Page 4
F. Tanneberger et al. THE PEATLAND MAP OF EUROPE
Mires and Peat, Volume 19 (2017), Article 22, 1–17, http://www.mires-and-peat.net/, ISSN 1819-754X
© 2017 International Mire Conservation Group and International Peatland Society, DOI: 10.19189/MaP.2016.OMB.264
4
Figure 1. The composite peatland map of Europe, showing the distribution of peatland/organic soils derived from best-available
national datasets. Note that small and sparsely distributed peatlands in (mostly) southern European countries are slightly enlarged
for better visibility, and that the paler shading in European Russia represents peat < 30 cm thick. See text for further details.
Page 5
F. Tanneberger et al. THE PEATLAND MAP OF EUROPE
Mires and Peat, Volume 19 (2017), Article 22, 1–17, http://www.mires-and-peat.net/, ISSN 1819-754X
© 2017 International Mire Conservation Group and International Peatland Society, DOI: 10.19189/MaP.2016.OMB.264
5
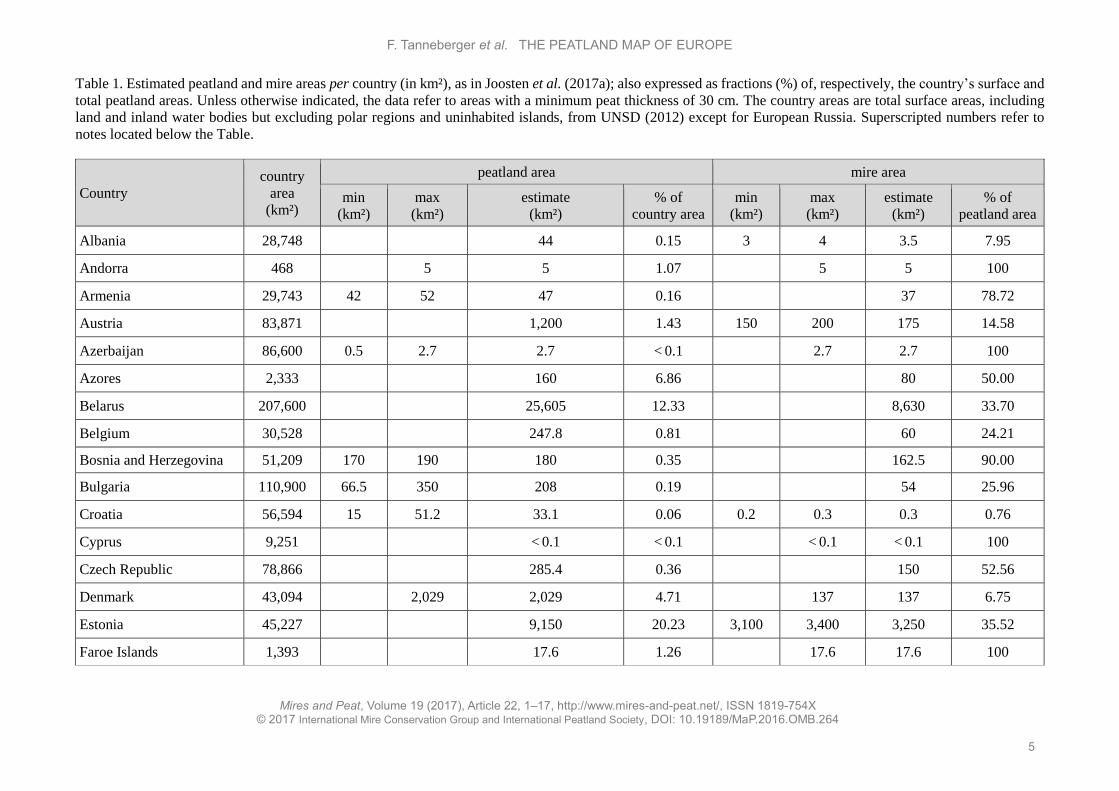
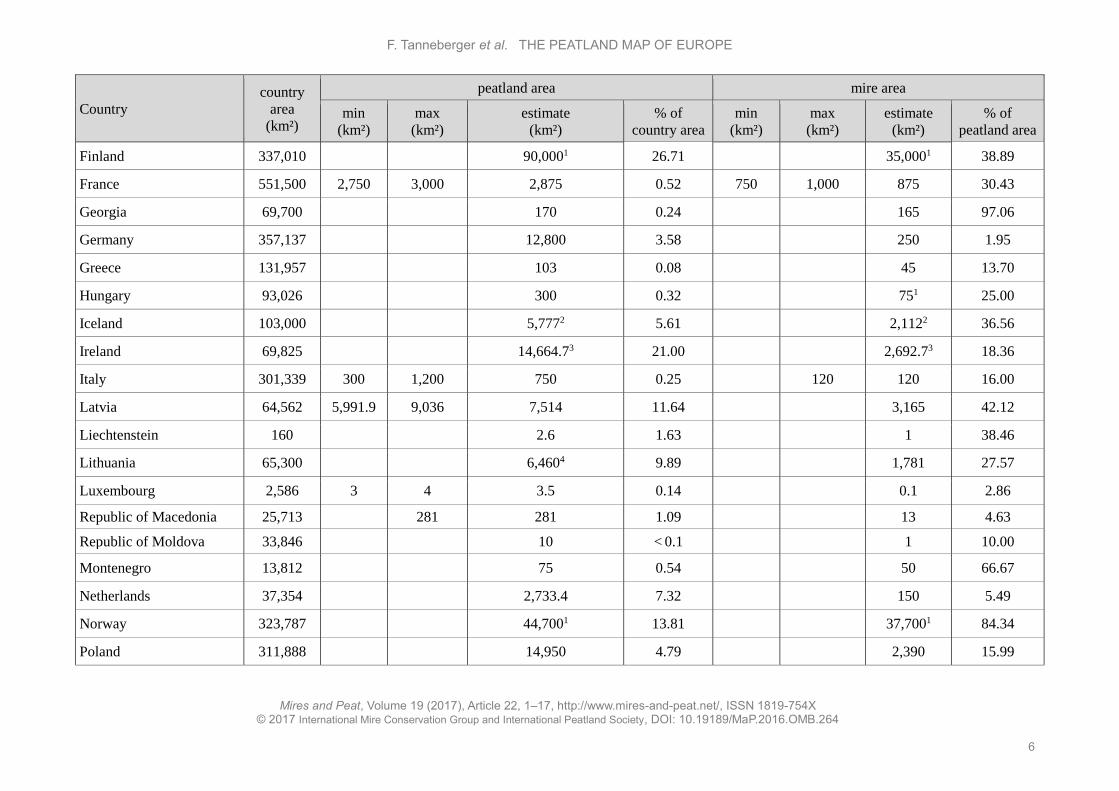
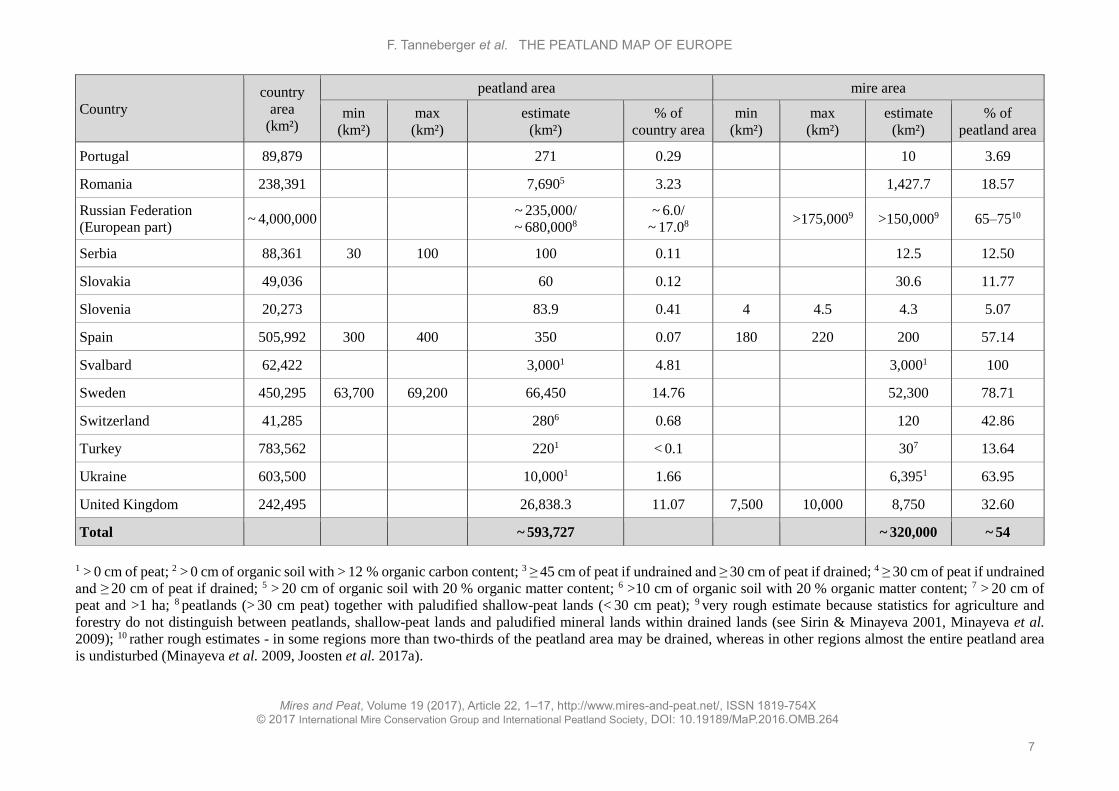
Table 1. Estimated peatland and mire areas per country (in km²), as in Joosten et al. (2017a); also expressed as fractions (%) of, respectively, the country’s surface and
total peatland areas. Unless otherwise indicated, the data refer to areas with a minimum peat thickness of 30 cm. The country areas are total surface areas, including
land and inland water bodies but excluding polar regions and uninhabited islands, from UNSD (2012) except for European Russia. Superscripted numbers refer to
notes located below the Table.
Country
country
area
(km²)
peatland area mire area
min
(km²)
max
(km²)
estimate
(km²)
% of
country area
min
(km²)
max
(km²)
estimate
(km²)
% of
peatland area
Albania 28,748 44 0.15 3 4 3.5 7.95
Andorra 468 5 5 1.07 5 5 100
Armenia 29,743 42 52 47 0.16 37 78.72
Austria 83,871 1,200 1.43 150 200 175 14.58
Azerbaijan 86,600 0.5 2.7 2.7 < 0.1 2.7 2.7 100
Azores 2,333 160 6.86 80 50.00
Belarus 207,600 25,605 12.33 8,630 33.70
Belgium 30,528 247.8 0.81 60 24.21
Bosnia and Herzegovina 51,209 170 190 180 0.35 162.5 90.00
Bulgaria 110,900 66.5 350 208 0.19 54 25.96
Croatia 56,594 15 51.2 33.1 0.06 0.2 0.3 0.3 0.76
Cyprus 9,251 < 0.1 < 0.1 < 0.1 < 0.1 100
Czech Republic 78,866 285.4 0.36 150 52.56
Denmark 43,094 2,029 2,029 4.71 137 137 6.75
Estonia 45,227 9,150 20.23 3,100 3,400 3,250 35.52
Faroe Islands 1,393 17.6 1.26 17.6 17.6 100
Page 6
F. Tanneberger et al. THE PEATLAND MAP OF EUROPE
Mires and Peat, Volume 19 (2017), Article 22, 1–17, http://www.mires-and-peat.net/, ISSN 1819-754X
© 2017 International Mire Conservation Group and International Peatland Society, DOI: 10.19189/MaP.2016.OMB.264
6
Country
country
area
(km²)
peatland area mire area
min
(km²)
max
(km²)
estimate
(km²)
% of
country area
min
(km²)
max
(km²)
estimate
(km²)
% of
peatland area
Finland 337,010 90,0001 26.71 35,0001 38.89
France 551,500 2,750 3,000 2,875 0.52 750 1,000 875 30.43
Georgia 69,700 170 0.24 165 97.06
Germany 357,137 12,800 3.58 250 1.95
Greece 131,957 103 0.08 45 13.70
Hungary 93,026 300 0.32 751 25.00
Iceland 103,000 5,7772 5.61 2,1122 36.56
Ireland 69,825 14,664.73 21.00 2,692.73 18.36
Italy 301,339 300 1,200 750 0.25 120 120 16.00
Latvia 64,562 5,991.9 9,036 7,514 11.64 3,165 42.12
Liechtenstein 160 2.6 1.63 1 38.46
Lithuania 65,300 6,4604 9.89 1,781 27.57
Luxembourg 2,586 3 4 3.5 0.14 0.1 2.86
Republic of Macedonia 25,713 281 281 1.09 13 4.63
Republic of Moldova 33,846 10 < 0.1 1 10.00
Montenegro 13,812 75 0.54 50 66.67
Netherlands 37,354 2,733.4 7.32 150 5.49
Norway 323,787 44,7001 13.81 37,7001 84.34
Poland 311,888 14,950 4.79 2,390 15.99
Page 7
F. Tanneberger et al. THE PEATLAND MAP OF EUROPE
Mires and Peat, Volume 19 (2017), Article 22, 1–17, http://www.mires-and-peat.net/, ISSN 1819-754X
© 2017 International Mire Conservation Group and International Peatland Society, DOI: 10.19189/MaP.2016.OMB.264
7
Country
country
area
(km²)
peatland area mire area
min
(km²)
max
(km²)
estimate
(km²)
% of
country area
min
(km²)
max
(km²)
estimate
(km²)
% of
peatland area
Portugal 89,879 271 0.29 10 3.69
Romania 238,391 7,6905 3.23 1,427.7 18.57
Russian Federation
(European part) ~ 4,000,000 ~ 235,000/
~ 680,0008
~ 6.0/
~ 17.08 >175,0009 >150,0009 65–7510
Serbia 88,361 30 100 100 0.11 12.5 12.50
Slovakia 49,036 60 0.12 30.6 11.77
Slovenia 20,273 83.9 0.41 4 4.5 4.3 5.07
Spain 505,992 300 400 350 0.07 180 220 200 57.14
Svalbard 62,422 3,0001 4.81 3,0001 100
Sweden 450,295 63,700 69,200 66,450 14.76 52,300 78.71
Switzerland 41,285 2806 0.68 120 42.86
Turkey 783,562 2201 < 0.1 307 13.64
Ukraine 603,500 10,0001 1.66 6,3951 63.95
United Kingdom 242,495 26,838.3 11.07 7,500 10,000 8,750 32.60
Total ~ 593,727 ~ 320,000 ~ 54
1 > 0 cm of peat; 2 > 0 cm of organic soil with > 12 % organic carbon content; 3 ≥ 45 cm of peat if undrained and ≥ 30 cm of peat if drained; 4 ≥ 30 cm of peat if undrained
and ≥ 20 cm of peat if drained; 5 > 20 cm of organic soil with 20 % organic matter content; 6 >10 cm of organic soil with 20 % organic matter content; 7 > 20 cm of
peat and >1 ha; 8 peatlands (> 30 cm peat) together with paludified shallow-peat lands (< 30 cm peat); 9 very rough estimate because statistics for agriculture and
forestry do not distinguish between peatlands, shallow-peat lands and paludified mineral lands within drained lands (see Sirin & Minayeva 2001, Minayeva et al.
2009); 10 rather rough estimates - in some regions more than two-thirds of the peatland area may be drained, whereas in other regions almost the entire peatland area
is undisturbed (Minayeva et al. 2009, Joosten et al. 2017a).
Page 8
F. Tanneberger et al. THE PEATLAND MAP OF EUROPE
Mires and Peat, Volume 19 (2017), Article 22, 1–17, http://www.mires-and-peat.net/, ISSN 1819-754X
© 2017 International Mire Conservation Group and International Peatland Society, DOI: 10.19189/MaP.2016.OMB.264
8
The total extent of peatland per country ranges
from 0.015 km² (Cyprus) to around 235,000 km²
(European Russia; Table 1). Proportionally (peatland
as a fraction of the total area of the country), Finland
is the country with most peatland (26.7 %). The
extent of mire is highest in European Russia (more
than 150,000 km²). The fraction of the total peatland
area that is still mire is about 5 % or less in Croatia,
Germany, Luxembourg, Republic of Macedonia,
Netherlands, Portugal, and Slovenia (Table 1). In
contrast, it is possibly close to 100 % in Andorra,
Azerbaijan, Cyprus, Faroe Islands and Svalbard,
which probably arises partly (cf. Andorra,
Azerbaijan, Cyprus) because non-mire peatlands
have rapidly disappeared by total oxidation of the
peat layer. The overall area of peatland in Europe is
estimated at 593,727 km² (5.4 % of the total surface
area). Mires cover more than 320,000 km² (about
54 % of the peatland area). If shallow-peat lands
(< 30 cm peat) in European Russia are also taken into
account, the total peatland area in Europe is more
than 1,000,000 km2, which is almost 10 % of the total
surface area.
DISCUSSION
This article attempts to provide the most accurate
representation of current peatland distribution across
the whole of Europe that is possible on the basis of
available national data, using a consistent definition
of peatland. Where recent relevant systematic
national soils data are not available, we have used
proxy data and expert judgement. Although this
approach weakens the consistency of the
methodology, we expect it to increase the reliability
and completeness of the final product.
Our estimates of national peatland/mire areas are
largely derived from published sources. Combining
them with other national GIS-based information,
especially on land use, and using appropriate
algorithms (including informed guesses) may
improve the data, especially with regard to drained
peatlands, whose extent may change rapidly as a
result of ongoing peat oxidation (cf. Barthelmes et al.
2015 for Nordic and Baltic countries; datasets used in
this publication). Eventually, however, national data
must be improved by carrying out new inventories,
either country-wide or in part of the country.
Too often, national soils data are still very diverse
and disparate (e.g., different techniques and scales of
field survey, different criteria for classifying soils,
different sampling methods and sampling densities),
making it difficult to amalgamate the data
meaningfully (Bragg & Lindsay 2003, Jandl et al.
2014). Combining standardised raster soil data with
vegetation and climate data (‘top-down approach’, cf.
Jones et al. 2004, 2005) can avoid some of these
shortcomings. Montanarella et al. (2006) concluded
that, for most European countries, the distribution of
peat and peat-topped soils is more accurately
portrayed by the map of organic carbon in topsoils
(Jones et al. 2004) than by the European Soil Map
(European Soil Bureau 2004). Still, the former
approach yielded results that deviate substantially
from the nationally-sourced information on peatland
distribution presented here.
Ideally, future peatland mapping should be based
on aggregated data from local and national peat
surveys rather than global soil maps (Montanarella
2014). The first step towards establishing a fully
operational global peatland information system
would be a complete inventory of available national
peatland data, as presented here for Europe. Such an
inventory can serve to identify gaps and priority areas
for field surveys and further data collection activities.
Remote sensing based mapping approaches (e.g.,
Gumbricht et al. 2017) may benefit from ‘bottom-up’
composite maps of national datasets when calibrating
and cross-checking their modelling results. However,
as long as elaborated ‘top-down’ maps for the whole
of Europe are still absent, our map provides the most
comprehensive distribution map of peatlands in
Europe.
ACKNOWLEDGEMENTS
We thank all persons and institutions who helped us
to access the national datasets used in this work - see
acknowledgements in Joosten et al. (2017a). We also
appreciate the constructive comments on this article
of Luca Montanarella, Jonathan Price and the Editor-
in-Chief, Olivia Bragg.
AUTHOR CONTRIBUTIONS
All authors except those from Greifswald Mire
Centre (GMC) acquired, developed and/or modified
national datasets (for their own countries) according
to criteria set by, and extensive discussions with, the
GMC authors. They also provided and checked the
information presented in Table 1 and Appendix 1.
Authors from GMC collaborated with the ‘national’
authors to develop, improve and augment the national
datasets, compiled the data in GIS, and designed and
created the composite peatland map of Europe. They
also wrote the first draft of this article, which was
then iteratively revised by all authors.
Page 9
F. Tanneberger et al. THE PEATLAND MAP OF EUROPE
Mires and Peat, Volume 19 (2017), Article 22, 1–17, http://www.mires-and-peat.net/, ISSN 1819-754X
© 2017 International Mire Conservation Group and International Peatland Society, DOI: 10.19189/MaP.2016.OMB.264
9
REFERENCES
Barthelmes, A., Couwenberg, J., Risager, M.,
Tegetmeyer, C. & Joosten, H. (2015) Peatlands
and Climate in a Ramsar Context: A Nordic-
Baltic Perspective. TemaNord 2015:544, Nordic
Council of Ministers, Copenhagen, 1–244.
Bragg, O. & Lindsay, R. (eds.) (2003) Strategy and
Action Plan for Mire and Peatland Conservation
in Central Europe. Publication No. 18, Wetlands
International, Wageningen, 94 pp. Online at:
https://www.wetlands.org/publications/strategy-
and-action-plan-for-mire-and-peatland-
conservation-in-central-europe/
Broggi, M.F. (2009) Die Rietlandschaft im Dreieck
der Ortschaften Ruggell, Bangs und Nofels (The
Riet landscape in the triangle of the villages
Ruggell, Bangs and Nofels). In: Broggi, F., Heeb,
J., Nescher, M. & Rosier, X. (eds.) Naturerlebnis
Liechtenstein - Ruggeller Riet und Schellenberger
Riet (Experiencing Nature in Liechtenstein -
Ruggell Riet and Schellenberg Riet), Alpenland
Verlag, Schaan, 19–30 (in German).
Chytrý, M., Kučera, T., Kočí, M., Grulich, V. &
Lustyk, P. (eds.) (2010) Katalog biotopů České
Republiky (Catalogue of Habitats of the Czech
Republic). Second edition, Agentura ochrany
přírody a krajiny ČR, Prague, 448 pp. (in Czech).
Connolly, J. & Holden, N.M. (2011) Object oriented
classification of disturbance on raised bogs in the
Irish Midlands using medium- and high-
resolution satellite imagery. Irish Geography, 44,
111–135.
de Brogniez, D., Ballabio, C., Stevens, A., Jones,
R.J.A., Montanarella, L. & van Wesemael, B.
(2014) A map of the topsoil organic carbon
content of Europe generated by a generalized
additive model. European Journal of Soil Science,
66, 121–134.
Eggleston, H.S., Buendia, L., Miwa, K., Ngara, T. &
Tanabe, K. (eds.) (2006) 2006 IPCC Guidelines
for National Greenhouse Gas Inventories.
Volume 4. Agriculture, Forestry and Other Land
Use. National Greenhouse Gas Inventories
Programme, IGES, Japan. Online at: http://www.
ipcc-nggip.iges.or.jp/public/2006gl/vol4.html
European Soil Bureau (2004) Thematic Map. PEAT.
Soil Geographical Database of Eurasia. Version
4 beta, 25/09/2001 and Pedotransfer Rules 2.0.
1:30,000,000. Online at: https://esdac.jrc.ec.
europa.eu/ESDB_Archive/ptrdb/peata3.pdf
FAO (2006) World Reference Base for Soil
Resources 2006: A Framework for International
Classification, Correlation and Communication.
World Soil Resources Report 103, Food and
Agriculture Organization of the United Nations
(FAO), Rome, 128 pp. Online at:
http://www.fao.org/3/a-a0510e.pdf
FAO (2015) World Reference Base for Soil
Resources 2014: International Soil Classification
System for Naming Soils and Creating Legends
for Soil Maps. Update 2015. World Soil
Resources Report 106, Food and Agriculture
Organization of the United Nations (FAO), Rome,
203 pp. Online at: http://www.fao.org/3/a-
i3794e.pdf
FAO (2017) Unlocking the Potential of Soil Organic
Carbon: Outcome Document of the Global
Symposium on Soil Organic Carbon, 21–23
March 2017, FAO Headquarters, Rome. Food and
Agriculture Organization of the United Nations
(FAO), Rome, 22 pp. Online at:
http://www.fao.org/3/b-i7268e.pdf
Felbaba-Klyshina, L.M. (2010) [Фельбаба-
Клушина, Л.М. (2010)] Рослинний покрив
боліт і водойм верхівя басейну р. Тиса
(Українські Карпати) та флювіальна
концепція його охорони. (Vegetation of Mires
and Waterbodies of the Upper Basin of Tisa River
(Ukrainian Carpathians) and a Fluvial Concept
for its Protection). Poligrafzentr Lira, Uzhgorod,
129 pp. (in Ukrainian).
Goodwillie, R. (1980) European Peatlands. Nature
and Environment Series No. 19, Council of
Europe, Strasbourg, 76 pp.
Gumbricht, T., Roman-Cuesta, R.M., Verchot, L.,
Herold, M., Wittmann, F., Householder, E.,
Herold, N. & Murdiyarso, D. (2017) An expert
system model for mapping tropical wetlands and
peatlands reveals South America as the largest
contributor. Global Change Biology, DOI:
10.1111/gcb.13689.
Hiraishi, T., Krug, T., Tanabe, K., Srivastava, N.,
Baasansuren, J., Fukuda, M. & Troxler, T.G.
(eds.) (2014) 2013 Supplement to the 2006 IPCC
Guidelines for National Greenhouse Gas
Inventories: Wetlands. IPCC, Switzerland, 354 pp.
Jandl, R., Rodeghiero, M., Martinez, C., Cotrufo,
M.F., Bampa, F., van Wesemael, B., Harrison,
R.B., Guerrini, I.A., Richter, D.deB.Jr., Rustad,
L., Lorenz, K., Chabbi, A. & Miglietta, F. (2014)
Current status, uncertainty and future needs in soil
organic carbon monitoring. Science of the Total
Environment, 468–469, 376–383.
Jones, R.J.A., Hiederer, R., Rusco, E., Loveland, P.J.
& Montanarella, L. (2004) The map of organic
carbon in topsoils in Europe, Version 1.2.
September 2003: Explanation of Special
Publication Ispra 2004 No.72 (S.P.I.04.72),
European Soil Bureau Research Report No.17,
Page 10
F. Tanneberger et al. THE PEATLAND MAP OF EUROPE
Mires and Peat, Volume 19 (2017), Article 22, 1–17, http://www.mires-and-peat.net/, ISSN 1819-754X
© 2017 International Mire Conservation Group and International Peatland Society, DOI: 10.19189/MaP.2016.OMB.264
10
EUR 21209, 26 pp. + 1 map in ISO B1 format,
Office for Official Publications of the European
Communities, Luxembourg. Online at:
http://esdac.jrc.ec.europa.eu/ESDB_Archive/eus
oils_docs/other/OCtopMapBkLet76.pdf
Jones, R.J.A., Hiederer, R., Rusco, E., Loveland, P.J.
& Montanarella, L. (2005) Estimating organic
carbon in the soils of Europe for policy support.
European Journal of Soil Science, 56, 655-671.
Joosten, H., Tanneberger, F. & Moen, A. (eds.)
(2017a) Mires and Peatlands of Europe: Status,
Distribution and Conservation. Schweizerbart
Science Publishers, Stuttgart, 730 pp.
Joosten, H., Tanneberger, F. & Moen, A. (2017b)
Introduction Part I. In: Joosten, H., Tanneberger,
F. & Moen, A. (eds.) Mires and Peatlands of
Europe: Status, Distribution and Conservation.
Schweizerbart Science Publishers, Stuttgart, 3–4.
Joosten, H., Moen, A., Couwenberg, J. &
Tanneberger, F. (2017c) Mire diversity in Europe:
mire and peatland types. In: Joosten, H.,
Tanneberger, F. & Moen, A. (eds.) Mires and
Peatlands of Europe: Status, Distribution and
Conservation. Schweizerbart Science Publishers,
Stuttgart, 5–64.
Joosten, H., Couwenberg, J., Moen, A. &
Tanneberger, F. (2017d) Mire and peatland terms
and definitions in Europe. In: Joosten, H.,
Tanneberger, F. & Moen, A. (eds.) Mires and
Peatlands of Europe: Status, Distribution and
Conservation. Schweizerbart Science Publishers,
Stuttgart, 67–89.
Kats, N.Y. (1971) [Кац, Н.Я. (1971)] Болота
Земного Шара (Mires of the Earth). Nauka,
Мoscow, 295 pp. (in Russian).
Lappalainen, E. (ed.) (1996) Global Peat Resources.
International Peat Society, Jyväskylä, 359 pp.
Martinelli, G., Cremonini, S., Samonati, E. &
Stracher, G.B. (2015) Italian peat and coal fires.
In: Stracher, G.B., Prakash, A. & Rein, G. (eds.)
Coal and Peat Fires. A Global Perspective.
Volume 4. Peat - Geology, Combustion, and Case
Studies. Elsevier, Amsterdam, 39–73.
Minayeva, T., Sirin, A. & Bragg, O. (2009) A Quick
Scan of Peatlands in Central and Eastern Europe.
Wetlands International, Wageningen, 132 pp.
Moen, A., Joosten, H. & Tanneberger, F. (2017) Mire
diversity in Europe: mire regionality. In: Joosten,
H., Tanneberger, F. & Moen, A. (eds.) Mires and
Peatlands of Europe: Status, Distribution and
Conservation. Schweizerbart Science Publishers,
Stuttgart, 97–149.
Montanarella, L. (2014) Mapping of peatlands. In:
Biancalani, R. & Avagyan, A. (ed.) Towards
Climate-responsible Peatlands Management.
Food and Agriculture Organization of the United
Nations (FAO), Rome, 19–22. Online at:
http://www.fao.org/3/a-i4029e.pdf
Montanarella, L., Jones, R.J.A. & Hiederer, R. (2006)
The distribution of peatland in Europe. Mires and
Peat, 1(01), 1–10.
Montanarella, L., Tóth, G. & Jones, A. (2011) Soil
components in the 2009 LUCAS survey. In: Tóth,
G. & Németh, T. (eds.) Land Quality and Land
Use Information - in the European Union. Office
for Official Publications of the European
Communities, Luxembourg, 209–220.
Olenin, A.S. (ed.) (1988) [Оленин, А.С. (рeд.)
(1988)] Торфяные Ресурсы Мира: Справочник
(Peat Resources of the World: Reference Book).
Nedra, Moscow, 384 pp. (in Russian).
Sirin, A.A. & Minayeva, T.Yu. (eds.) (2001) [Сирин,
А.А. & Минаева, Т.Ю. (2001)] Торфяные
болота России: к анализу отраслевой
информации (Peatlands of Russia: Towards the
Analysis of Sectoral Information). GEOS Publ.,
Moscow, 190 pp. (in Russian).
Sirin, A.A., Maslov, A.A., Valyaeva, N.A.,
Tsyganova, O.P. & Glukhova, T.V. (2014)
Mapping of peatlands in the Moscow Oblast
based on high resolution remote sensing data.
Contemporary Problems of Ecology, 7(7), 809–
815, DOI: 10.1134/S1995425514070117.
Sirin, A., Minayeva, T., Ilyasov, D., Suvorov, G.,
Martynenko, V., Fedotov, Yu., Glukhova, T.,
Valyaeva, N., Tsuganova, O., Maslov, A.,
Muldashev, A., Shirokikh, P. & Kuznetsov, E.
(2016) Peatlands in sub humid regions under
changing climate and human activities. Abstract
No. A-142 in: Peatlands in Harmony -
Agriculture, Industry and Nature - Poster
Presentations, Proceedings of the 15th
International Peat Congress, Malaysian Peat
Society and International Peat Society, Kuching,
Sarawak, Malaysia, 409–413.
SOeS (2013) Fiches Descriptives de Massifs à
Tourbières de France Métropolitaine (Catalogue
of Mire Massifs in Mainland France). Document
de travail No. 11, Service de l’Observation et des
Statistiques (Observation and Statistics Service)
(SOeS), Commissariat General for Sustainable
Development, Ministry of Ecology, Sustainable
Development and Energy, Paris, 736 pp. (in
French).
UNSD (2012) Table 3: Population by sex, annual rate
of population increase, surface area and density.
In: Demographic Yearbook 2012, United Nations
Statistics Division, New York, USA. Online at:
https://unstats.un.org/unsd/demographic/products
/dyb/dyb2012.htm
Page 11
F. Tanneberger et al. THE PEATLAND MAP OF EUROPE
Mires and Peat, Volume 19 (2017), Article 22, 1–17, http://www.mires-and-peat.net/, ISSN 1819-754X
© 2017 International Mire Conservation Group and International Peatland Society, DOI: 10.19189/MaP.2016.OMB.264
11
Várallyay, G., Szűcs, L., Rajkai, K., Zilahy, P. &
Murányi, A. (1980) Magyarországi talajok
vízgazdálkodási tulajdonságainak kategória-
rendszere és 1:100 000 méretarányú térképe (Soil
water management categories of Hungarian soils
and a 1:100,000 scale map). Agrokémia és
Talajtan, 29, 77–112 (in Hungarian).
Vompersky, S.E., Ivanov, A.I., Tsyganova, O.P.,
Valyaeva, N.A., Dubinin, A.I., Glukhov, A.I. &
Markelova, L.G. (1996) Bog organic soils and
bogs of Russia and carbon pool of their peats.
Eurasian Soil Science, 28(2), 91–105.
Vompersky, S.E., Sirin, A.A., Sal’nikov, A.A.,
Tsyganova, O.P. & Valyaeva, N.A. (2011)
Estimation of forest cover extent over peatlands
and paludified shallow-peat lands in Russia.
Contemporary Problems of Ecology, 4(7), 734–
741. DOI: 10.1134/S1995425511070058.
Yigini, Y. & Panagos, P. (2016) Assessment of soil
organic carbon stocks under future climate and
land cover changes in Europe. Science of the Total
Environment, 557–558, 838–850.
Submitted 23 Dec 2016, final revision 04 Oct 2017
Editor: Olivia Bragg
_______________________________________________________________________________________
Author for correspondence:
Dr Franziska Tanneberger, Institute of Botany and Landscape Ecology, Greifswald University, partner in the
Greifswald Mire Centre, Soldmannstr. 15, D-17487 Greifswald, Germany.
Tel: +49 3834 4204137; Fax: +3834 4204116; E-mail: [email protected]
Page 12
F. Tanneberger et al. THE PEATLAND MAP OF EUROPE
Mires and Peat, Volume 19 (2017), Article 22, 1–17, http://www.mires-and-peat.net/, ISSN 1819-754X
© 2017 International Mire Conservation Group and International Peatland Society, DOI: 10.19189/MaP.2016.OMB.264
12
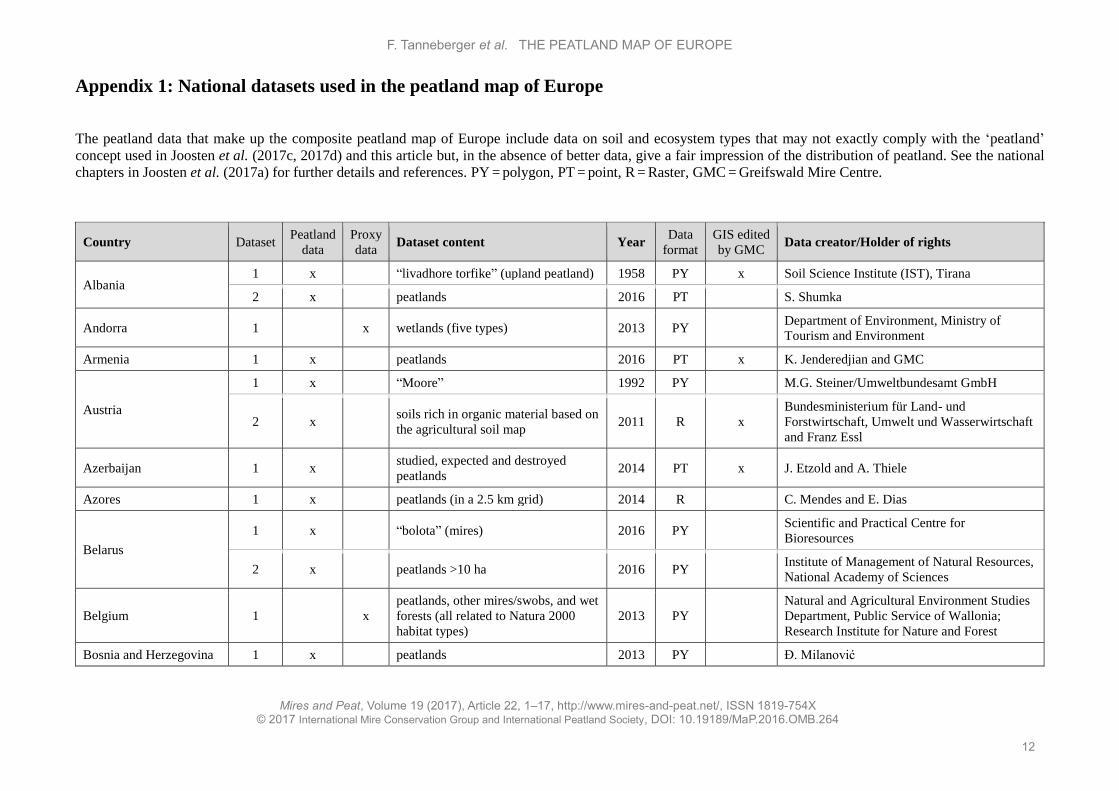
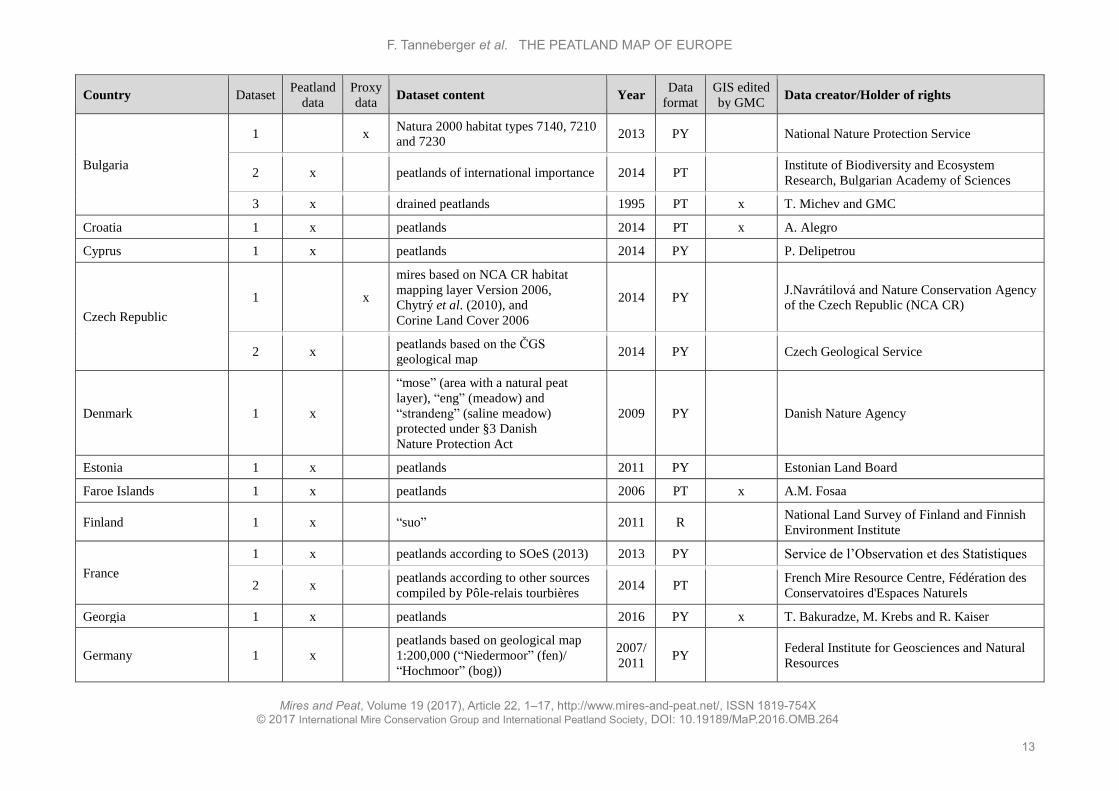
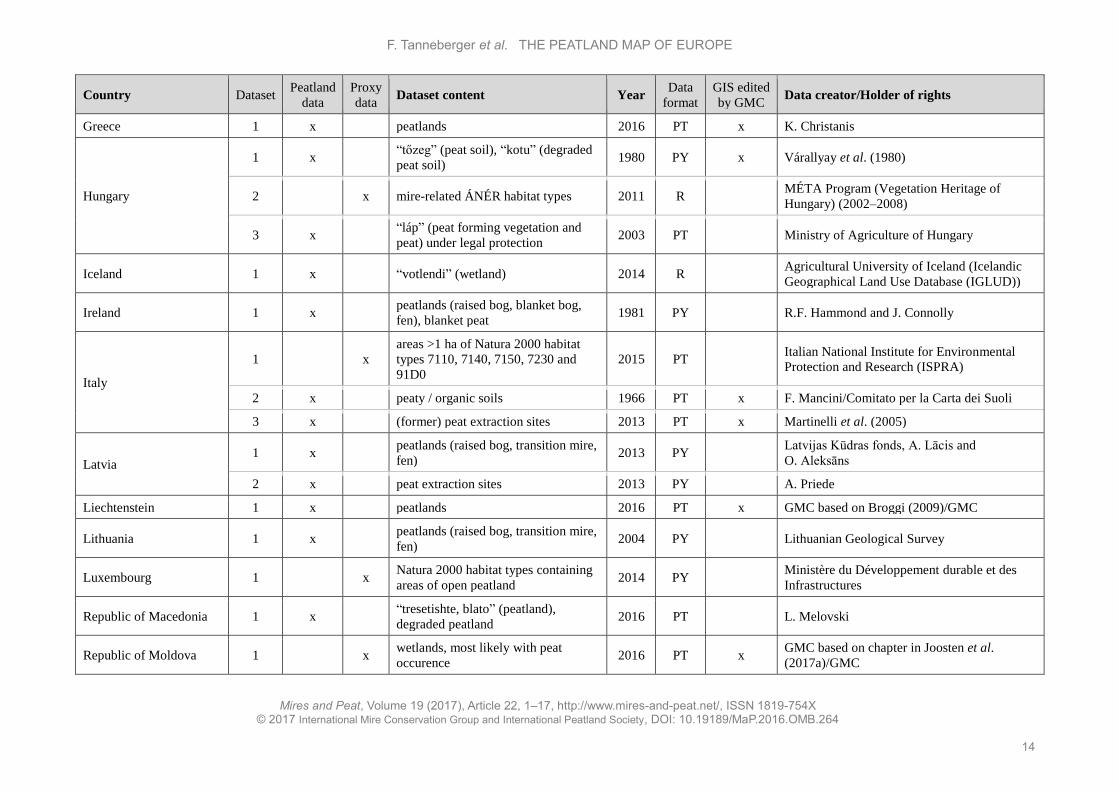
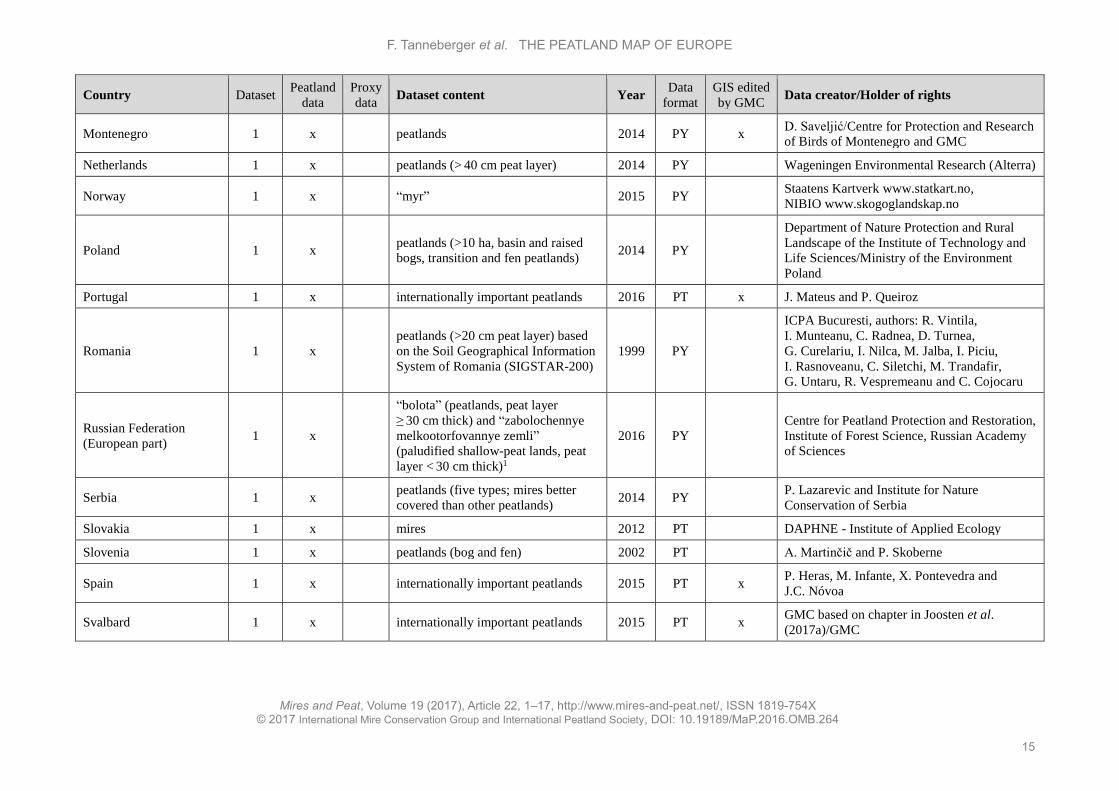
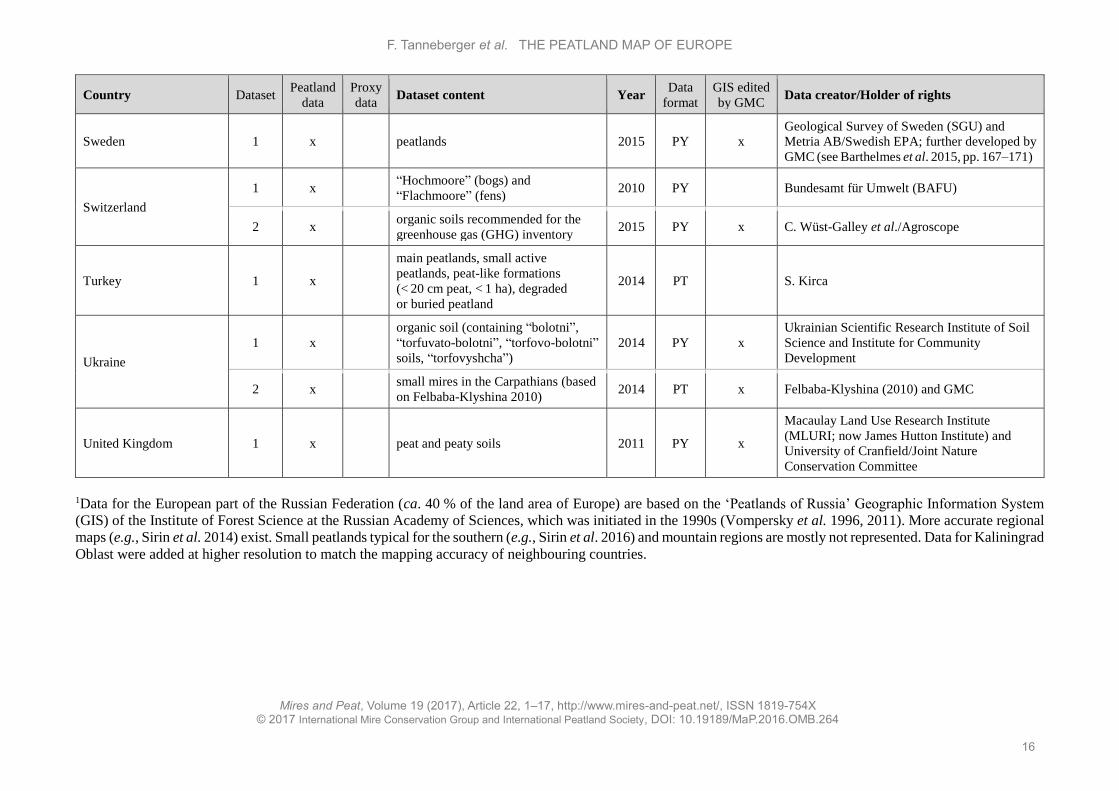
Appendix 1: National datasets used in the peatland map of Europe
The peatland data that make up the composite peatland map of Europe include data on soil and ecosystem types that may not exactly comply with the ‘peatland’
concept used in Joosten et al. (2017c, 2017d) and this article but, in the absence of better data, give a fair impression of the distribution of peatland. See the national
chapters in Joosten et al. (2017a) for further details and references. PY = polygon, PT = point, R = Raster, GMC = Greifswald Mire Centre.
Country Dataset Peatland
data
Proxy
data Dataset content Year
Data
format
GIS edited
by GMC Data creator/Holder of rights
Albania 1 x “livadhore torfike” (upland peatland) 1958 PY x Soil Science Institute (IST), Tirana
2 x peatlands 2016 PT S. Shumka
Andorra 1 x wetlands (five types) 2013 PY Department of Environment, Ministry of
Tourism and Environment
Armenia 1 x peatlands 2016 PT x K. Jenderedjian and GMC
Austria
1 x “Moore” 1992 PY M.G. Steiner/Umweltbundesamt GmbH
2 x soils rich in organic material based on
the agricultural soil map 2011 R x
Bundesministerium für Land- und
Forstwirtschaft, Umwelt und Wasserwirtschaft
and Franz Essl
Azerbaijan 1 x studied, expected and destroyed
peatlands 2014 PT x J. Etzold and A. Thiele
Azores 1 x peatlands (in a 2.5 km grid) 2014 R C. Mendes and E. Dias
Belarus
1 x “bolota” (mires) 2016 PY Scientific and Practical Centre for
Bioresources
2 x peatlands >10 ha 2016 PY Institute of Management of Natural Resources,
National Academy of Sciences
Belgium 1 x
peatlands, other mires/swobs, and wet
forests (all related to Natura 2000
habitat types)
2013 PY Natural and Agricultural Environment Studies
Department, Public Service of Wallonia;
Research Institute for Nature and Forest
Bosnia and Herzegovina 1 x peatlands 2013 PY Đ. Milanović
Page 13
F. Tanneberger et al. THE PEATLAND MAP OF EUROPE
Mires and Peat, Volume 19 (2017), Article 22, 1–17, http://www.mires-and-peat.net/, ISSN 1819-754X
© 2017 International Mire Conservation Group and International Peatland Society, DOI: 10.19189/MaP.2016.OMB.264
13
Country Dataset Peatland
data
Proxy
data Dataset content Year
Data
format
GIS edited
by GMC Data creator/Holder of rights
Bulgaria
1 x Natura 2000 habitat types 7140, 7210
and 7230 2013 PY National Nature Protection Service
2 x peatlands of international importance 2014 PT Institute of Biodiversity and Ecosystem
Research, Bulgarian Academy of Sciences
3 x drained peatlands 1995 PT x T. Michev and GMC
Croatia 1 x peatlands 2014 PT x A. Alegro
Cyprus 1 x peatlands 2014 PY P. Delipetrou
Czech Republic
1 x
mires based on NCA CR habitat
mapping layer Version 2006,
Chytrý et al. (2010), and
Corine Land Cover 2006
2014 PY J.Navrátilová and Nature Conservation Agency
of the Czech Republic (NCA CR)
2 x peatlands based on the ČGS
geological map 2014 PY Czech Geological Service
Denmark 1 x
“mose” (area with a natural peat
layer), “eng” (meadow) and
“strandeng” (saline meadow)
protected under §3 Danish
Nature Protection Act
2009 PY Danish Nature Agency
Estonia 1 x peatlands 2011 PY Estonian Land Board
Faroe Islands 1 x peatlands 2006 PT x A.M. Fosaa
Finland 1 x “suo” 2011 R National Land Survey of Finland and Finnish
Environment Institute
France
1 x peatlands according to SOeS (2013) 2013 PY Service de l’Observation et des Statistiques
2 x peatlands according to other sources
compiled by Pôle-relais tourbières 2014 PT French Mire Resource Centre, Fédération des
Conservatoires d'Espaces Naturels
Georgia 1 x peatlands 2016 PY x T. Bakuradze, M. Krebs and R. Kaiser
Germany 1 x peatlands based on geological map
1:200,000 (“Niedermoor” (fen)/
“Hochmoor” (bog))
2007/
2011 PY Federal Institute for Geosciences and Natural
Resources
Page 14
F. Tanneberger et al. THE PEATLAND MAP OF EUROPE
Mires and Peat, Volume 19 (2017), Article 22, 1–17, http://www.mires-and-peat.net/, ISSN 1819-754X
© 2017 International Mire Conservation Group and International Peatland Society, DOI: 10.19189/MaP.2016.OMB.264
14
Country Dataset Peatland
data
Proxy
data Dataset content Year
Data
format
GIS edited
by GMC Data creator/Holder of rights
Greece 1 x peatlands 2016 PT x K. Christanis
Hungary
1 x “tőzeg” (peat soil), “kotu” (degraded
peat soil) 1980 PY x Várallyay et al. (1980)
2 x mire-related ÁNÉR habitat types 2011 R MÉTA Program (Vegetation Heritage of
Hungary) (2002–2008)
3 x “láp” (peat forming vegetation and
peat) under legal protection 2003 PT Ministry of Agriculture of Hungary
Iceland 1 x “votlendi” (wetland) 2014 R Agricultural University of Iceland (Icelandic
Geographical Land Use Database (IGLUD))
Ireland 1 x peatlands (raised bog, blanket bog,
fen), blanket peat 1981 PY R.F. Hammond and J. Connolly
Italy
1 x
areas >1 ha of Natura 2000 habitat
types 7110, 7140, 7150, 7230 and
91D0
2015 PT Italian National Institute for Environmental
Protection and Research (ISPRA)
2 x peaty / organic soils 1966 PT x F. Mancini/Comitato per la Carta dei Suoli
3 x (former) peat extraction sites 2013 PT x Martinelli et al. (2005)
Latvia 1 x peatlands (raised bog, transition mire,
fen) 2013 PY Latvijas Kūdras fonds, A. Lācis and
O. Aleksāns
2 x peat extraction sites 2013 PY A. Priede
Liechtenstein 1 x peatlands 2016 PT x GMC based on Broggi (2009)/GMC
Lithuania 1 x peatlands (raised bog, transition mire,
fen) 2004 PY Lithuanian Geological Survey
Luxembourg 1 x Natura 2000 habitat types containing
areas of open peatland 2014 PY Ministère du Développement durable et des
Infrastructures
Republic of Macedonia 1 x “tresetishte, blato” (peatland),
degraded peatland 2016 PT L. Melovski
Republic of Moldova 1 x wetlands, most likely with peat
occurence 2016 PT x
GMC based on chapter in Joosten et al.
(2017a)/GMC
Page 15
F. Tanneberger et al. THE PEATLAND MAP OF EUROPE
Mires and Peat, Volume 19 (2017), Article 22, 1–17, http://www.mires-and-peat.net/, ISSN 1819-754X
© 2017 International Mire Conservation Group and International Peatland Society, DOI: 10.19189/MaP.2016.OMB.264
15
Country Dataset Peatland
data
Proxy
data Dataset content Year
Data
format
GIS edited
by GMC Data creator/Holder of rights
Montenegro 1 x peatlands 2014 PY x D. Saveljić/Centre for Protection and Research
of Birds of Montenegro and GMC
Netherlands 1 x peatlands (> 40 cm peat layer) 2014 PY Wageningen Environmental Research (Alterra)
Norway 1 x “myr” 2015 PY Staatens Kartverk www.statkart.no,
NIBIO www.skogoglandskap.no
Poland 1 x peatlands (>10 ha, basin and raised
bogs, transition and fen peatlands) 2014 PY
Department of Nature Protection and Rural
Landscape of the Institute of Technology and
Life Sciences/Ministry of the Environment
Poland
Portugal 1 x internationally important peatlands 2016 PT x J. Mateus and P. Queiroz
Romania 1 x peatlands (>20 cm peat layer) based
on the Soil Geographical Information
System of Romania (SIGSTAR-200)
1999 PY
ICPA Bucuresti, authors: R. Vintila,
I. Munteanu, C. Radnea, D. Turnea,
G. Curelariu, I. Nilca, M. Jalba, I. Piciu,
I. Rasnoveanu, C. Siletchi, M. Trandafir,
G. Untaru, R. Vespremeanu and C. Cojocaru
Russian Federation
(European part) 1 x
“bolota” (peatlands, peat layer
≥ 30 cm thick) and “zabolochennye
melkootorfovannye zemli”
(paludified shallow-peat lands, peat
layer < 30 cm thick)1
2016 PY Centre for Peatland Protection and Restoration,
Institute of Forest Science, Russian Academy
of Sciences
Serbia 1 x peatlands (five types; mires better
covered than other peatlands) 2014 PY P. Lazarevic and Institute for Nature
Conservation of Serbia
Slovakia 1 x mires 2012 PT DAPHNE - Institute of Applied Ecology
Slovenia 1 x peatlands (bog and fen) 2002 PT A. Martinčič and P. Skoberne
Spain 1 x internationally important peatlands 2015 PT x P. Heras, M. Infante, X. Pontevedra and
J.C. Nóvoa
Svalbard 1 x internationally important peatlands 2015 PT x GMC based on chapter in Joosten et al.
(2017a)/GMC
Page 16
F. Tanneberger et al. THE PEATLAND MAP OF EUROPE
Mires and Peat, Volume 19 (2017), Article 22, 1–17, http://www.mires-and-peat.net/, ISSN 1819-754X
© 2017 International Mire Conservation Group and International Peatland Society, DOI: 10.19189/MaP.2016.OMB.264
16
Country Dataset Peatland
data
Proxy
data Dataset content Year
Data
format
GIS edited
by GMC Data creator/Holder of rights
Sweden 1 x peatlands 2015 PY x
Geological Survey of Sweden (SGU) and
Metria AB/Swedish EPA; further developed by
GMC (see Barthelmes et al. 2015, pp. 167–171)
Switzerland
1 x “Hochmoore” (bogs) and
“Flachmoore” (fens) 2010 PY Bundesamt für Umwelt (BAFU)
2 x organic soils recommended for the
greenhouse gas (GHG) inventory 2015 PY x C. Wüst-Galley et al./Agroscope
Turkey 1 x
main peatlands, small active
peatlands, peat-like formations
(< 20 cm peat, < 1 ha), degraded
or buried peatland
2014 PT S. Kirca
Ukraine
1 x organic soil (containing “bolotni”,
“torfuvato-bolotni”, “torfovo-bolotni”
soils, “torfovyshcha”)
2014 PY x
Ukrainian Scientific Research Institute of Soil
Science and Institute for Community
Development
2 x small mires in the Carpathians (based
on Felbaba-Klyshina 2010) 2014 PT x Felbaba-Klyshina (2010) and GMC
United Kingdom 1 x peat and peaty soils 2011 PY x
Macaulay Land Use Research Institute
(MLURI; now James Hutton Institute) and
University of Cranfield/Joint Nature
Conservation Committee
1Data for the European part of the Russian Federation (ca. 40 % of the land area of Europe) are based on the ‘Peatlands of Russia’ Geographic Information System
(GIS) of the Institute of Forest Science at the Russian Academy of Sciences, which was initiated in the 1990s (Vompersky et al. 1996, 2011). More accurate regional
maps (e.g., Sirin et al. 2014) exist. Small peatlands typical for the southern (e.g., Sirin et al. 2016) and mountain regions are mostly not represented. Data for Kaliningrad
Oblast were added at higher resolution to match the mapping accuracy of neighbouring countries.
Page 17
F. Tanneberger et al. THE PEATLAND MAP OF EUROPE
Mires and Peat, Volume 19 (2017), Article 22, 1–17, http://www.mires-and-peat.net/, ISSN 1819-754X
© 2017 International Mire Conservation Group and International Peatland Society, DOI: 10.19189/MaP.2016.OMB.264
17
Appendix 2: Additional author affiliations (see title page) 2 Faculty of Biotechnology and Food, Agricultural University of Tirana, Tirana, Albania 3 Department of Environment, Ministry of Tourism and Environment, Andorra la Vella, Andorra 4 Agency of Bioresources Management, Ministry of Nature Protection, Yerevan, Armenia 5 Division of Conservation Biology, Vegetation and Landscape Ecology, University of Vienna, Vienna, Austria 6 Faculty of Agrarian Sciences and Environment, Azores University, Angra do Heroismo, Portugal 7 Institute of Zoology, National Academy of Sciences of Belarus, Minsk, Belarus 8 Natural and Agricultural Environment Studies Department, Public Service of Wallonia, Gembloux, Belgium 9 Faculty of Forestry, University of Banja Luka, Banja Luka, Bosnia-Herzegovina 10 Institute of Biodiversity and Ecosystem Research, Bulgarian Academy of Sciences, Sofia, Bulgaria 11 Department of Biology, University of Zagreb, Zagreb, Croatia 12 Department of Botany, Faculty of Biology, National and Kapodistrian University of Athens, Athens, Greece 13 Institute of Botany, The Czech Academy of Sciences, Třeboň, Czech Republic 14 Risager Consult, Randers, Denmark 15 Nature Conservation Department, Environmental Board, Tallinn, Estonia 16 Faroese Museum of Natural History, Tórshavn, Faroe Islands 17 Finnish Environment Institute, Helsinki, Finland 18 French Mire Resource Centre, Fédération des Conservatoires d'Espaces Naturels, Besançon, France 19 Department of Geodesy and Geoinformatics, Technical University of Georgia, Tbilisi, Georgia 20 Leibniz Centre for Agricultural Landscape Research, Müncheberg, Germany 21 Department of Geology, University of Patras, Rio-Patras, Greece 22 Department of Botany, Hungarian Natural History Museum, Budapest, Hungary 23 Agricultural University of Iceland, Keldnaholt, Iceland 24 School of History and Geography, Dublin City University, Dublin, Ireland 25 Department of Life Science and Biotechnologies, University of Ferrara, Ferrara, Italy 26 Environmental Protection Agency of Emilia Romagna Region, Reggio Emilia, Italy 27 Environment Modelling Centre, Technical University of Riga, Riga, Latvia 28 Nature Conservation Agency, Jūrmala, Latvia 29 State Service for Protected Areas under the Ministry of Environment, Protection and Management Division,
Vilnius, Lithuania 30 Faculty of Natural Sciences and Mathematics, Ss. Cyril and Methodius University, Skopje, Republic of
Macedonia 31 Institute of Ecology and Geography, Academy of Sciences of the Republic of Moldova, Chisinau, Republic of
Moldova 32 Centre for Protection and Research of Birds of Montenegro, BirdLife Affiliate Montenegro, Podgorica,
Montenegro 33 Wageningen Environmental Research (ALTERRA), Wageningen, Netherlands 34 NTNU University Museum, Norwegian University of Science and Technology, Trondheim, Norway 35 ITP - Institute of Technology and Life Sciences, Falenty, Poland 36 A-dos-Cunhados (Torres Vedras), Portugal 37 Danube Delta National Institute for Research and Development, Tulcea, Romania 38 Institute of Forest Science, Russian Academy of Sciences, Moscow, Russian Federation 39 Institute of Living Systems, Immanuel Kant Baltic Federal University, Kaliningrad, Russian Federation 40 Institute of Botany and Botanical Garden "Jevremovac", University of Belgrade – Faculty of Biology, Belgrade,
Serbia 41 DAPHNE – Institute of Applied Ecology, Bratislava, Slovakia 42 Ministry of the Environment and Spatial Planning, Ljubljana, Slovenia 43 Museo de Ciencias Naturales de Alava, Vitoria, Spain 44 Department of Soil Science and Agricultural Chemistry, University of Santiago de Compostela, Santiago de
Compostela, Spain 45 Swedish Environmental Protection Agency, Stockholm, Sweden 46 Swiss Federal Research Institute WSL, Birmensdorf, Switzerland 47 Agroscope, Zürich, Switzerland 48 Department of Silviculture, Faculty of Forestry, University of Istanbul, Istanbul, Turkey 49 Institute for Community Development, Kyiv, Ukraine 50 Sustainability Research Institute, University of East London, London, UK