The phenomenon of vehicle park brake rollaway By Andrew James McKinlay Submitted in accordance with the requirements for the degree of Doctor of Philosophy (PhD) The University of Leeds School of Mechanical Engineering August, 2007 The candidate confinns that the work submitted is hislher own and that appropriate credit has been given where reference has been made to the work of others. This copy has been supplied on the understanding that it is copyright material and that no quotation from the thesis may be published without proper , acknowledgement.
Transcript
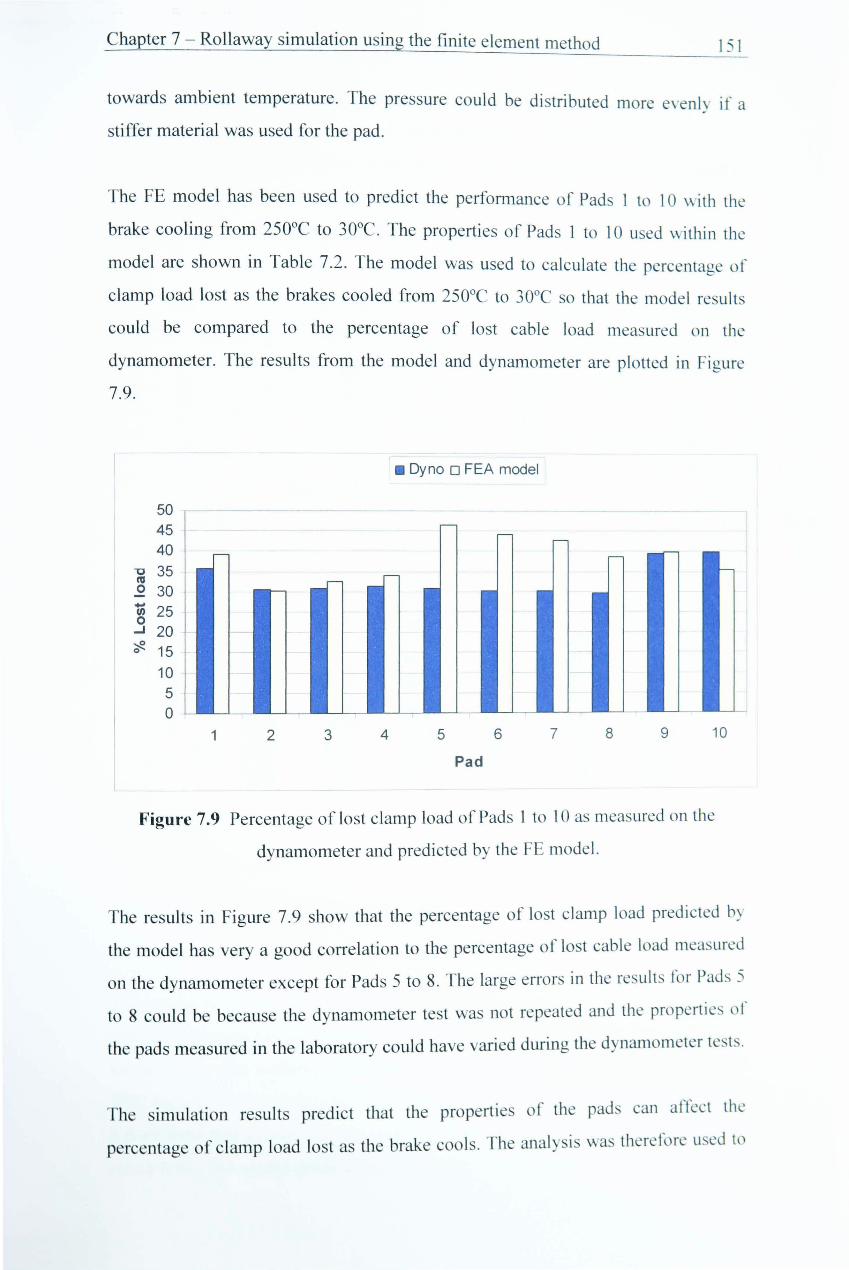
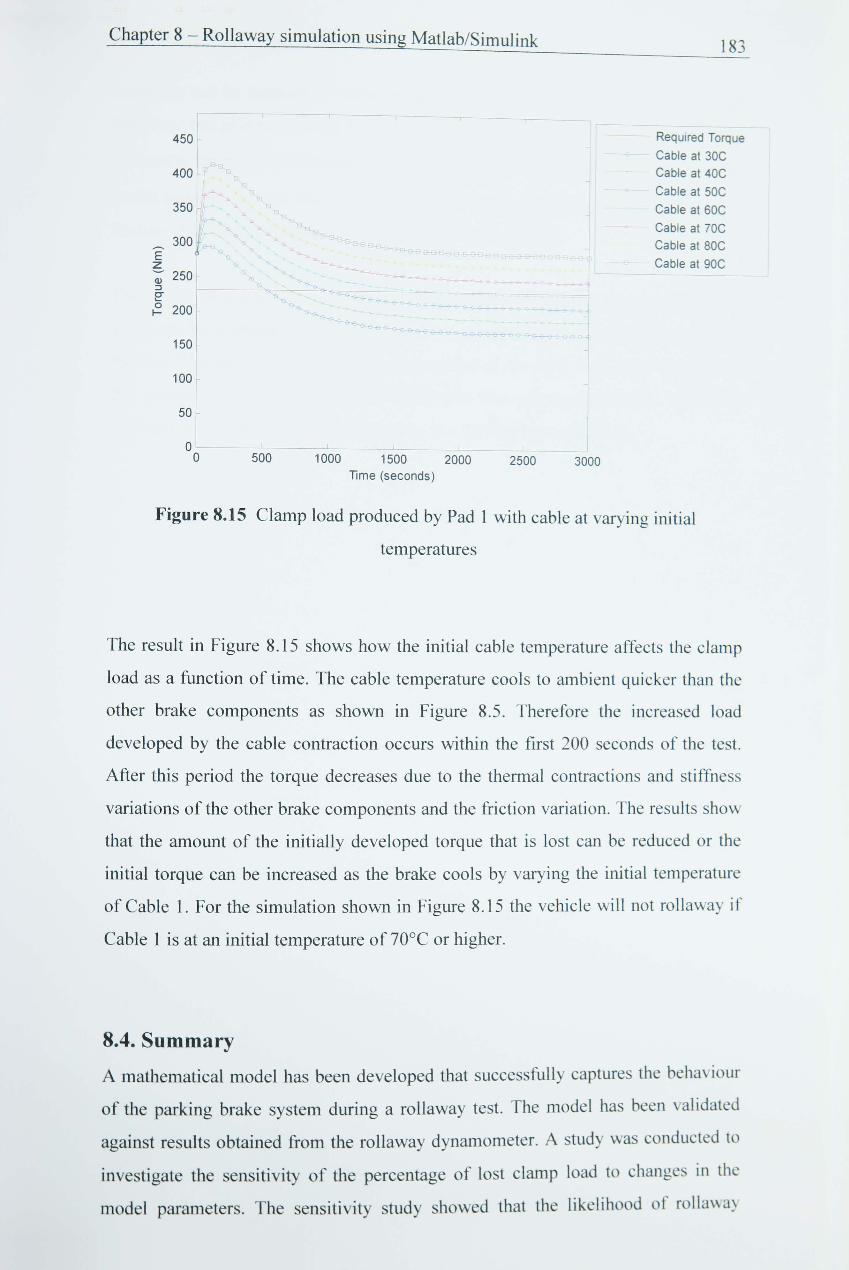
The phenomenon of vehicle park brake rollaway
By
Andrew James McKinlay
Submitted in accordance with the requirements for the degree of
Doctor of Philosophy (PhD)
The University of Leeds
School of Mechanical Engineering
August, 2007
The candidate confinns that the work submitted is hislher own and that appropriate
credit has been given where reference has been made to the work of others.
This copy has been supplied on the understanding that it is copyright material and
that no quotation from the thesis may be published without proper
, acknowledgement.
-11-
Acknowledgements
This work is dedicated to my parents. I would like to thank them for their continued
support and encouragement throughout my time studying and without whom none
of this would be possible. I would also like to thank all of my friends and family for
keeping me going throughout my period of further study and keeping a smile on my
face.
I would like to express my sincere gratitude to my two supervisors Dr. Peter Brooks
and Professor David Barton for their invaluable support and advise. I would also
like to thank all of the members of staff from the School of Mechanical Engineering
for their assistance over the years. A special thank you goes to Tony Wiese and
Dave Readman for their help and enthusiasm during all of the dynamometer work.
I wish to thank all the members of staff at Federal Mogul for their assistance,
financial support and collective knowledge, especially Alastair Bissett and David
Pindar.
Last but not least, I would like to thank Louise for her patience, understanding and
encouragement. Thank you.
- 111 -
Abstract
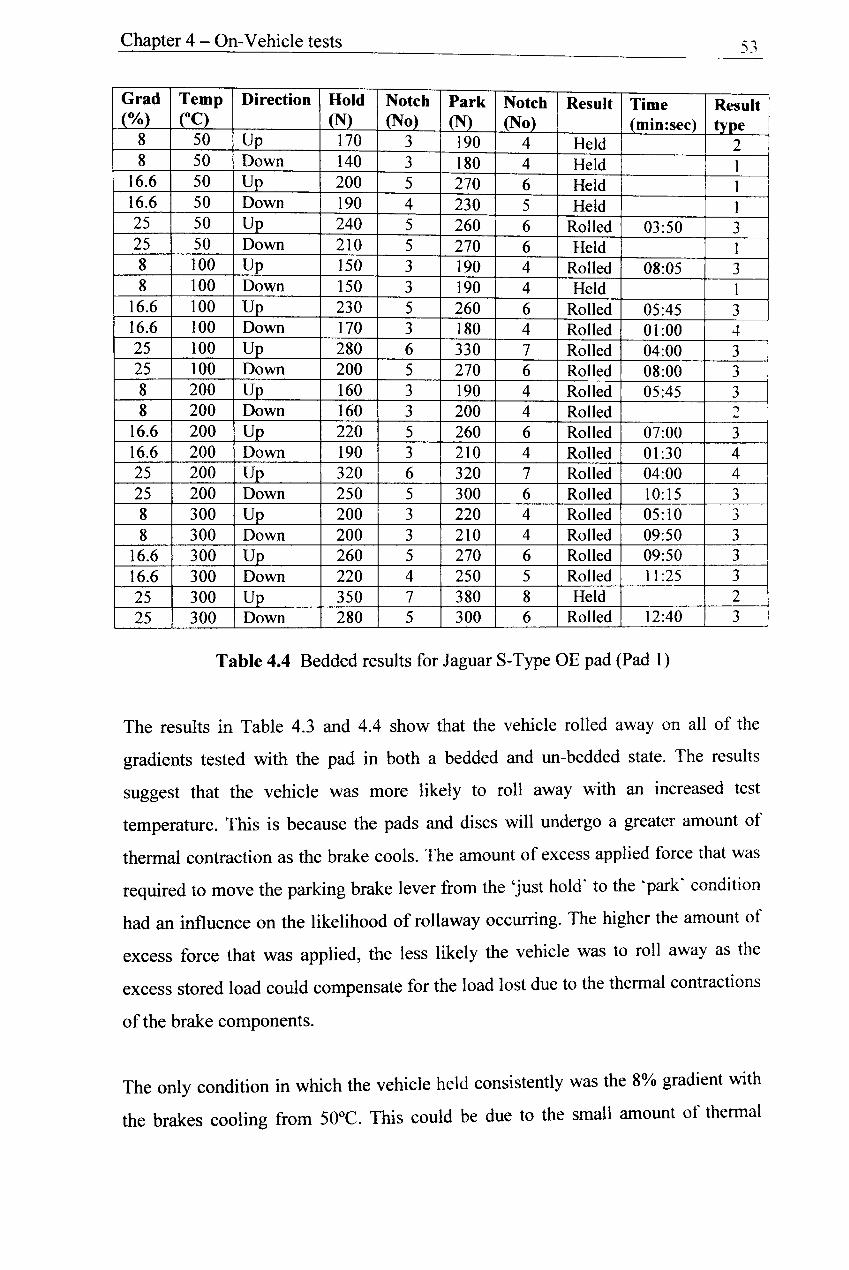
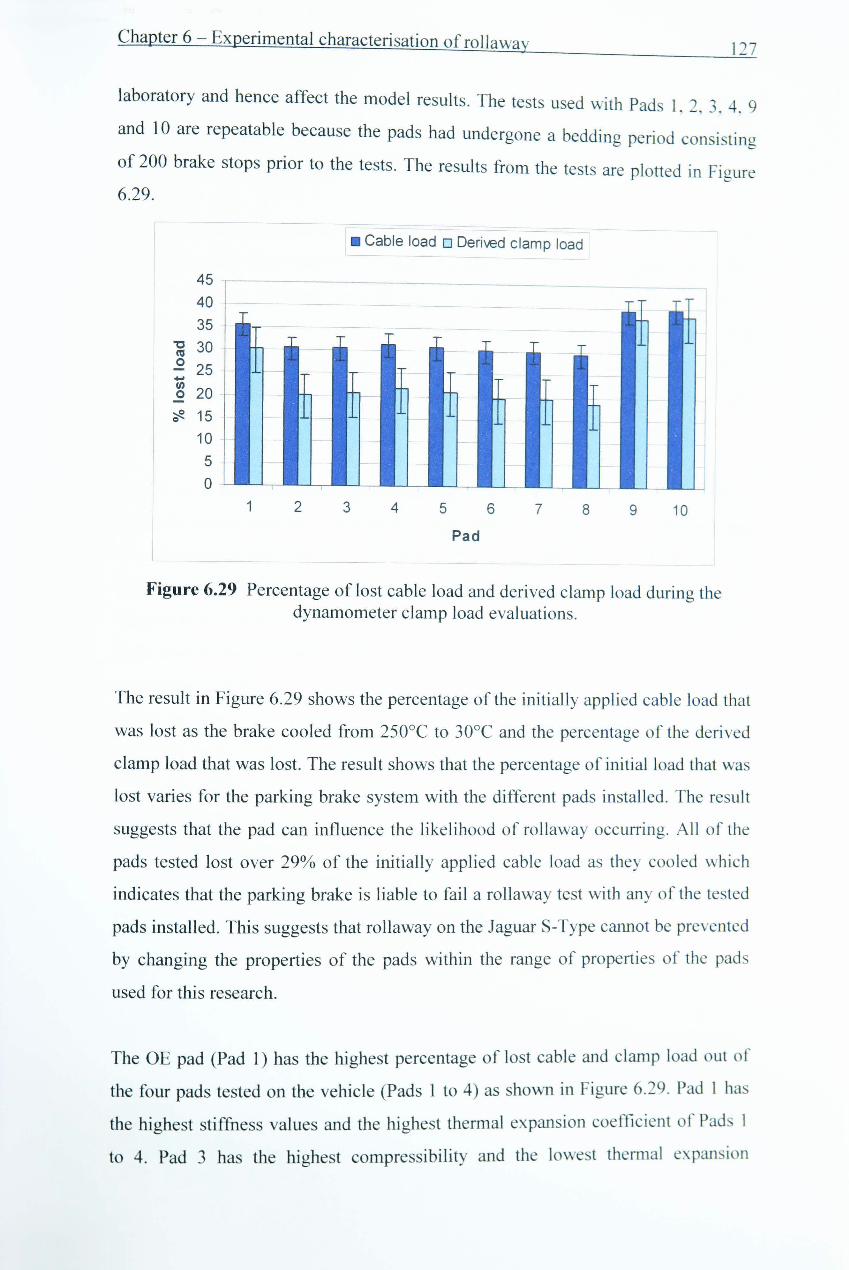
When a vehicle is parked on a slope with hot brakes, what appears to be a sufficient
parking brake action can sometimes become insufficient. When the brakes cool
down, the braking force reduces due to relaxation of the entire parking brake
system, and the vehicle may start to move, leading to obvious catastrophic
consequences. This phenomenon is known as vehicle rollaway. This thesis describes
the problem in detail and postulates a mechanism that accounts for the occurrence of
the rollaway event on vehicles using integrated rear callipers.
Different testing methods are presented that are used to investigate the propensity of
a vehicle's parking brake system to rollaway. These include on-vehicle evaluations
and laboratory based measurements. A description is given of a novel dynamometer
facility that was developed for this research that is capable of testing vehicle parking
brake systems for rollaway.
Two mathematical modelling techniques are presented that demonstrate how the
parking brake system parameters influence the likelihood of rollaway occurring. A
finite element model was used to simulate the change in contact pressure at the
frictional interface during a rollaway event. A numerical model was also used to
predict the change in torque developed by a parking brake system cooling from an
initial elevated temperature. The change in clamp load at the frictional interface was
modelled using an essentially I-D quasi-static system that showed how the stiffness
and the thermal properties of the system qualitatively affect the phenomenon.
The research found that rollaway does not always start with a uniform motion, but
with a stick/slip motion. The likelihood of rollaway occurring was found to be
directly linked to the temperature of the brake when the vehicle is parked. Rollaway
can be reduced by lowering the initial temperature of the brake prior to parking.
Rollaway can also be reduced by increasing the input load to the system when
applying the parking brake. The research identifies the key design parameters of the
brake system components whose values require close control within the real system
if rollaway is to be avoided.
- IV-
Contents
Acknowledgements .................................................................................................... ii
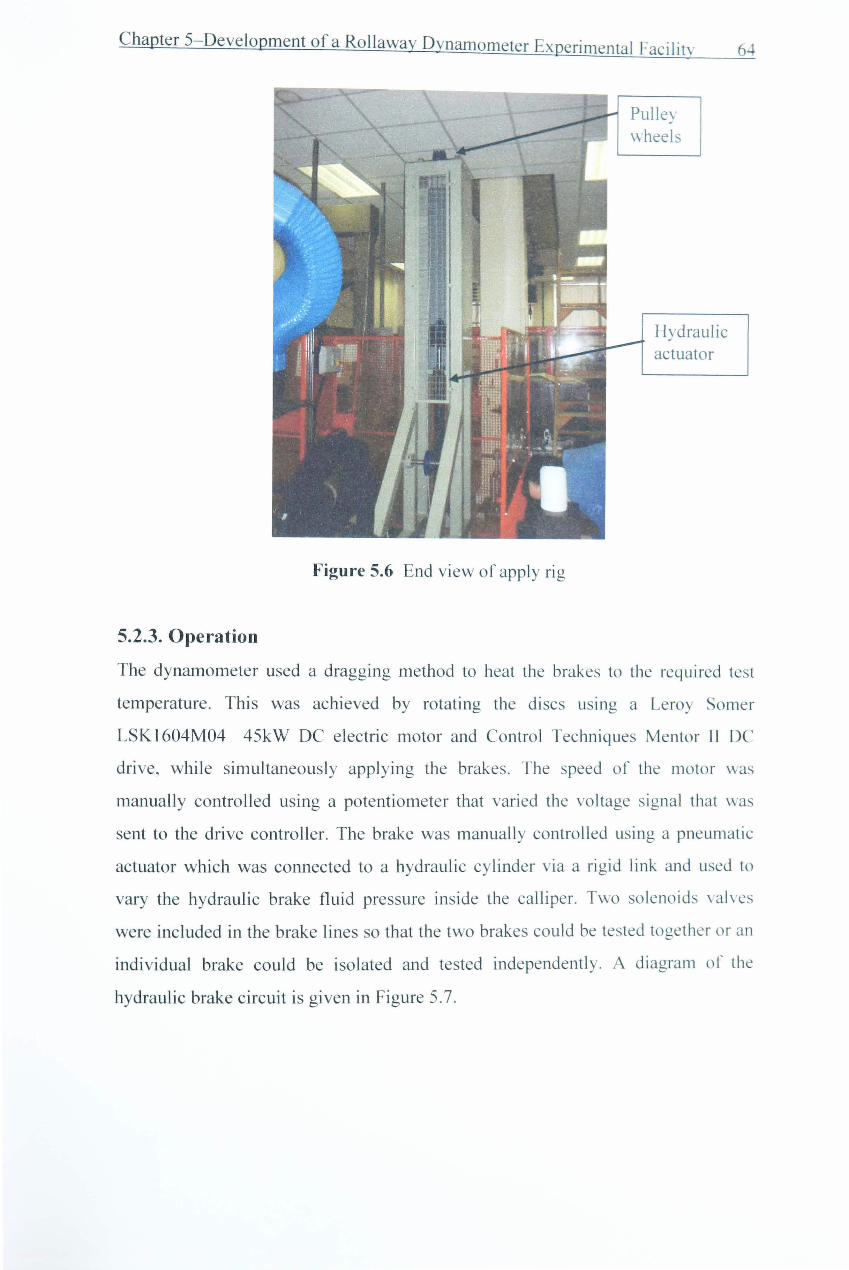
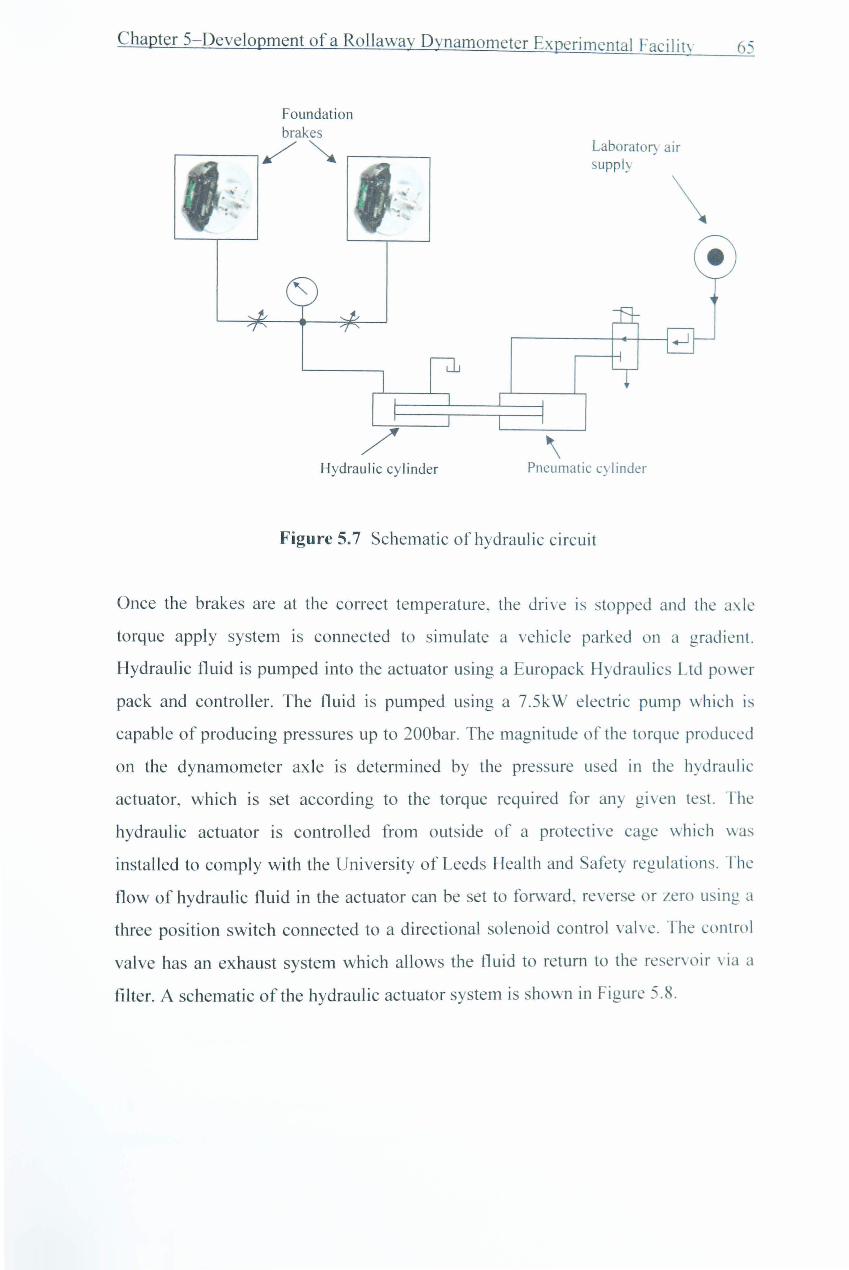
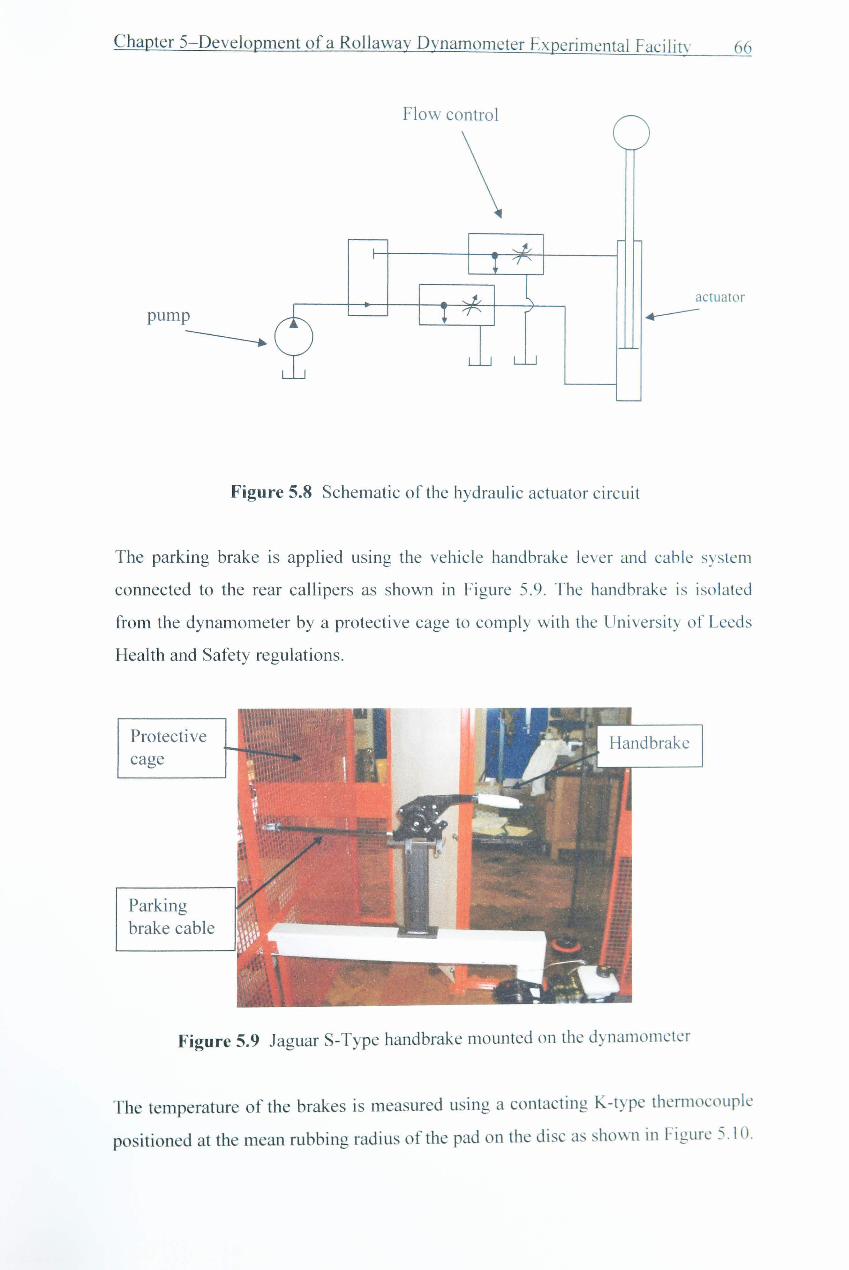
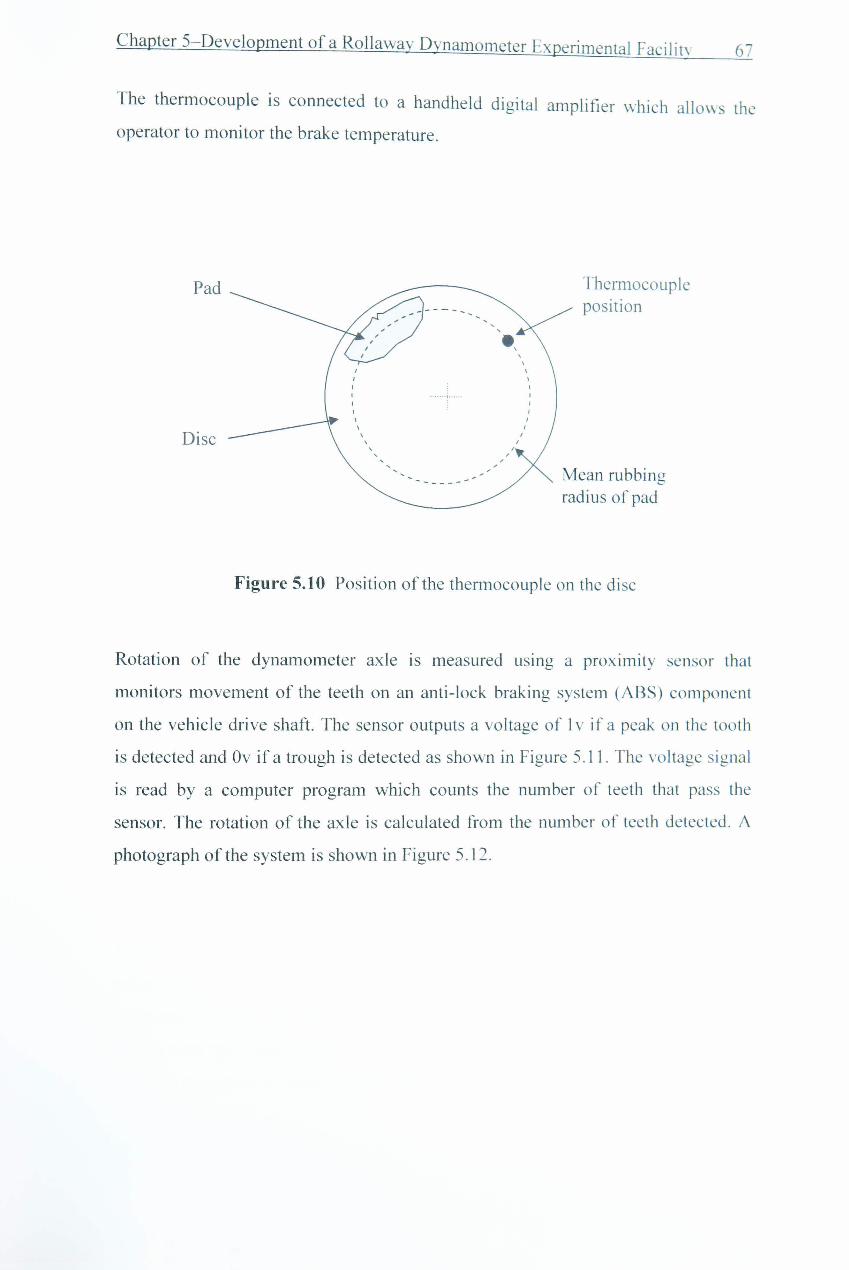
Chapter 5 Development of a Rollaway Dynamometer Experimental Facility ..................................................................................................... , ................ 60
5.8.1. Heating the brakes to a specified temperature .............................. 88
5.8.2. Application of a constant torque .................................................. 88
5.8.3. Actuating the parking brake and measurig the clamp load .......... 89
5.8.4. Clamp force measurement as a function of temperature .............. 92
5.8.5. Measuring the static coefficient of friction a s a function of temperature .............................................................................................. 92
Figure 1.1 Schematic of a manually operated parking brake system with integrated rear callipers .•.........•.....•.................................................................... 2
Figure 2.11 Cable system and connecting link ........................................•............... 14
Figure 2.12 Parking brake cable attachment point to the calliper .........•....•............ 14
Figure 2.13 Schematic of a ball in ramp mechanism with parking brake not applied ........•.............................................•.•.................•..........•......................•. 16
Figure 2.14 Schematic of a ball in ramp mechanism with parking brake applied ..••...........................•.................•...............•...........................•................ 16
Figure 2.15 Schematic of a Bosch BIR3 calliper design ......................................... 17
Figure 2.16 Back plate with Nucap Retention System ........•................................... 19
Figure 2.17 Schematic of a brake pad ..................................................................... 19
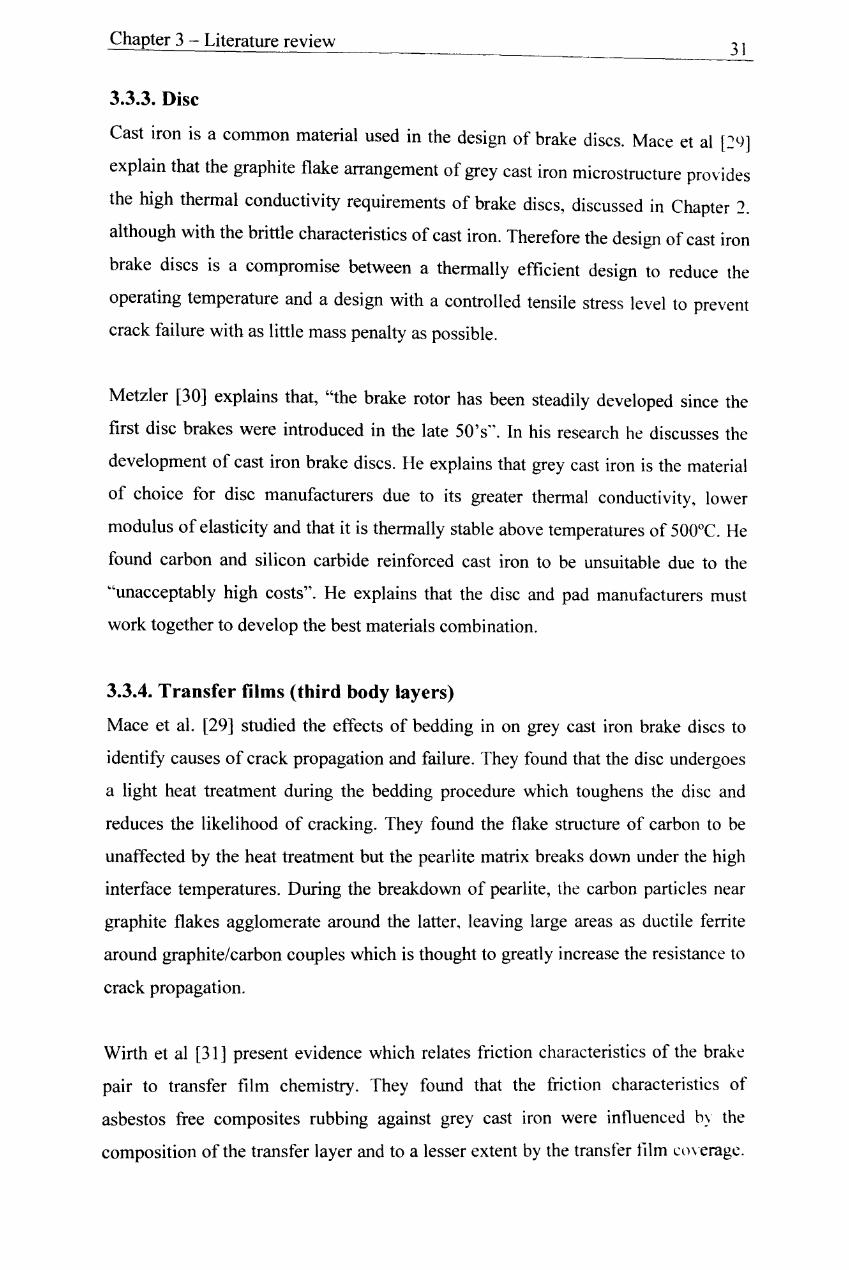
Figure 3.1 Location of the 'neck' on a brake disc .................................................... 32
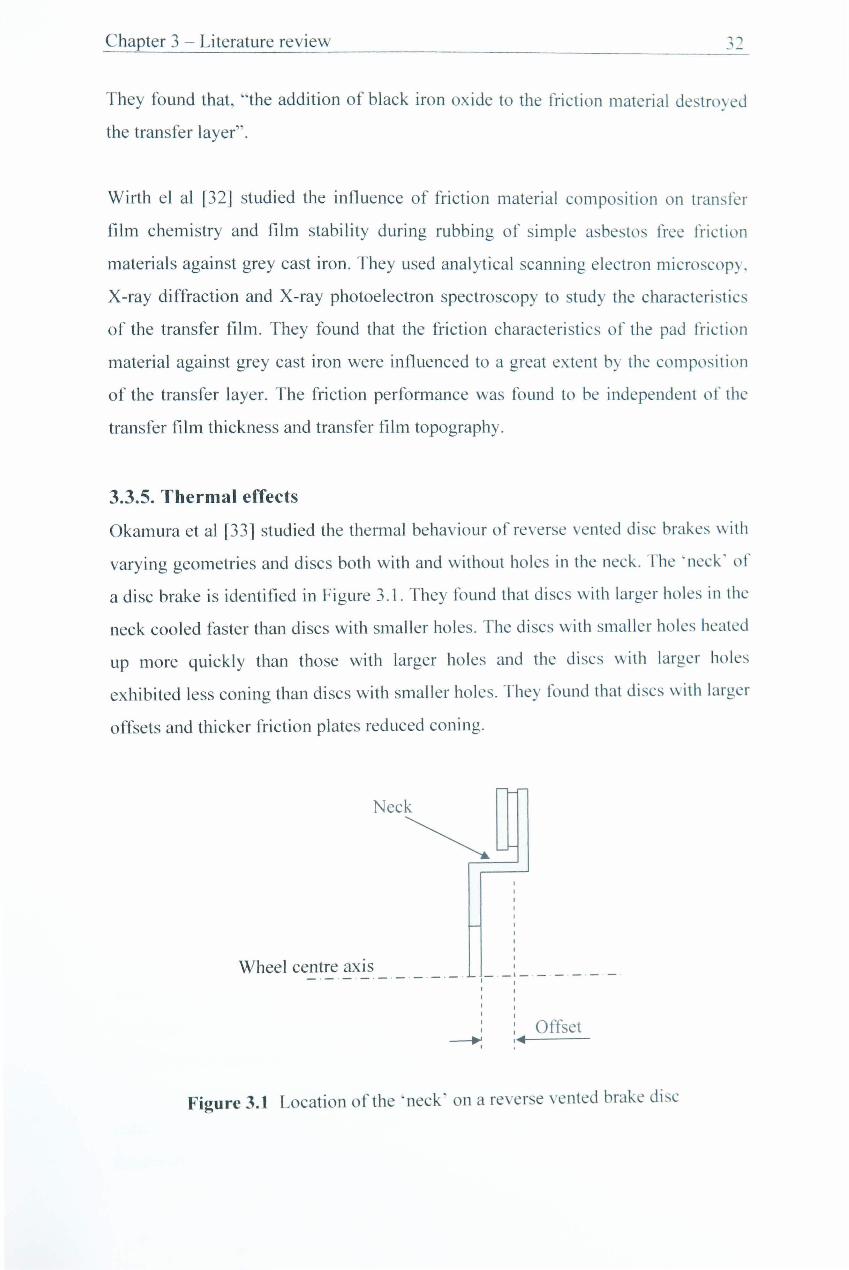
Figure 3.2 Schematic of an inboard vented disc brake ................•........................... 33
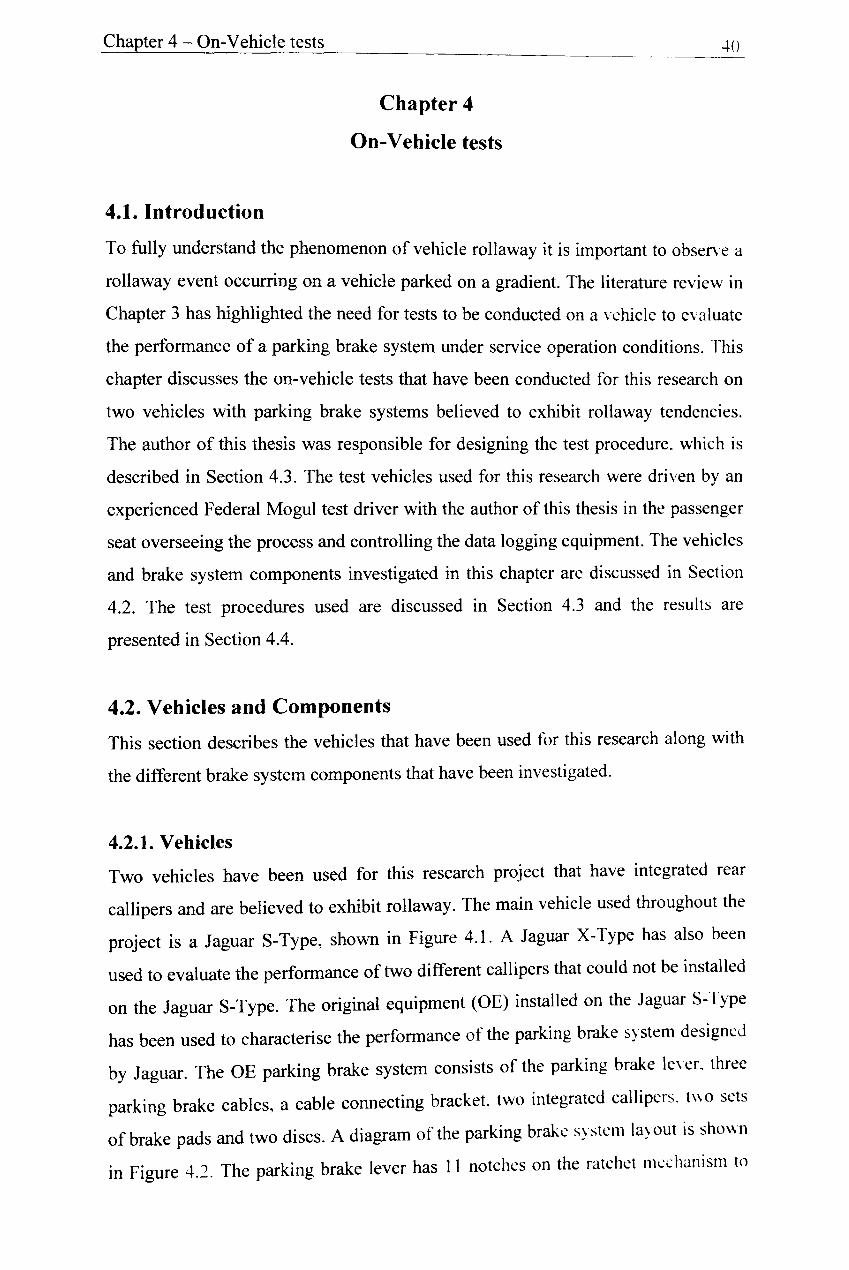
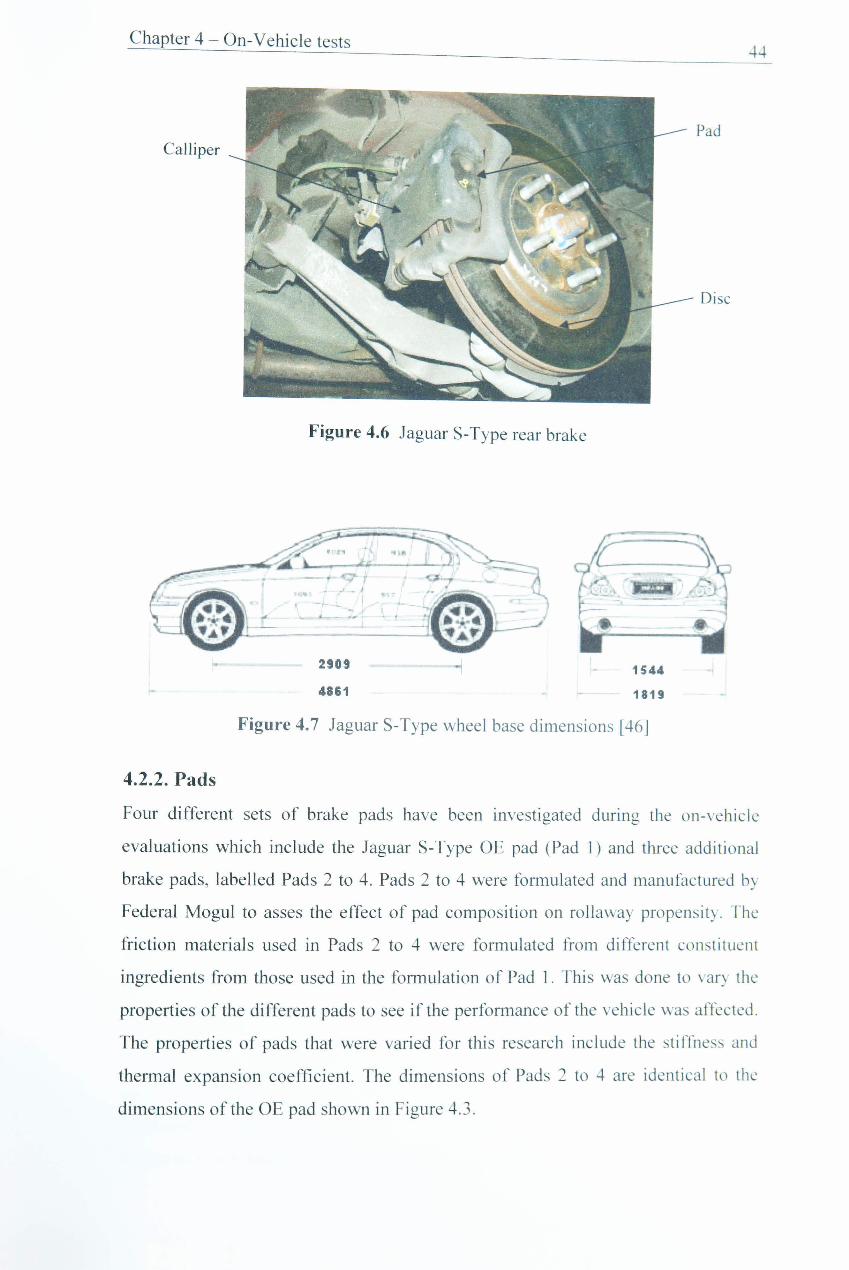
Figure 4.1 Jaguar S-Type used for the on-vehicle tests .......................................... .41
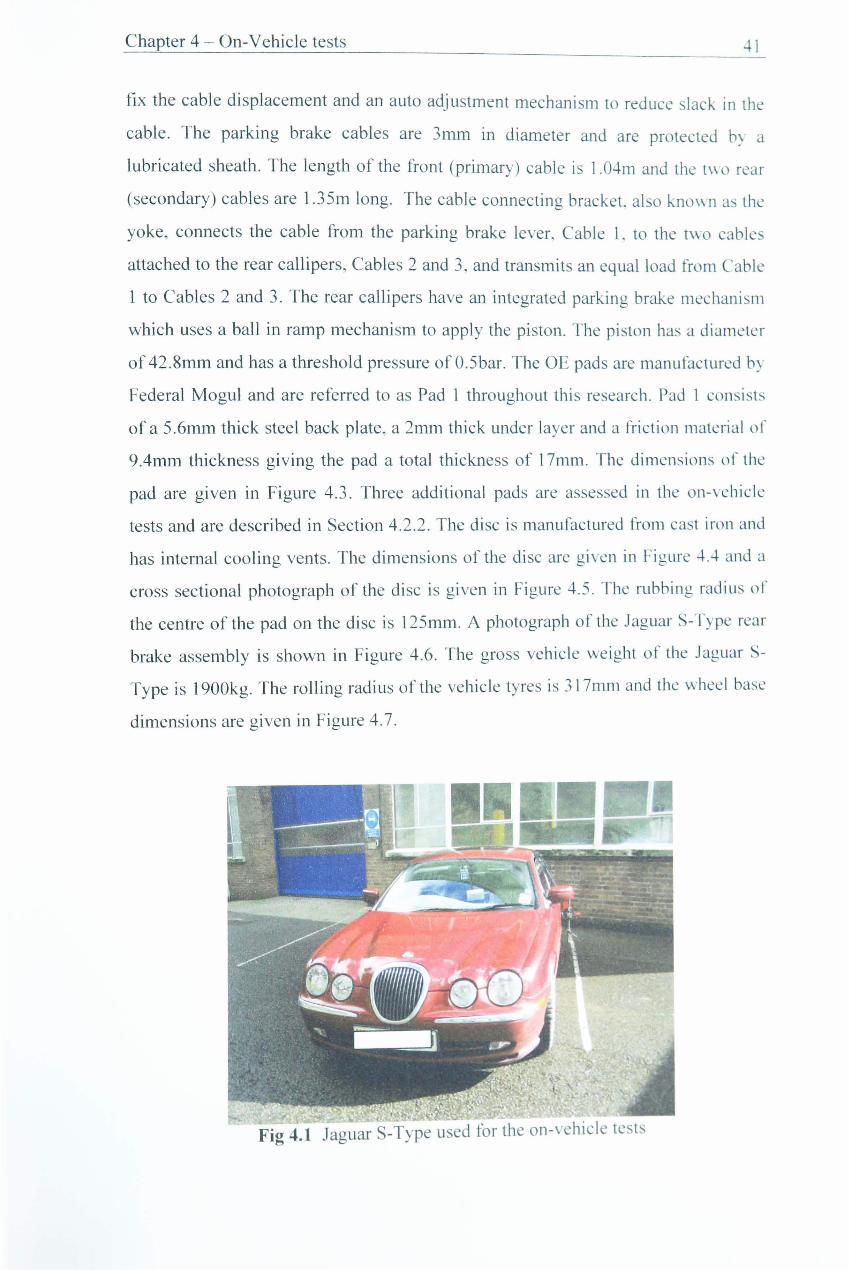
Figure 4.2 Layout of the Jaguar S-Type parking brake system ...•........................... 42
Figure 4.3 Dimensions of the Jaguar S-Type 0 E pad ............................................. 42
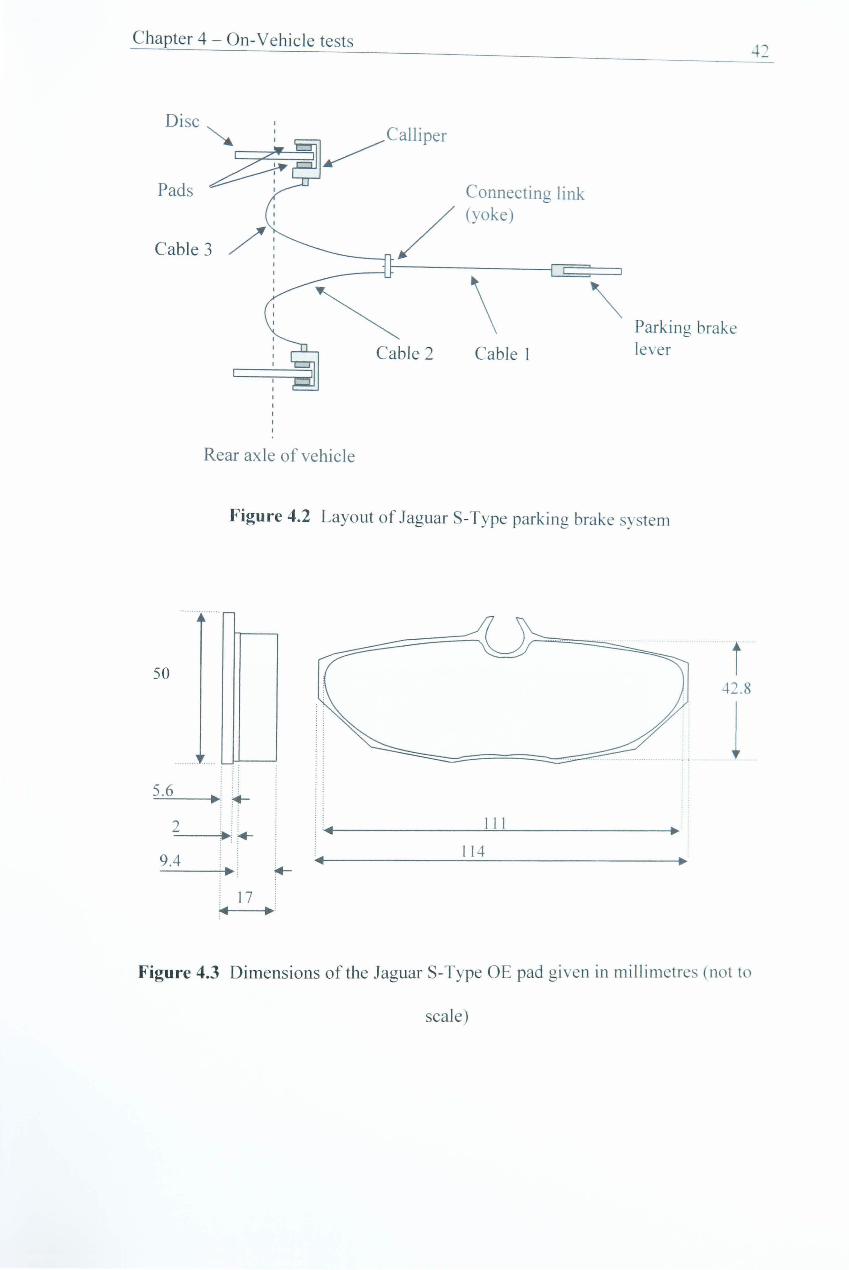
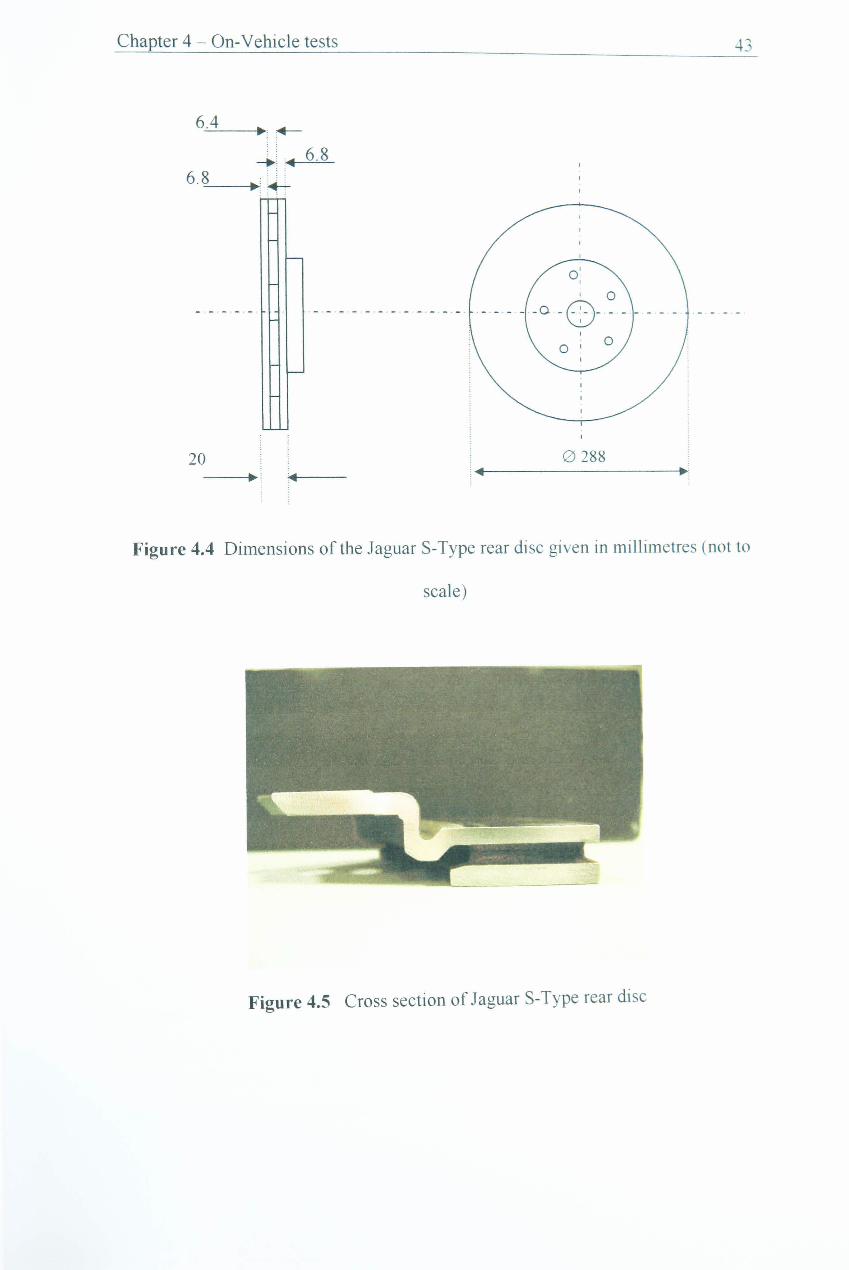
Figure 4.4 Dimensions of the Jaguar S-Type rear disc ........................................... 43
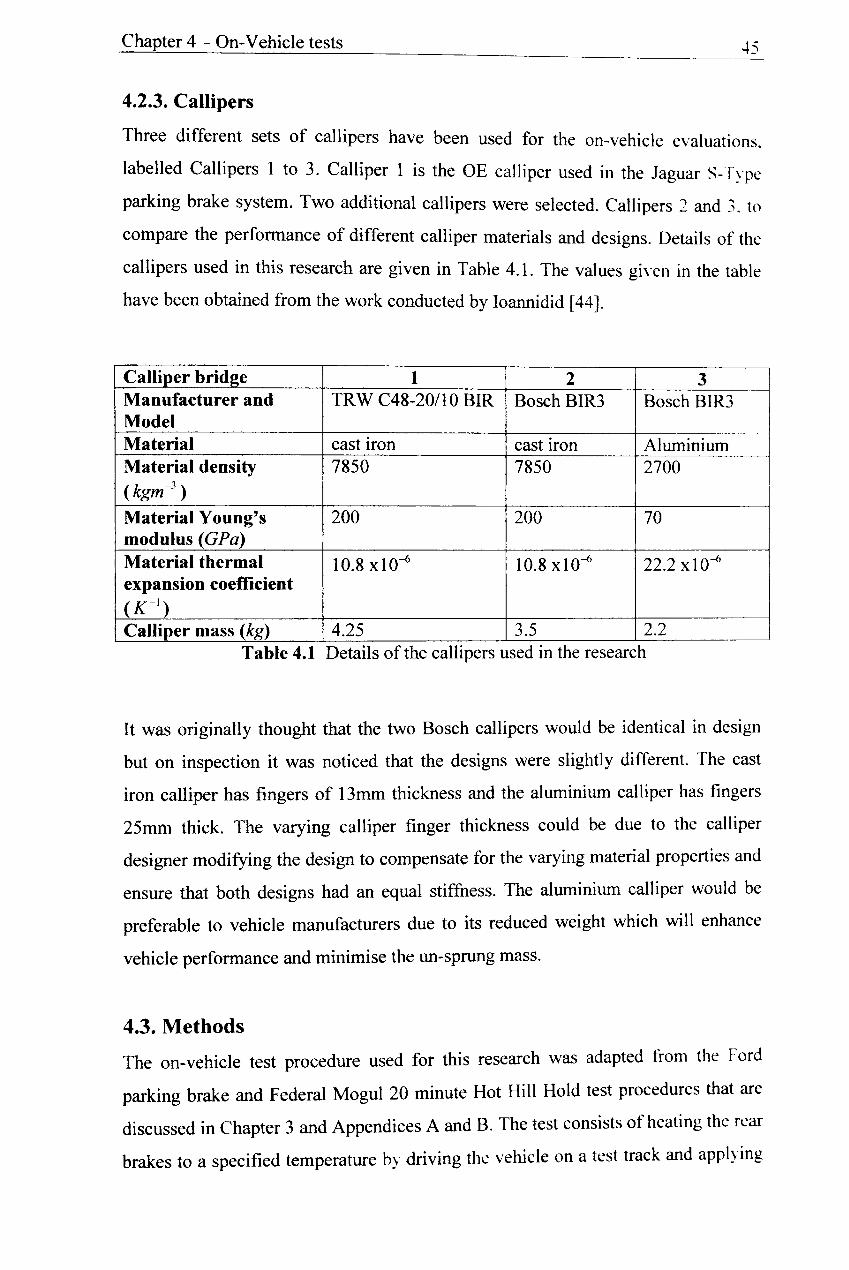
Figure 4.7 Jaguar S-Type wheel base dimensions ...........•....................................... 44
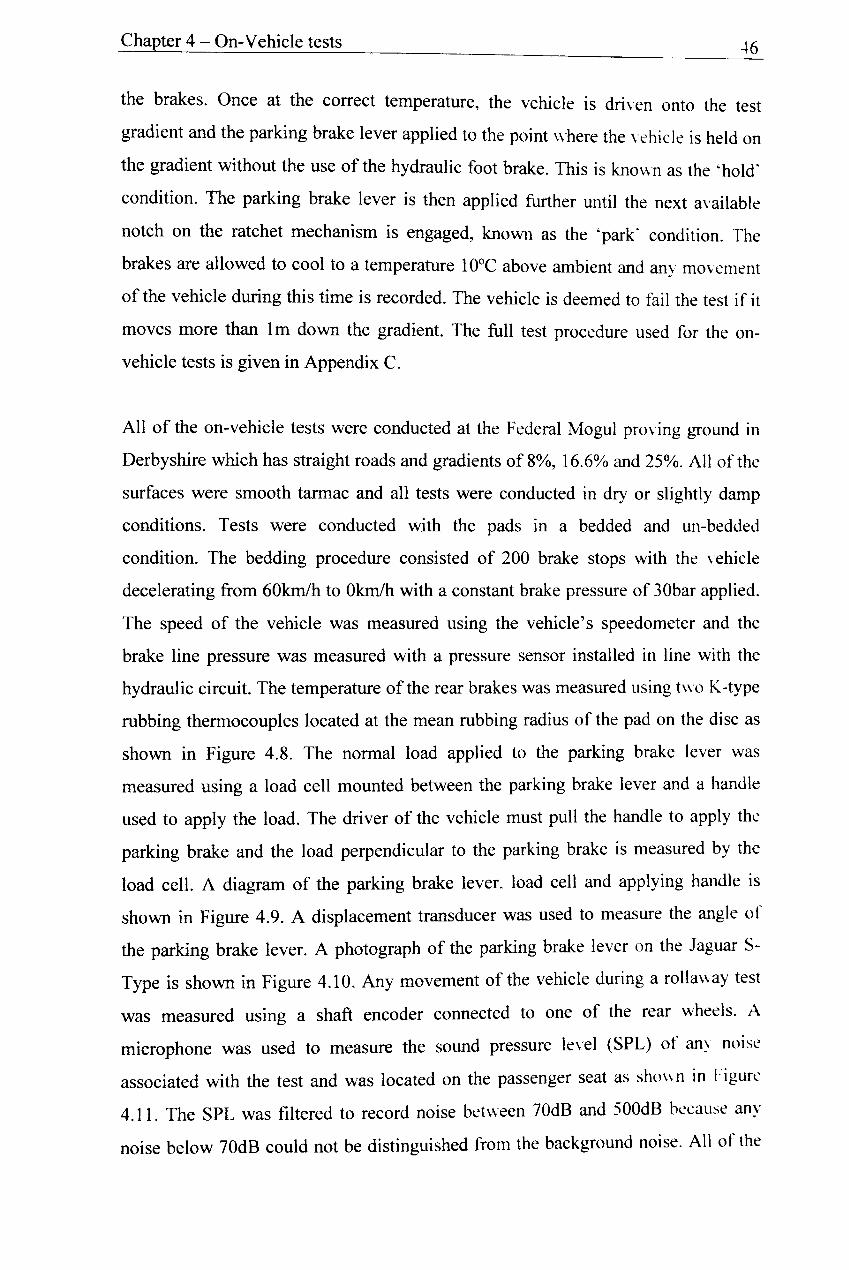
Figure 4.8 Position of the thermocouple on the disc ............................................... 47
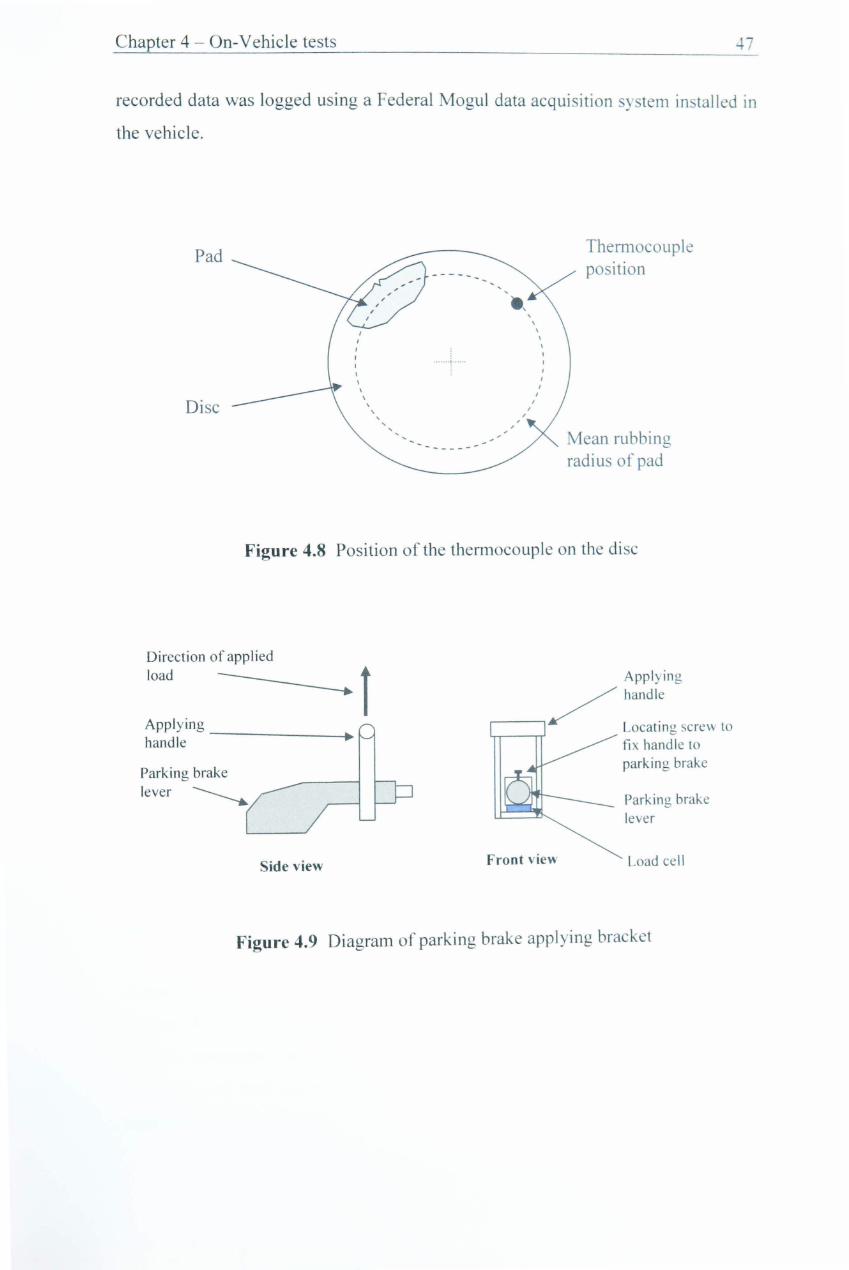
Figure 4.9 Diagram of parking brake applying bracket .......................................... 47
-x-
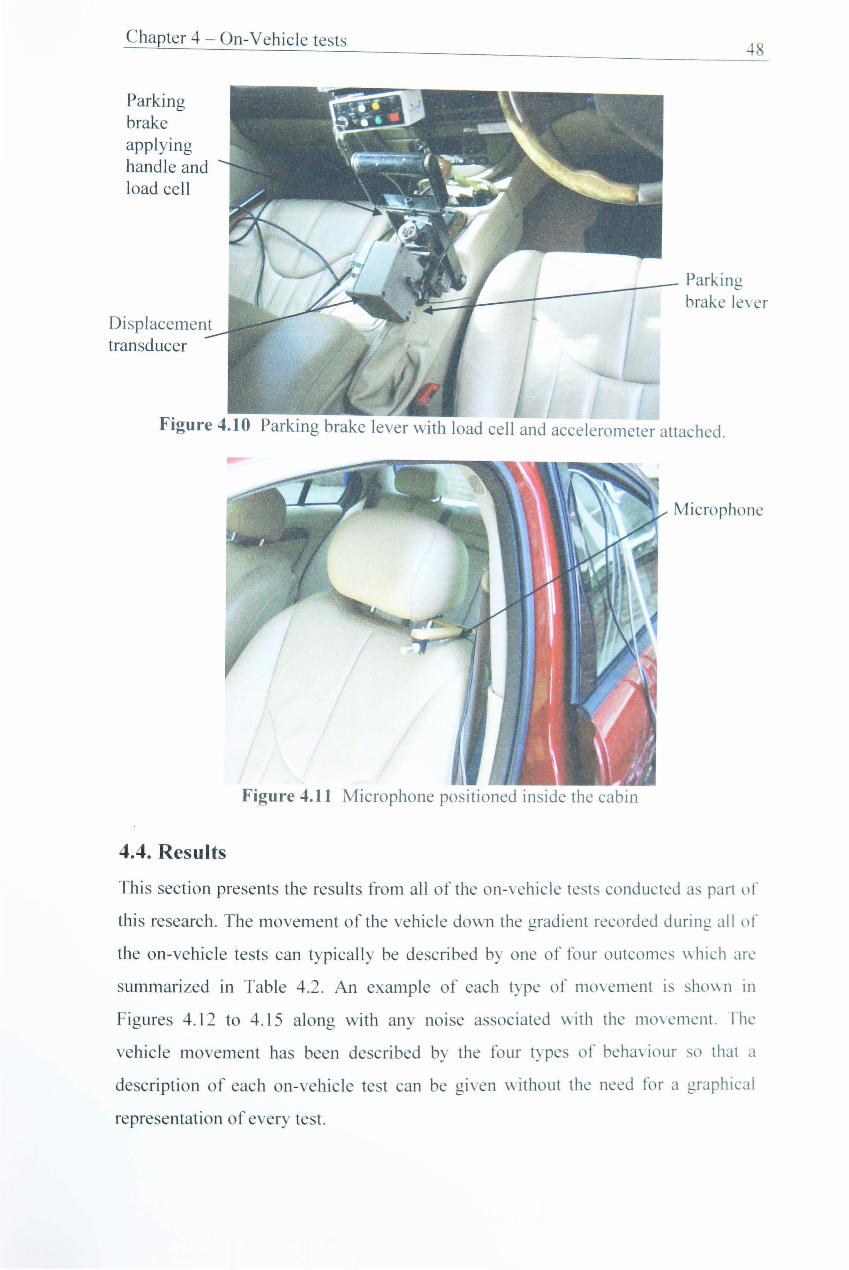
Figure 4.10 Parking brake lever with load cell and displacement transducer attached ...•...••..•...•........•........................•.•.•.........•.•........•.................................. -18
Figure 4.11 Microphone positioned inside the cabin .................•........................... .48
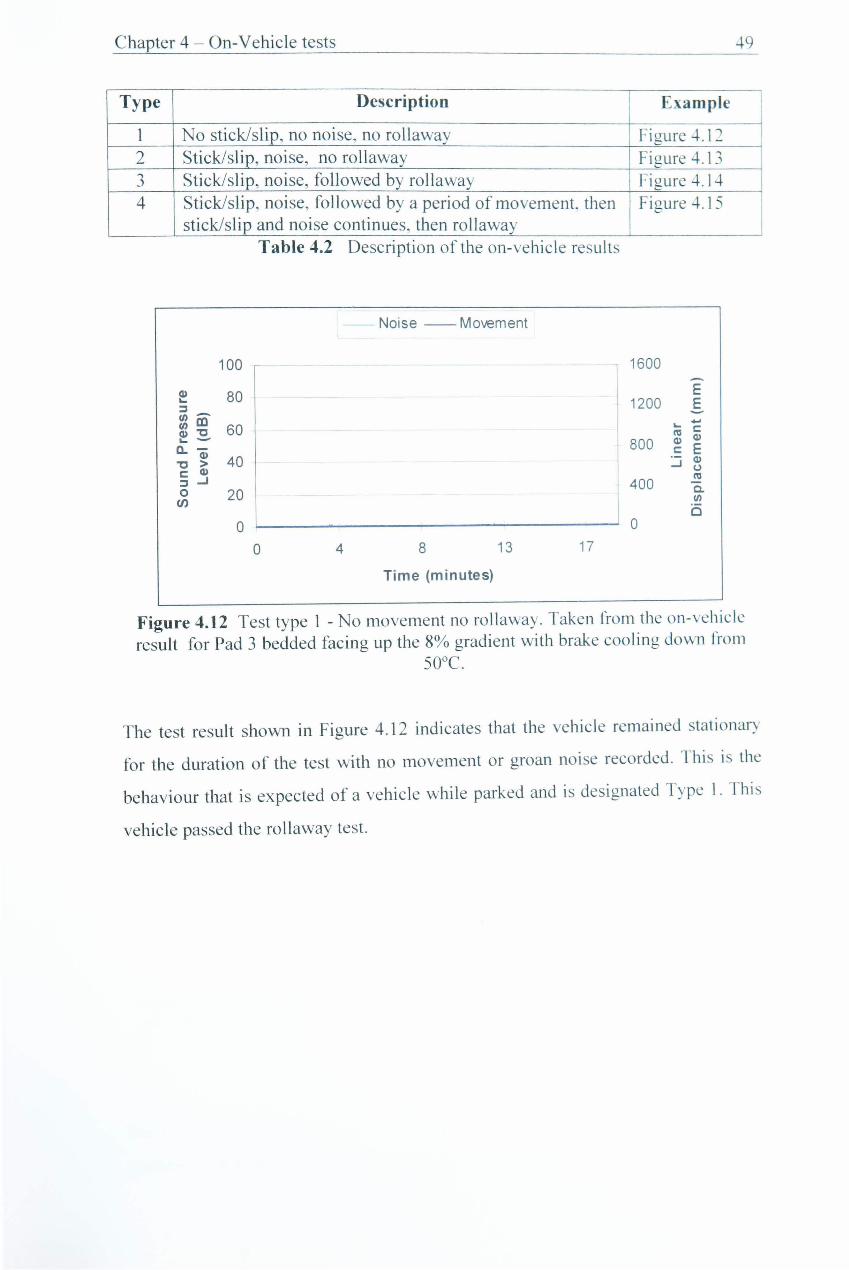
Figure 4.12 Test type 1 -No movement no rollaway. Taken from the on-vehicle result for Pad 3 bedded facing up the 8% gradient with the brake cooling dOWIl from 50°C ...................................•.............................................. 49
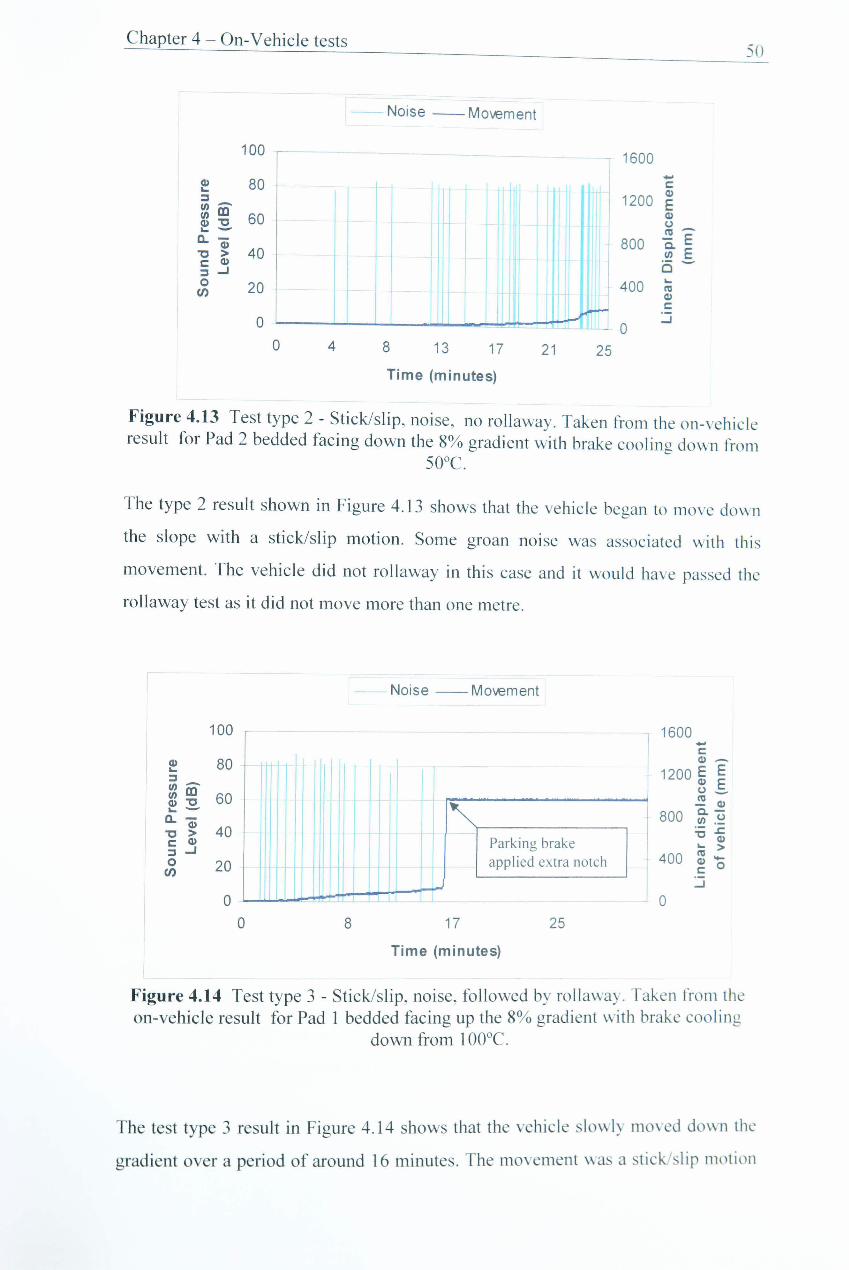
Figure 4.13 Test type 2 - Stick/slip, noise, no rollaway. Taken from the onvehicle result for Pad 2 bedded facing doWIl the 8% gradient with brake cooling dOWIl from 50°C ...........•..............................................•..•..............•..... 50
Figure 4.14 Test type 3 - Stick/slip, noise, followed by rollaway. Taken from the on-vehicle result for Pad 1 bedded facing up the 8% gradient with brake cooling dOWIl from 1 OO°C •...•...•..•..•....•.................................................. 50
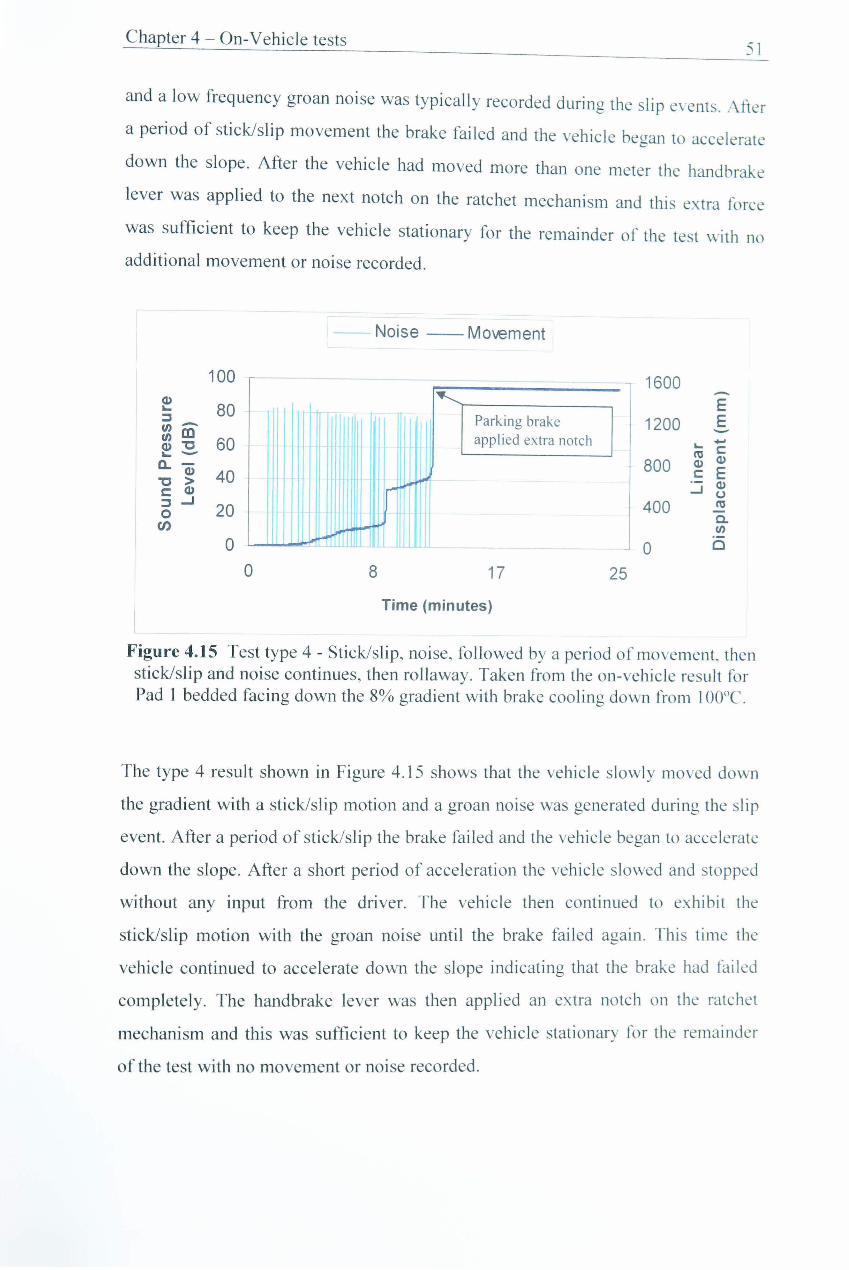
Figure 4.15 Test type 4 - Stick/slip, noise, followed by a period of movement, then stick/slip and noise continues, then rollaway. Taken from the on-vehicle result for Pad 1 bedded facing doWIl the 8% gradient with brake cooling dOWIl from 1 DO°C ............................................................... 51
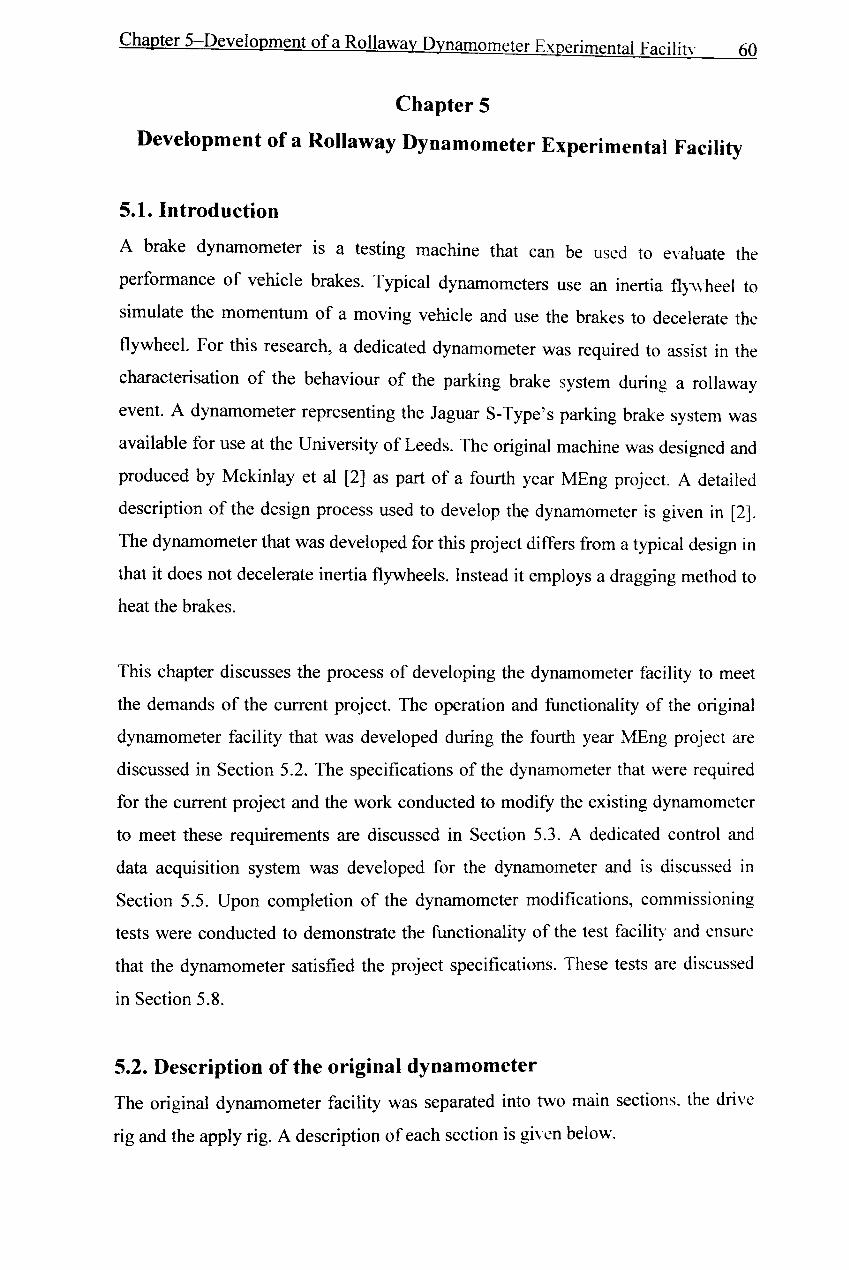
Figure 5.1 Schematic of drive rig (top view) .......................................................... 61
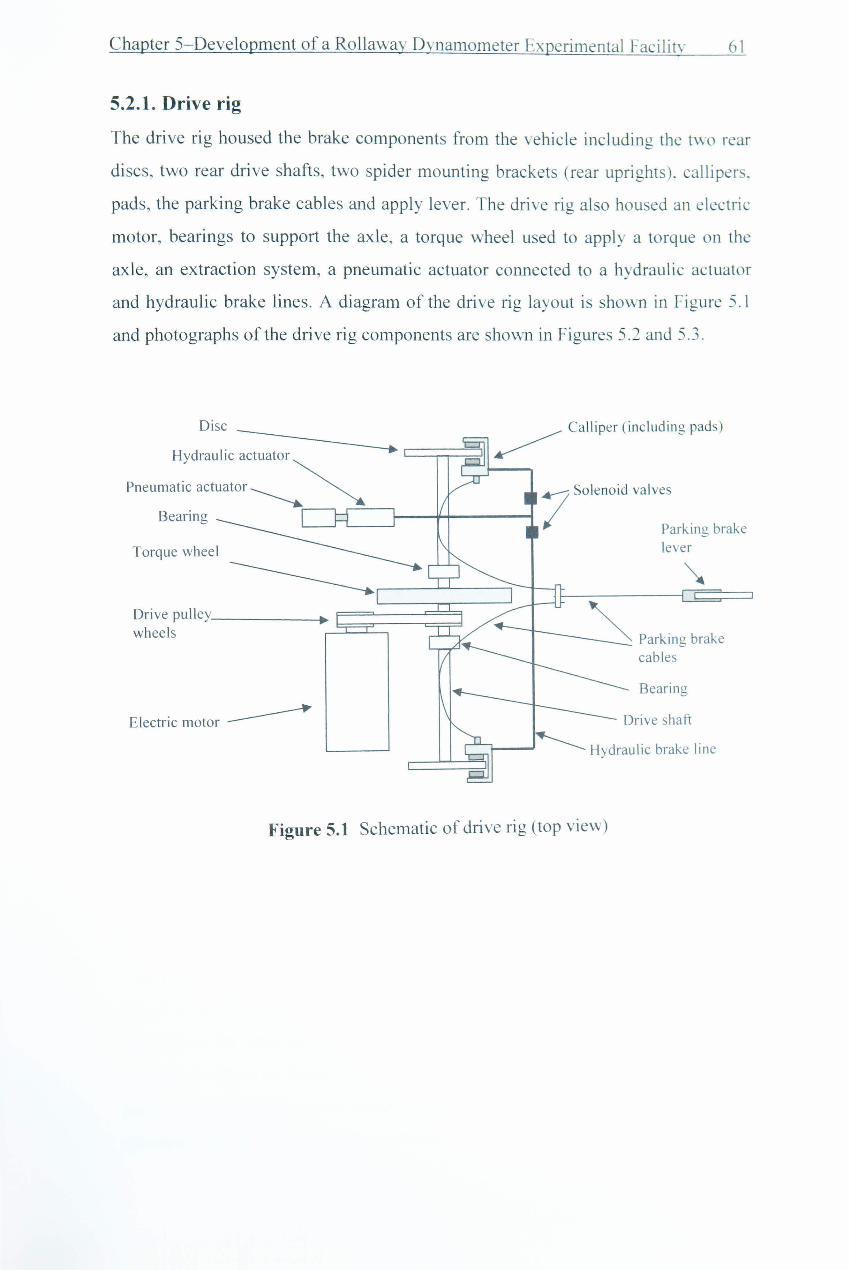
Figure 5.2 End view of drive rig ............................................................................. 62
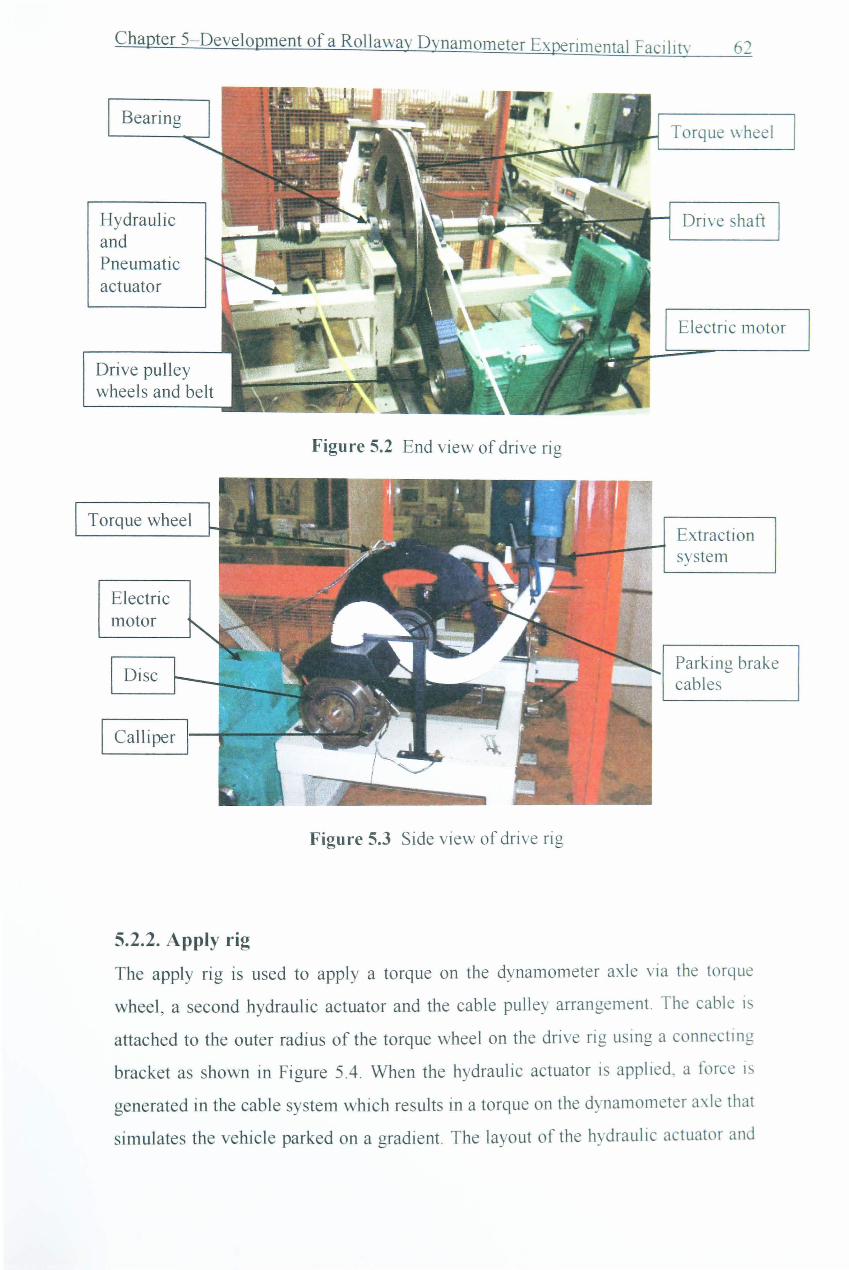
Figure 5.3 Side view of drive rig •..........•................................................................. 62
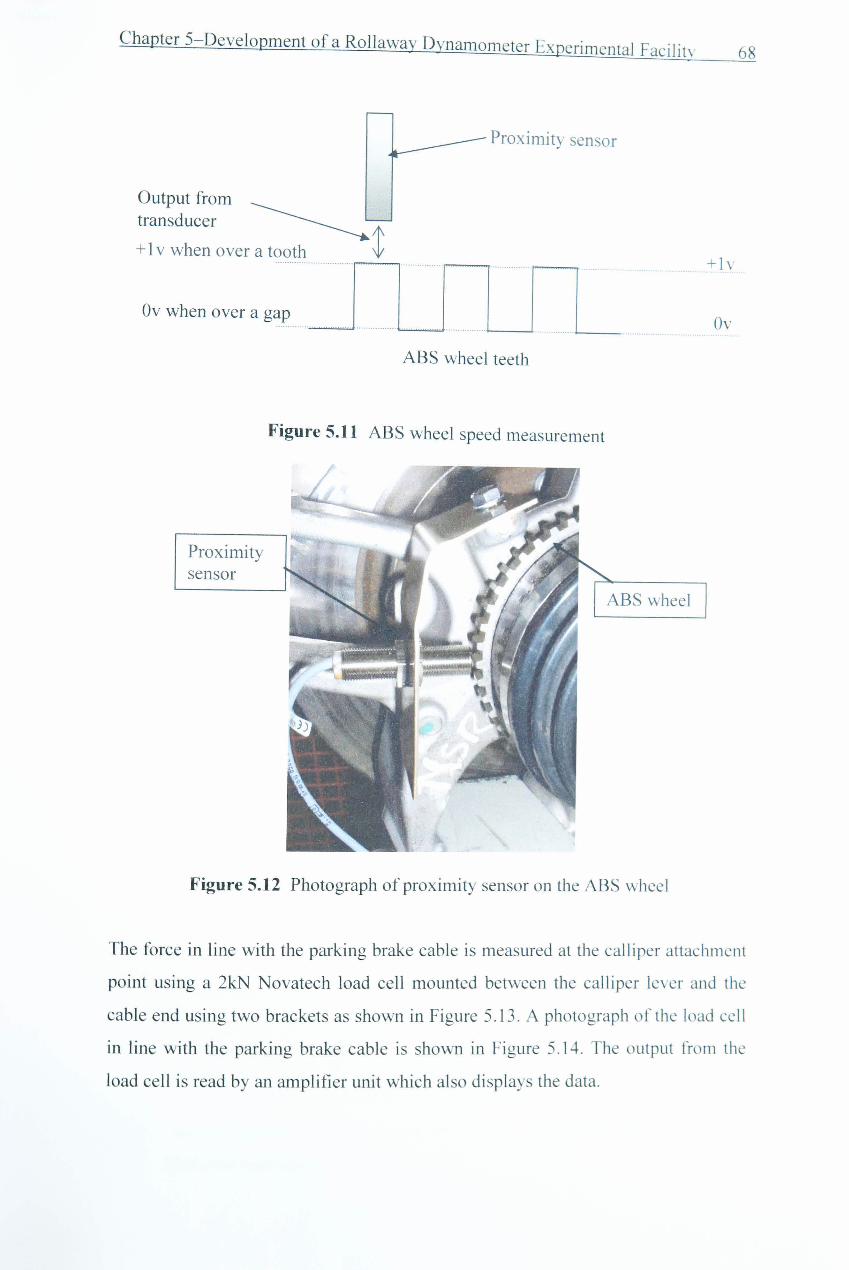
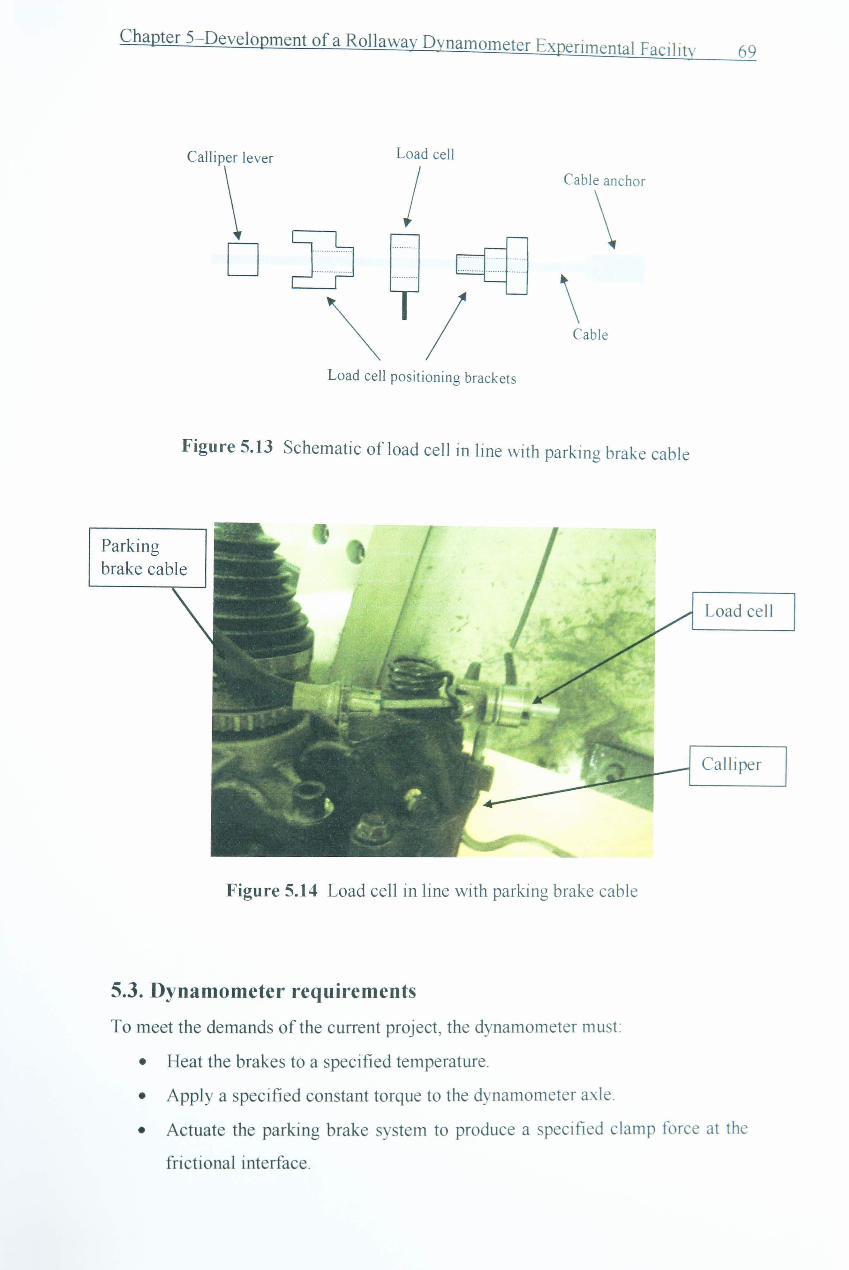
Figure 5.12 Photograph of proximity sensor on the ABS wheel ......•..................... 68
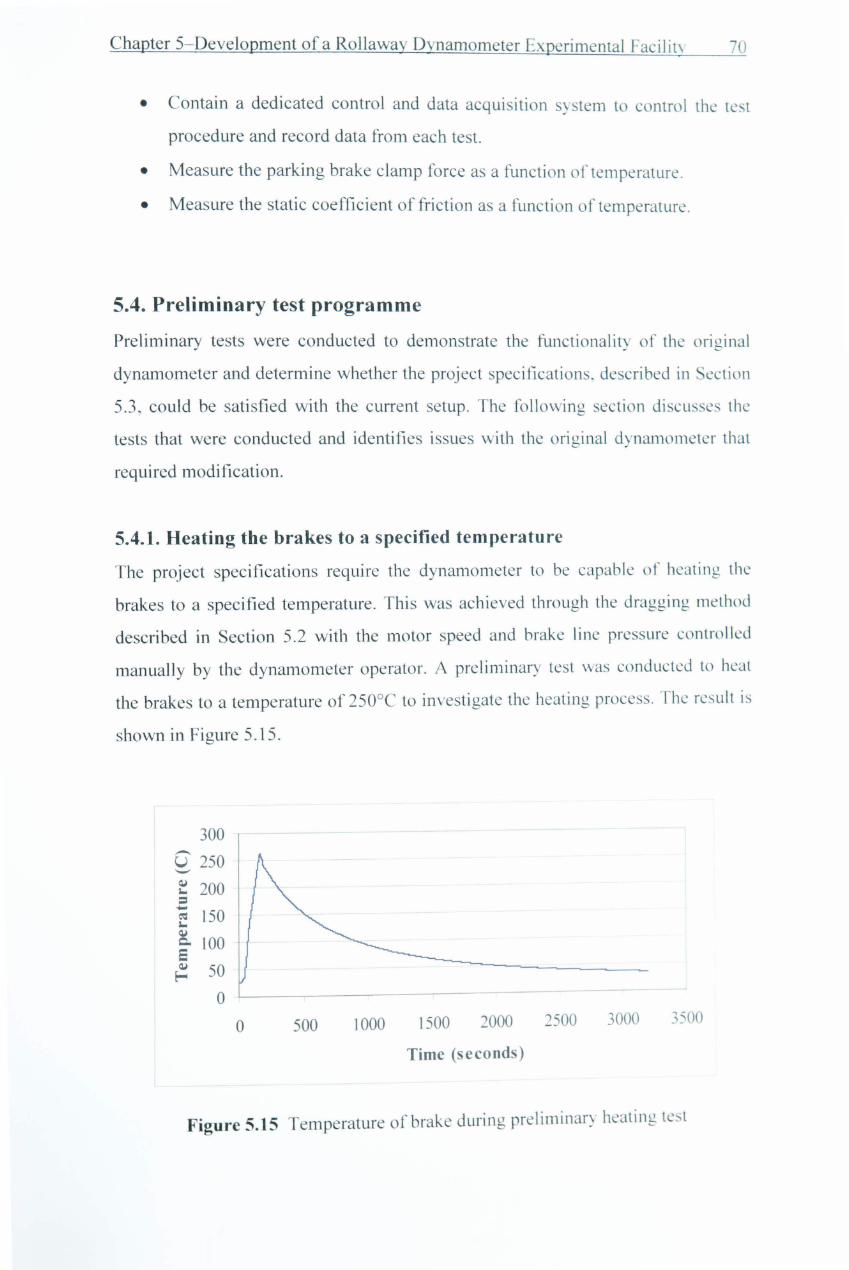
Figure 5.13 Schematic of load cell in line with parking brake cable ...................... 69
Figure 5.14 Load cell in line with parking brake cable ........................................... 69
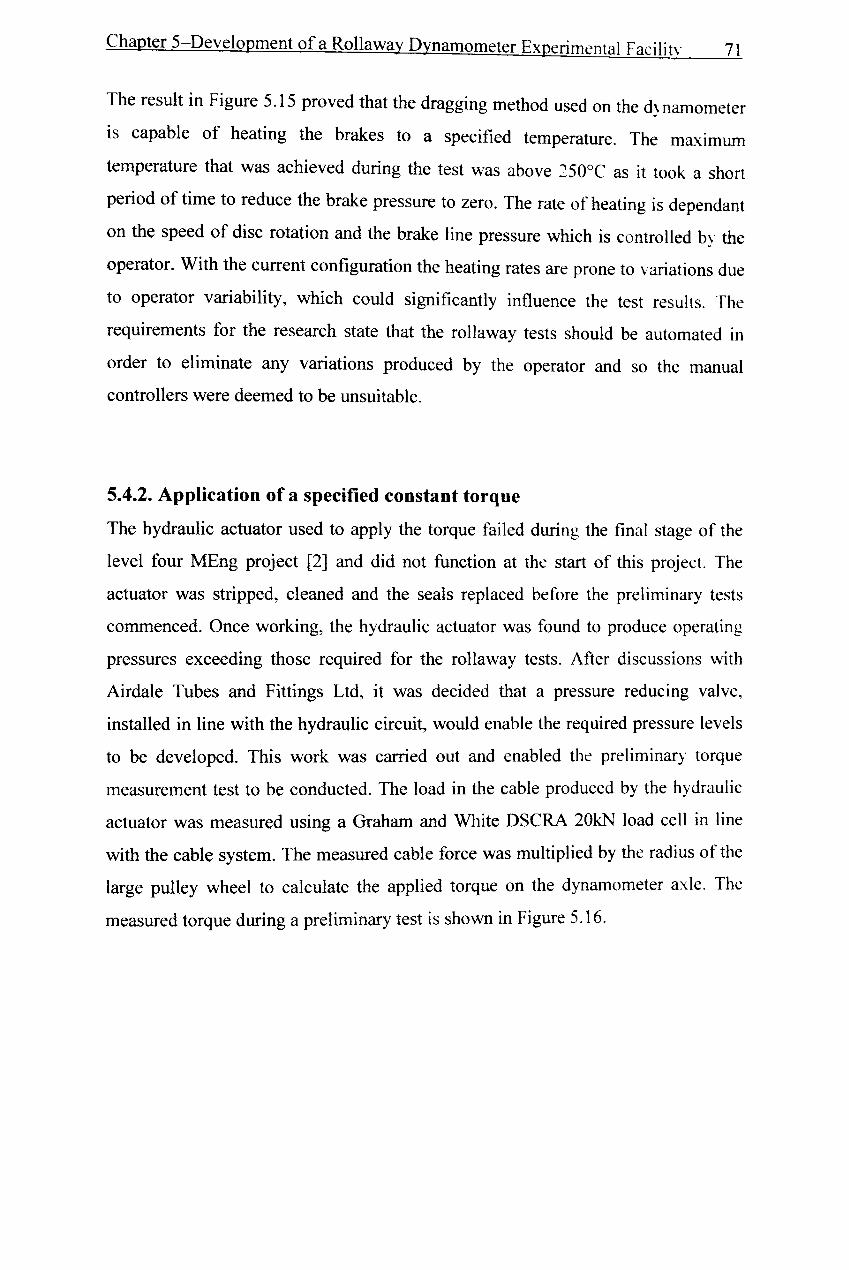
Figu re 5.15 Temperature of brake during preliminary heating test ......................... 70
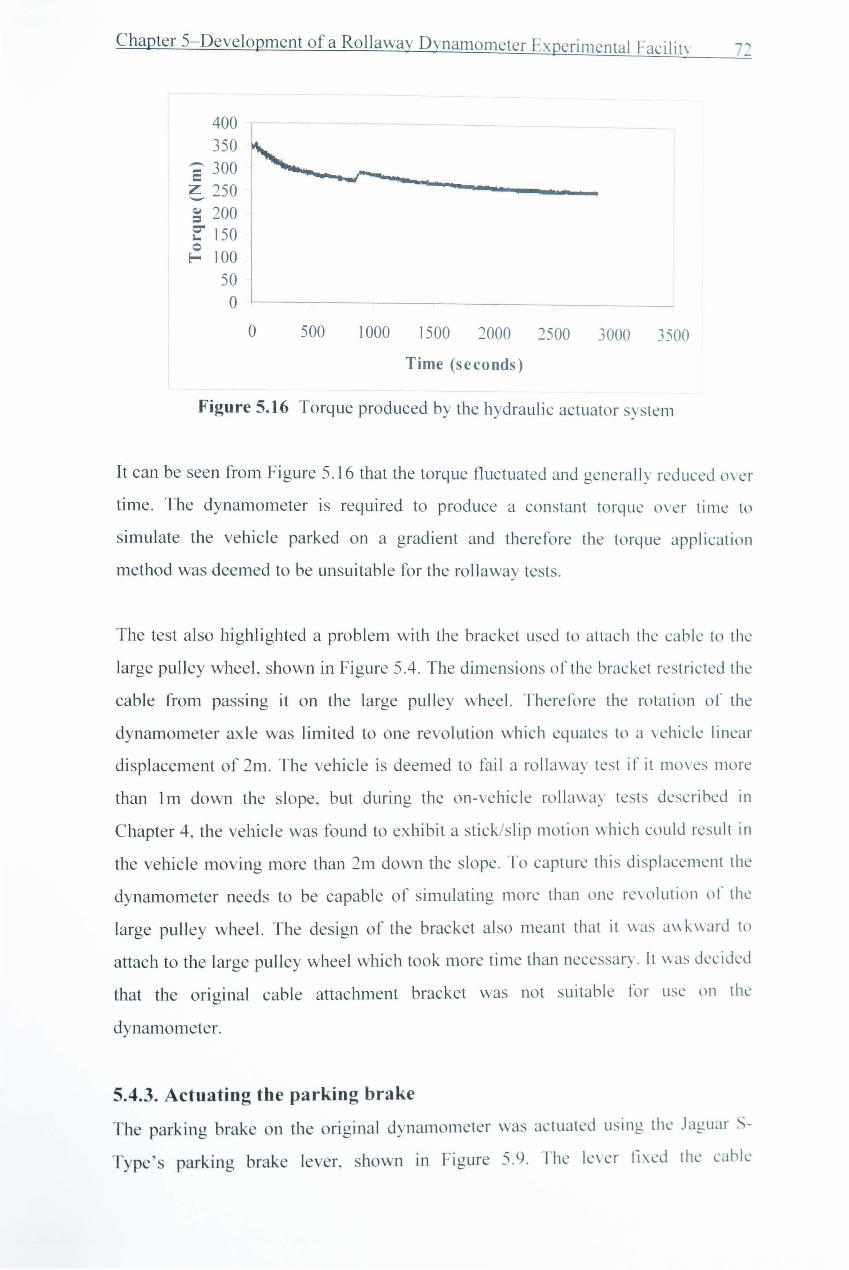
Figure 5.16 Torque produced by the hydraulic actuator system ............................. 72
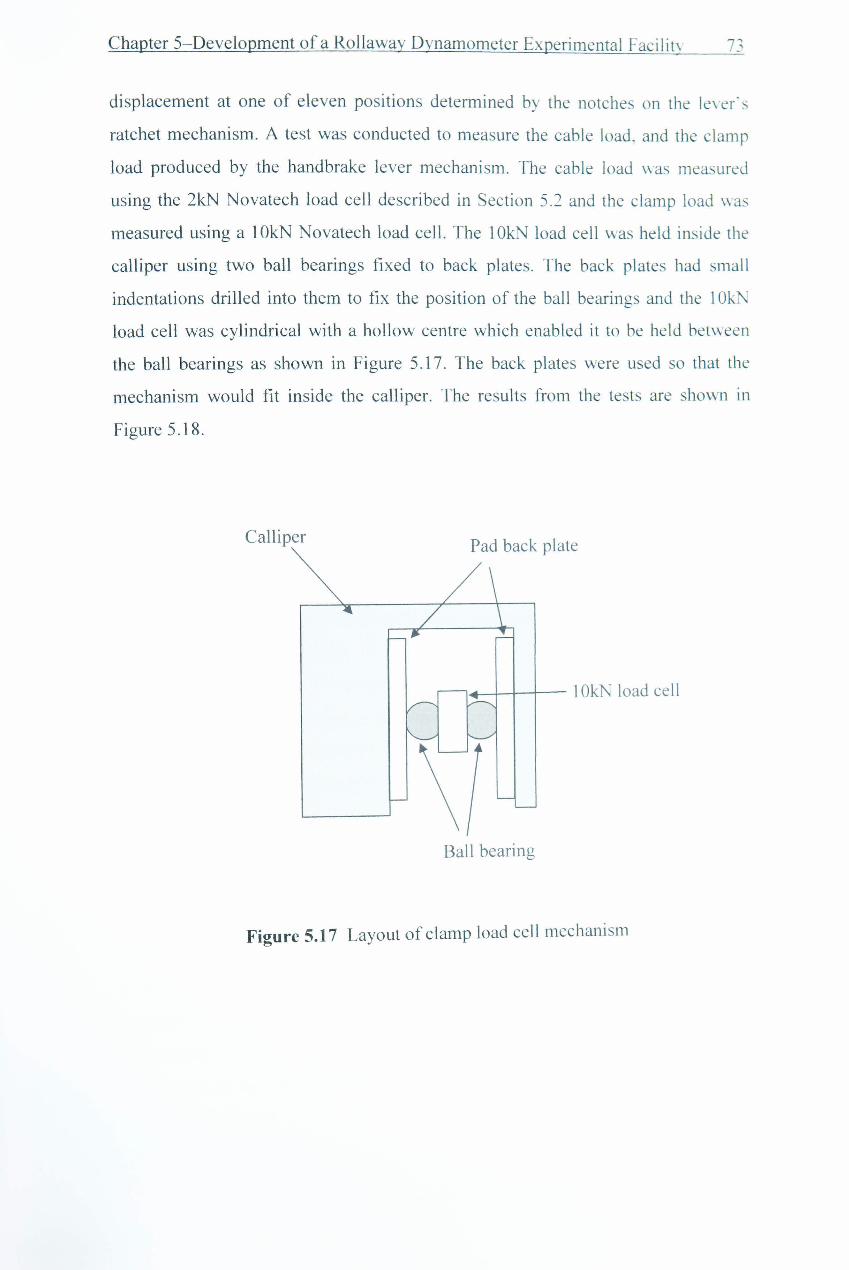
Figure 5.17 Layout of clamp load cell mechanism ................................................. 73
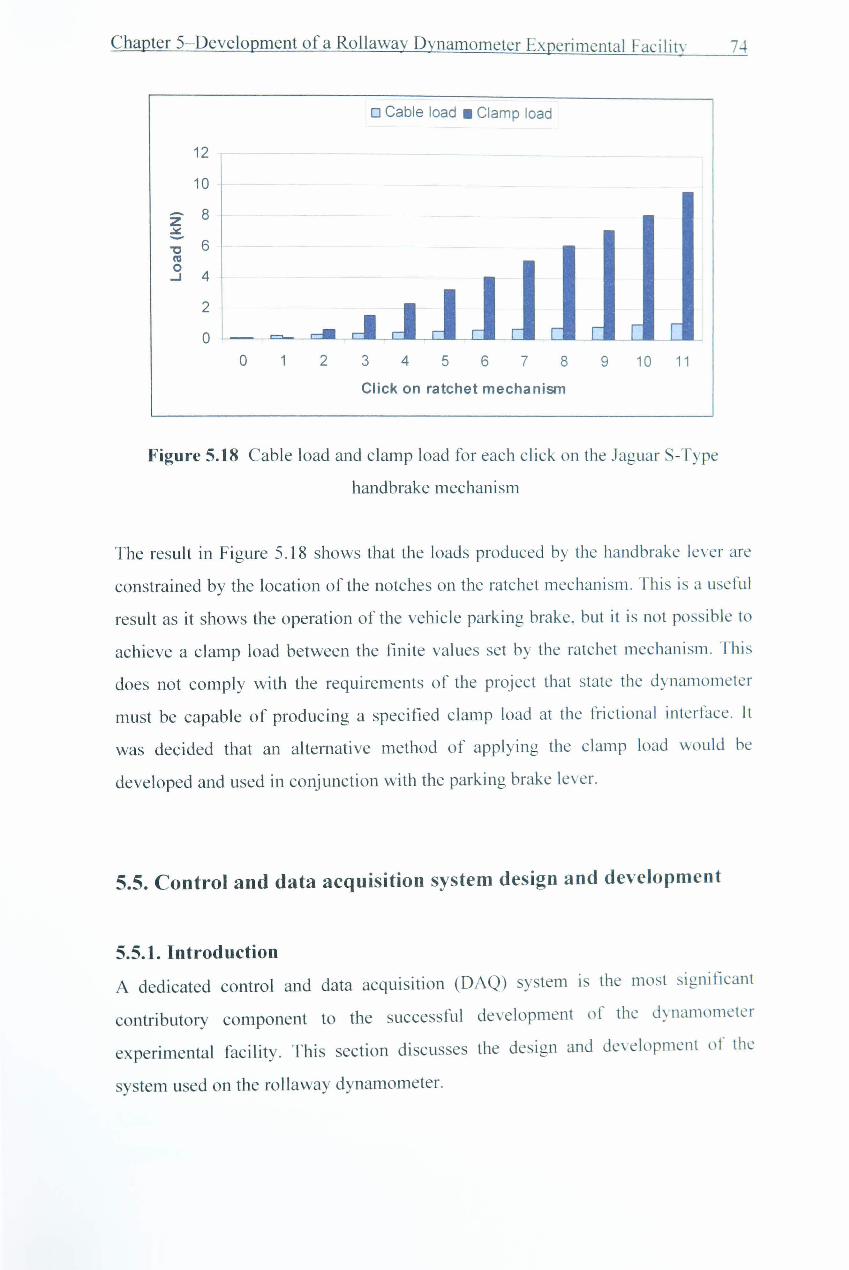
Figure 5.18 Cable load and clamp load for each click on the Jaguar S-Type handbrake mechanism .....•...........•.................................................................... 74
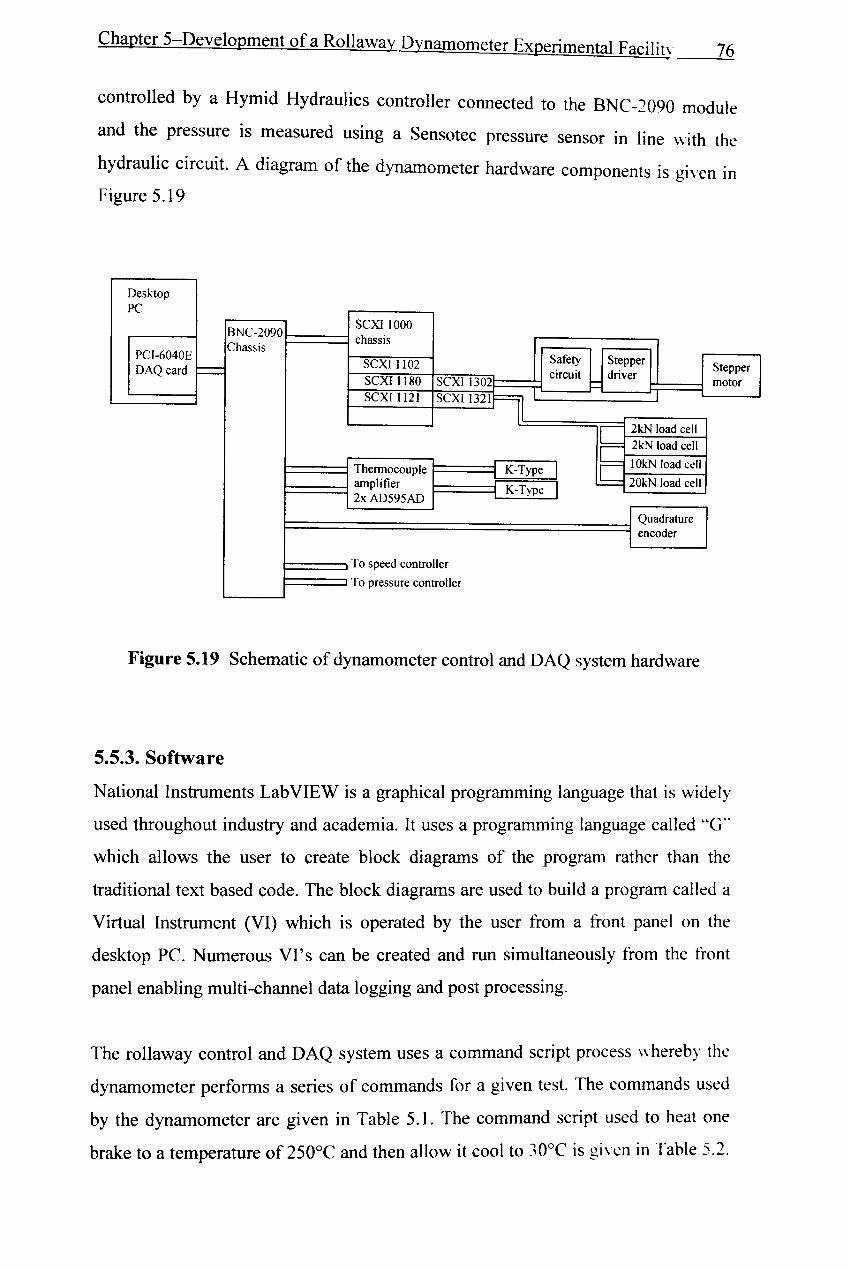
Figure 5.19 Schematic of dynamometer control and DAQ system hardware ......... 76
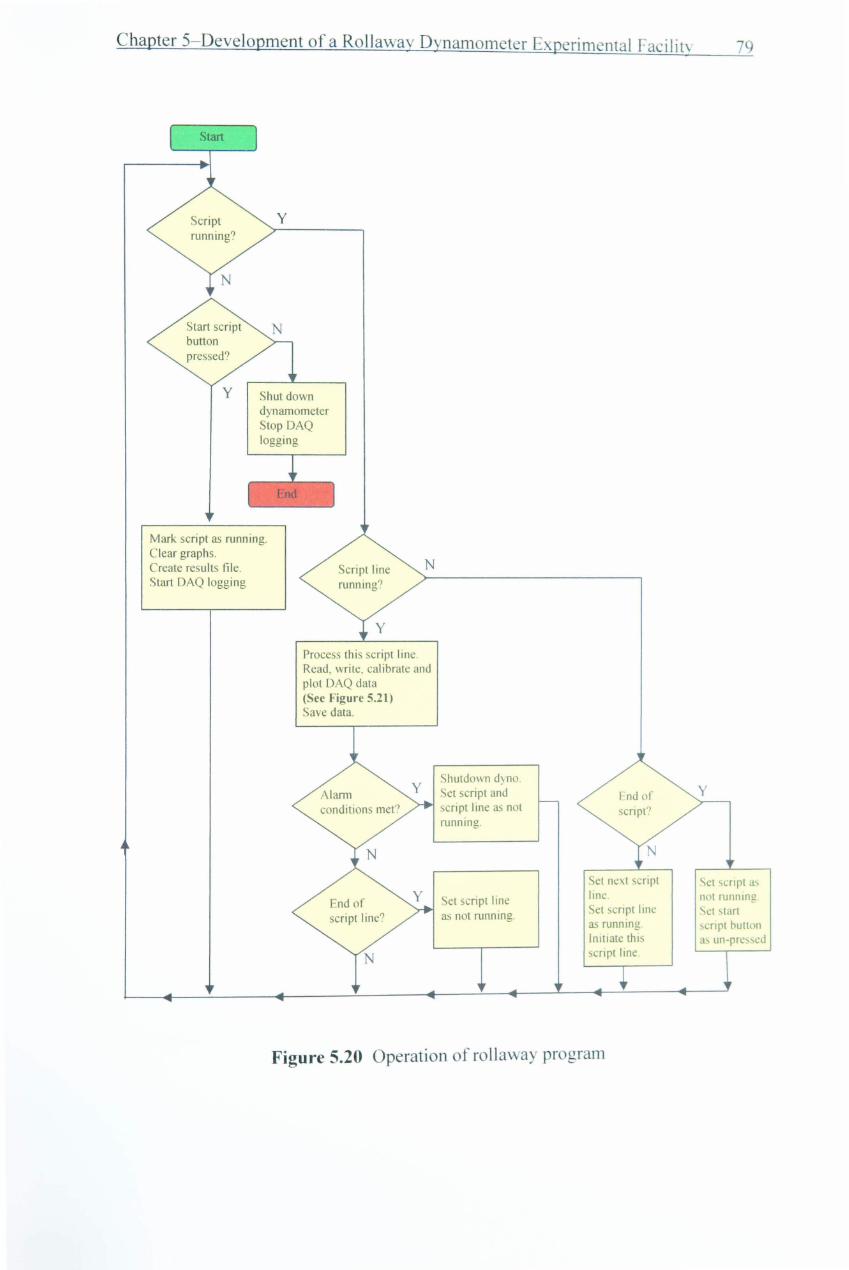
Figure 5.20 Operation of rollaway program ............................................................ 79
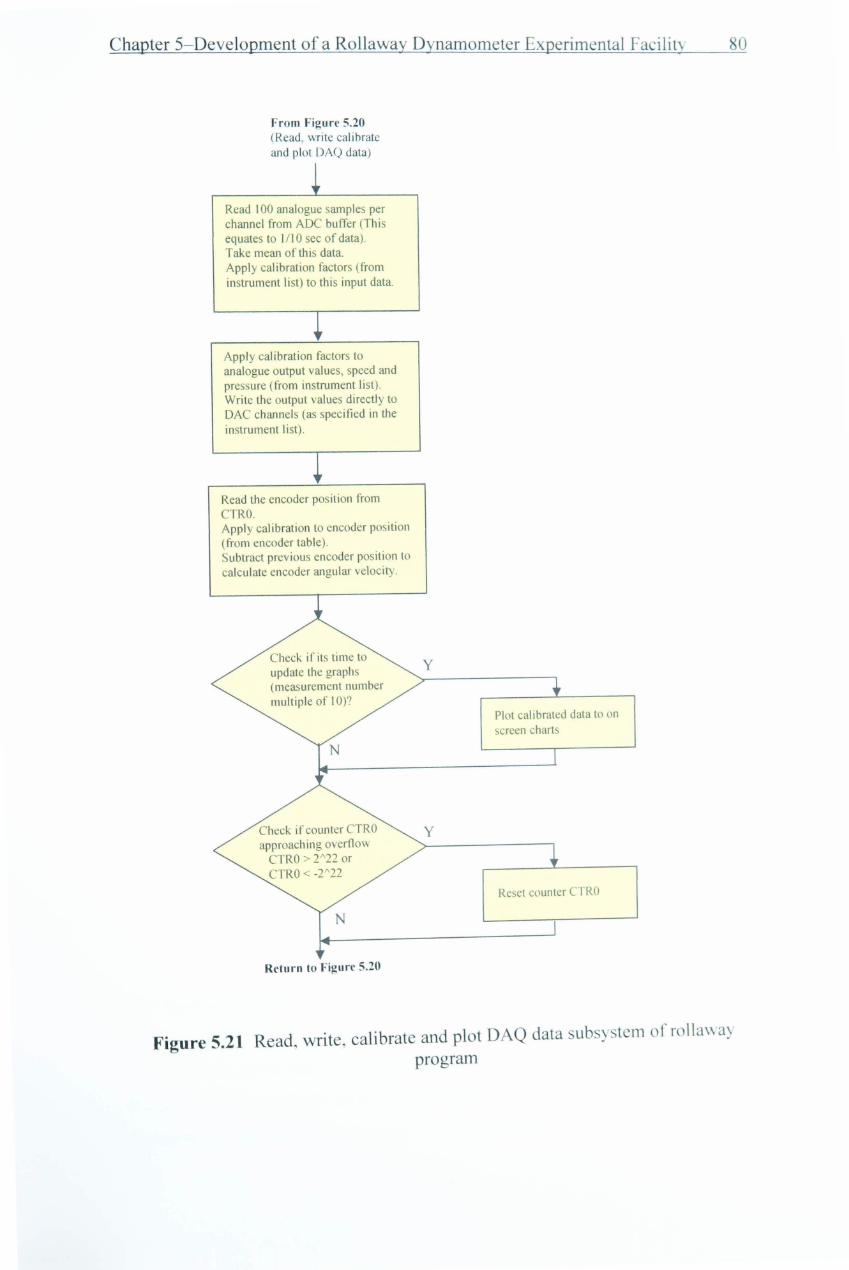
Figure 5.21 Read, write, calibrate and plot DAQ data subsystem of rolla way program ..................................................•......................................................... 80
- Xl -
Figure 5.22 Diagram of the dead weight apply system ........................................... 81
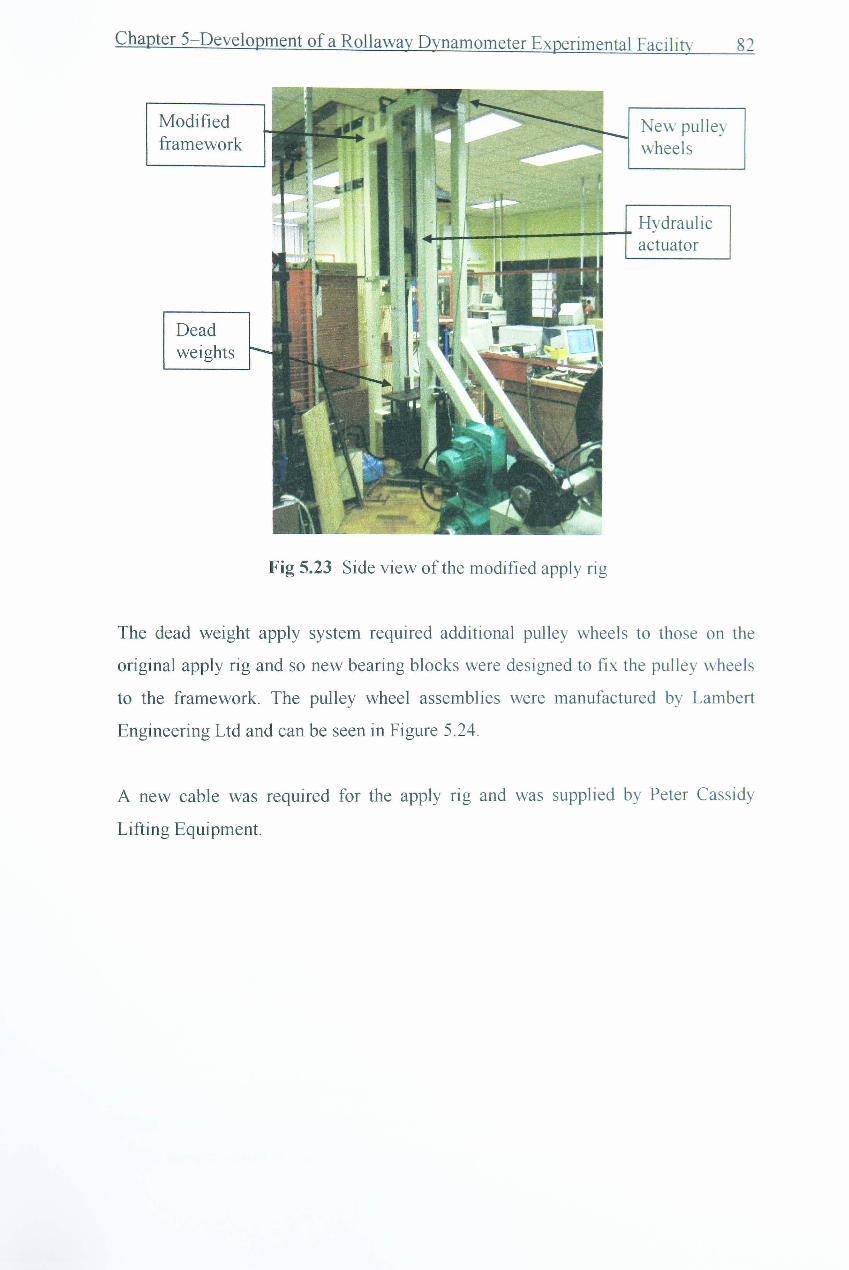
Figure 5.23 Side view of the modified apply rig ..................................................... 82
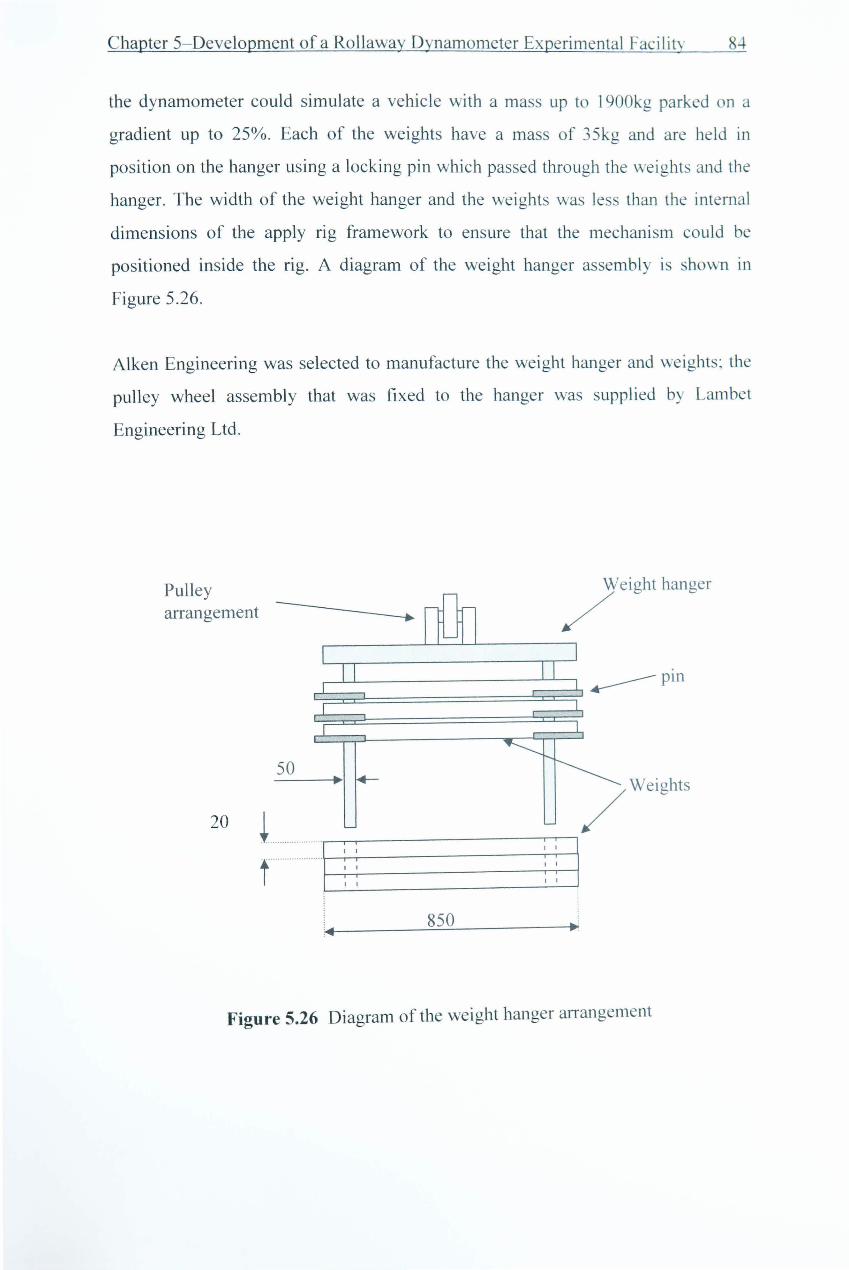
Figure 5.26 Diagram of the weight hanger arrangement ......................................... 84
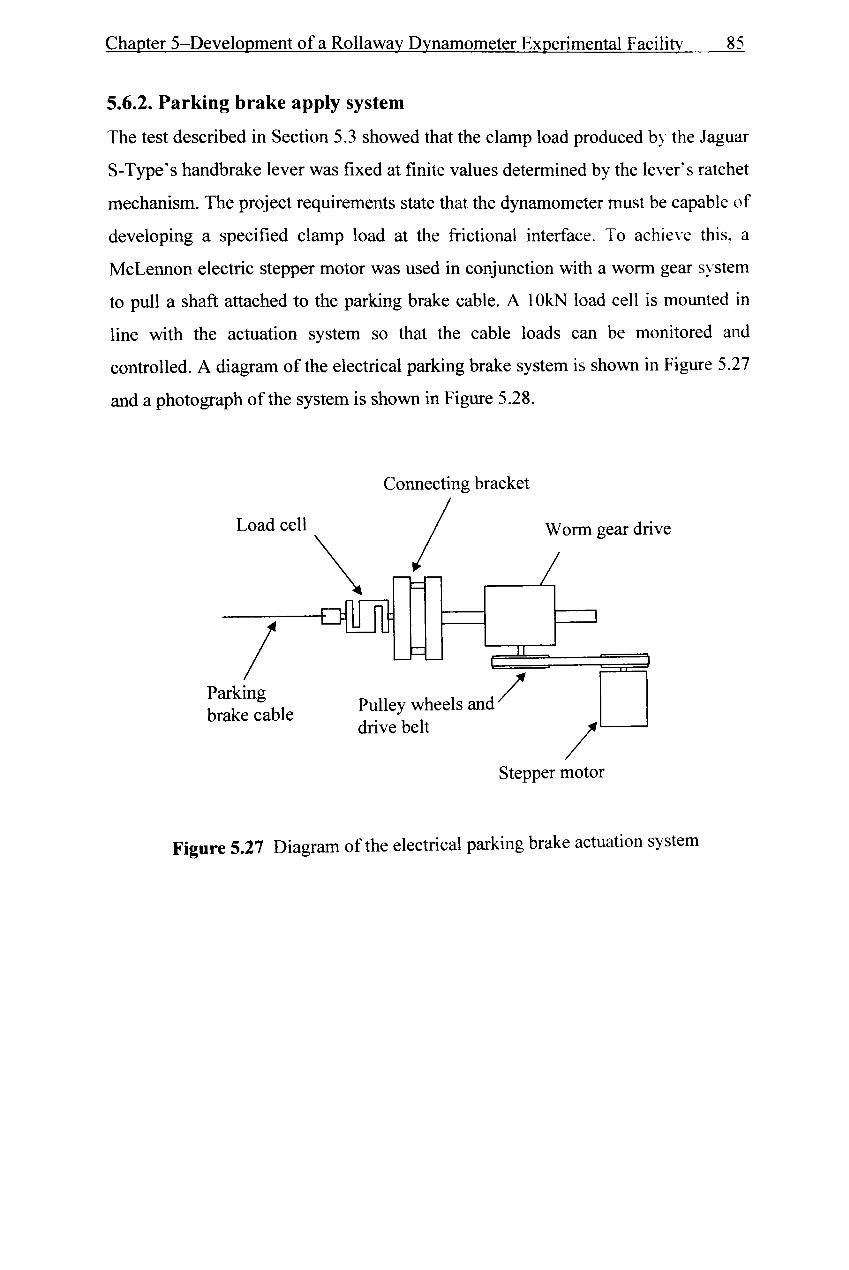
Figure 5.27 Diagram of the electrical parking brake actuation system ................... 85
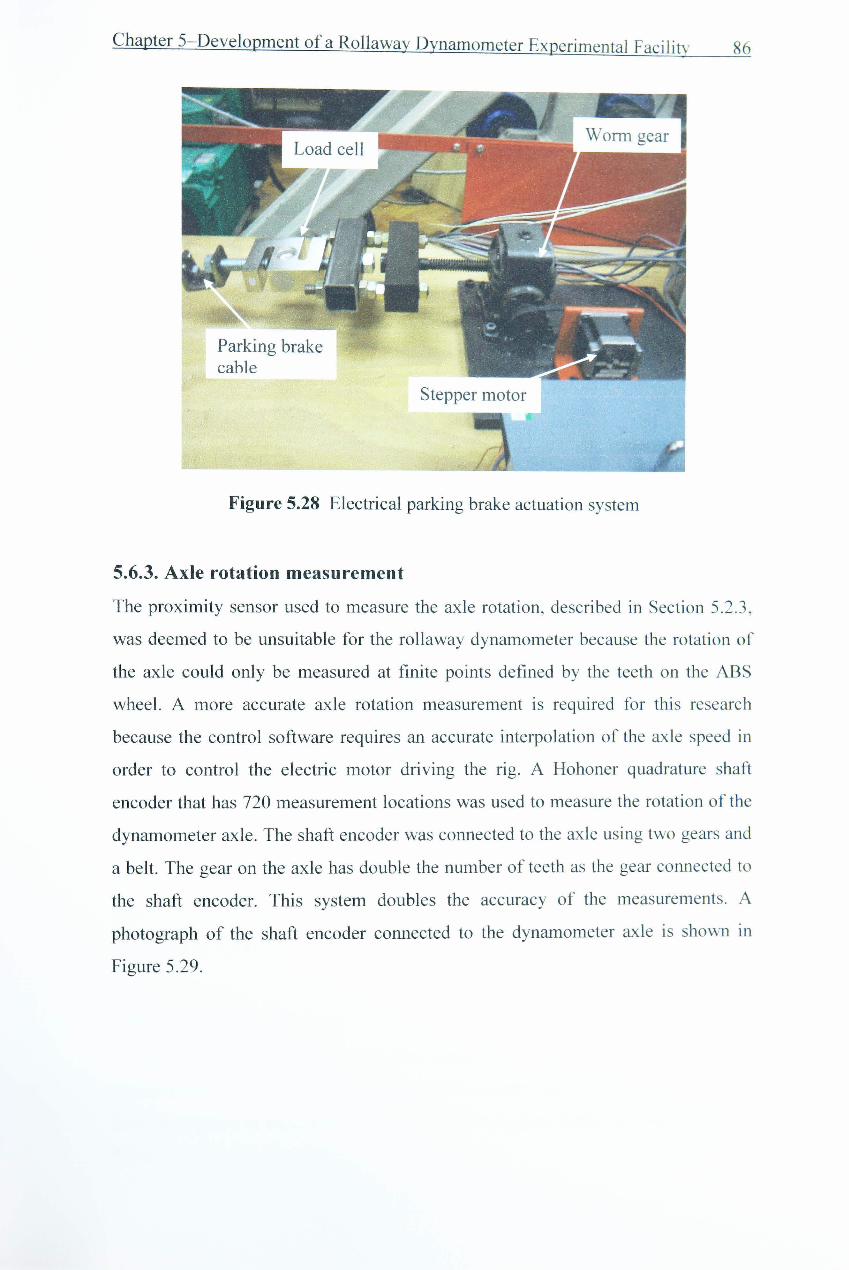
Figure 5.28 Electrical parking brake actuation system ........................................... 86
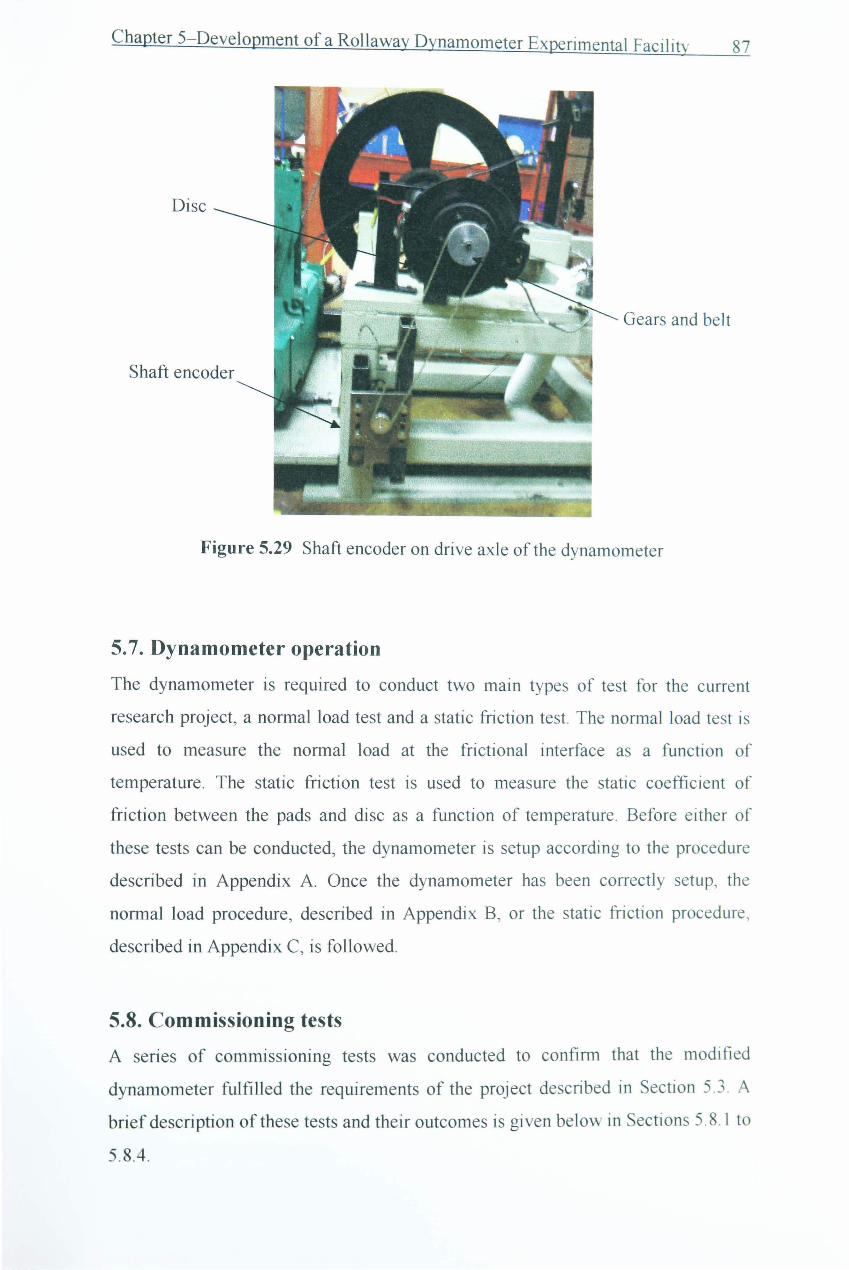
Figure 5.29 Shaft encoder on drive axle of the dynamometer ................................ 87
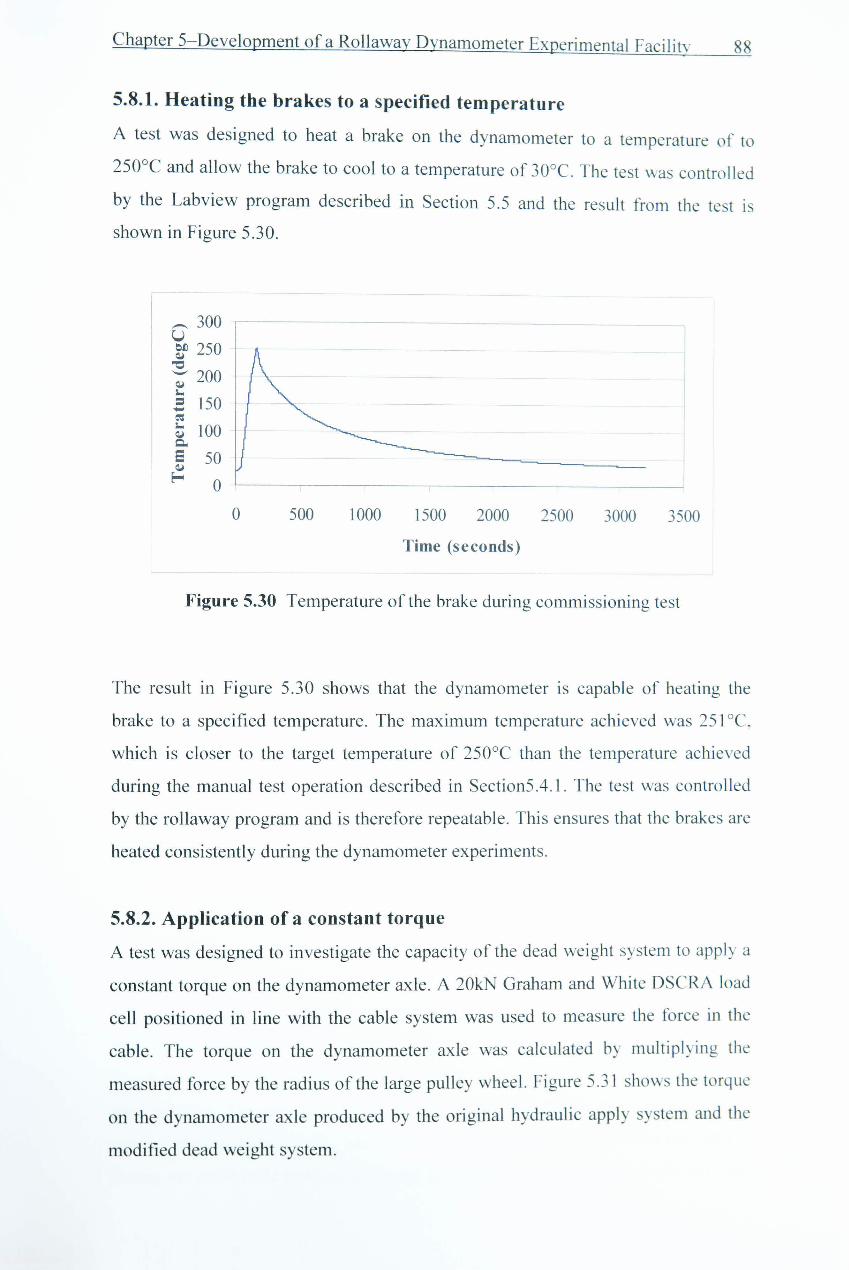
Figure 5.30 Temperature of the brake during commissioning test •......................... 88
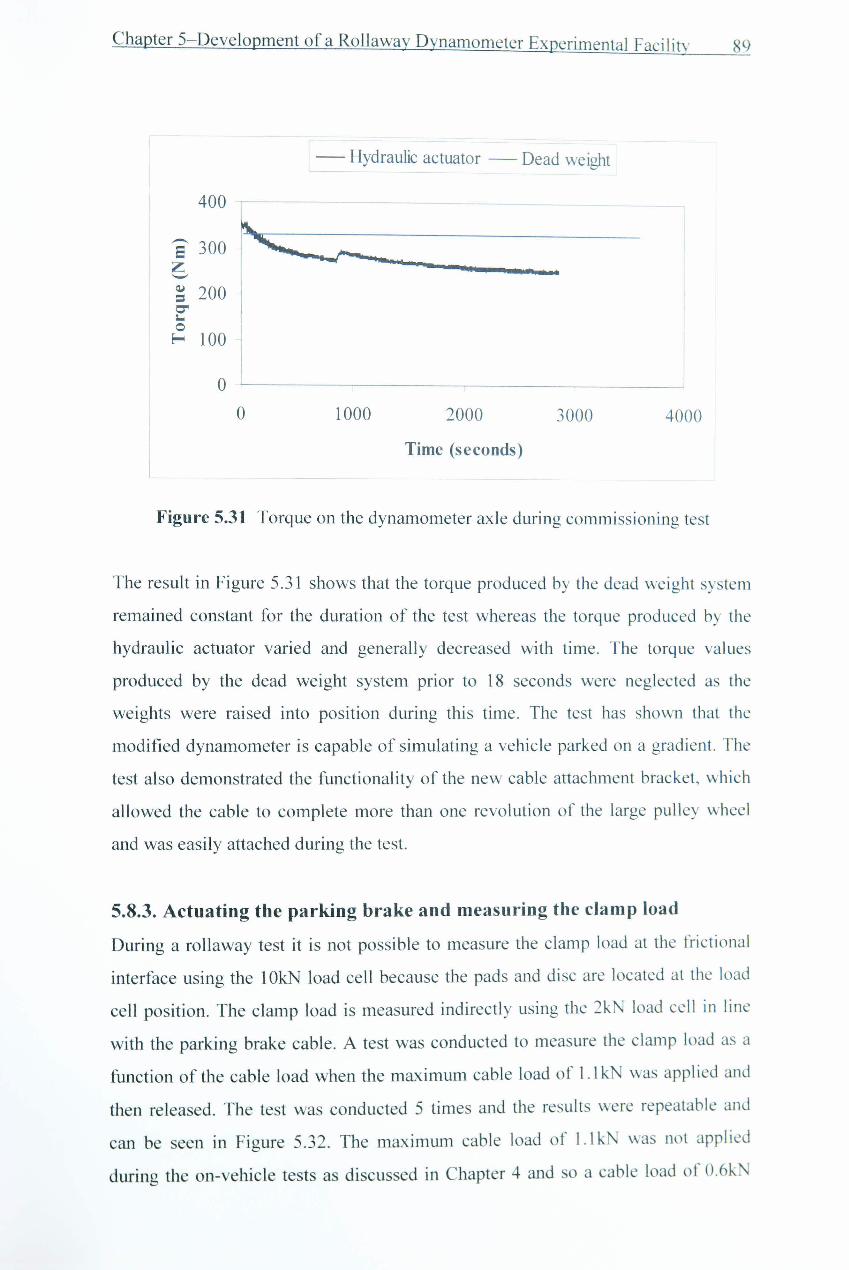
Figure 5.31 Torque on the dynamometer axle during commissioning test ............. 89
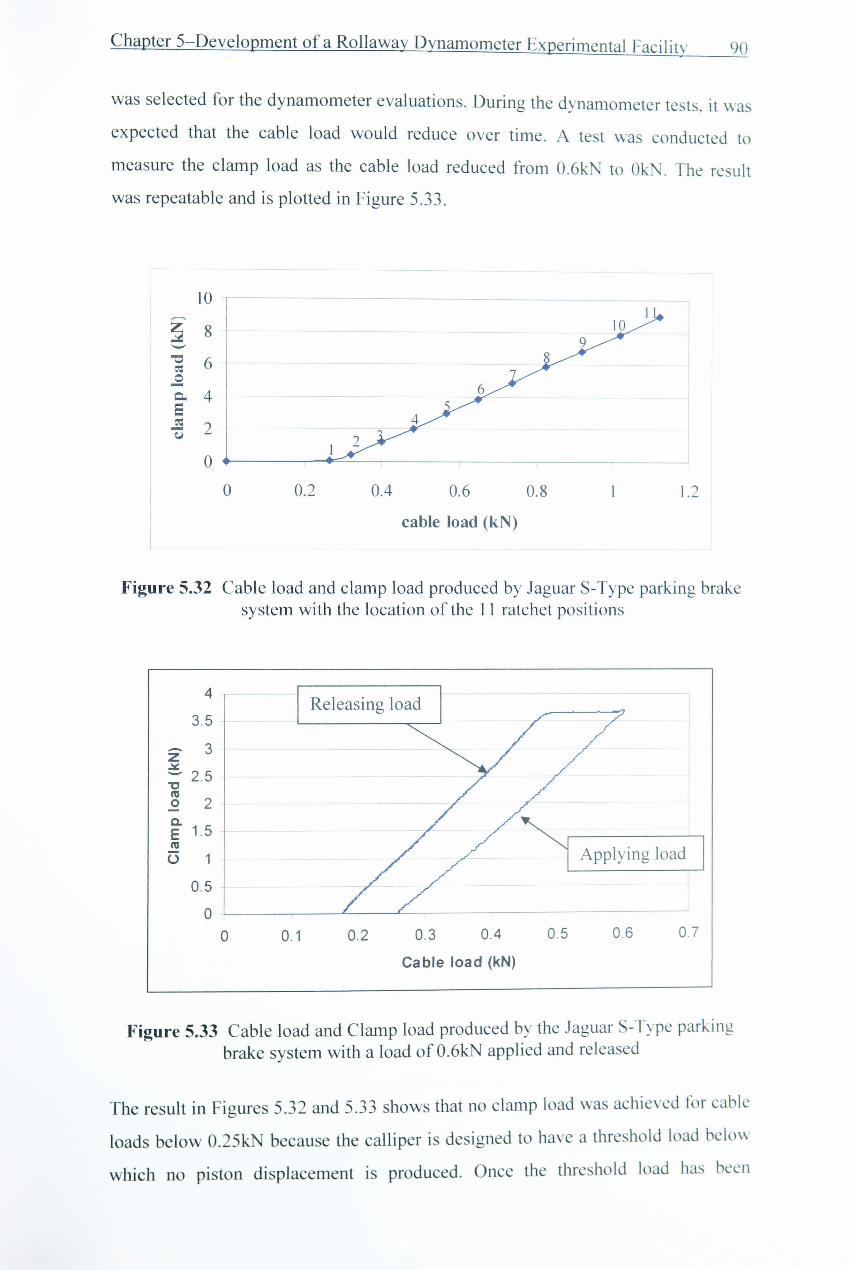
Figure 5.32 Cable load and clamp load produced by Jaguar S-Type parking brake system with the location of the 11 ratchet positions ............................... 90
Figure 5.33 Cable load and clamp load produced by the Jaguar S-Type parking brake system with a load of O.6kN applied and released .................... 90
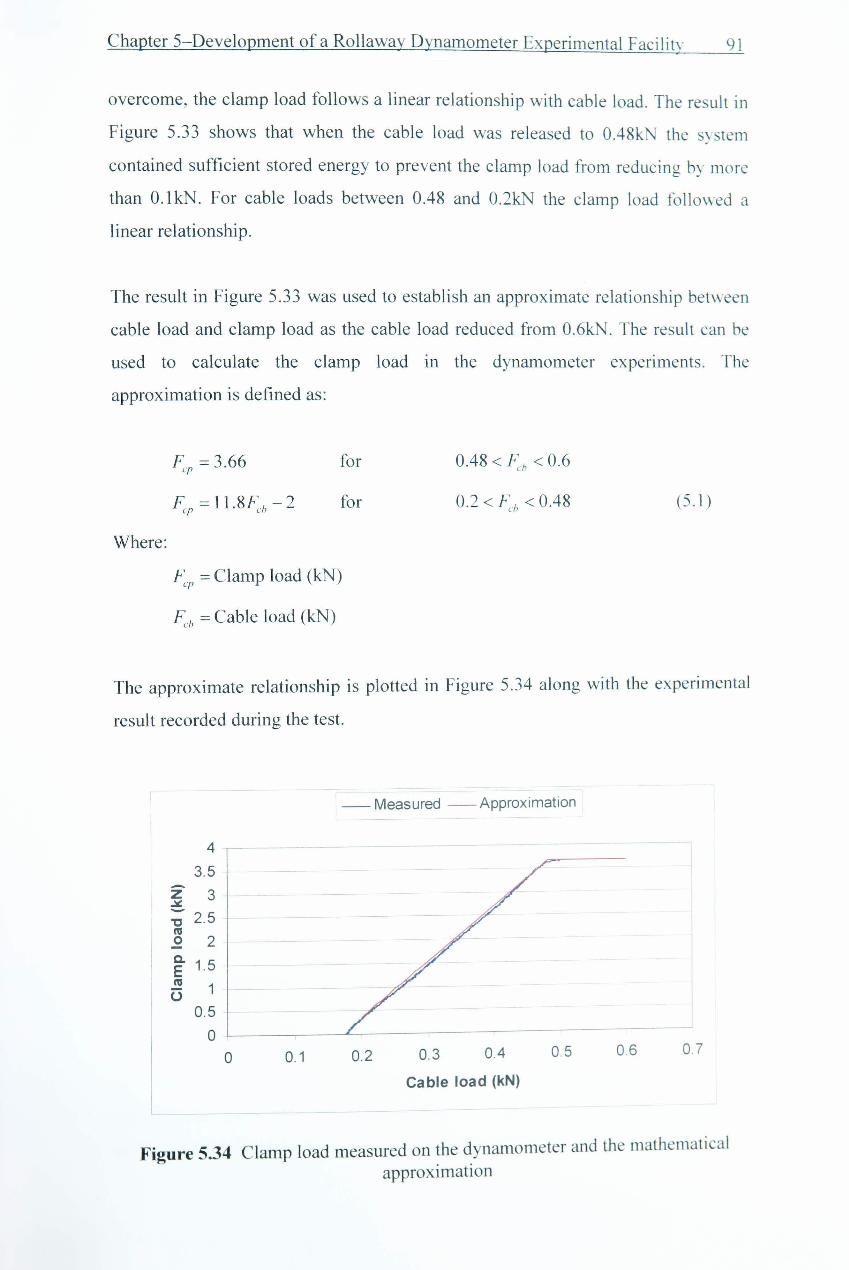
Figure 5.34 Clamp load measured on the dynamometer and the mathematical apprOxImatIon ..................................................•.................•.............................. 9 t
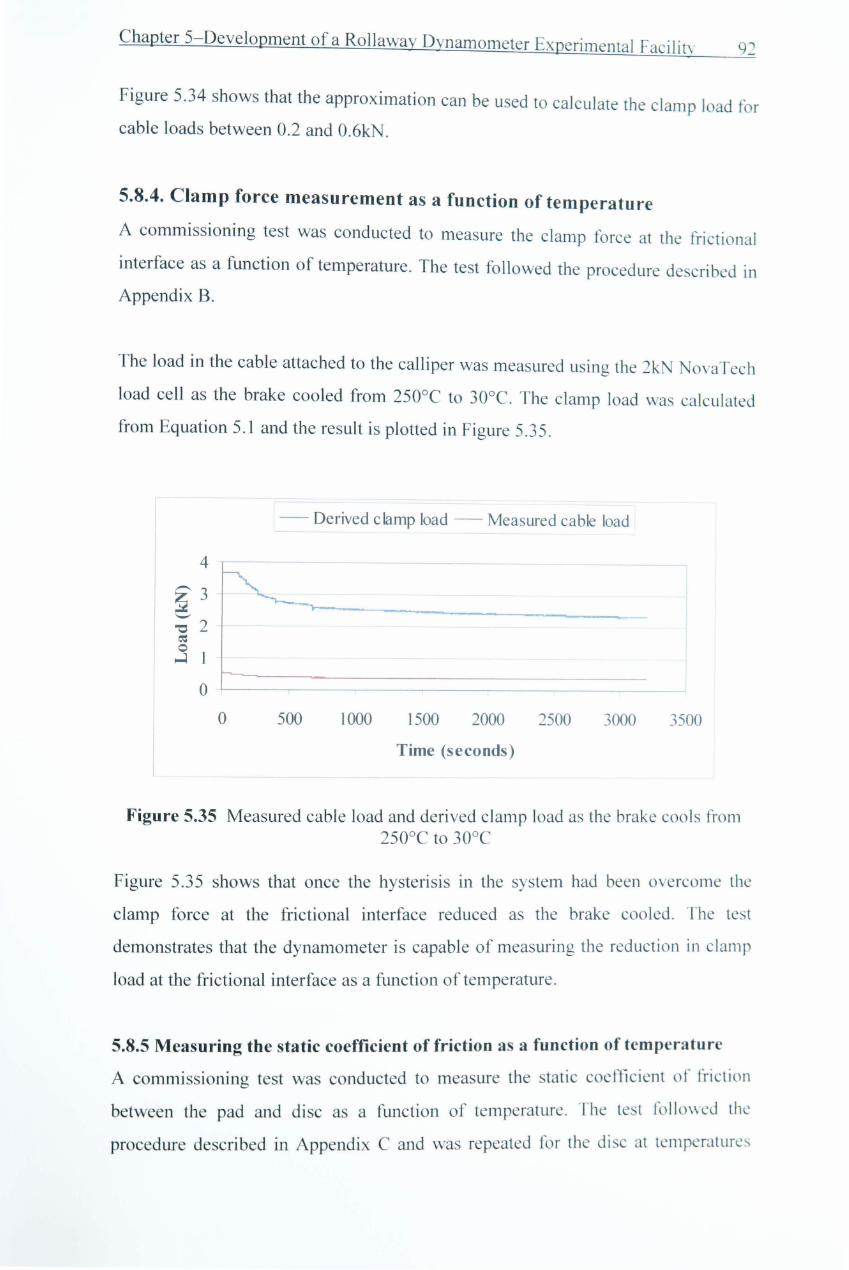
Figure 5.35 Measured cable load and derived clamp load as the brake cools from 250°C to 30°C ..............................................•........•.................................. 92
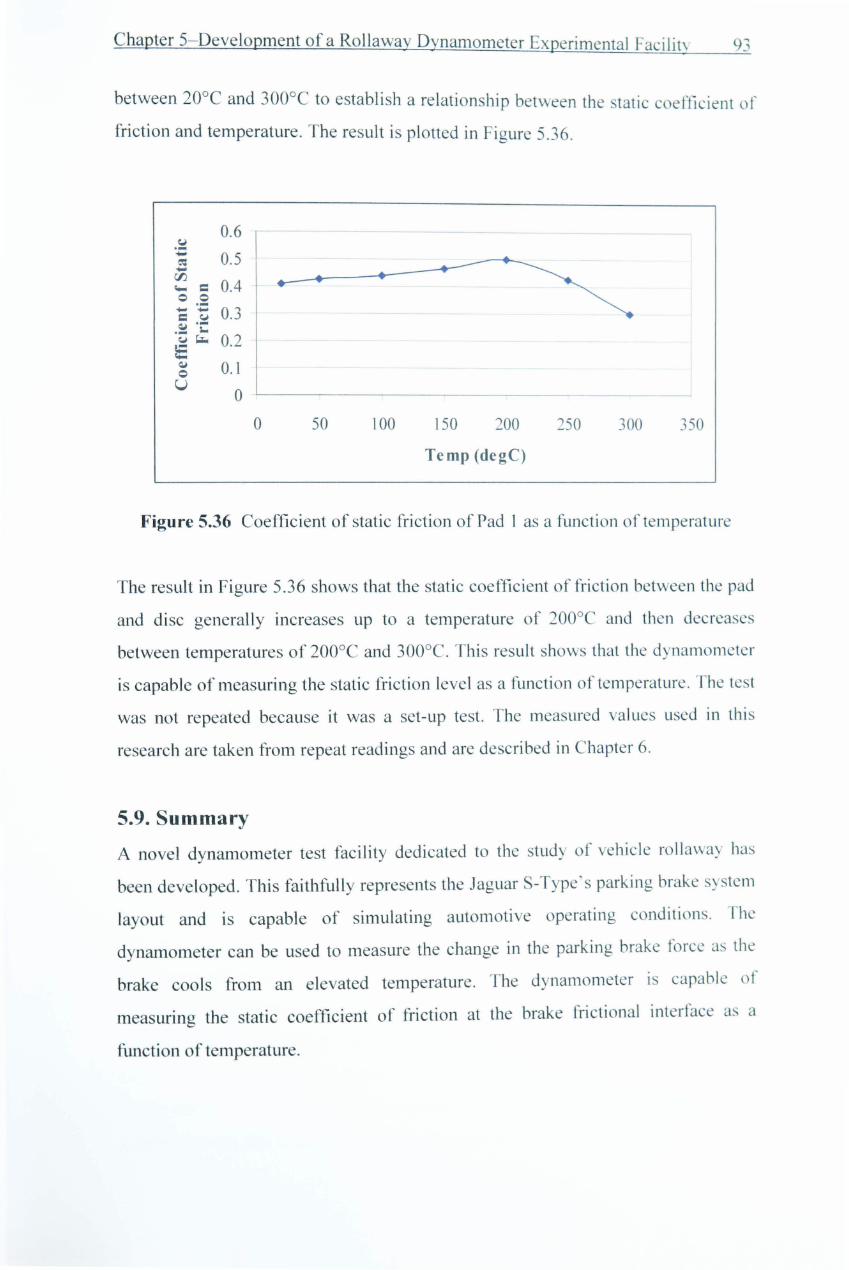
Figure 5.36 Coefficient of static friction as a function of temperature ................... 93
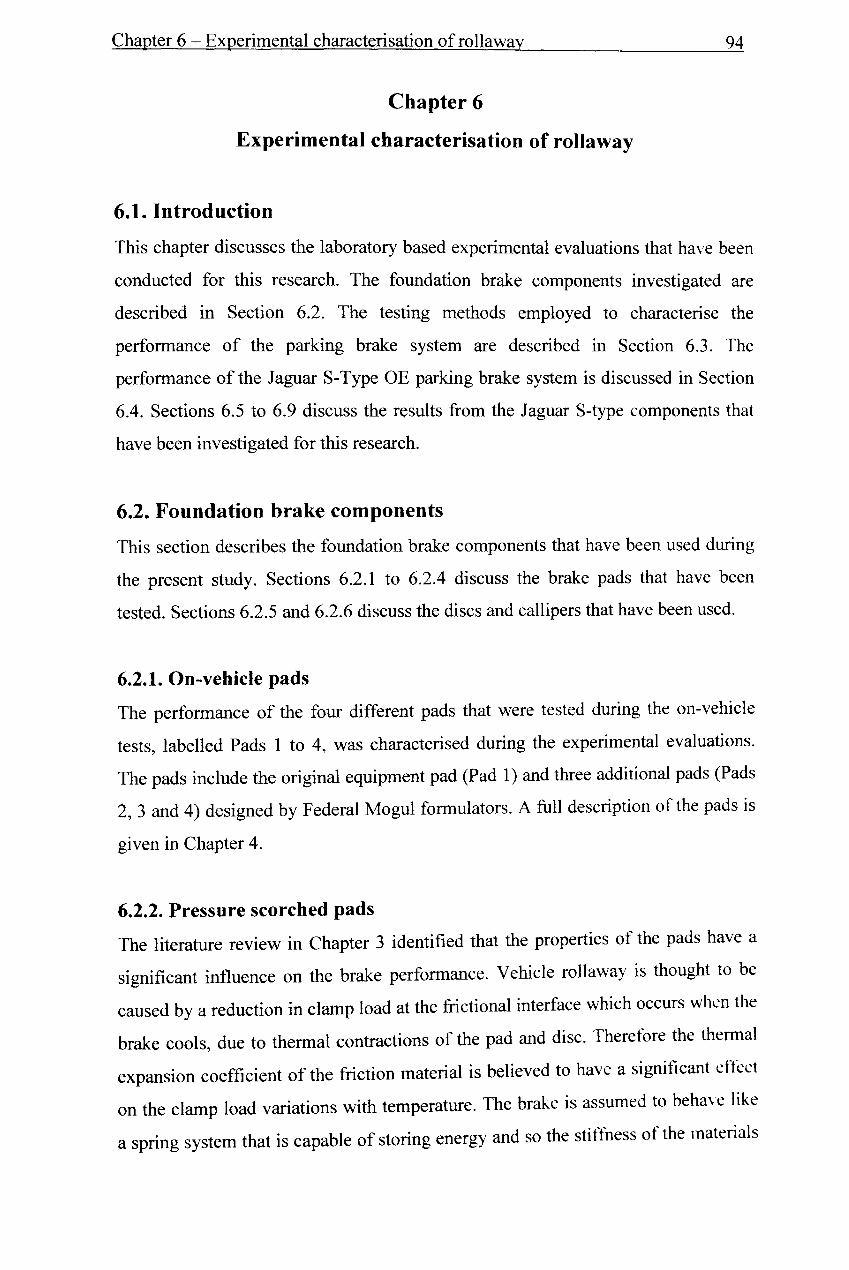
Figure 6.1 Schematic of the pressure scorching machine ....................................... 96
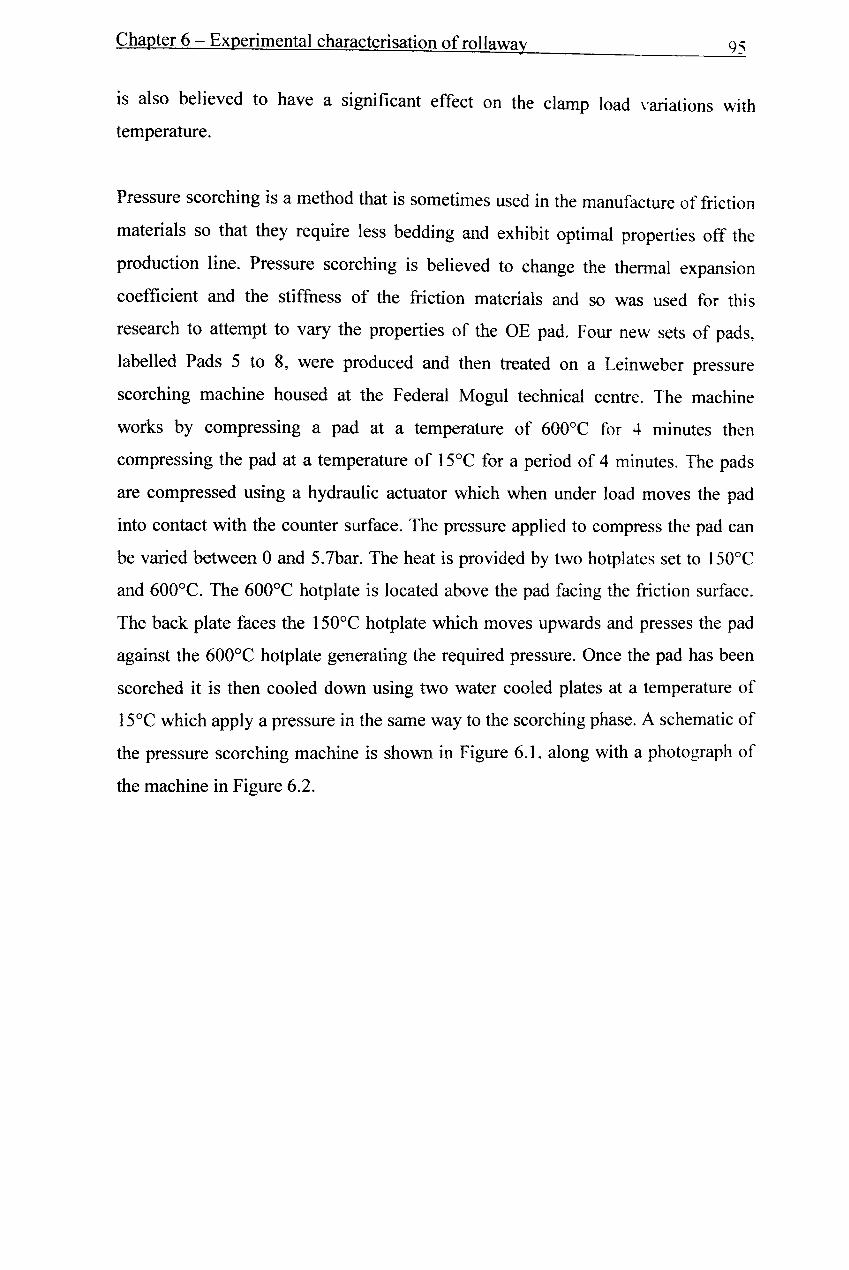
Figure 6.2 Photograph of the pressure scorching machine ...................................... 97
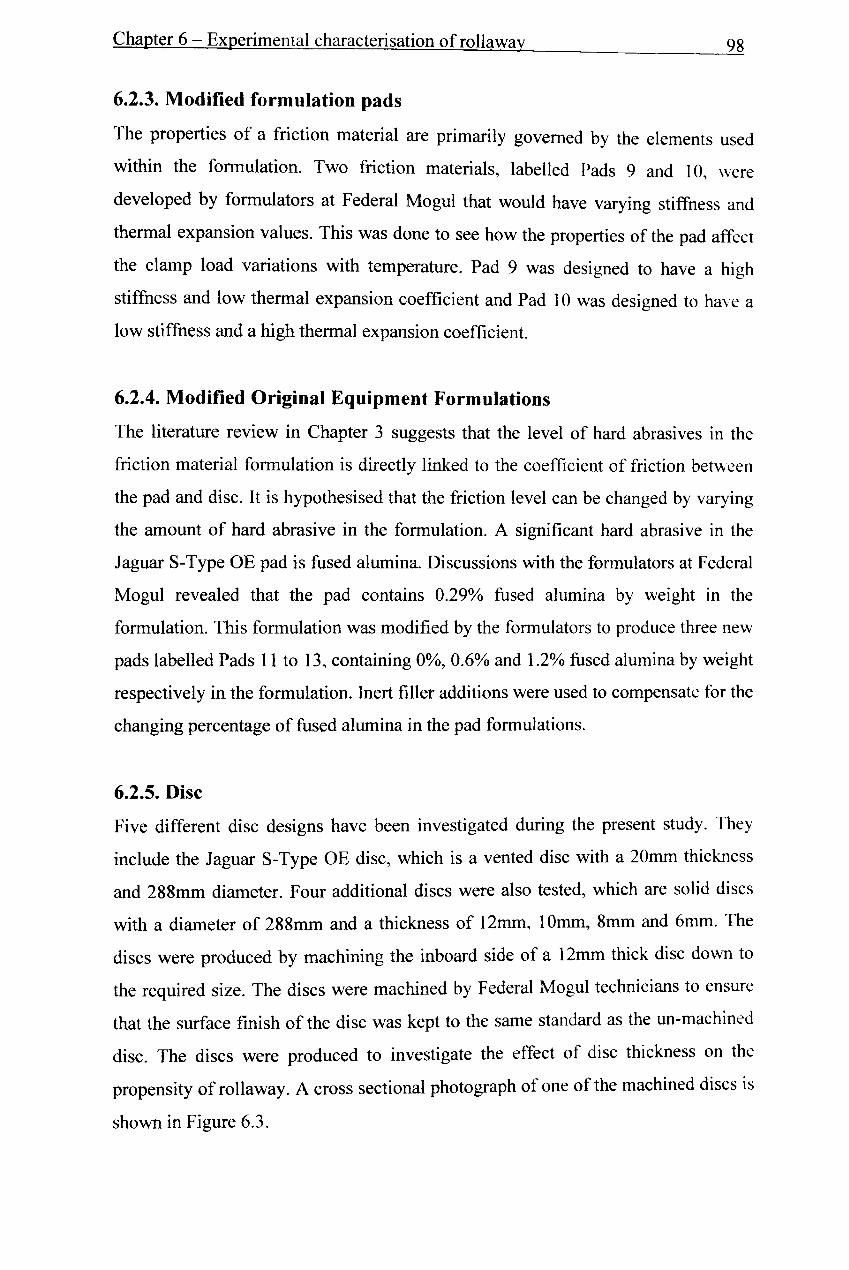
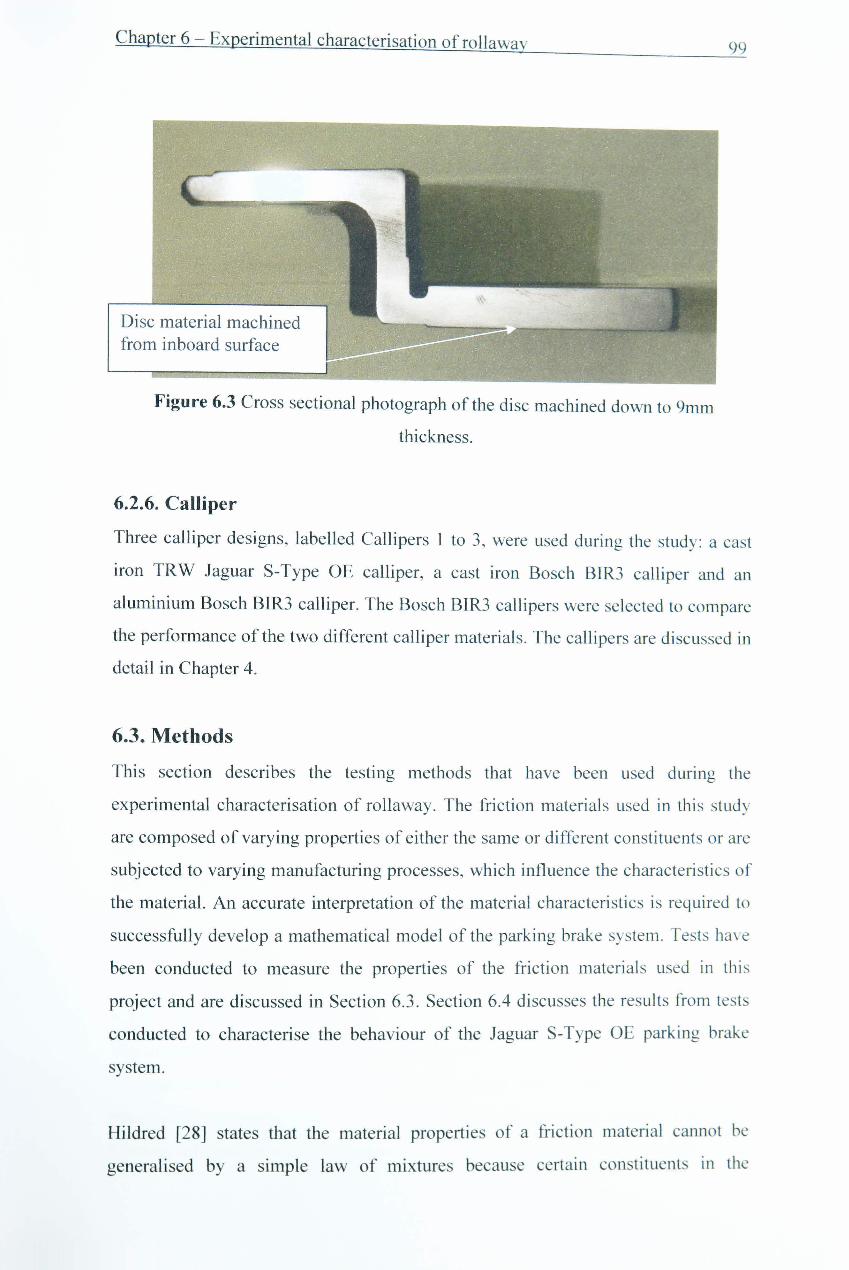
Figure 6.3 Cross sectional photograph of the disc machined down to 9mm thickness ............••....•........................................................................................ 99
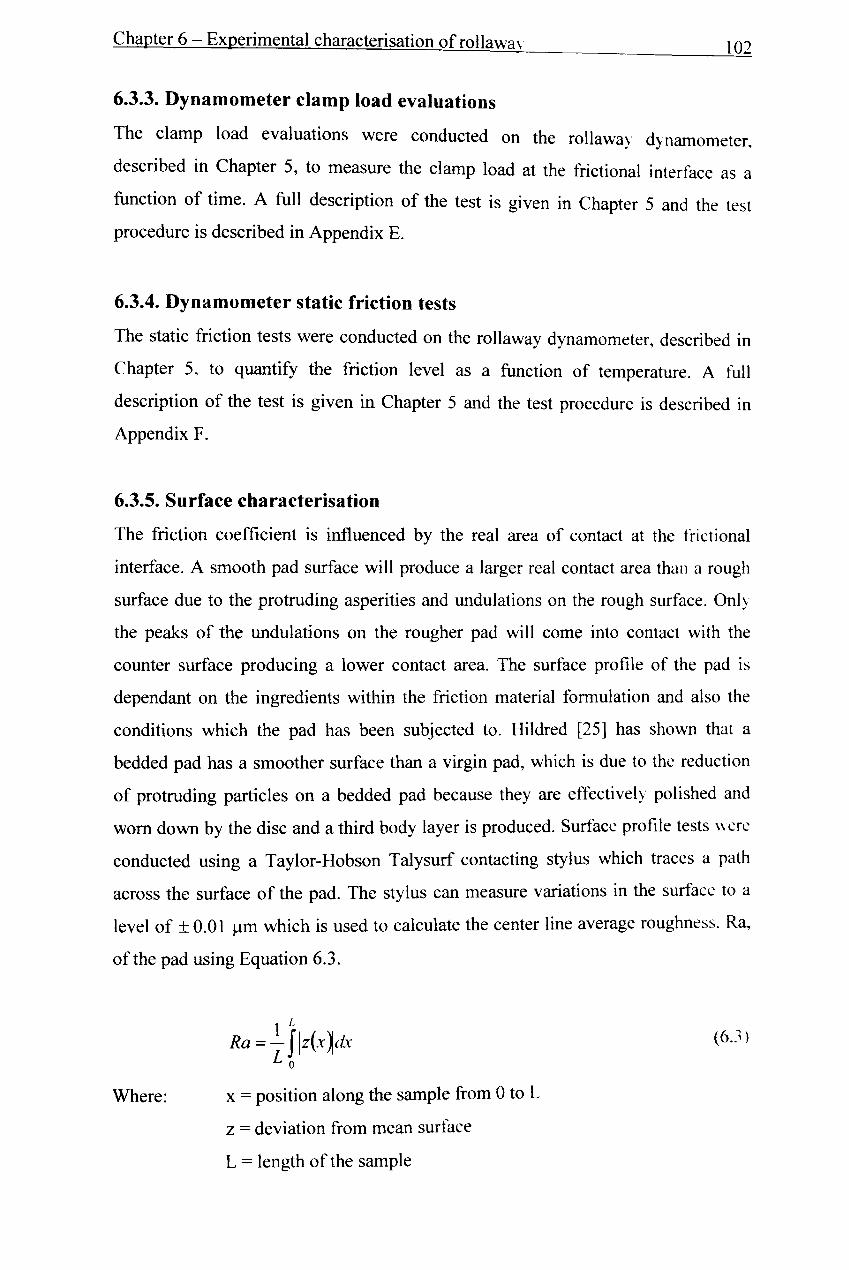
Figure 6.4 Position of the surface profile measurements on the pad ..................... 1 03
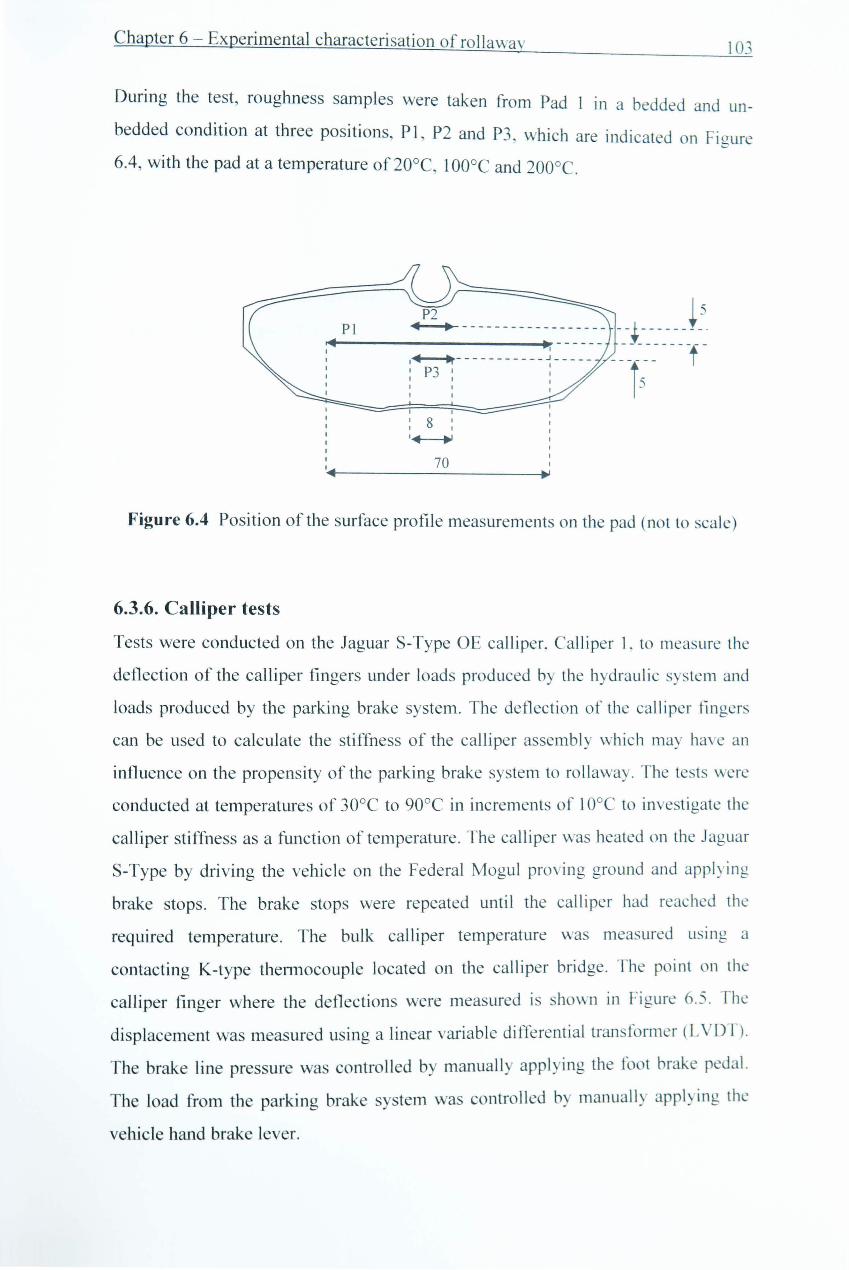
Figure 6.5 S-Type calliper with deflection measurement point 15mm from tip of calliper finger ............................................................................................. 104
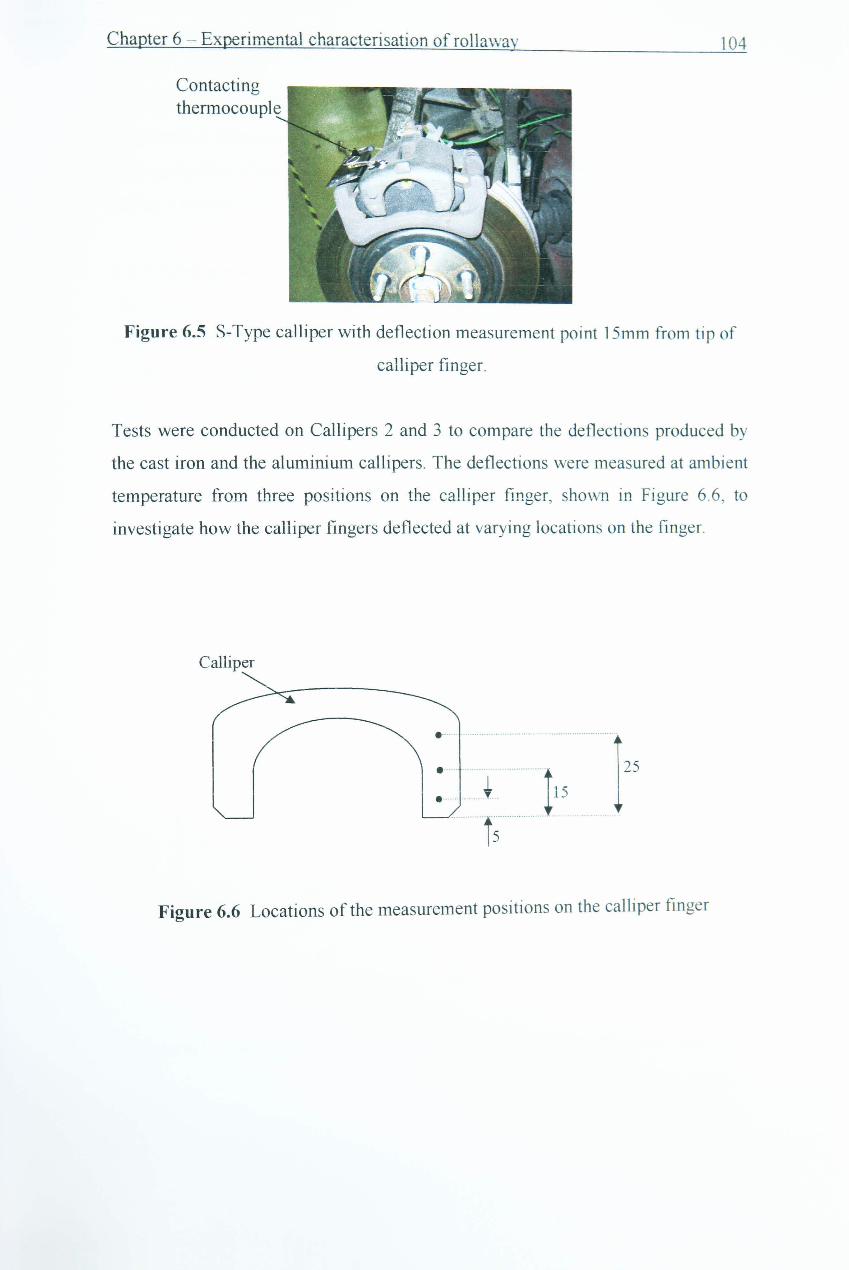
Figure 6.6 Location of the measurement positions on the calliper finger ............. 104
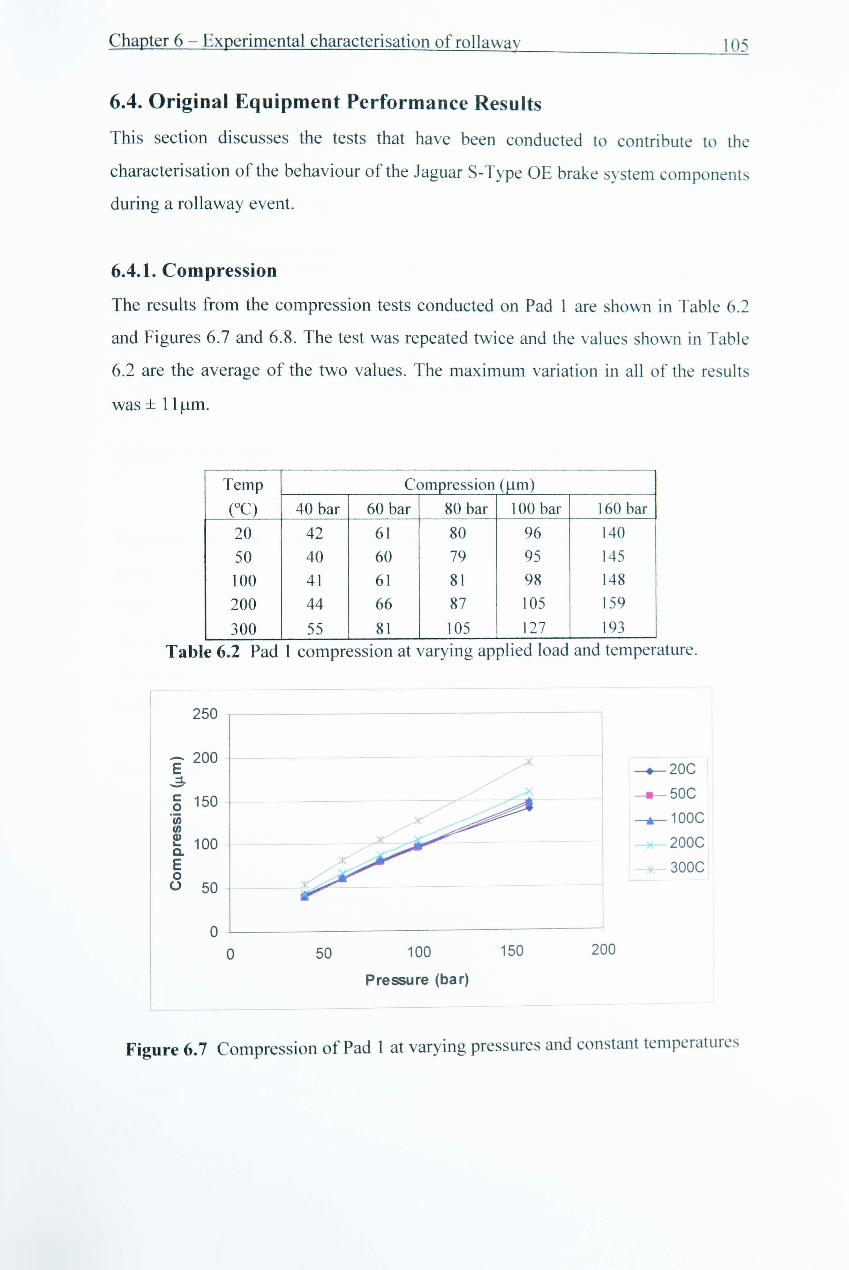
Figure 6.7 Compression of Pad 1 at varying pressures and constant temperatures .................•......•..............................•...•....................................... 105
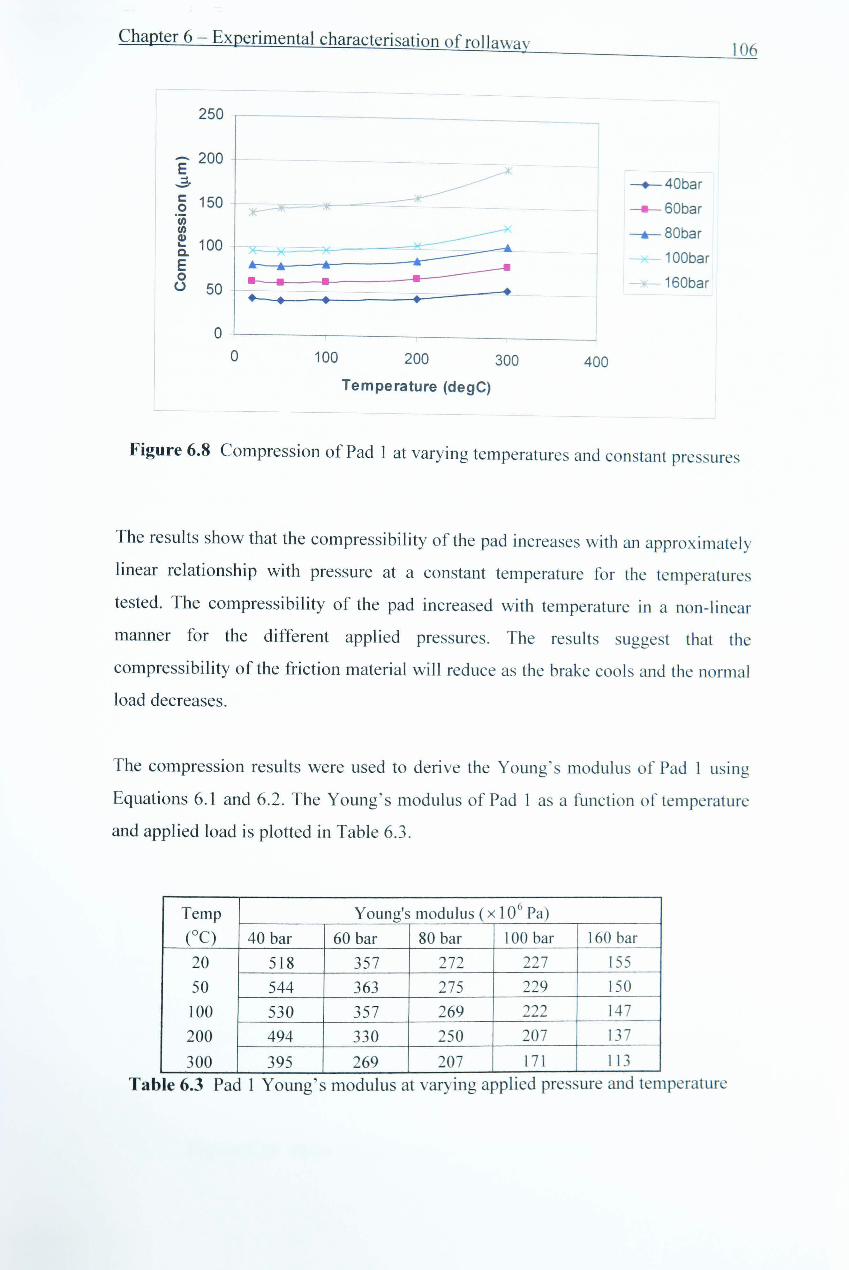
Figure 6.8 Compression of Pad 1 at varying temperatures and constant pressures .......................................................................................................... 106
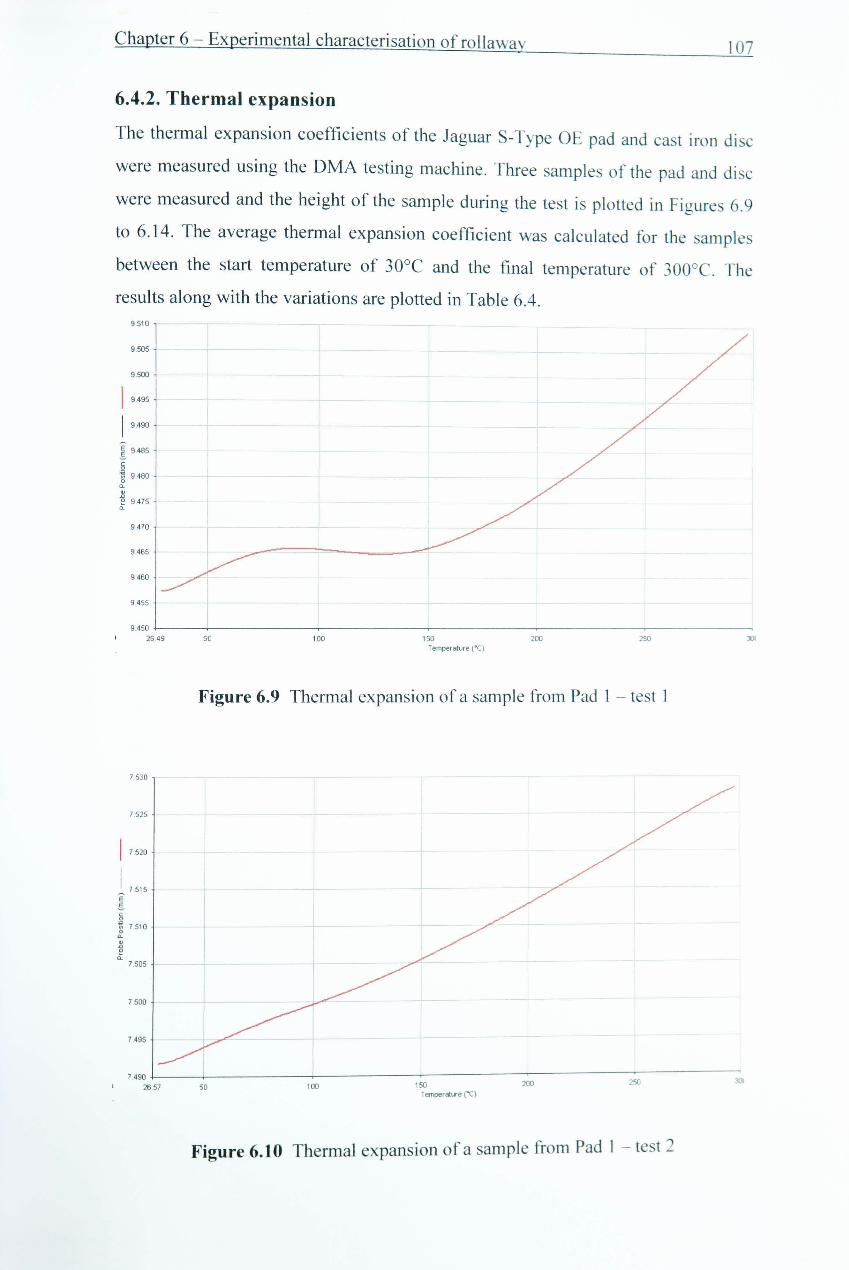
Figure 6.9 Thermal expansion of a sample from Pad 1 - test 1 ............................. 107
Figure 6.10 Thermal expansion of a sample from Pad 1 - test 2 ........................... 107
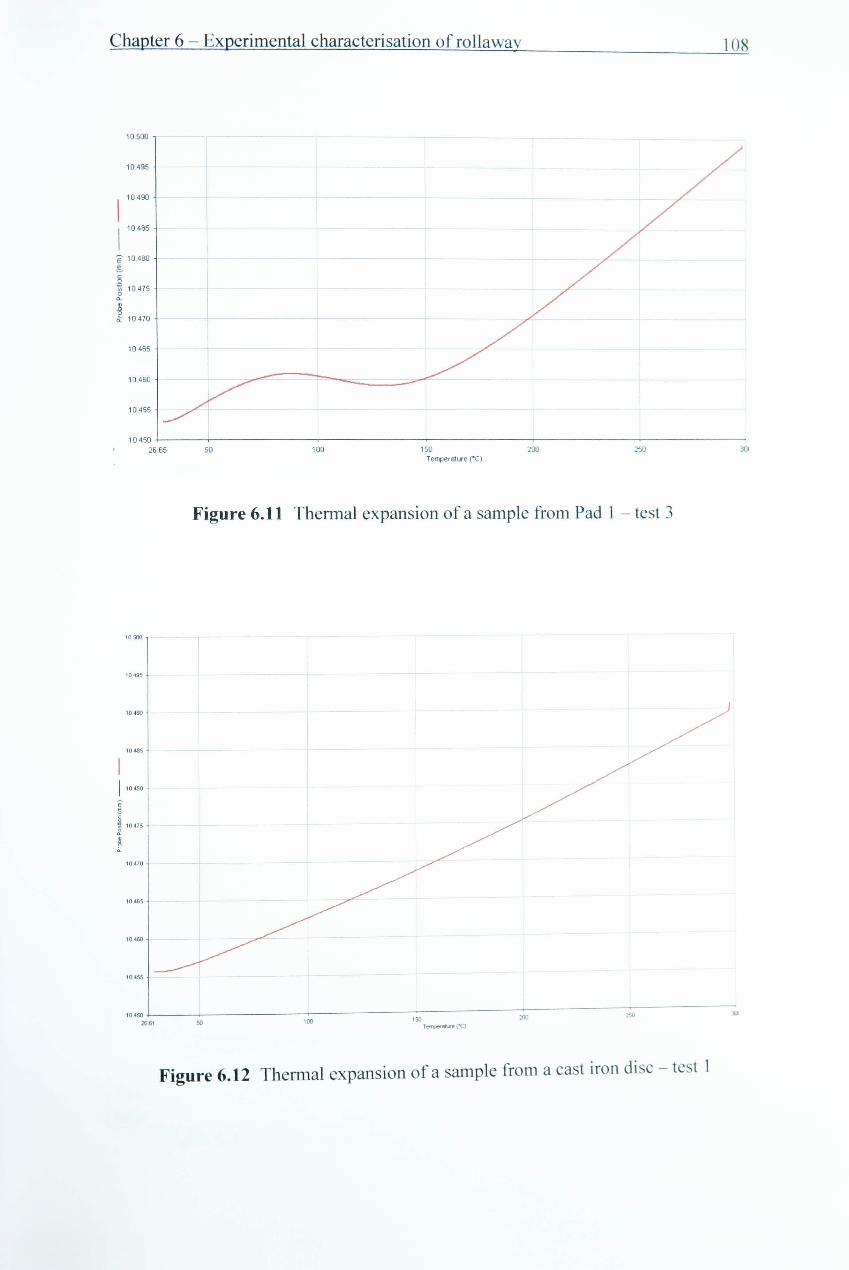
Figure 6.11 Thermal expansion of a sample from Pad 1 - test 3 ........................... 108
Figure 6.12 Thermal expansion of a sample from a cast iron disc - test 1 ............ 108
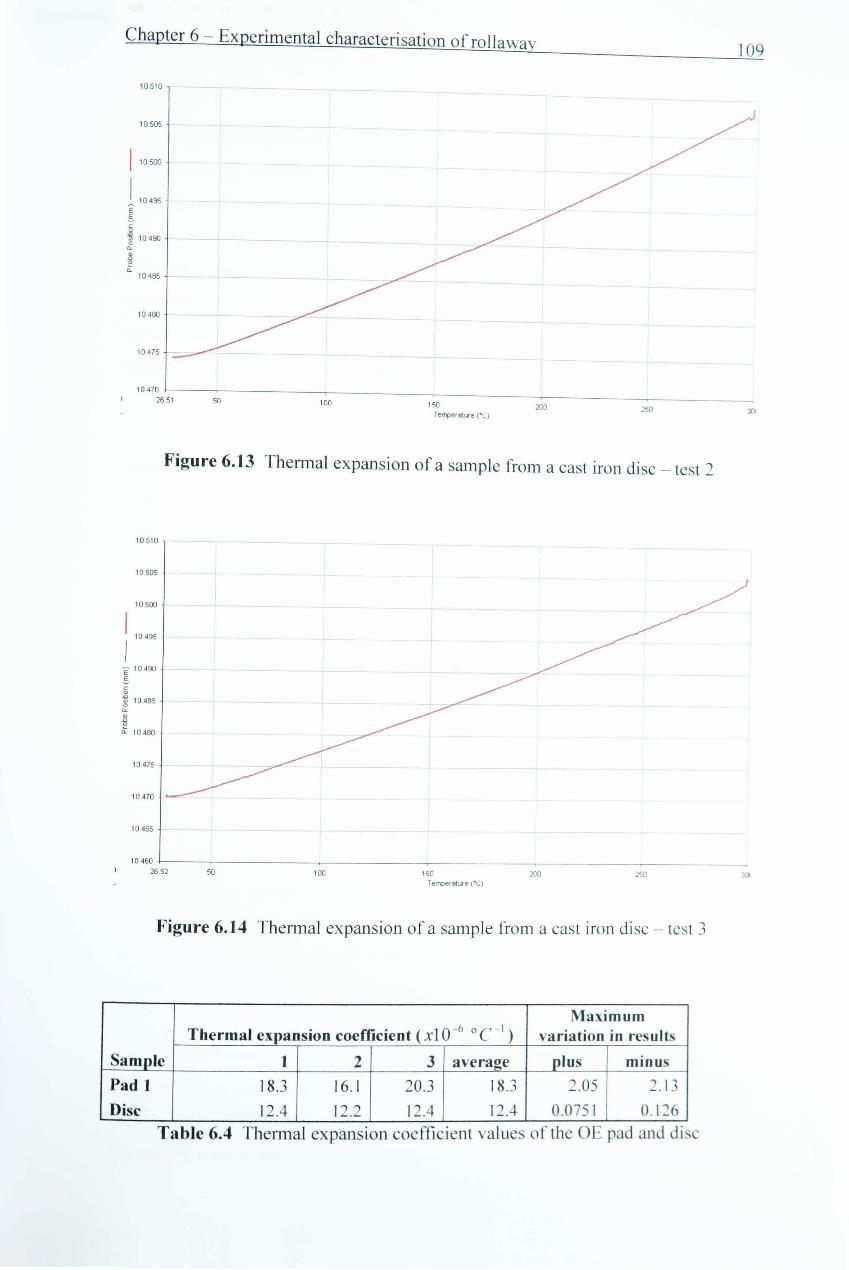
Figure 6.13 Thermal expansion of a sample from a cast iron disc - test 2 ............ 109
Figure 6.14 Thermal expansion of a sample from a cast iron disc - test 3 ............ 109
- XlI -
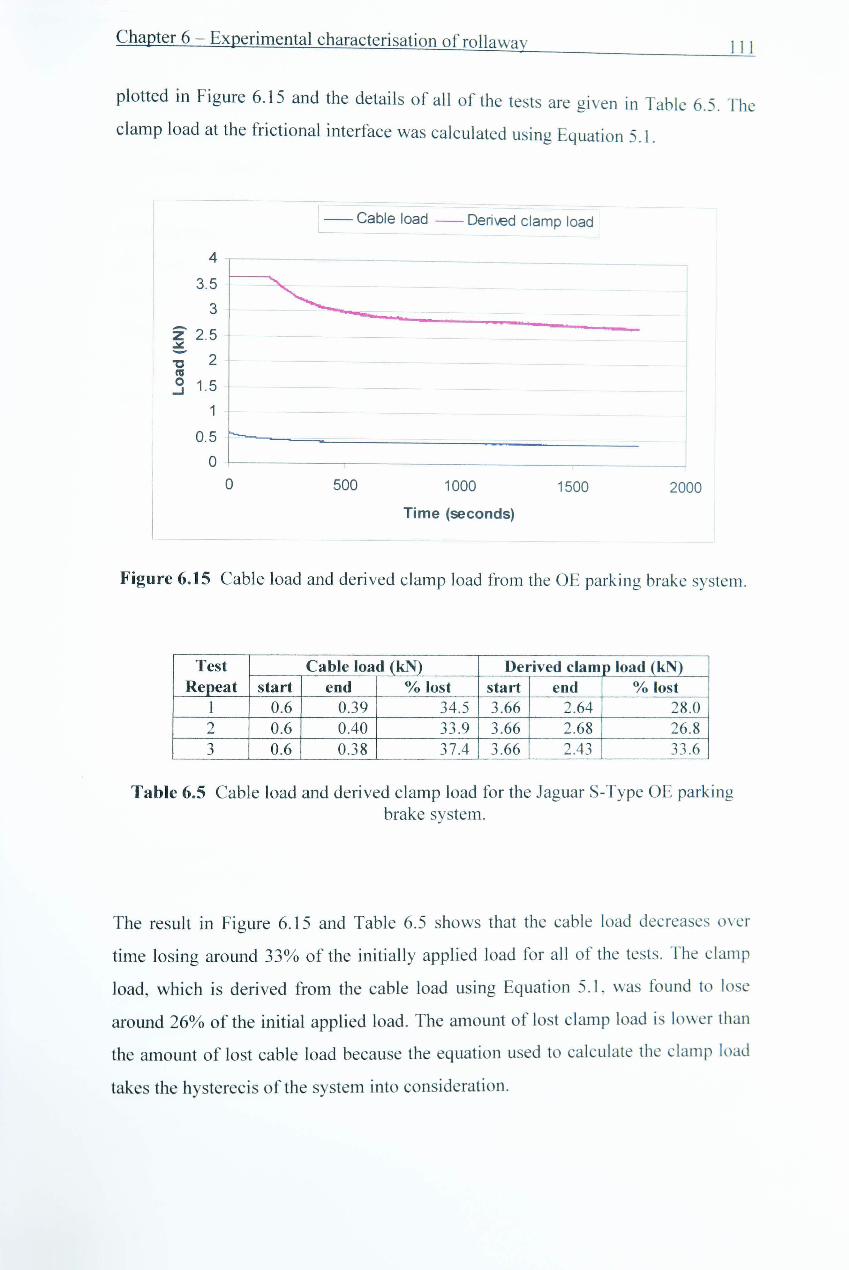
Figure 6.15 Cable load and derived clamp load from the OE parking brake system .............•........................................................................................................ 111
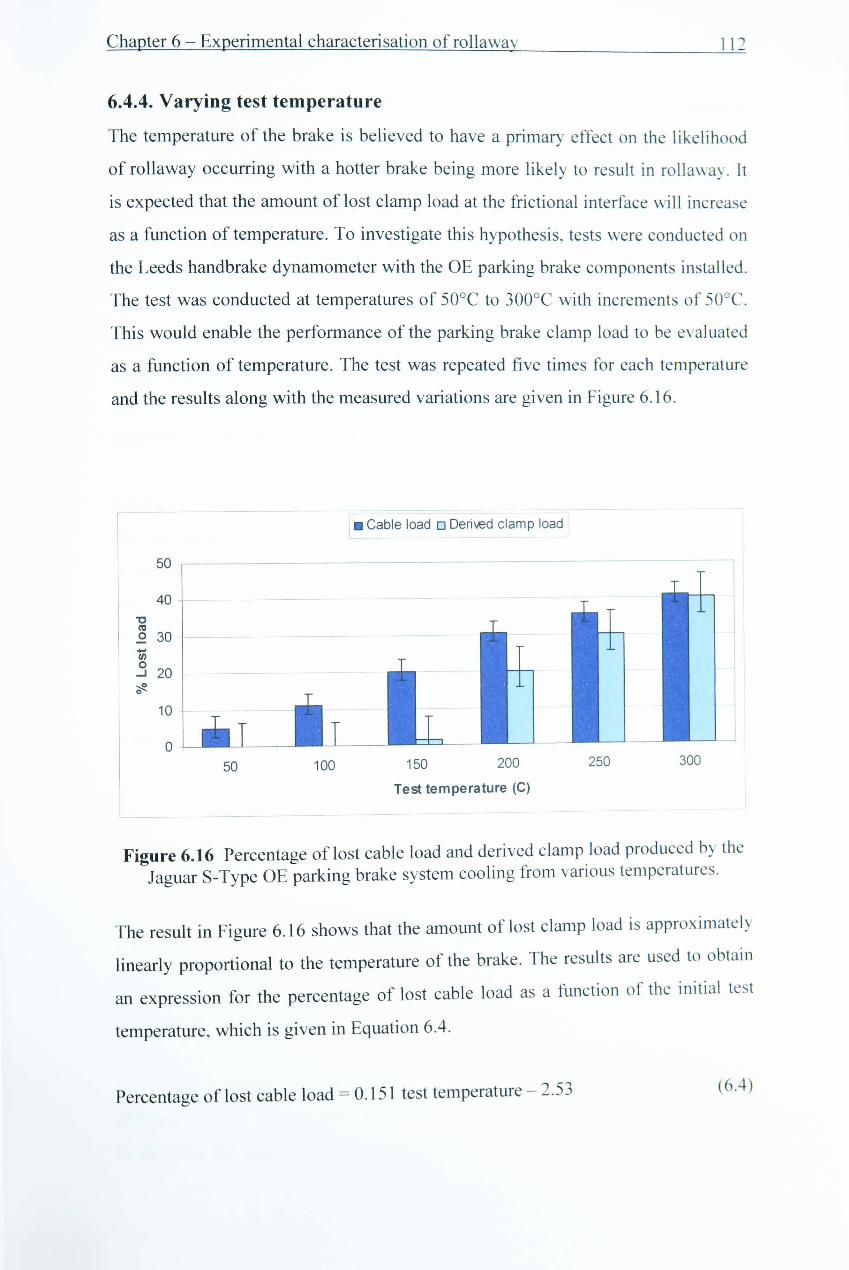
Figure 6.16 Percentage of lost cable load and derived clamp load produced by the Jaguar S-Type OE parking brake system cooling from various temperatures ......•...........................•.................•.............................................. 112
Figure 6.17 Percentage of lost cable load and derived clamp load produced by the Jaguar S-Type OE parking brake system with pads of varying thickness ..................................................................•.......••.....................•....... 114
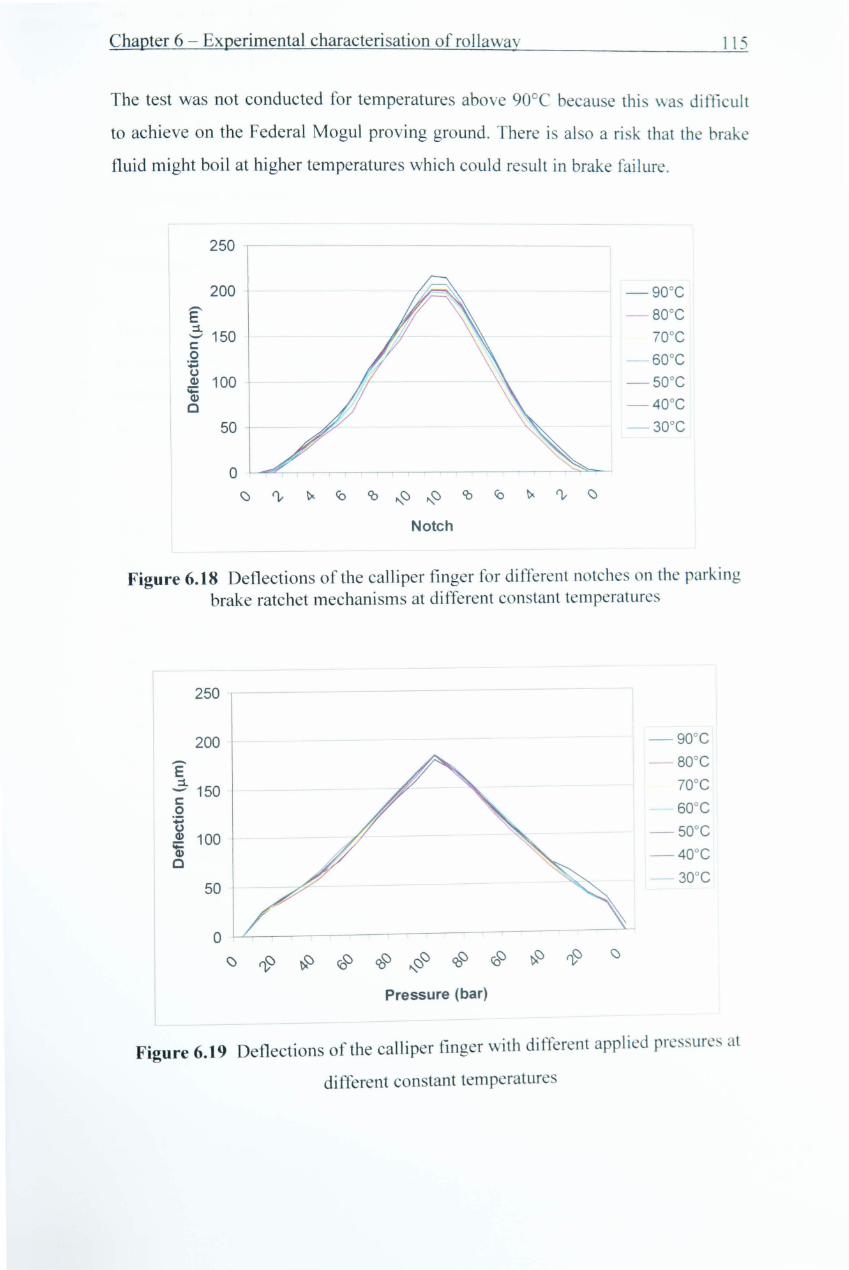
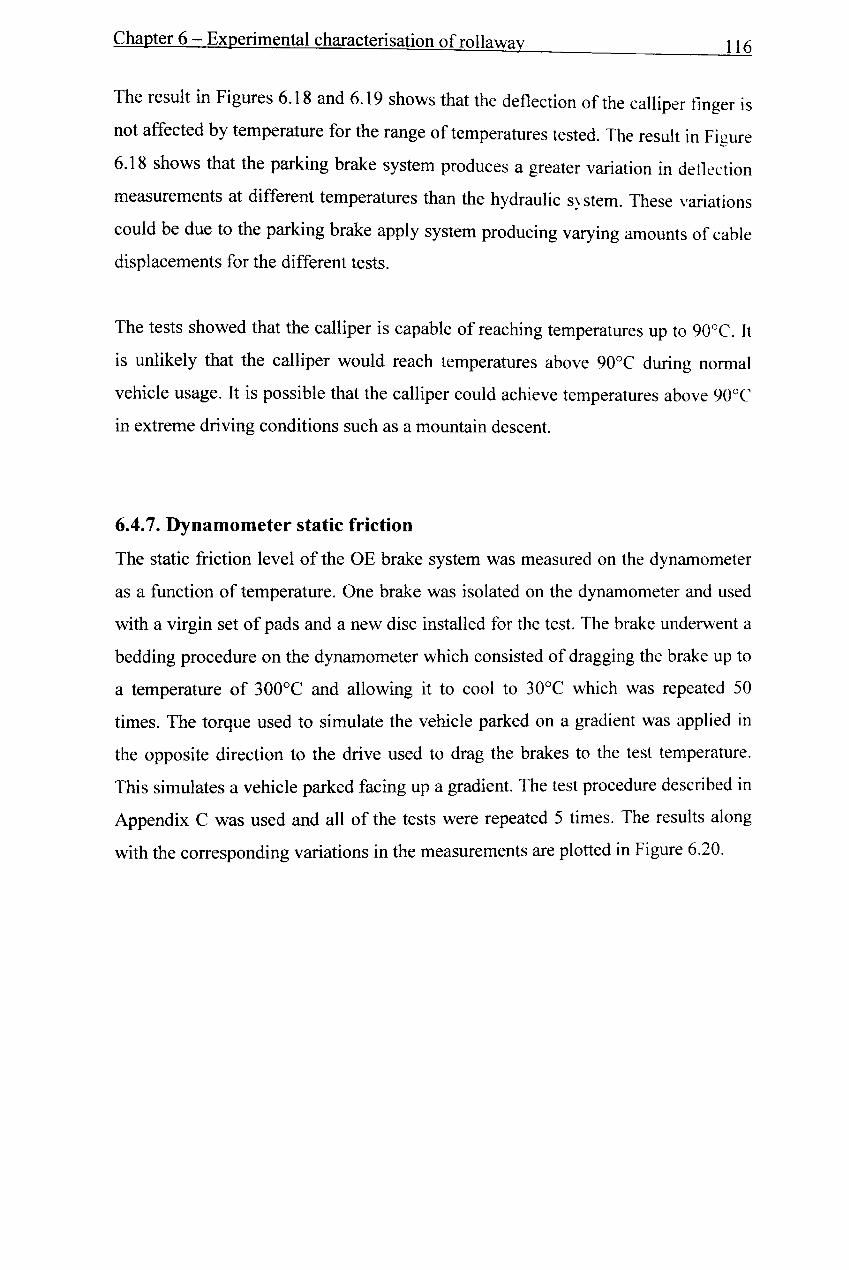
Figure 6.18 Deflections of the calliper finger for different nitches on the parking brake ratchet mechanism at different constant temperatures ............ 115
Figure 6.19 Deflections of the calliper finger with different applied pressures at different constant temperatures .......................•....•...................................•. 115
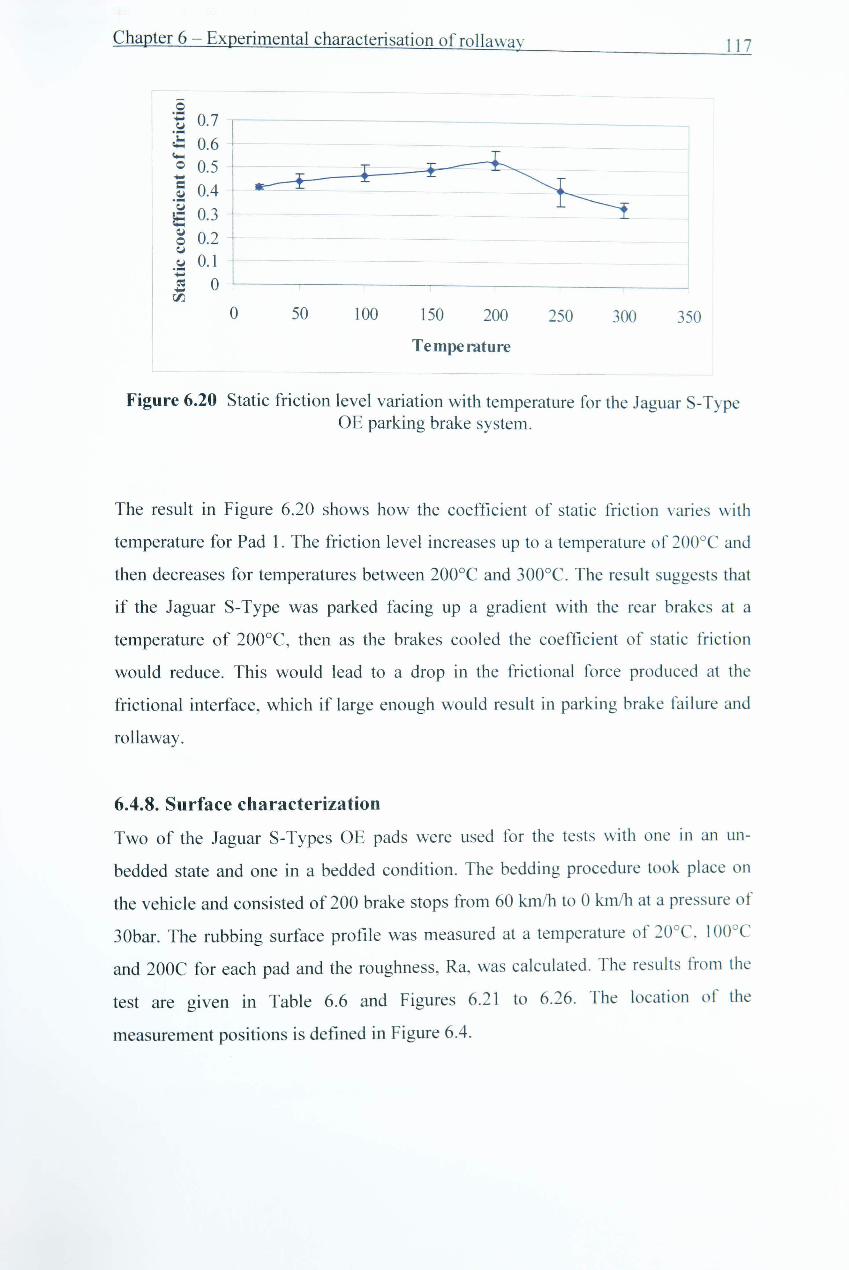
Figure 6.20 Static friction level variation with temperature for the Jaguar S-Type OE parking brake system ........•...•......................................................... 117
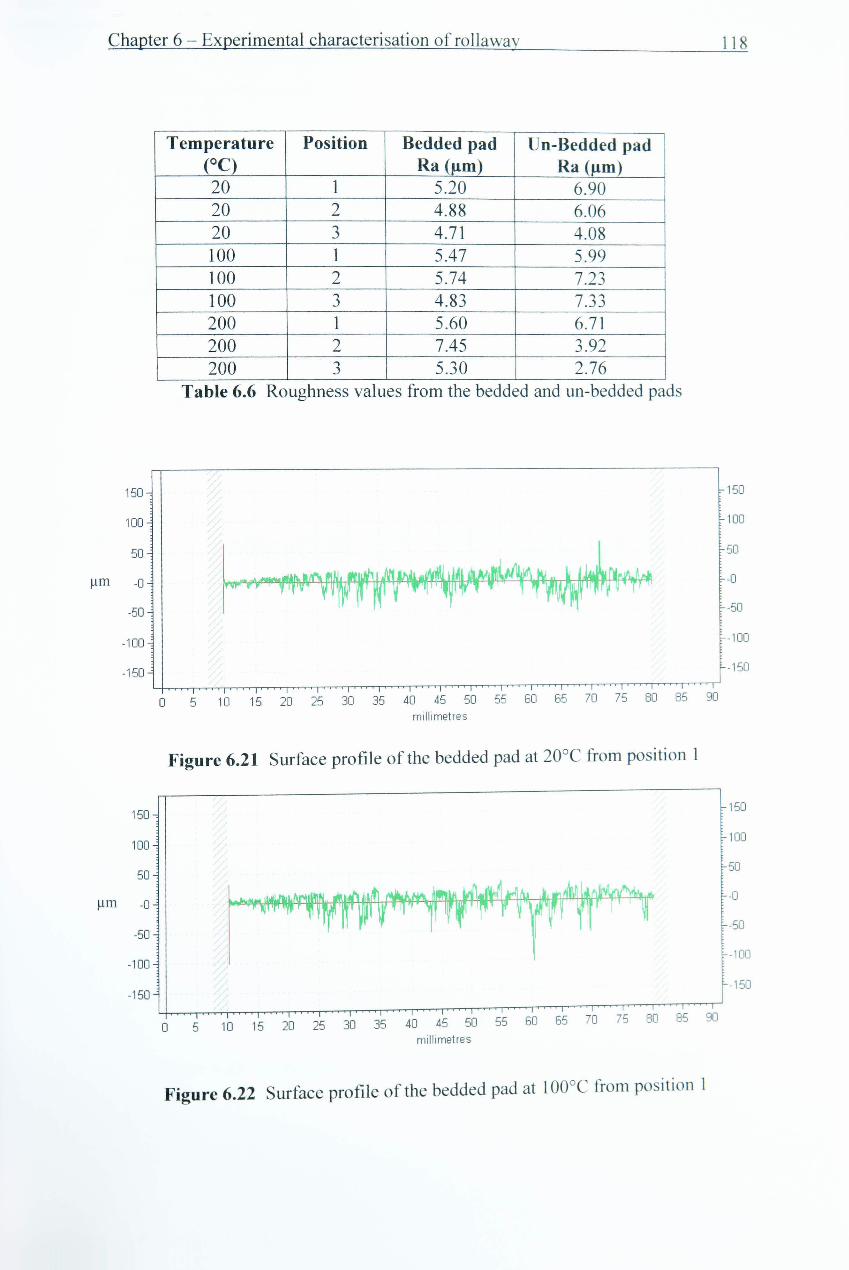
Figure 6.21 Surface profile of the bedded pad at 20°C from position 1 ................ 118
Figure 6.22 Surface profile of the bedded pad at 100°C from position 1 .............. 118
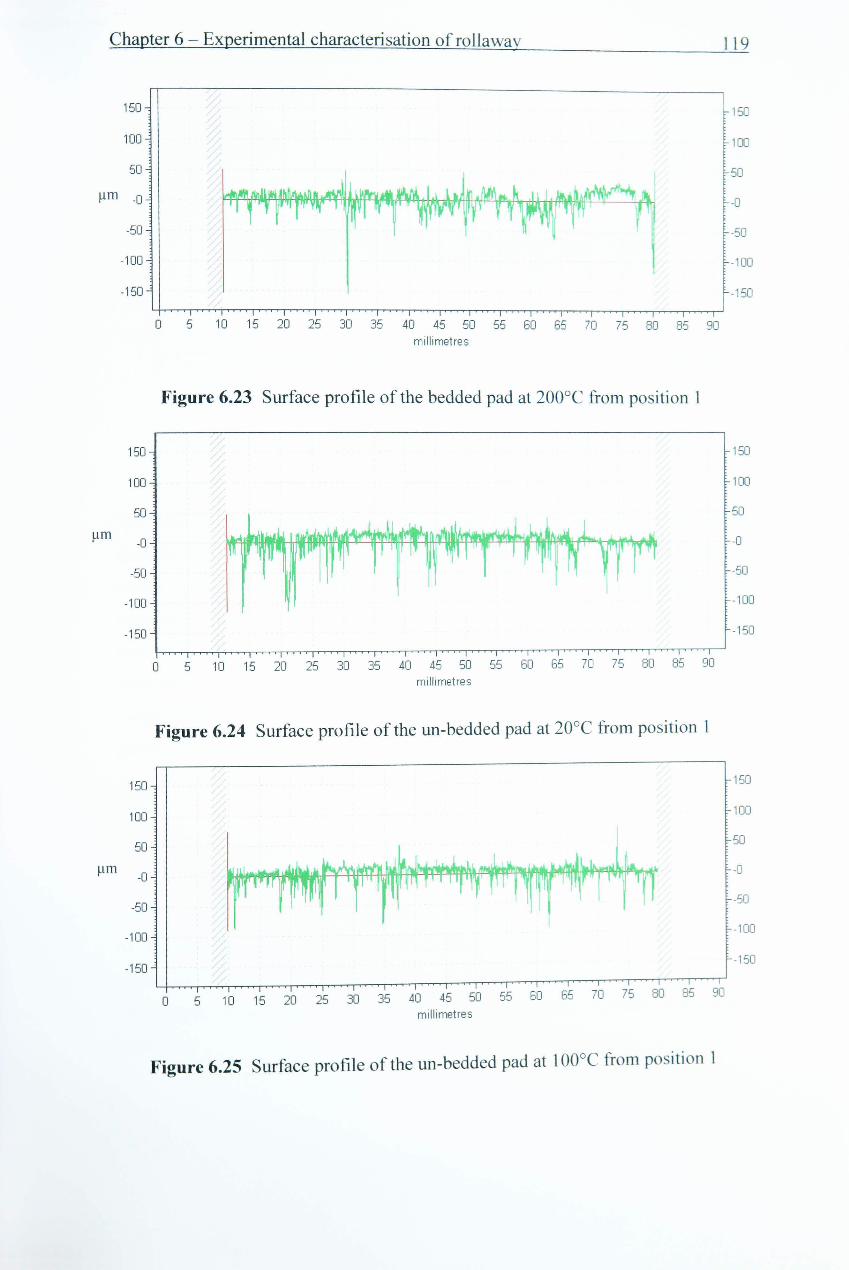
Figure 6.23 Surface profile of the bedded pad at 200°C from position 1 .............. 119
Figure 6.24 Surface profile of the un-bedded pad at 20°C from position 1 .......... 119
Figure 6.25 Surface profile of the un-bedded pad at 100°C from position 1 ........ 119
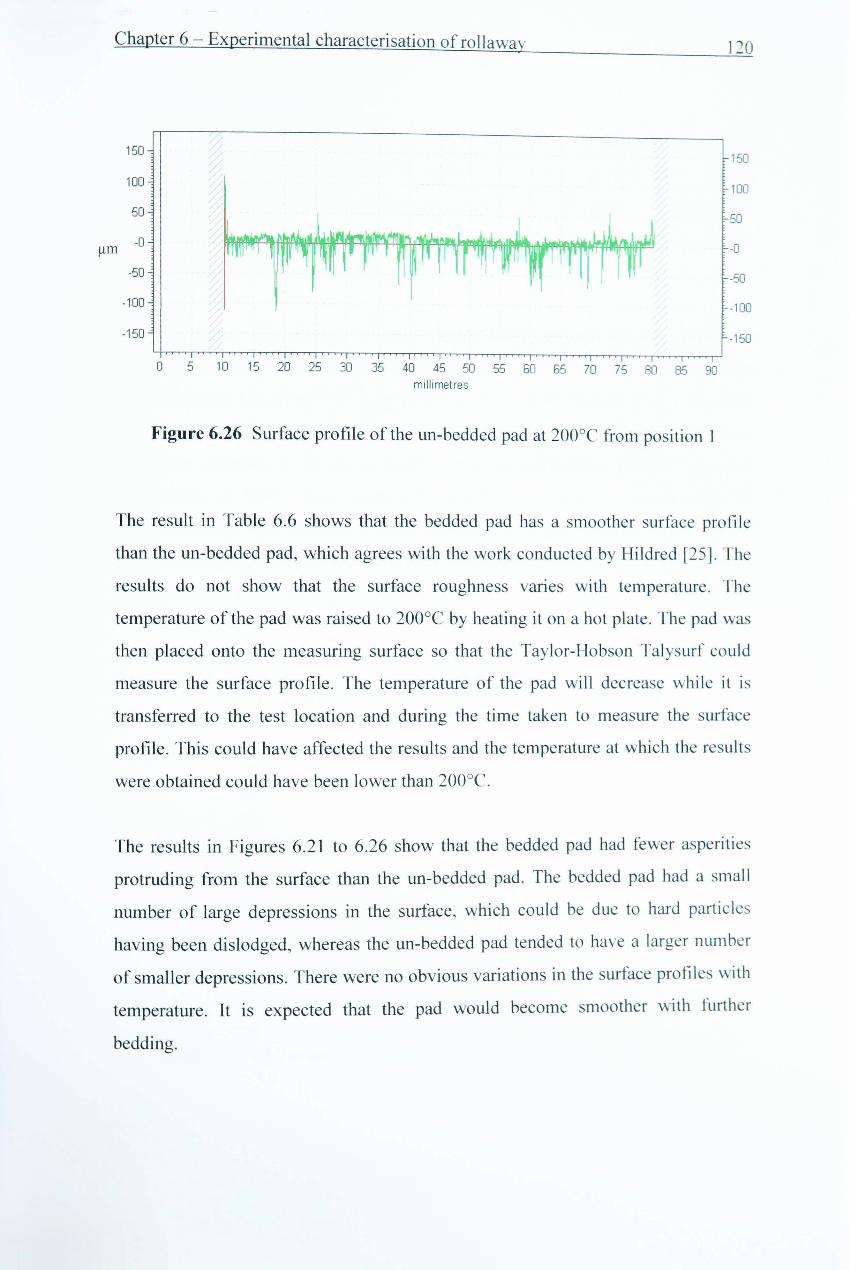
Figure 6.26 Surface profile of the un-bedded pad at 200°C from position 1 ........ 120
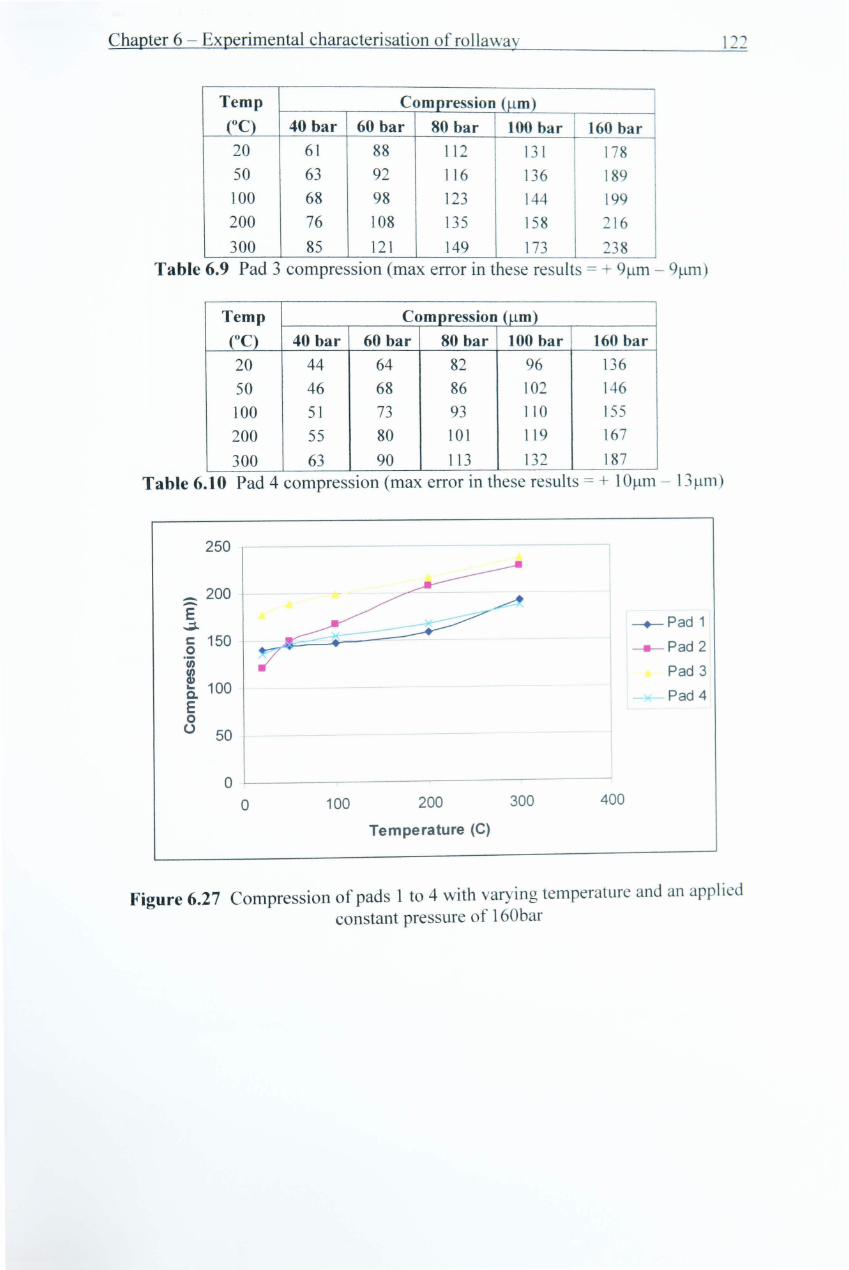
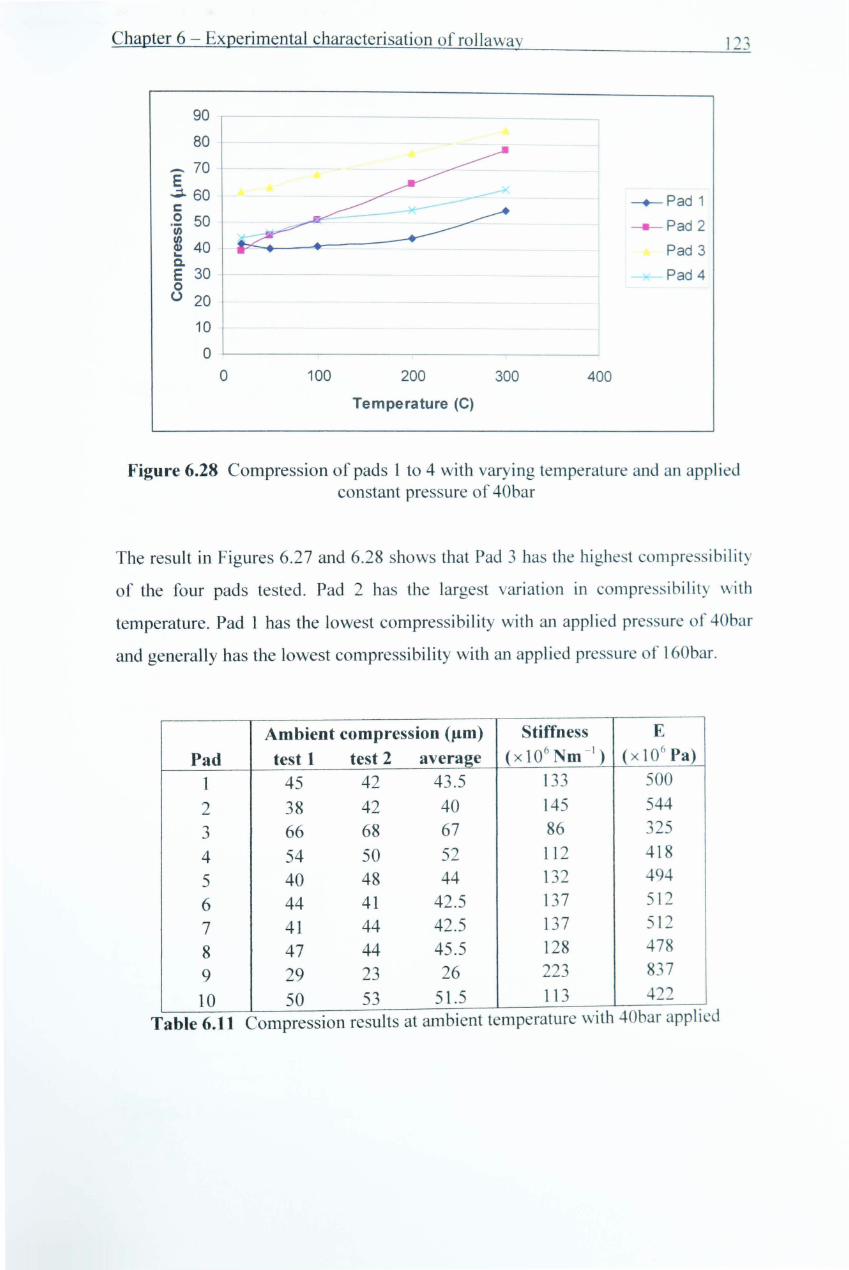
Figure 6.27 Compression of pads 1 to 4 with varying temperature and an applied constant pressure of 160bar .............................................•................. 122
Figure 6.28 Compression of pads 1 to 4 with varying temperature and an applied pressure of 40bar ...............................................................•......•........ 123
Figure 6.29 Percentage of lost cable load and derived clamp load during the dynamometer clamp load evaluations ............................................................ t 27
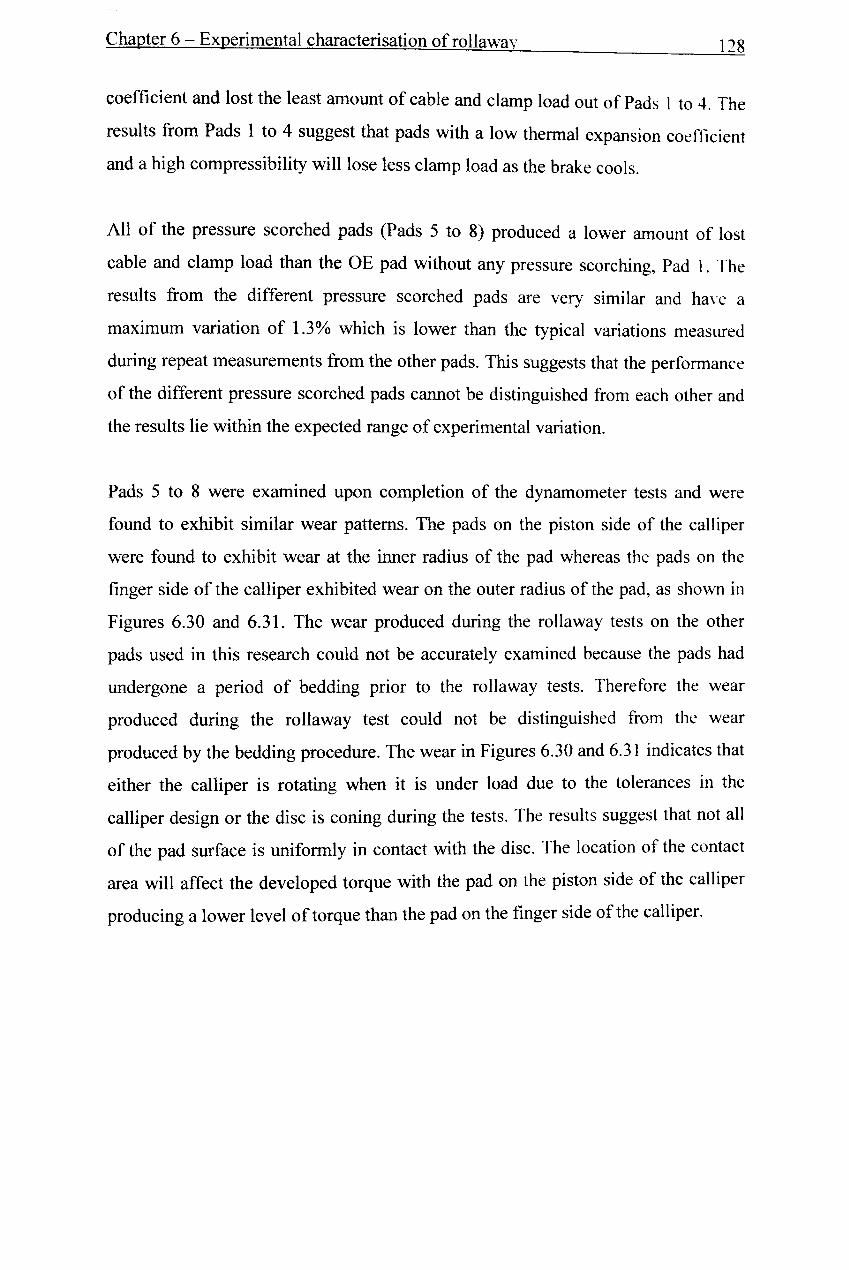
Figure 6.30 Wear on pad from piston side of calliper .................................•......... 129
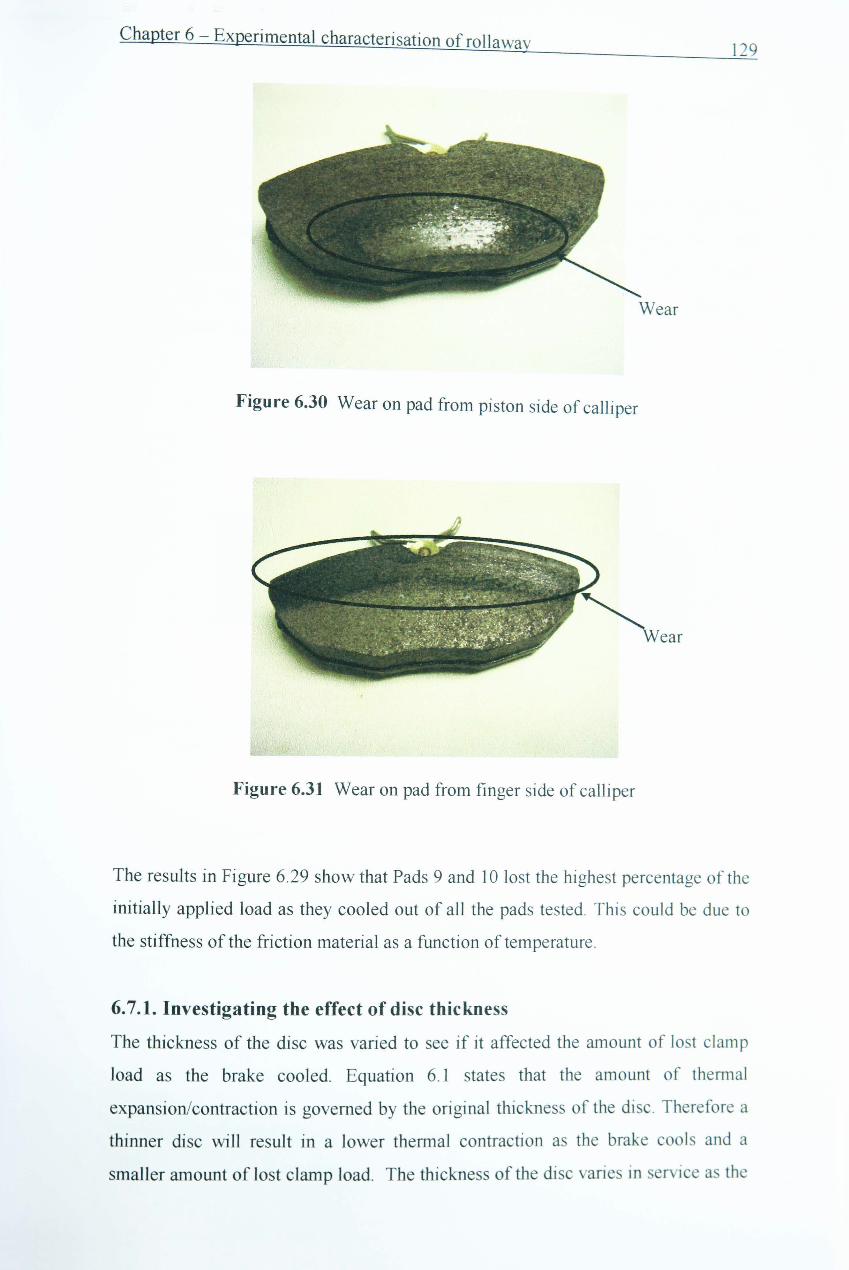
Figure 6.31 Wear on pad from finger side of calliper ........................................... 129
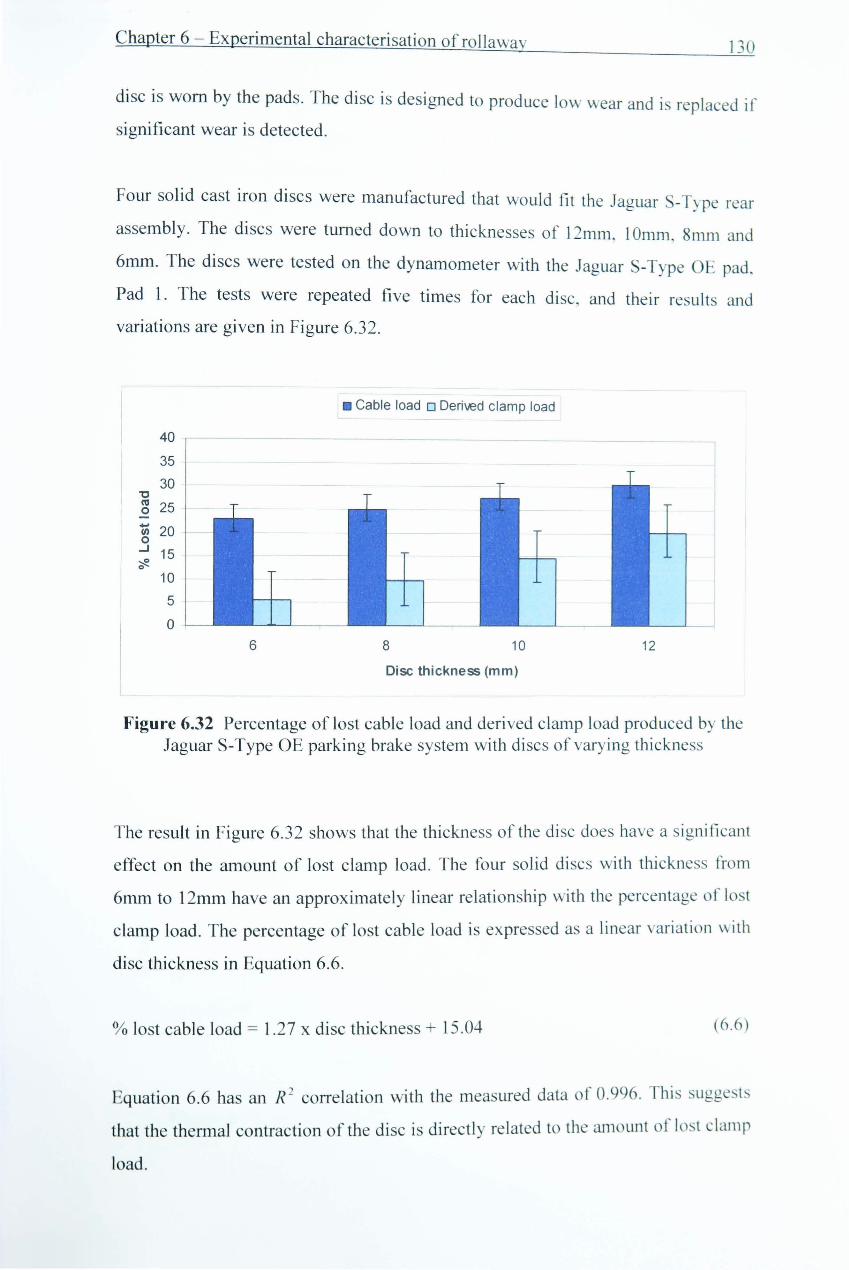
Figure 6.32 Percentage of lost cable load and derived clamp load produced by the Jaguar S-Type OE parking brake system with discs of varying thickness •.....•..•....•..•.........•..•.•........................................................................ 130
Figure 6.33 Deflections of the aluminium BOSCH BIR3 calliper finger ............. 131
Figure 6.34 Deflections of the cast iron BOSCH BIR3 calliper finger ................. 131
Figure 6.35 Static friction level variation with temperature for pads 1 to 4 ......... 133
Figure 6.36 Static friction level variation with temperature for pads 1, 11, 12 and 13 ............................................................................................................. 134
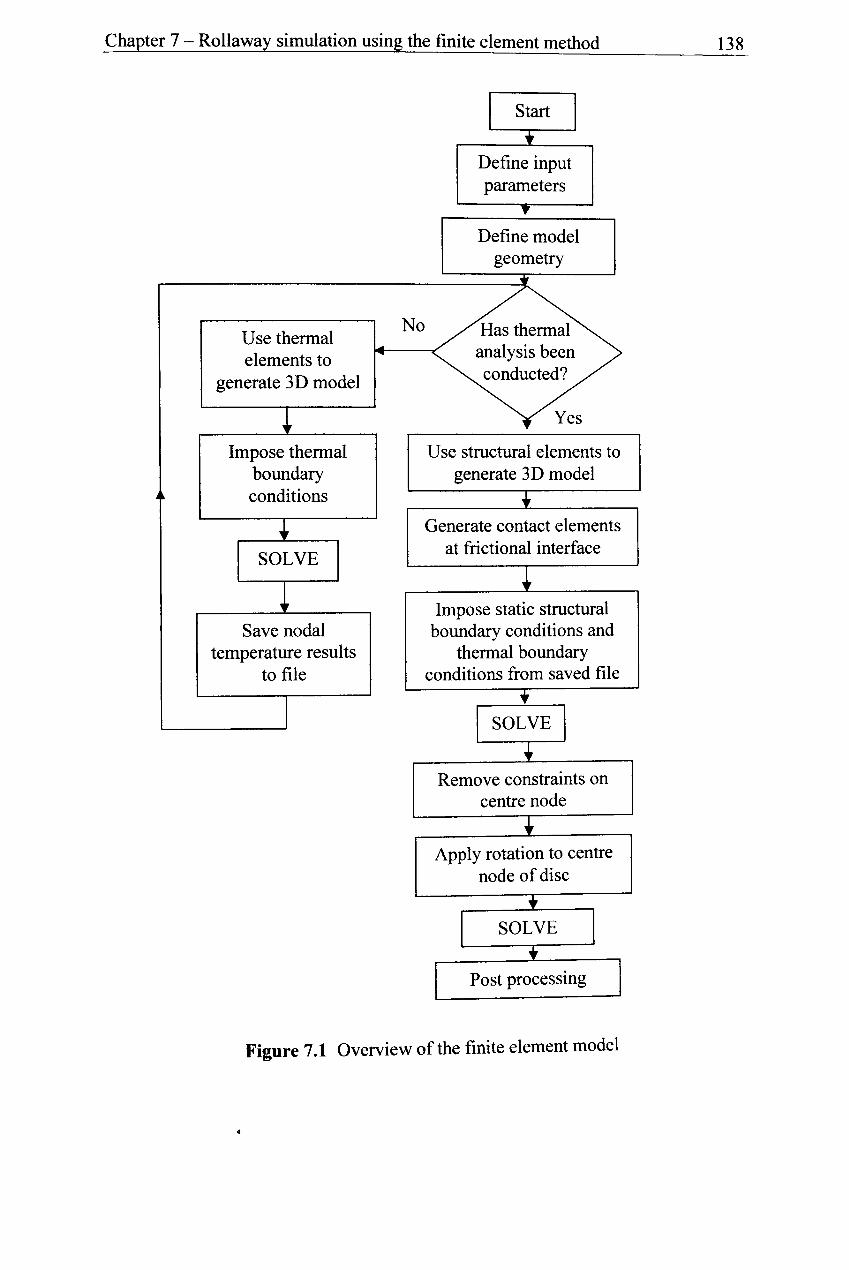
Figure 7.1 Overview of the finite element modeL ................................................ 138
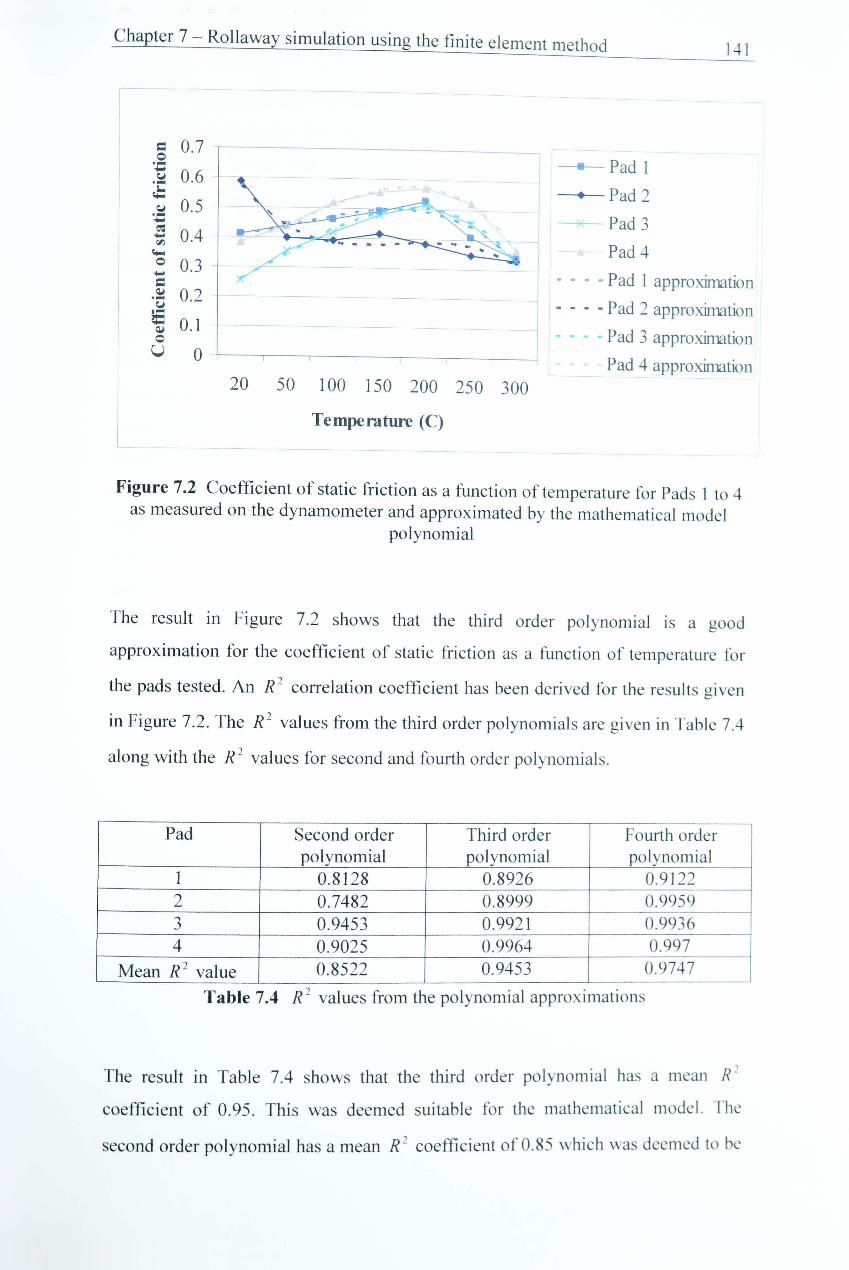
Figure 7.2 Coefficient of static friction as a function of temperature for Pads 1 to 4 as measured on the dynamometer and approximated by the mathematical model polynomial .................................................................... 141
- XllI -
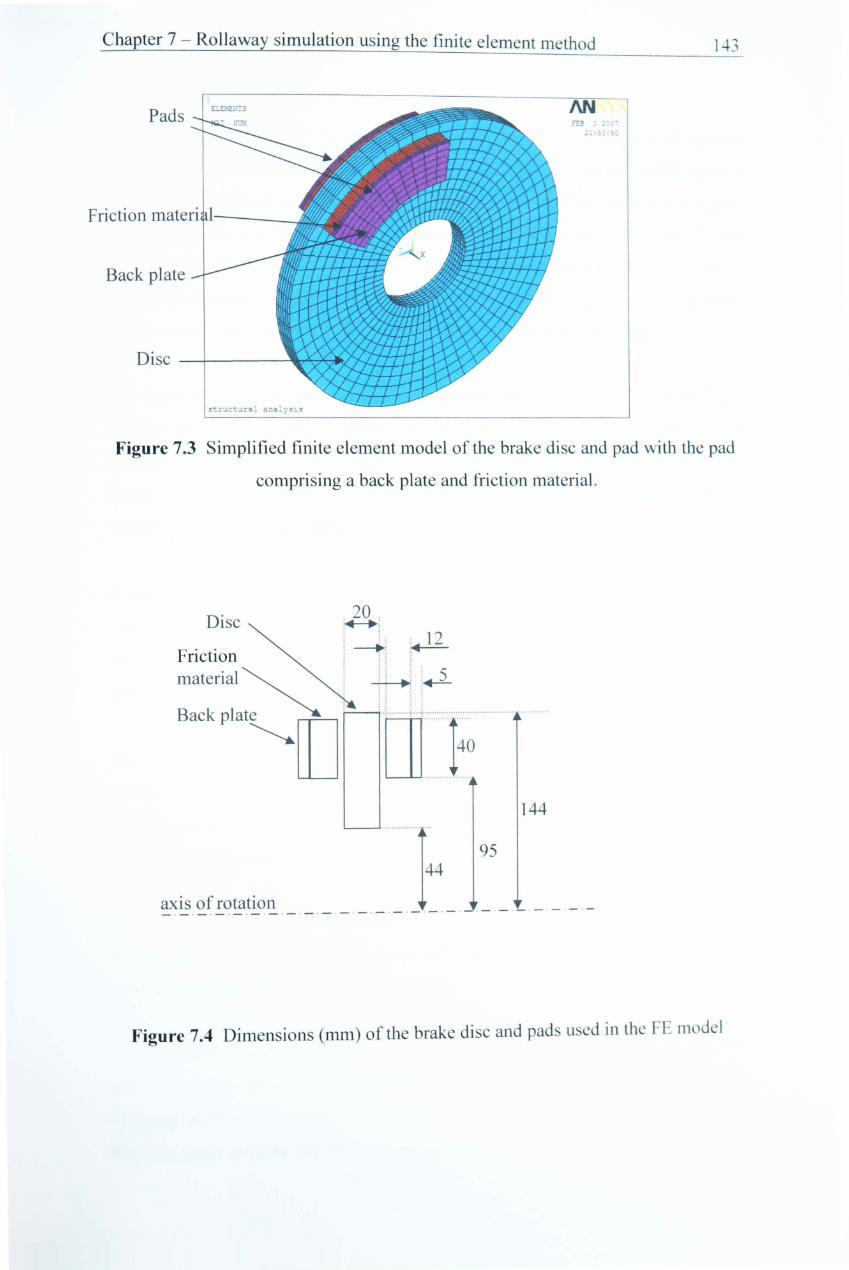
Figure 7.3 Simplified finite element modle of the brake disc and pad with the pad comprimising a back plate and friction material ..................................... 1 ... 3
Figure 7.4 Dimensions (mm) of the brake disc and pads used in the FE model ... 143
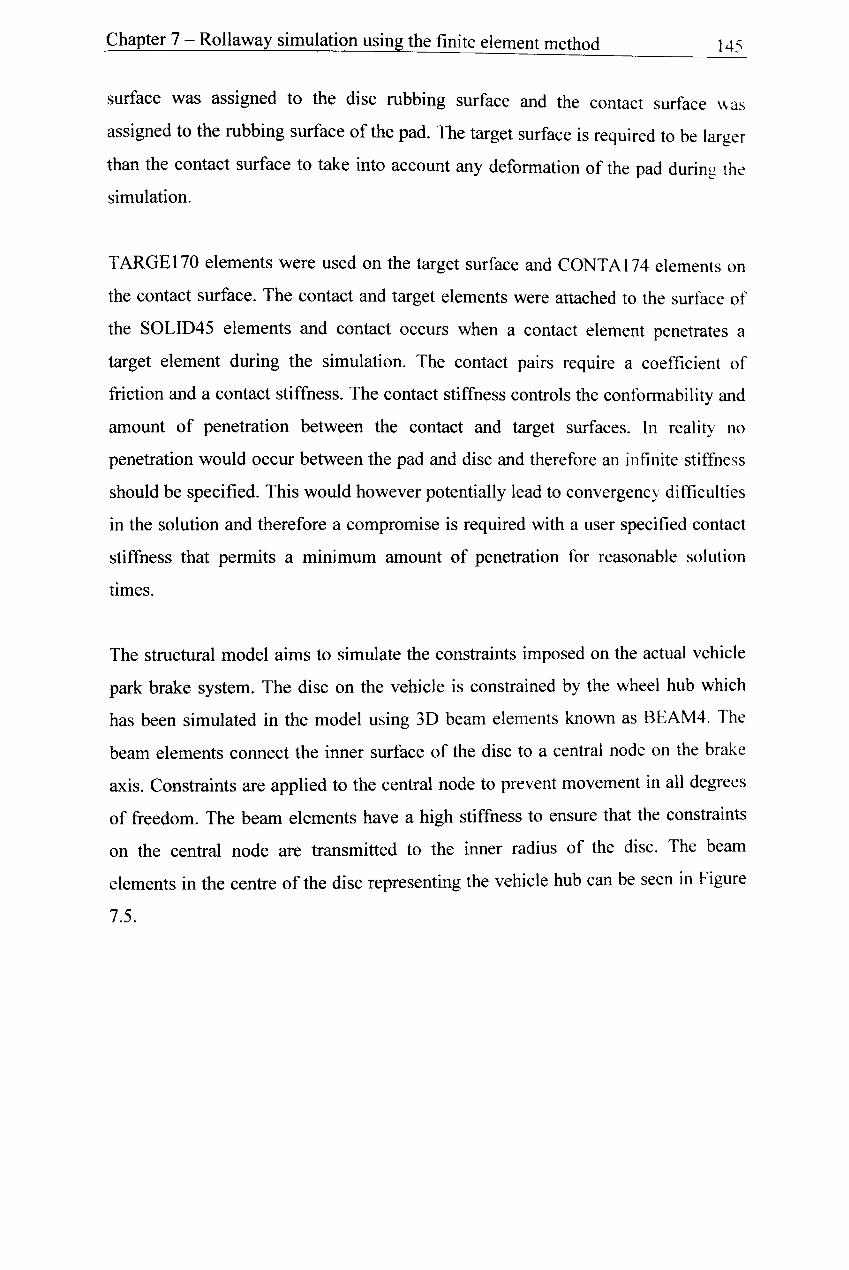
Figure 7.5 Beam elements in the centre of the disc ............................................... 146
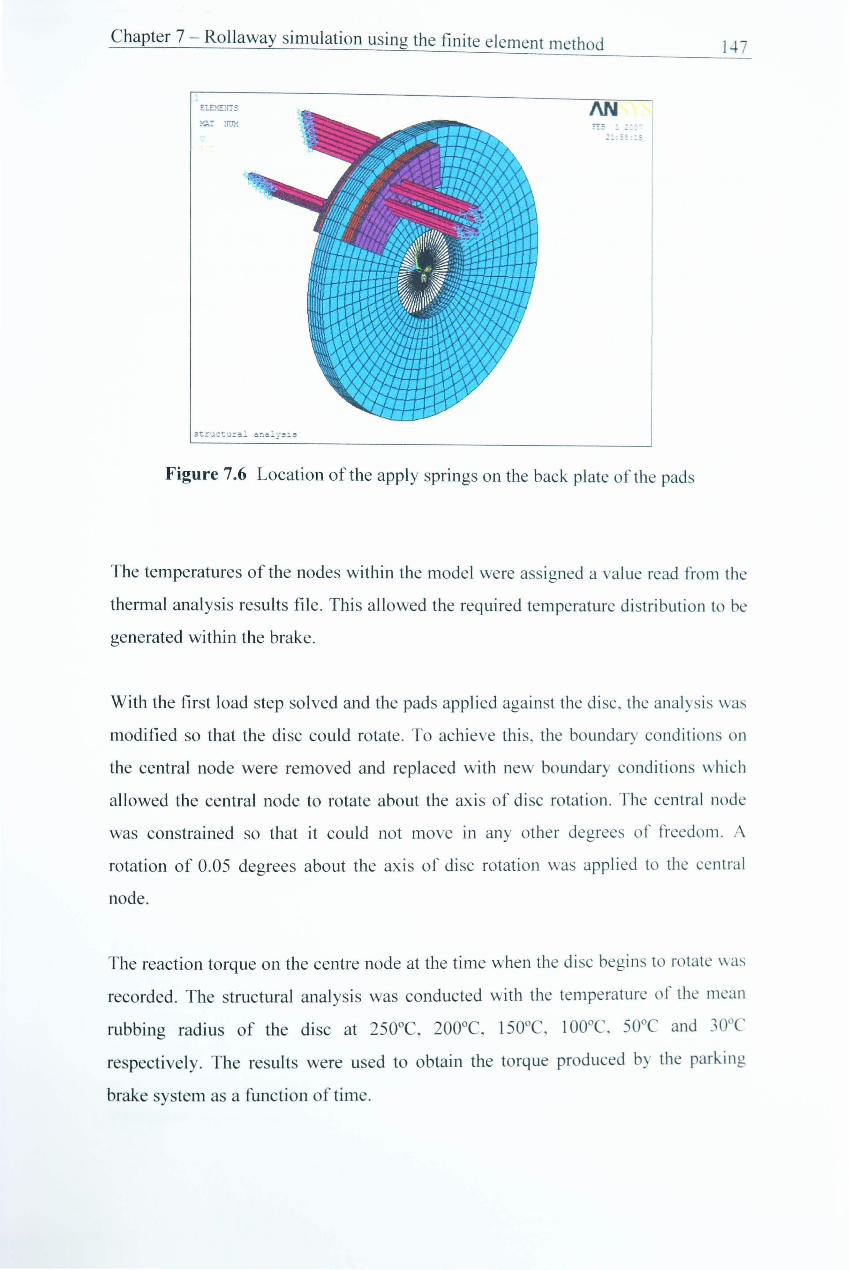
Figure 7.6 Location of the apply springs on the back plate of the pads ................ 1 ... 7
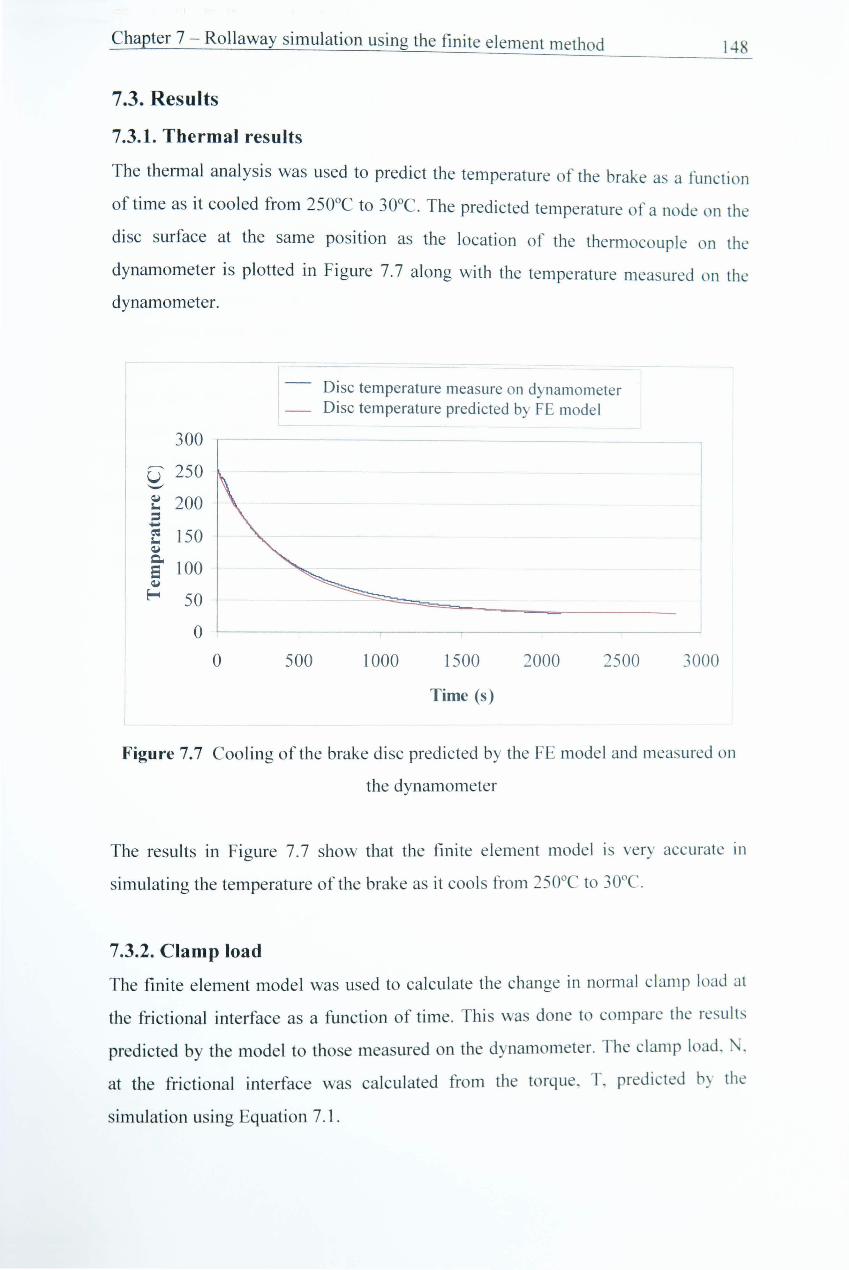
Figure 7.7 Cooling of the brake disc predicted by the FE model and measured on the dynam.ometer •..•................................................................... 148
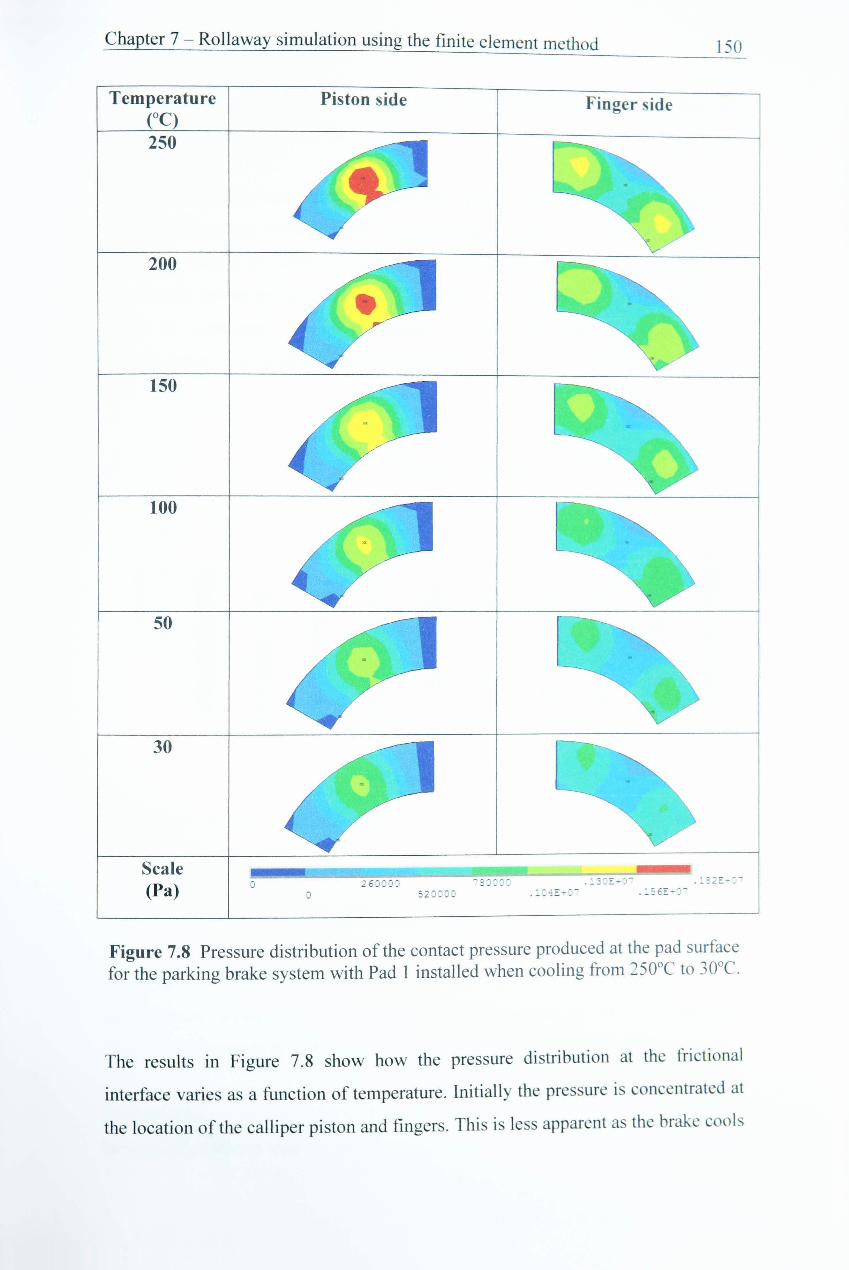
Figure 7.8 Pressure distribution of the contact pressure produced at the pad surface for the parking brake system with Pad 1 installed when cooling from 250°C to 30°C ............•••......•.....•.•.....................••.........•.••..••..•••••......•.•.. 150
Figure 7.9 Percentage of lost clamp load of Pads 1 tol0 as measured on the dynamometer and predicted by the FE model ................................................ 151
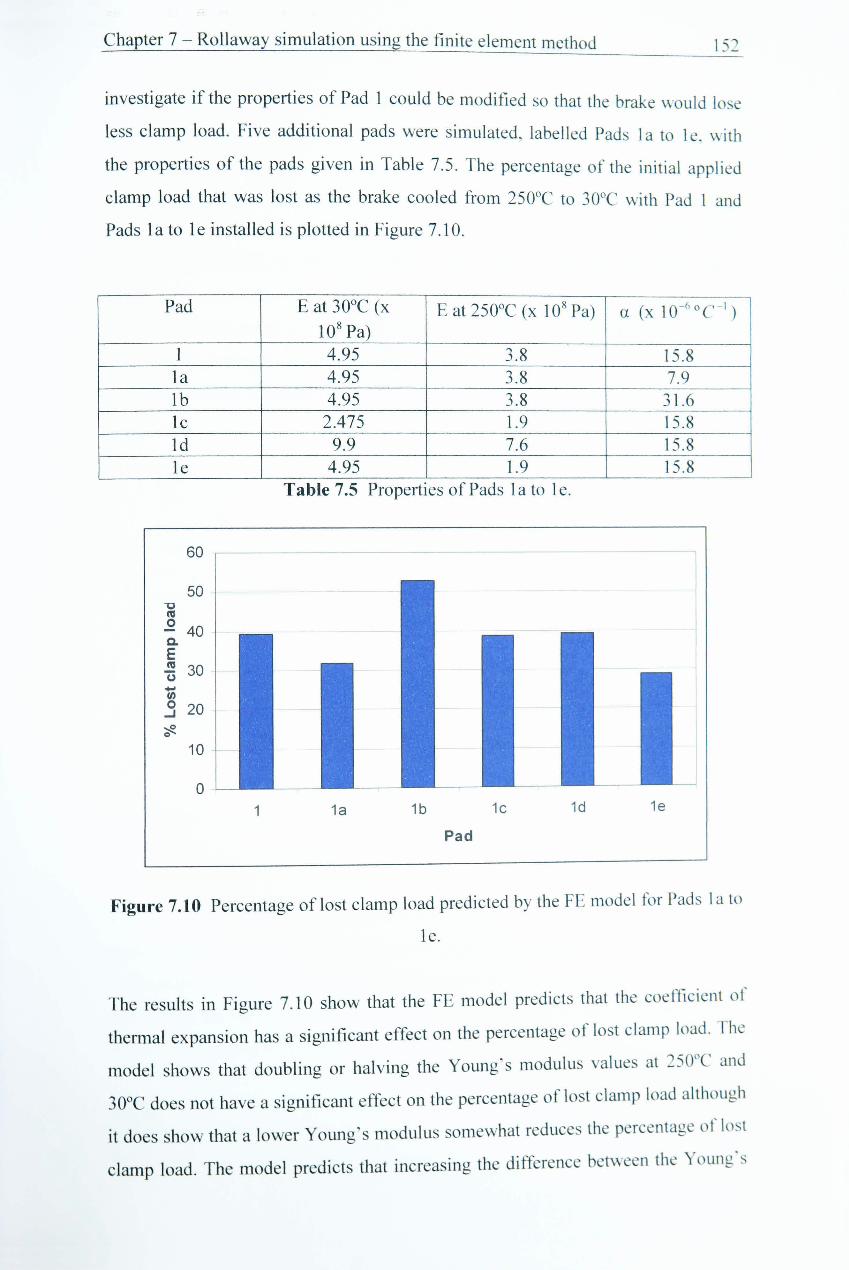
Figure 7.10 Percentage of lost clamp load predicted by the FE model for Pads la to Ie ..................•......•......................................................................... 152
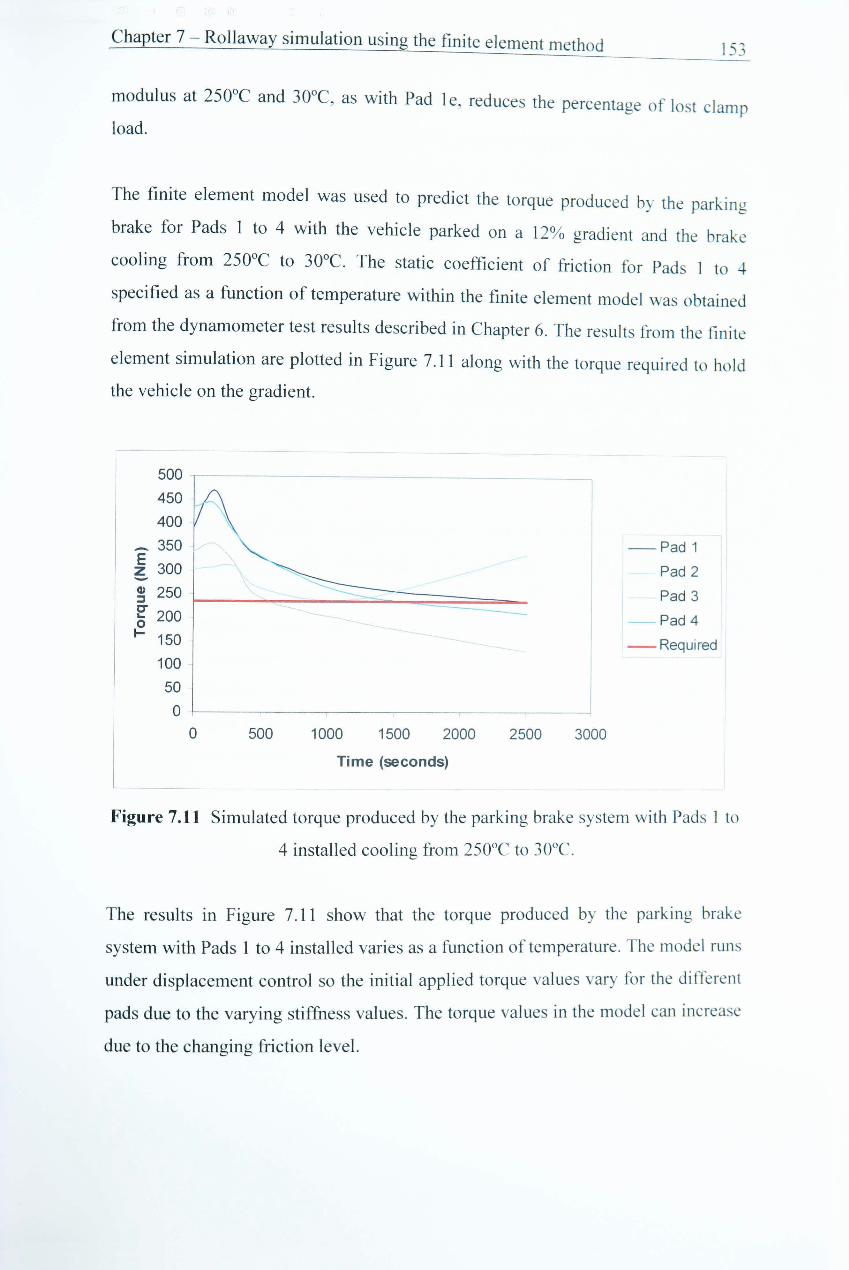
Figure 7.11 Simulated torque produced by the parking brake system with Pads 1 to 4 installed cooling from 250°C to 30°C .......................................... 153
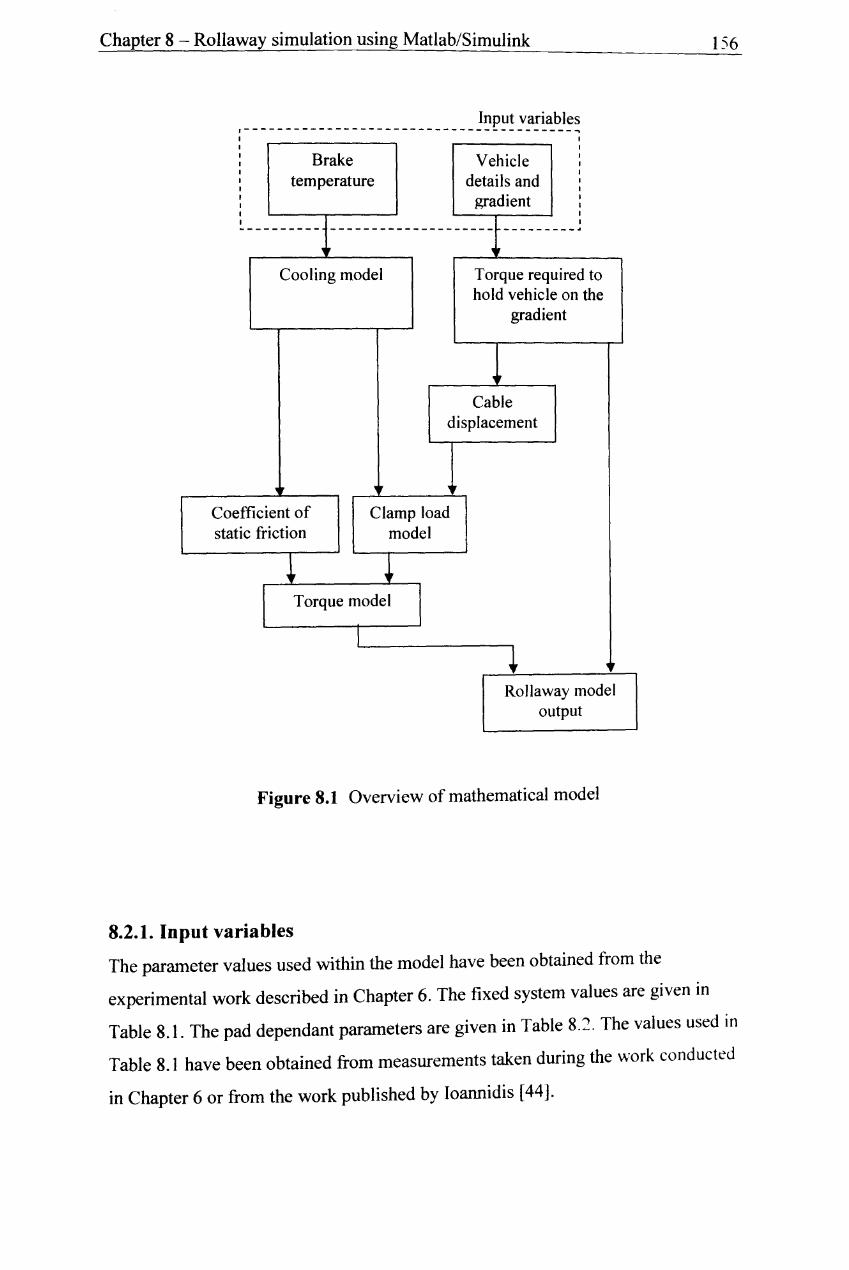
Figure 8.1 Overview of mathematical model ........................................................ 156
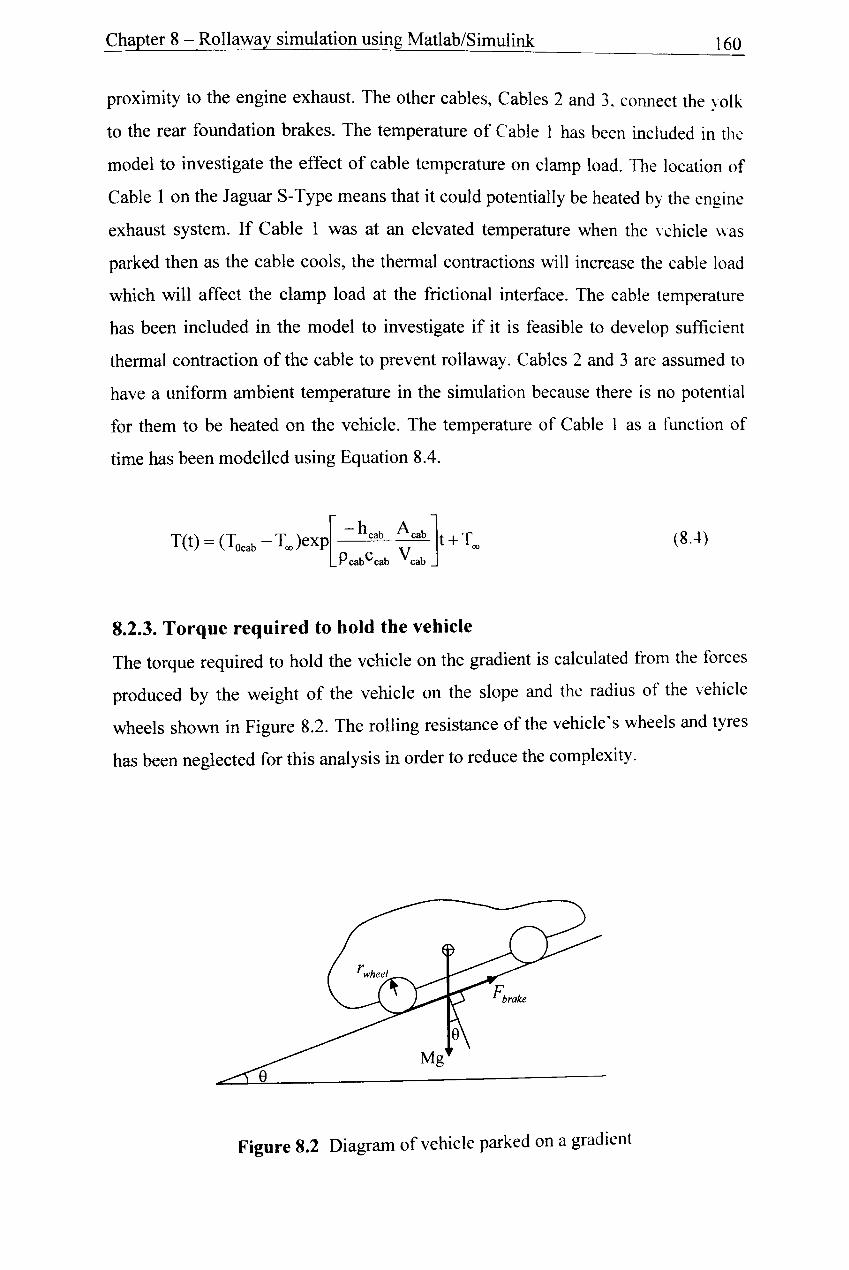
Figure 8.2 Diagram. of vehicle parked on a gradient ............................................. 160
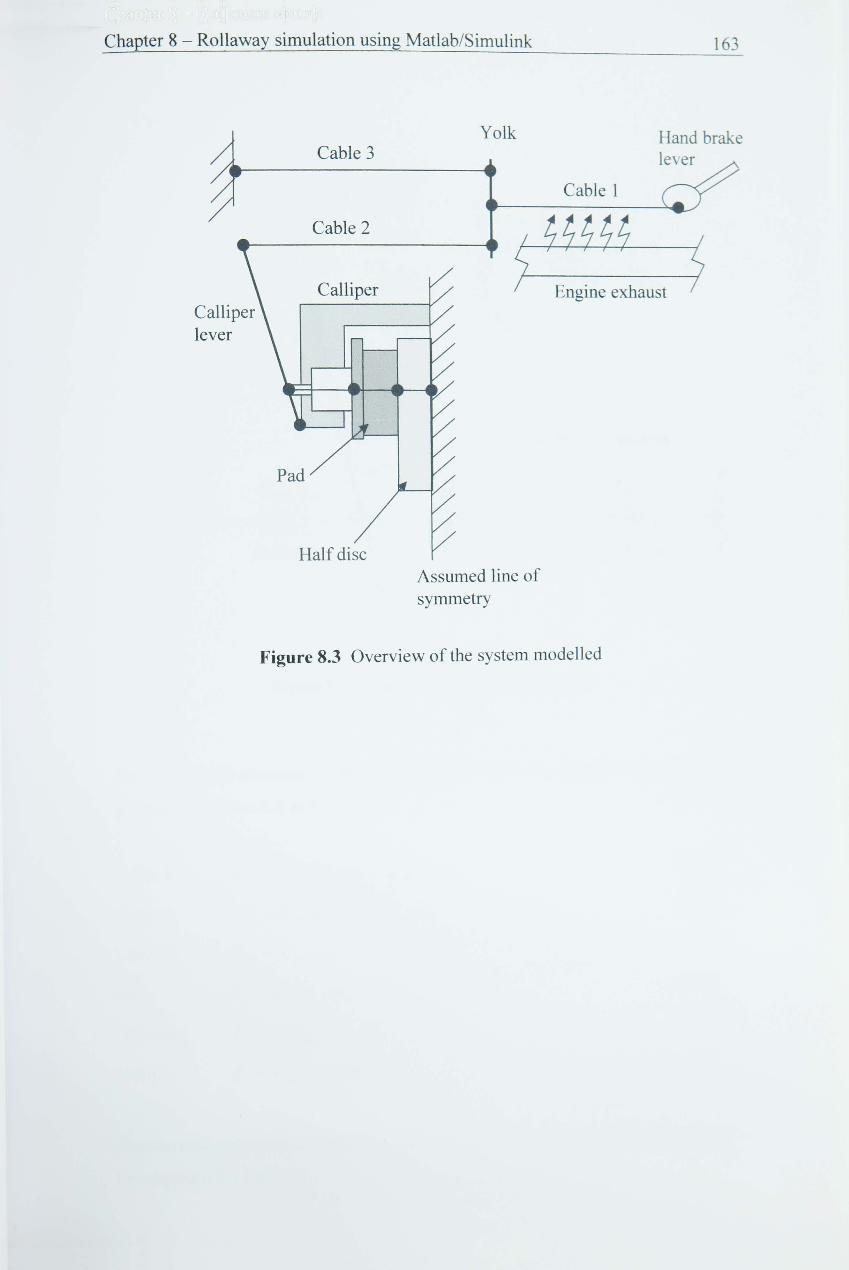
Figure 8.3 Overview of the system modelled ..............................•......................... 163
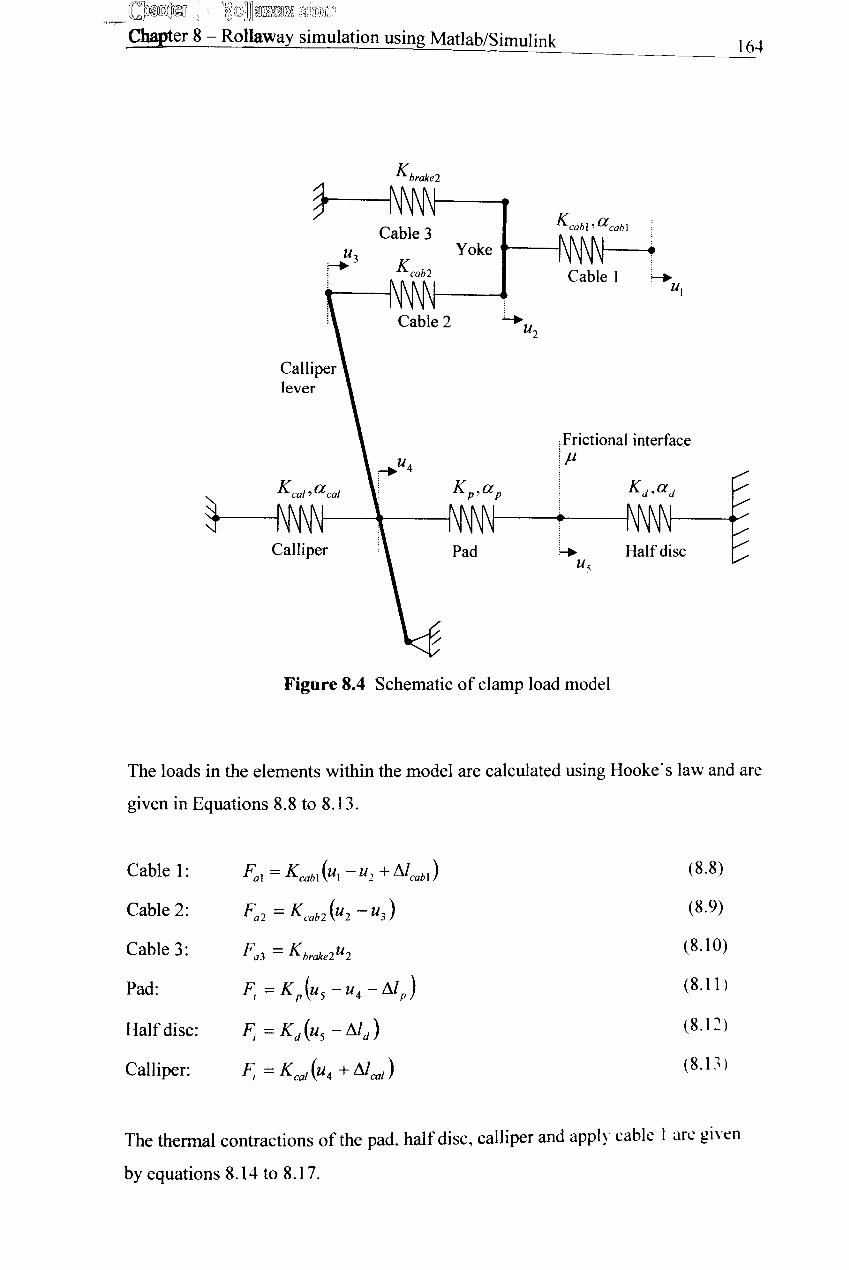
Figure 8.4 Schematic of clam.p load model ........................................................... 164
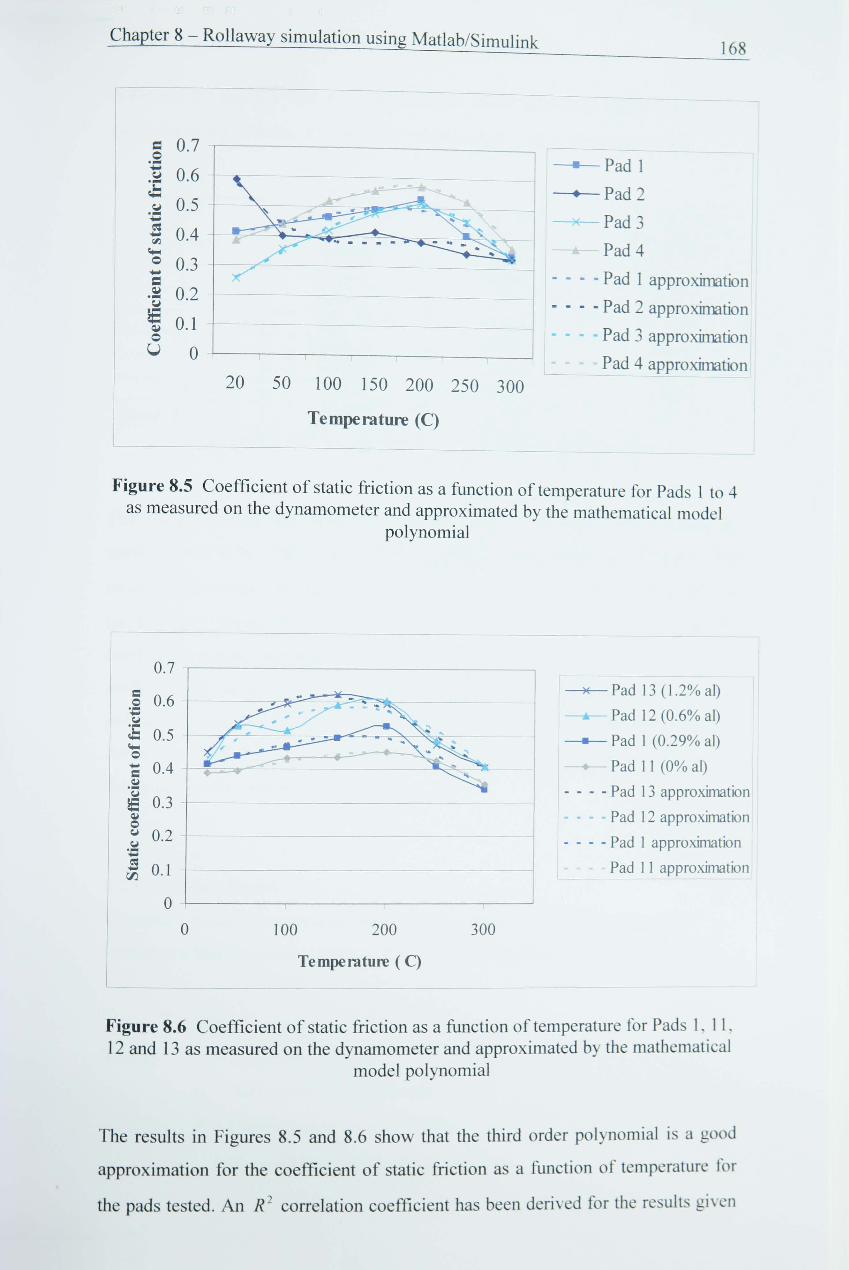
Figure 8.5 Coefficient of static friction as a function of temperature for Pads 1 to 4 as measured on the dynam.ometer and approximated by the mathematical model polynomial .........•.......................................................... 168
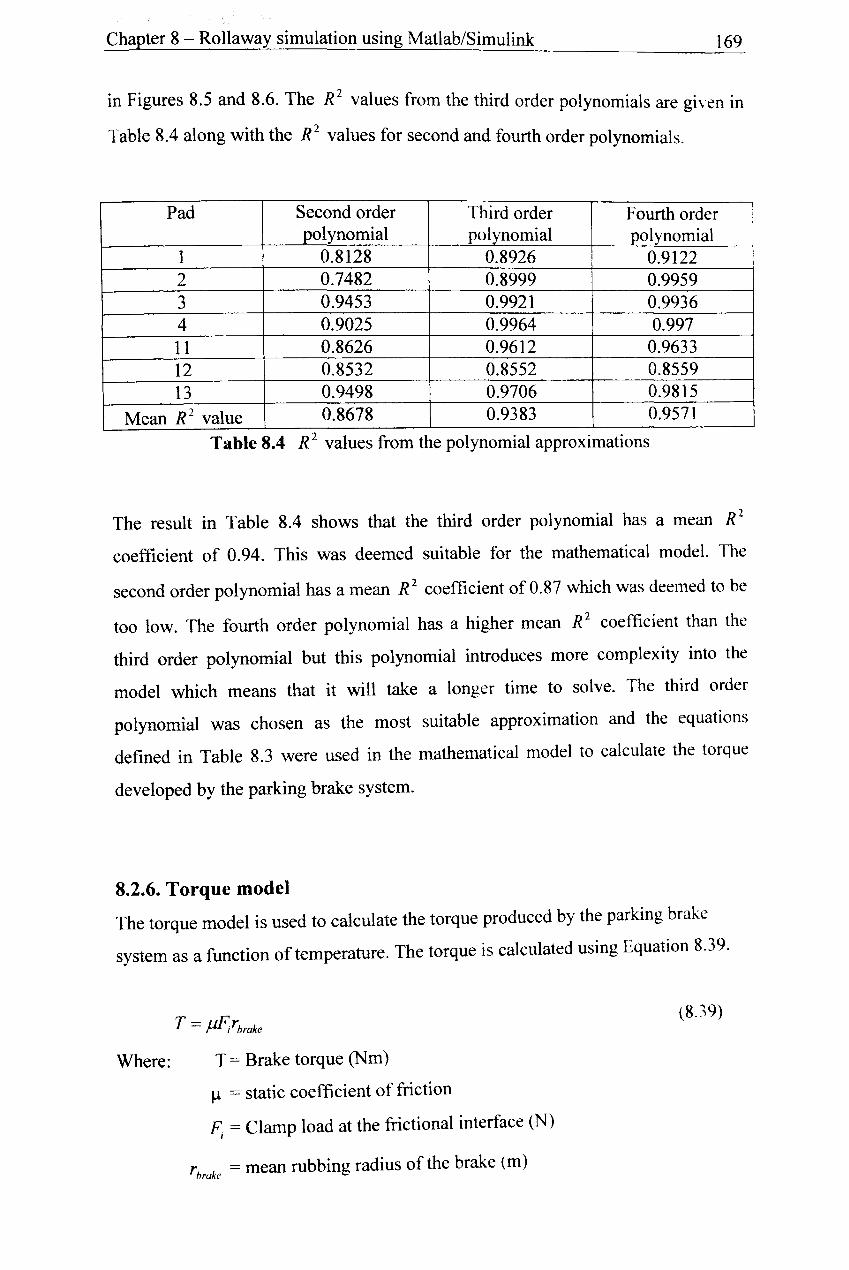
Figure 8.6 Coefficient of static friction as a function of temperature for Pads 1, 11, 12 and 13 as measured on the dynam.ometer and approximated by the mathematical model polynomial .............................................................. 168
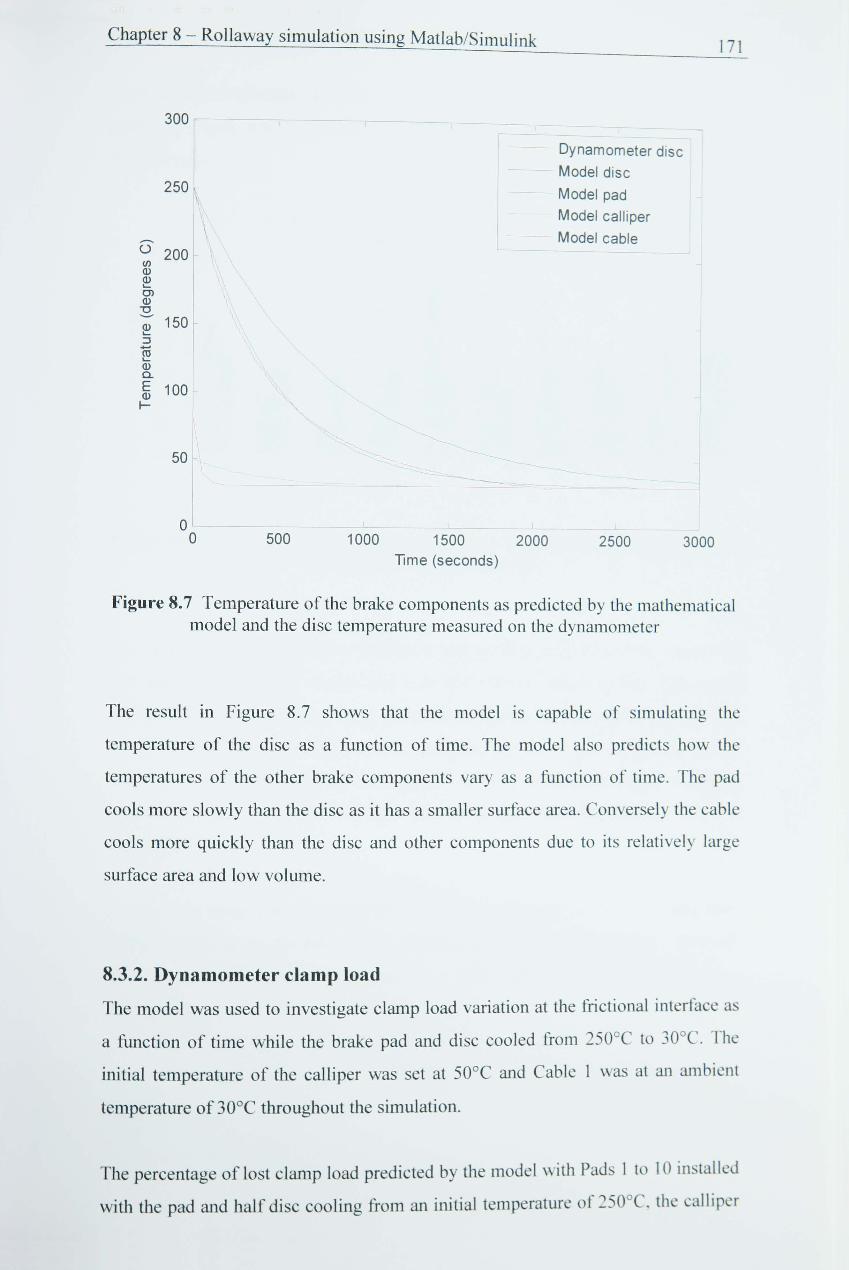
Figure 8.7 Temperature of the brake components as predicted by the mathematical model and the disc temperature measured on the dynam.ometer ....••.....................•...................................................................... 171
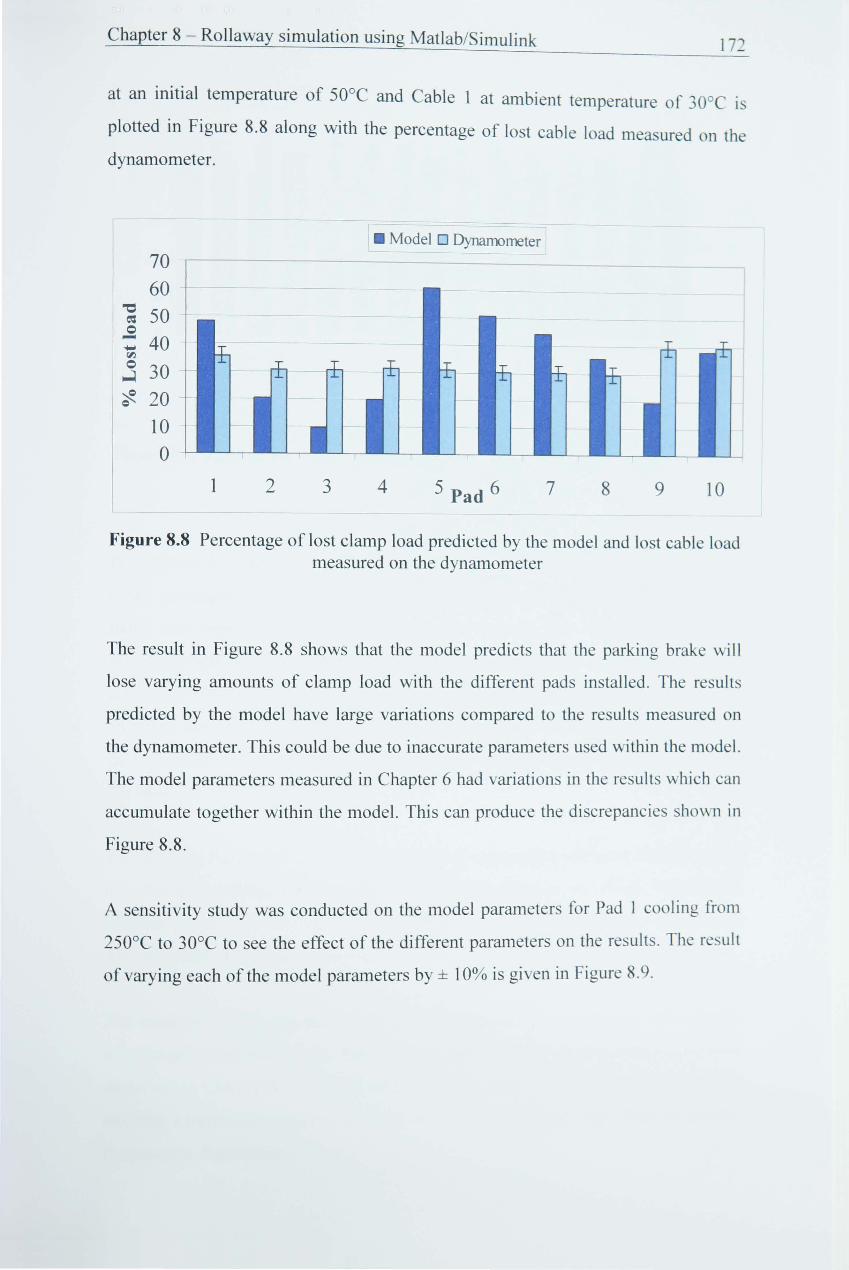
Figure 8.8 Percentage of lost clam.p load predicted by the model and lost cable load measured on the dynamometer ..................................................... 172
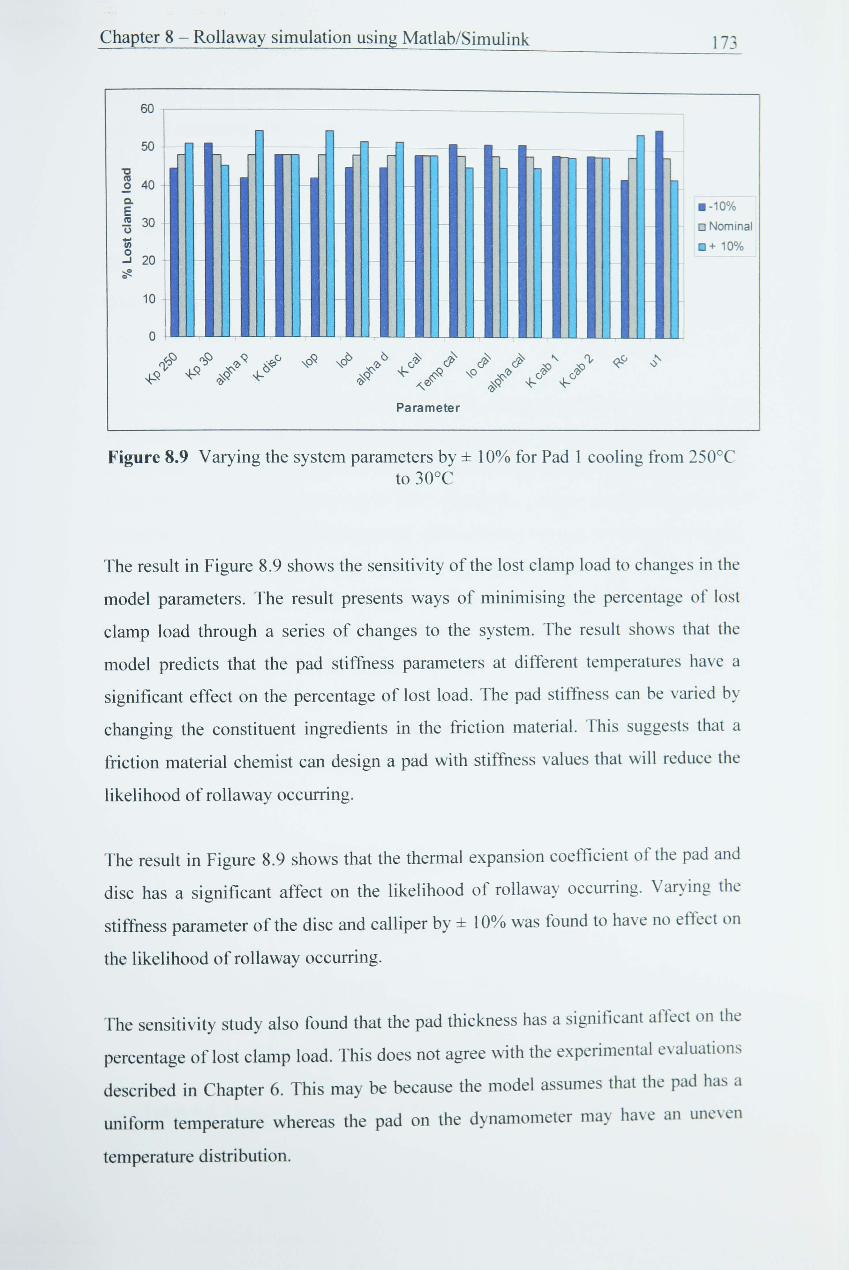
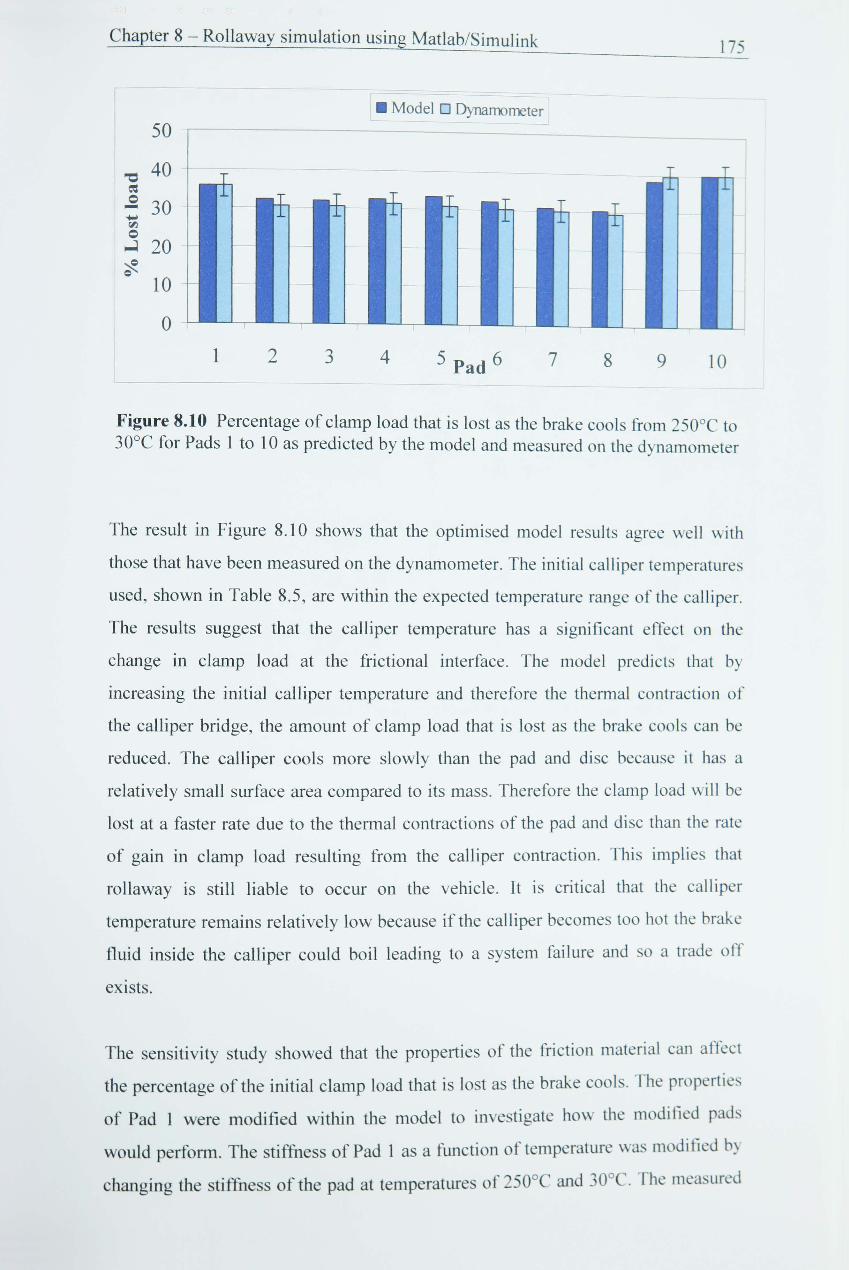
Figure 8.9 Varying the system param.eters by ± 10% for Pad 1 cooling from 250°C to 30°C .....•.•.....••......••.....•••••••..•••.•..•.•.••.••..•...•....•......•..•.....................• 173
Figure 8.10 Percentage of clam.p load that is lost as the brake cools from 250°C to 30°C for Pads 1 to 10 as predicted by the model and measured on the dynam.ometer ....................................................................................... 175
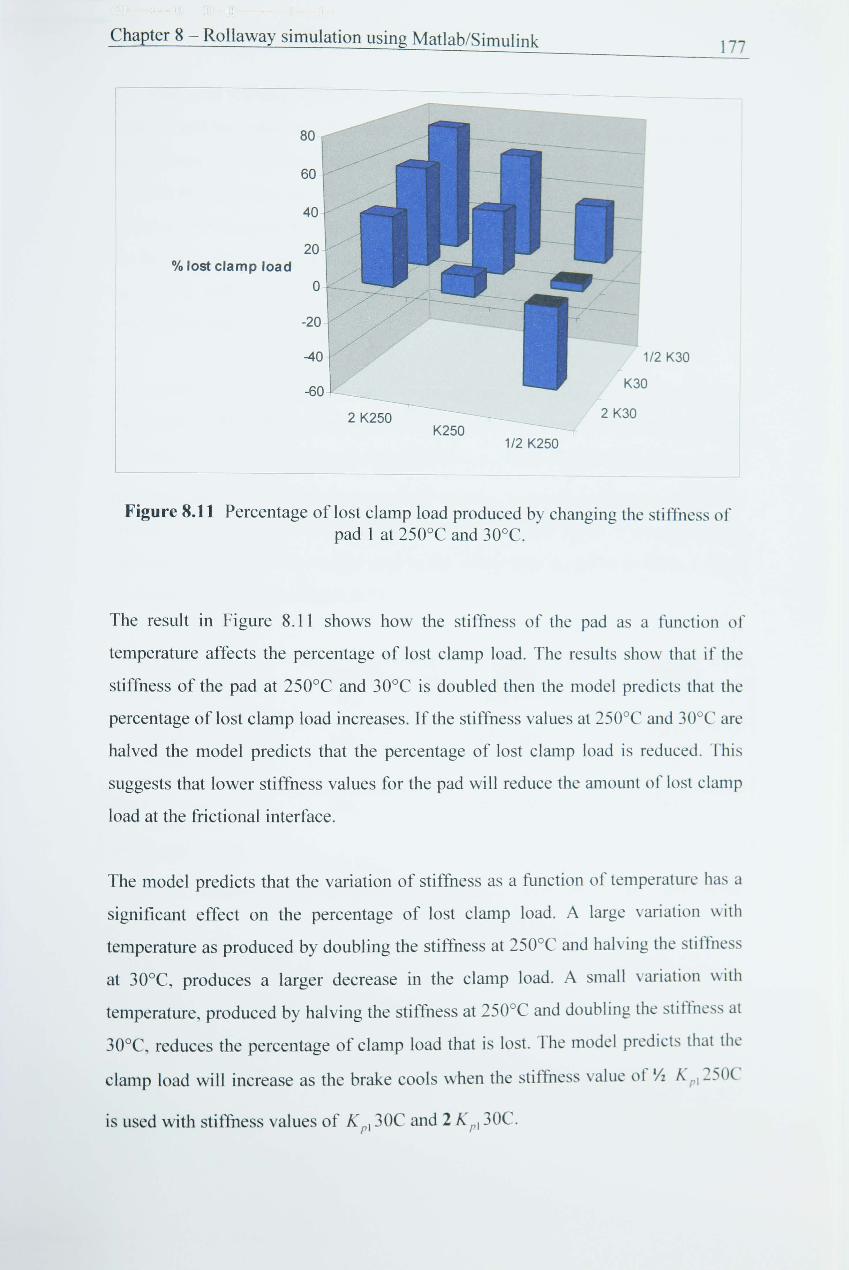
Figure 8.11 Percentage of lost clam.p load produced by changing the stiffness of Pad 1 at 250°C and 30°C ...•...•..........•.............•...........•............•.................. t 77
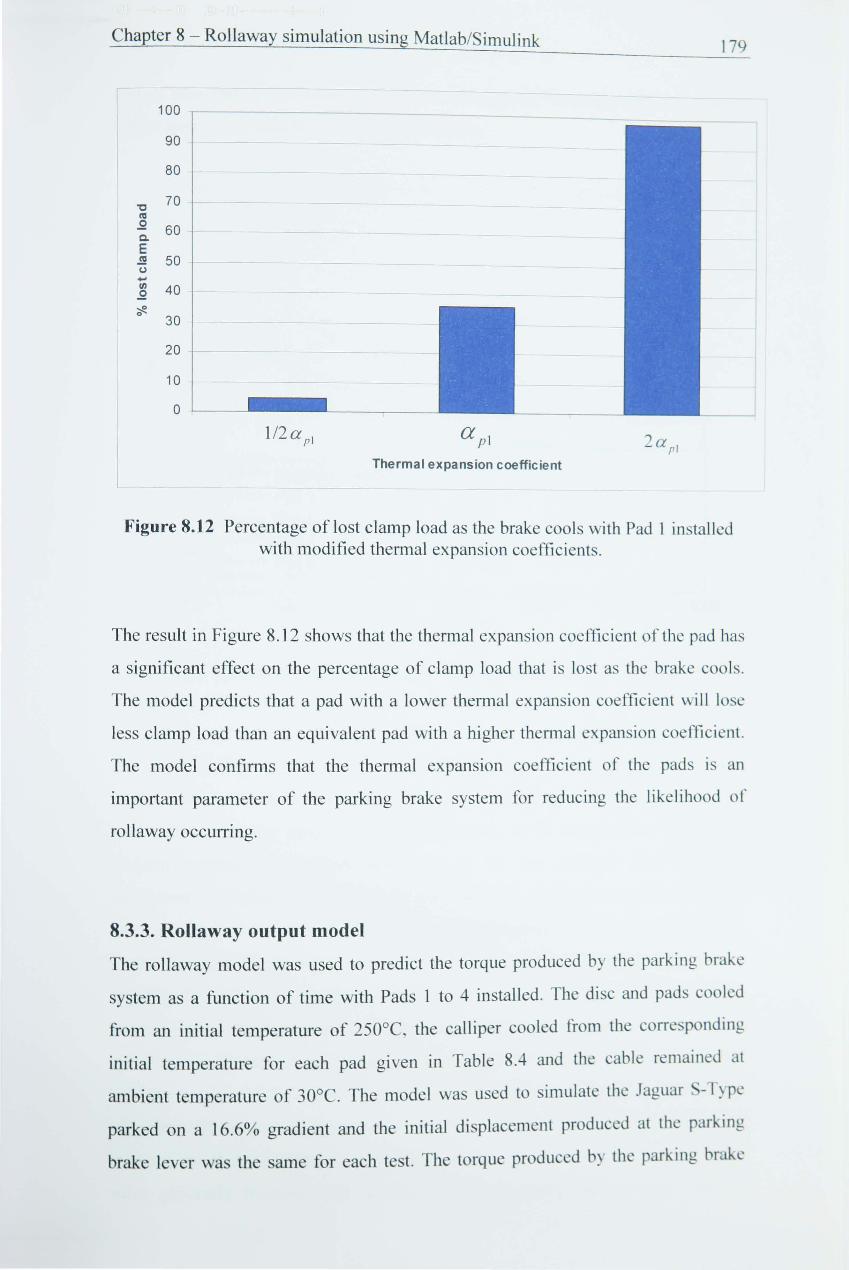
Figure 8.12 Percentage of lost clam.p load as the brake cools with Pad 1 installed with modified thermal expansion coefficients ................................. 179
- XIV-
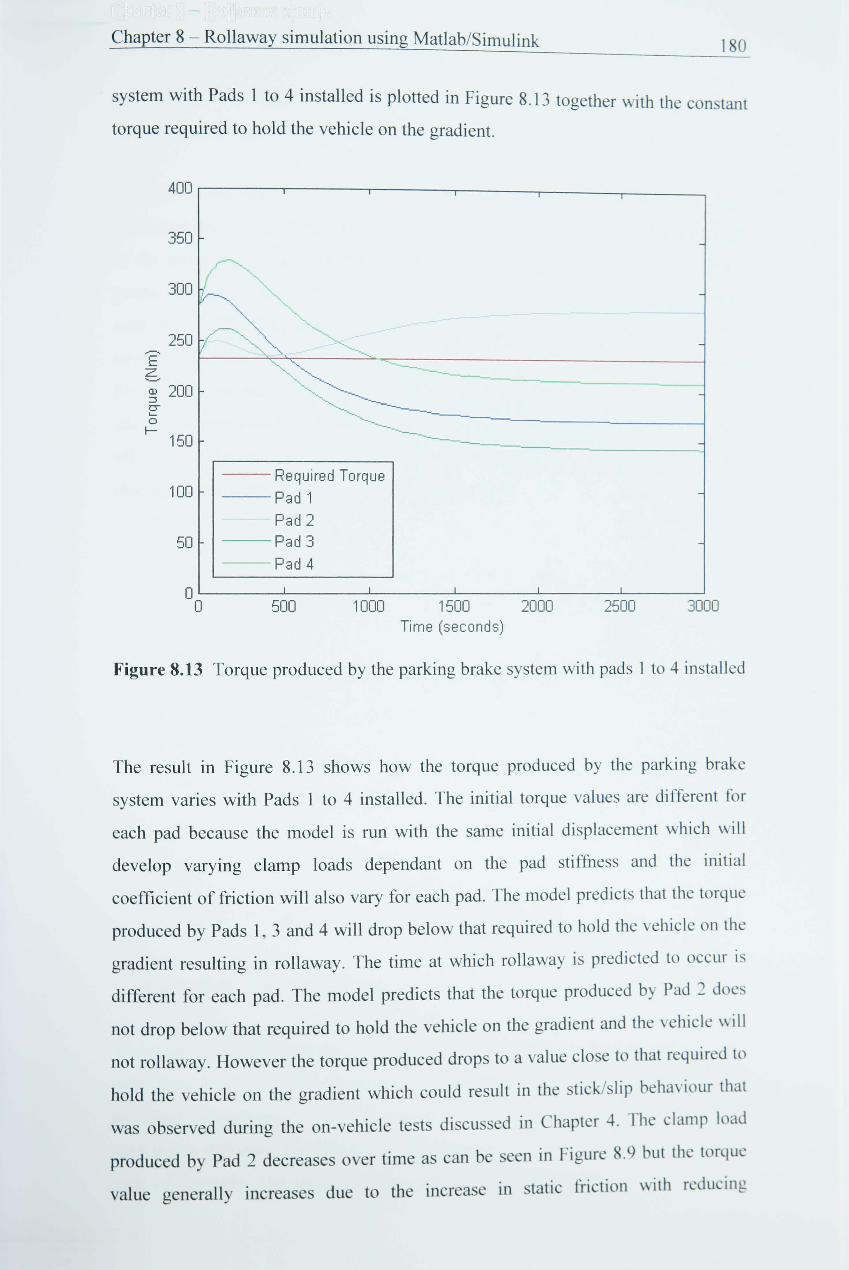
Figure 8.13 Torque produced by the parking brake system with Pads 1 to 4 installed .•..................................................................................•..................... 180
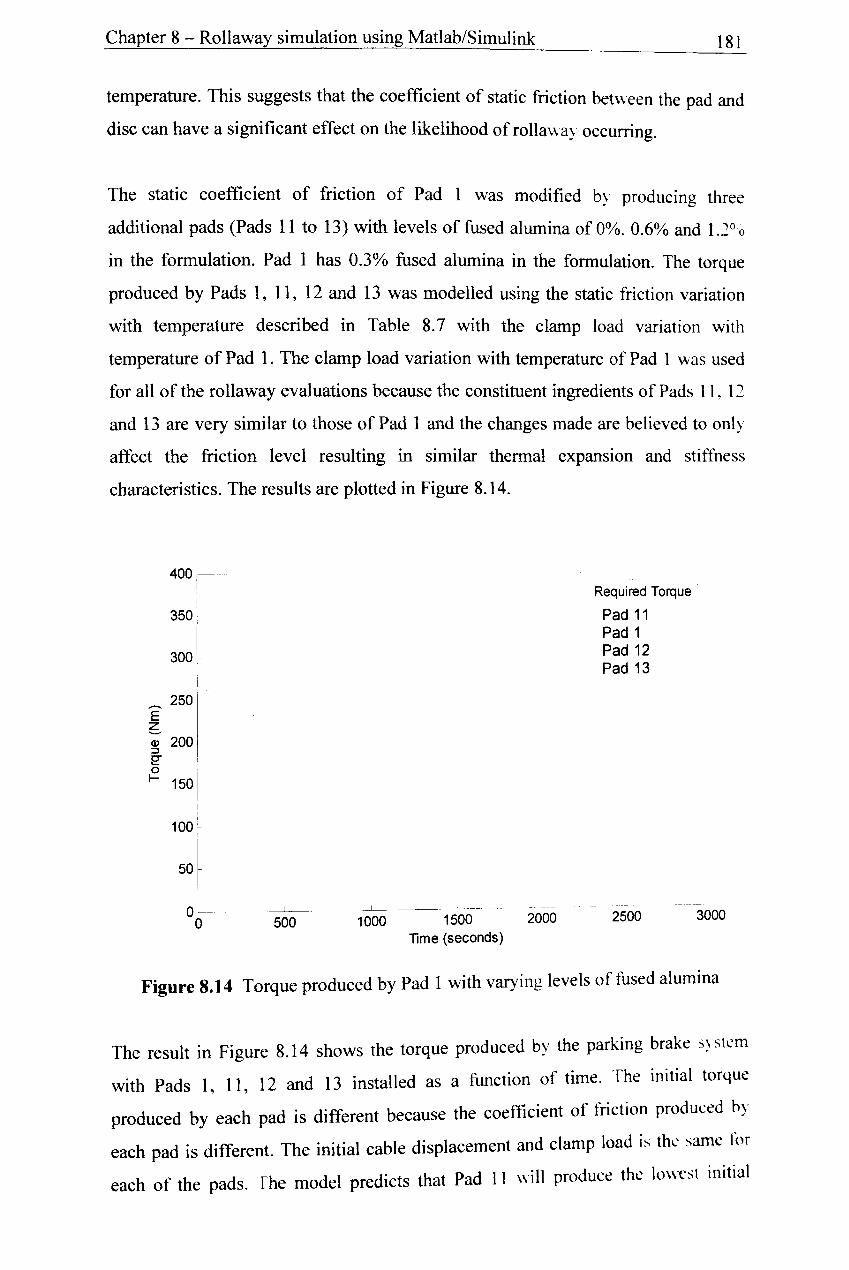
Figure 8.14 Torque produced by Pad 1 with varying levels of fused alumina ...... 181
Figure 8.15 Clamp load produced by Pad 1 with cable at varying initial temperatures ................••......................................•.......................................... 183
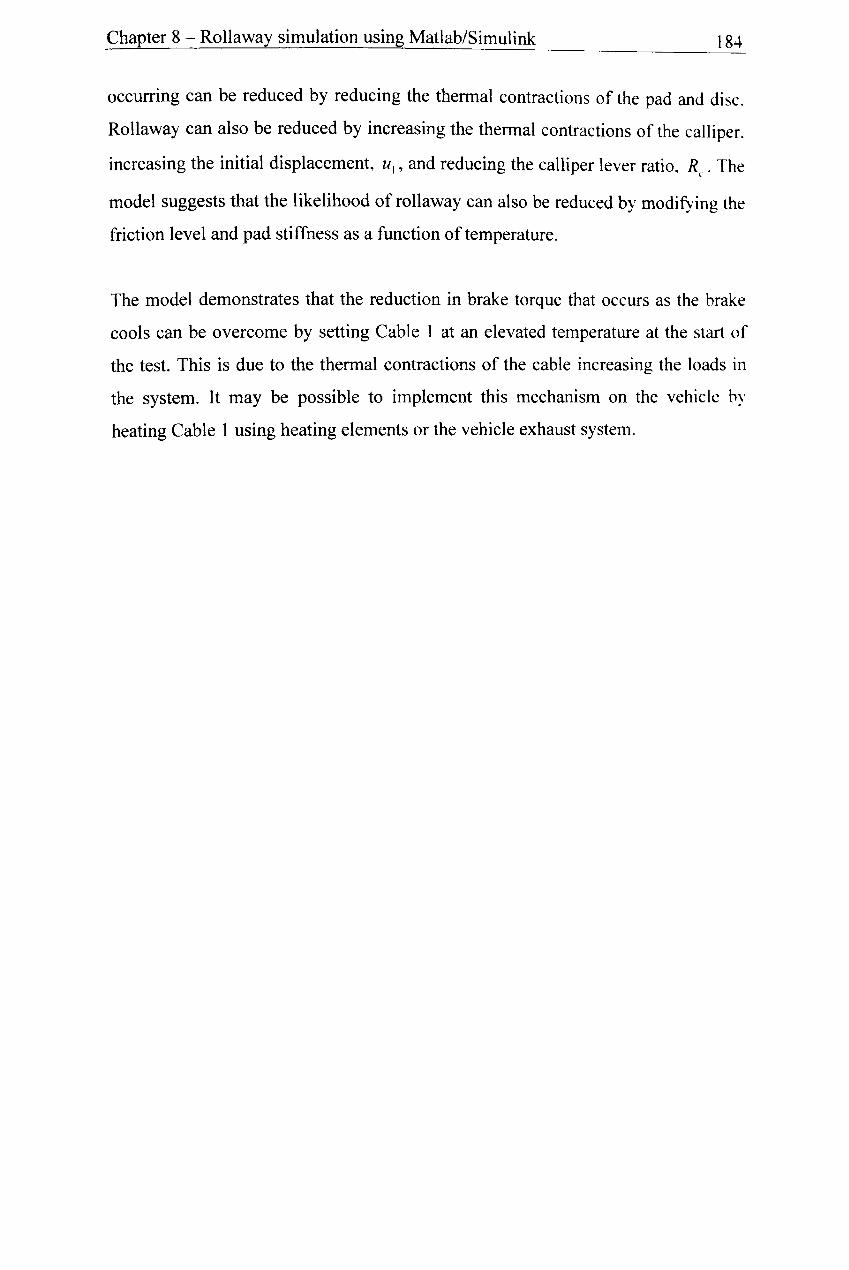
Figure 9.1 Frictional interface during stick slip event before cooling .................. 186
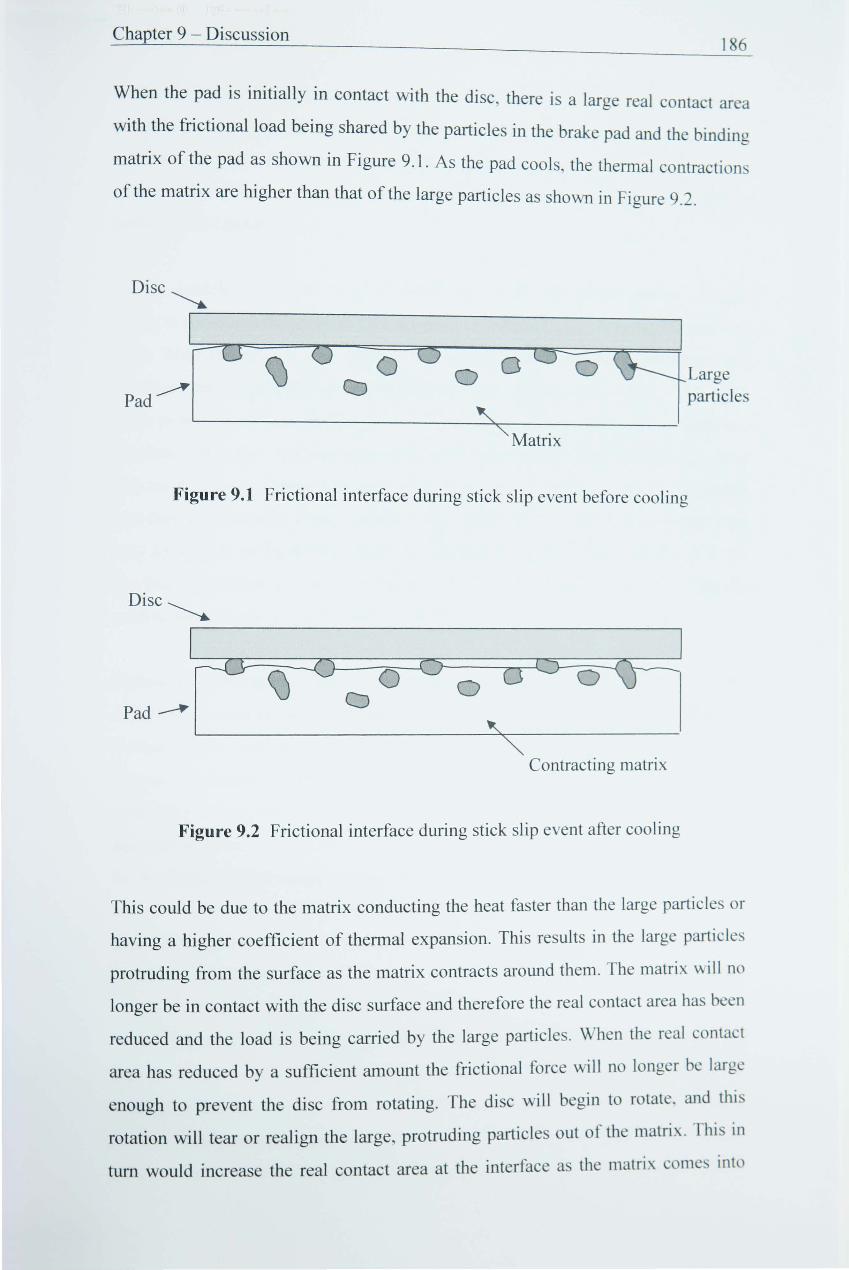
Figure 9.2 Frictional interface during stick slip event after cooling ..................... 186
Tables
Table 4.1 Details of the callipers used in the research •........................................... 45
Table 4.2 Description of the on-vehicle results ............................................•.......... 49
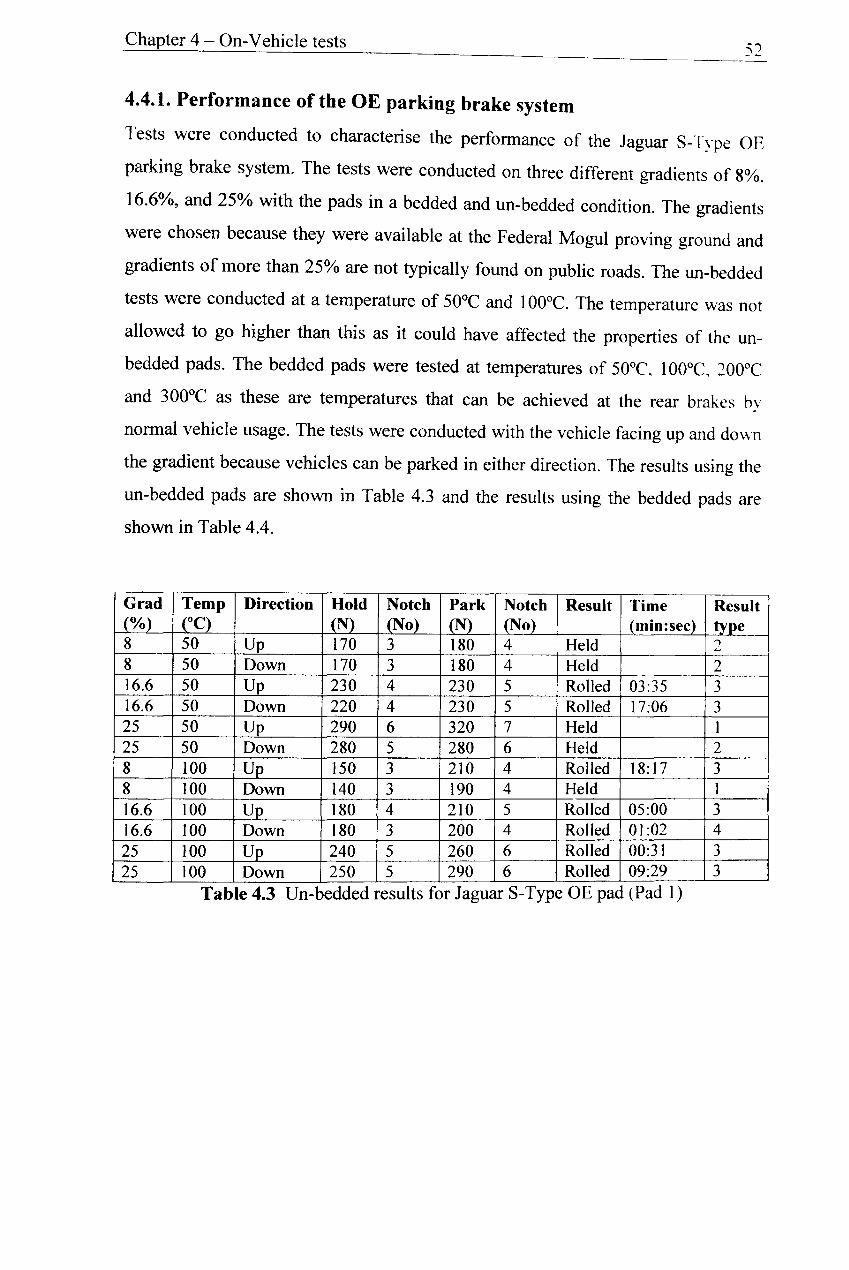
Table 4.3 Un-bedded results for Jaguar S-Type OE pad (Pad 1) ............................ 52
Table 4.4 Bedded results for Jaguar S-Type OE pad (Pad 1) ..•....•........•..........•...... 53
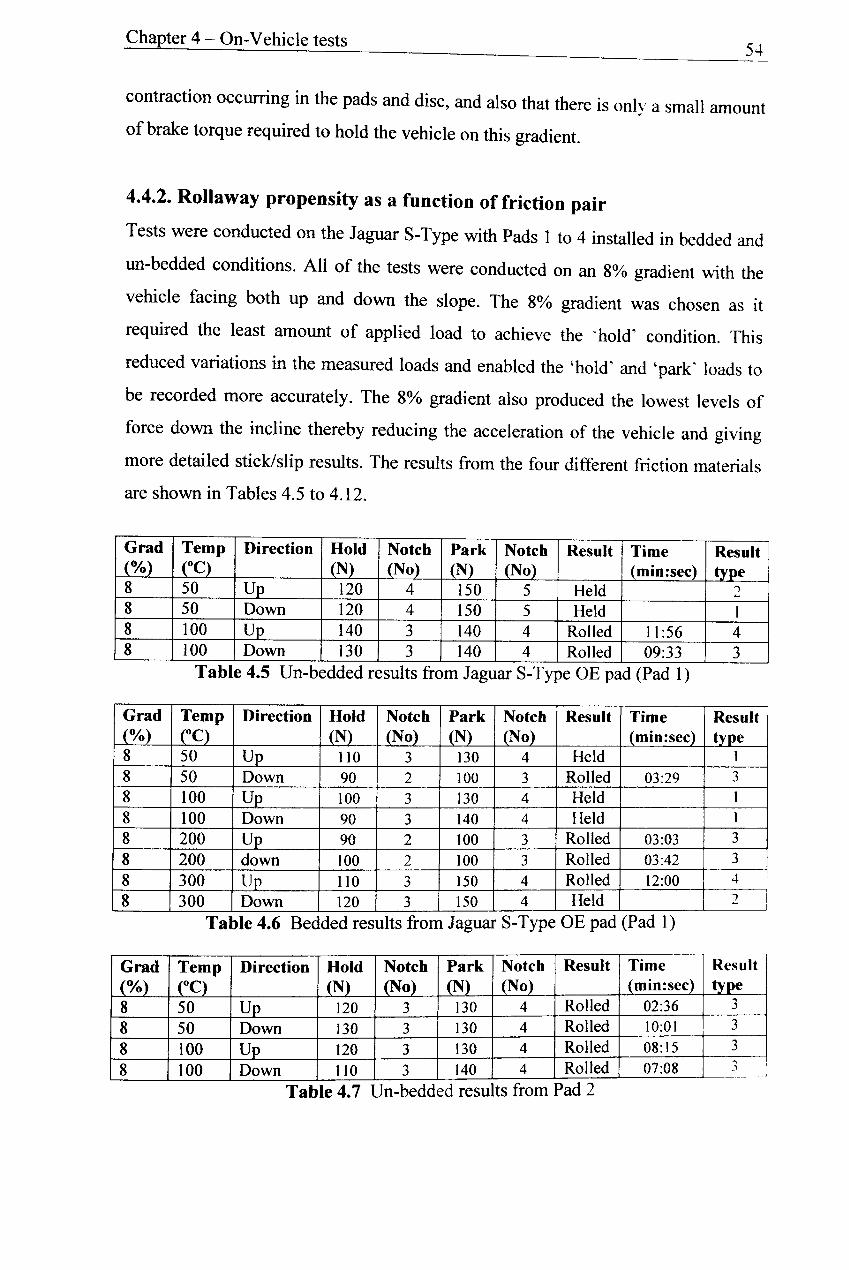
Table 4.5 Un-bedded results from Jaguar S-Type OE pad (Pad 1) ......................... 54
Table 4.6 Bedded results from Jaguar S-Type OE pad (Pad I) ............................... 54
Table 4.7 Un-bedded results from Pad 2 ................................................................. 54
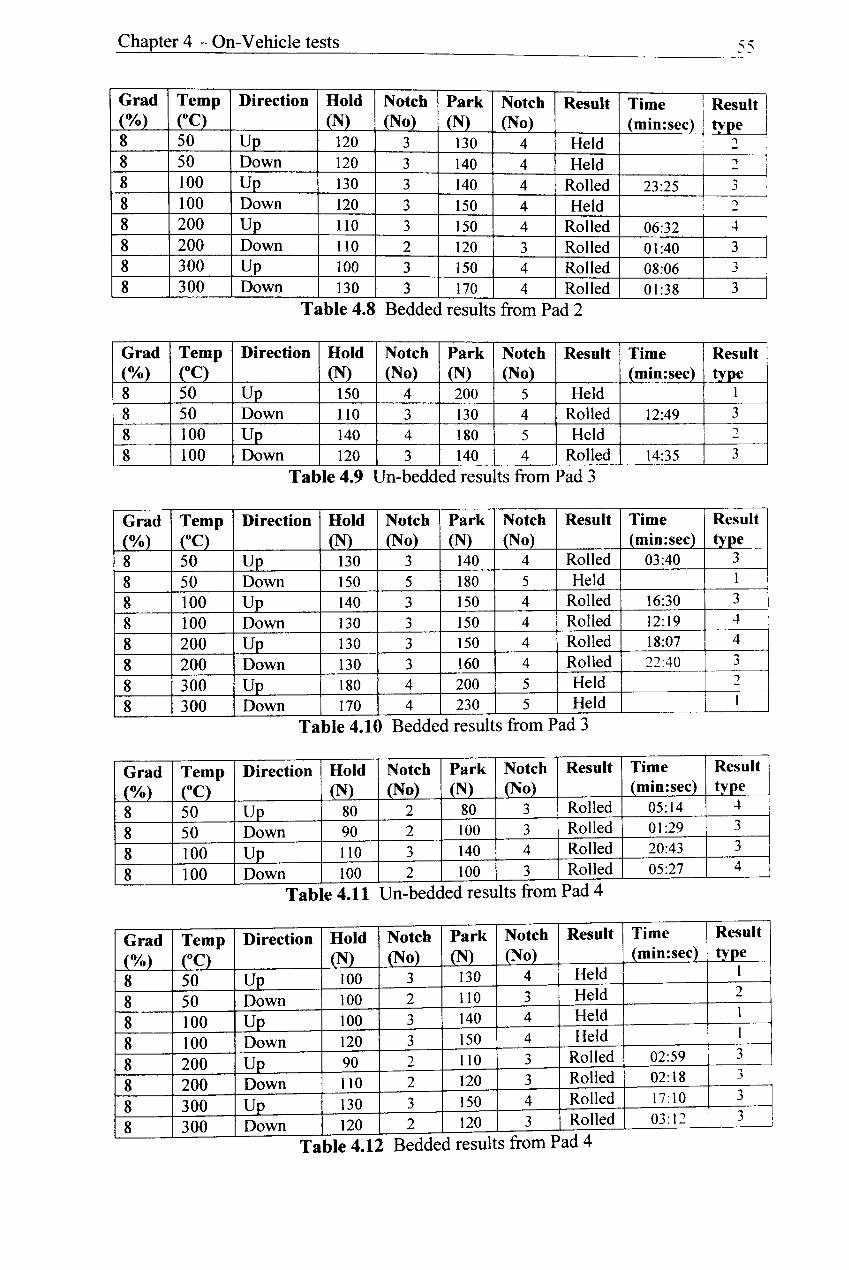
Table 4.8 Bedded results from Pad 2 .....•................................................................. 55
Table 4.9 Un-bedded results from Pad 3 ................................................................. 55
Table 4.10 Bedded results from Pad 3 .........................•.............•.....................•....... 55
Table 4.11 Un-bedded results from Pad 4 ............................................................... 55
Table 4.12 Bedded results from Pad 4 ••••••.•••••••.•••••••••••••..•..•..•••..••••..•••••••.•••••.••••..•. 55
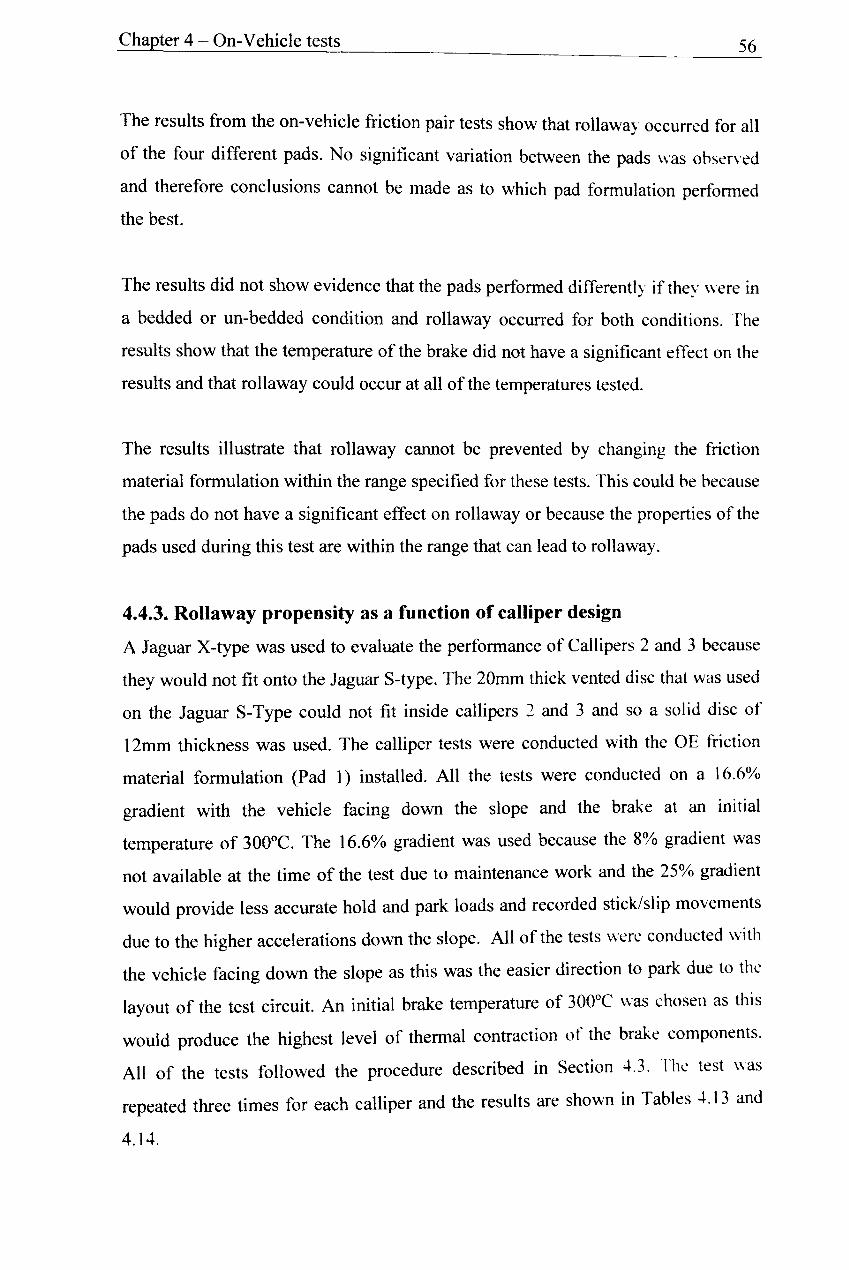
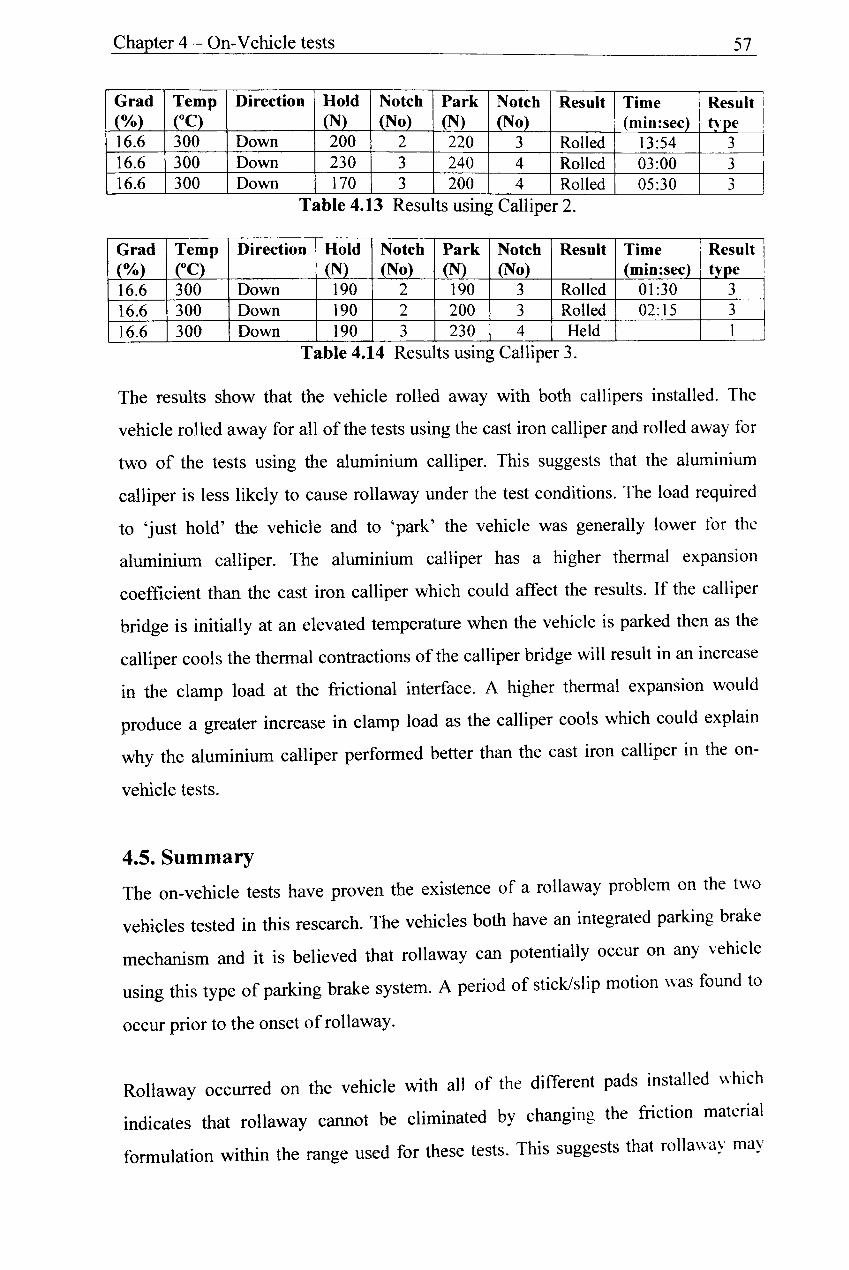
Table 4.13 Results using Calliper 2 .......................................................................... 57
Table 4.14 Results using Calliper 3 ......................................................................... 57
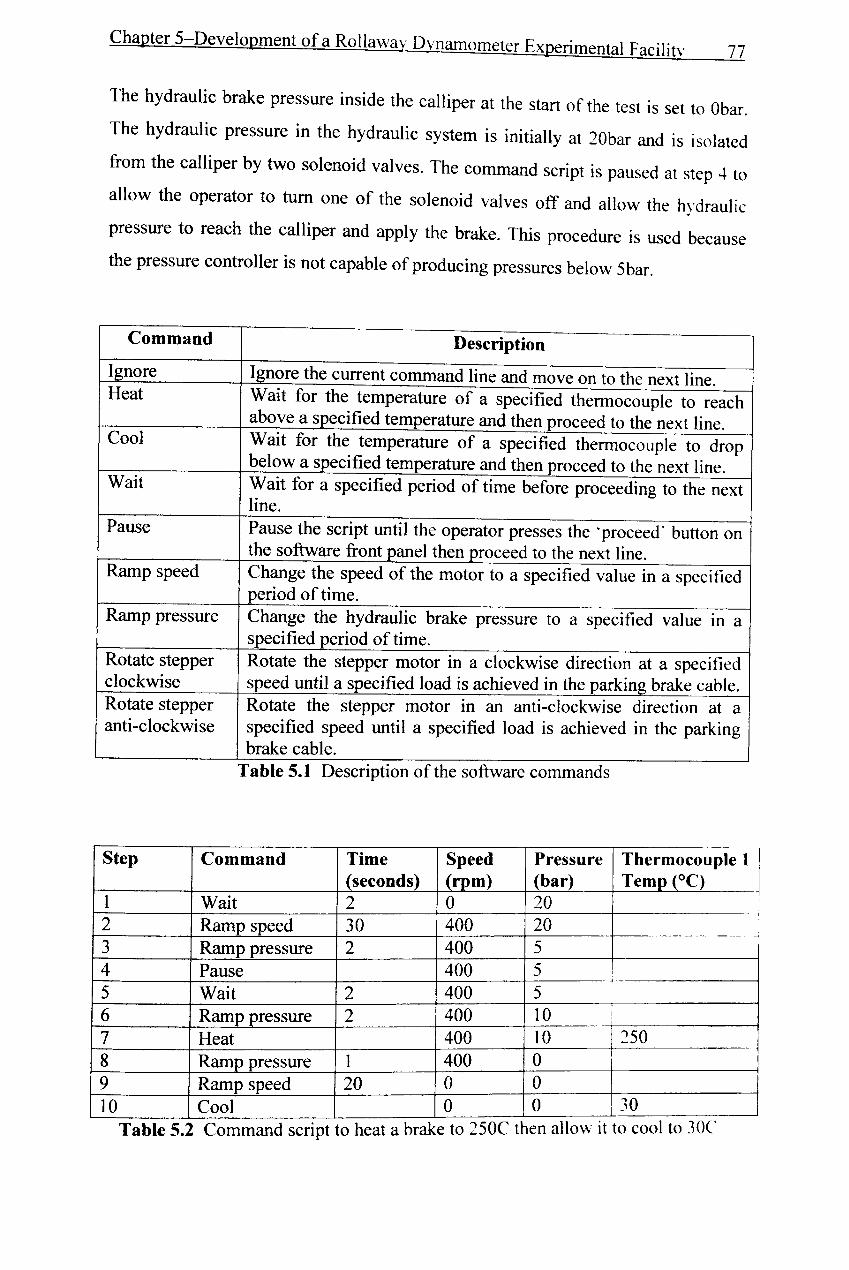
Table 5.1 Description of the software commands ....•....•...•............•........................ 77
Table 5.2 Command script to heat a brake to 250°C then allow it to cool to 30°C .....•.•........................•...............................•....•............................................ 77
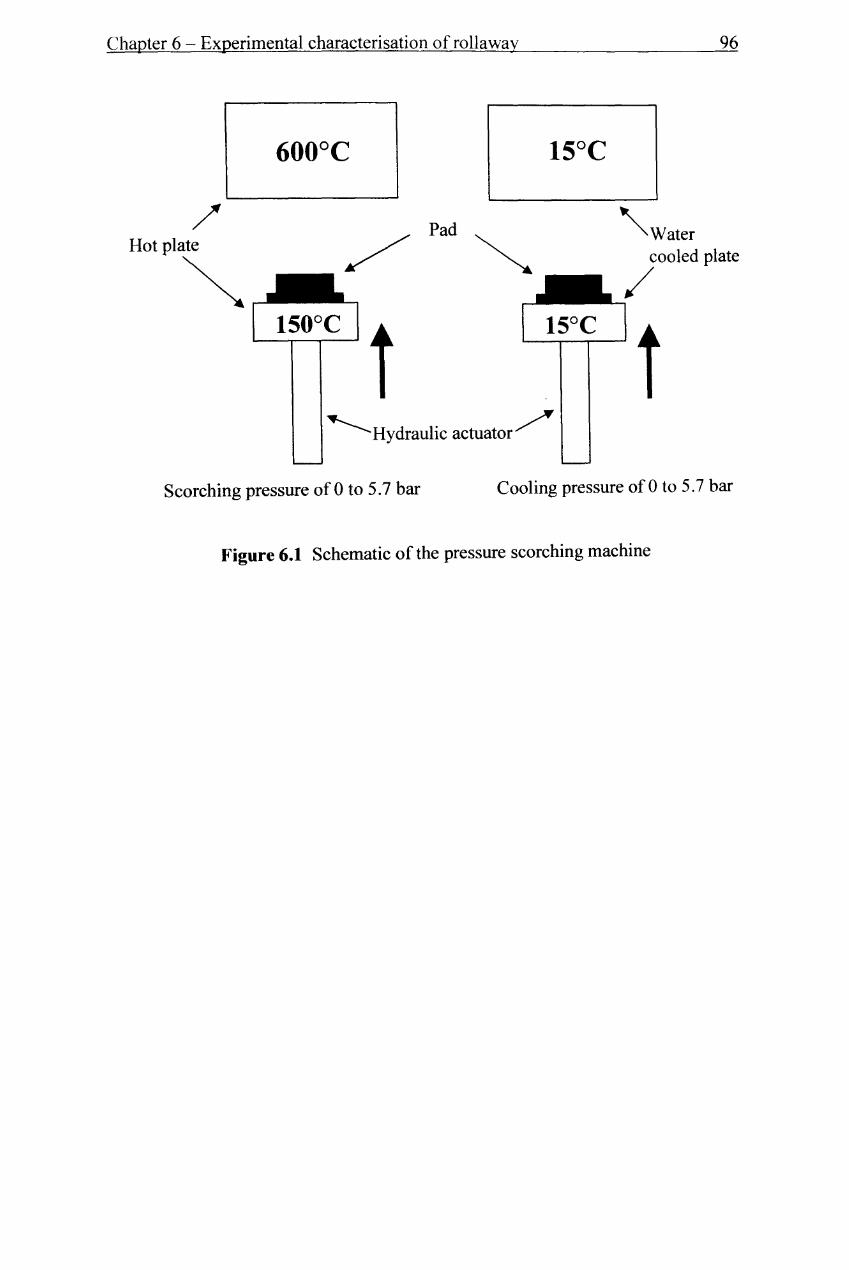
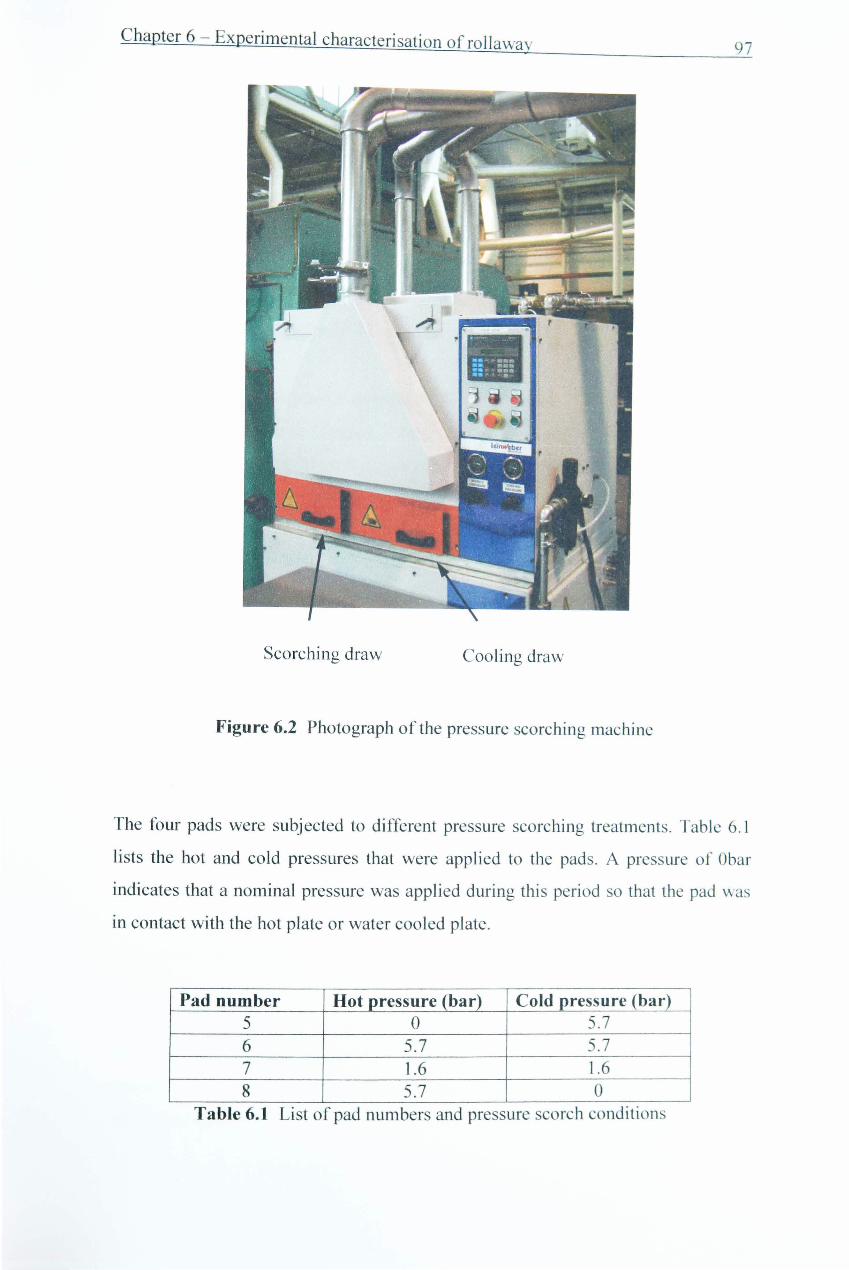
Table 6.1 List of pad numbers and pressure scorch conditions ............................... 97
Table 6.2 Pad 1 compression at varying applied load and temperature ................ 105
Table 6.3 Pad 1 Young's modulus at varying applied pressure and temperature ................•.....•...•.......................•.................................................. 106
Table 6.4 Thermal expansion coefficient values of the OE pad and disc .............. 109
Table 6.5 Cable load and derived clamp load for the Jaguar S-Type OE parking brake system ...................................................................................... t 11
Table 6.6 Roughness values from the bedded and un-bedded pads ...................... 118
- xv-
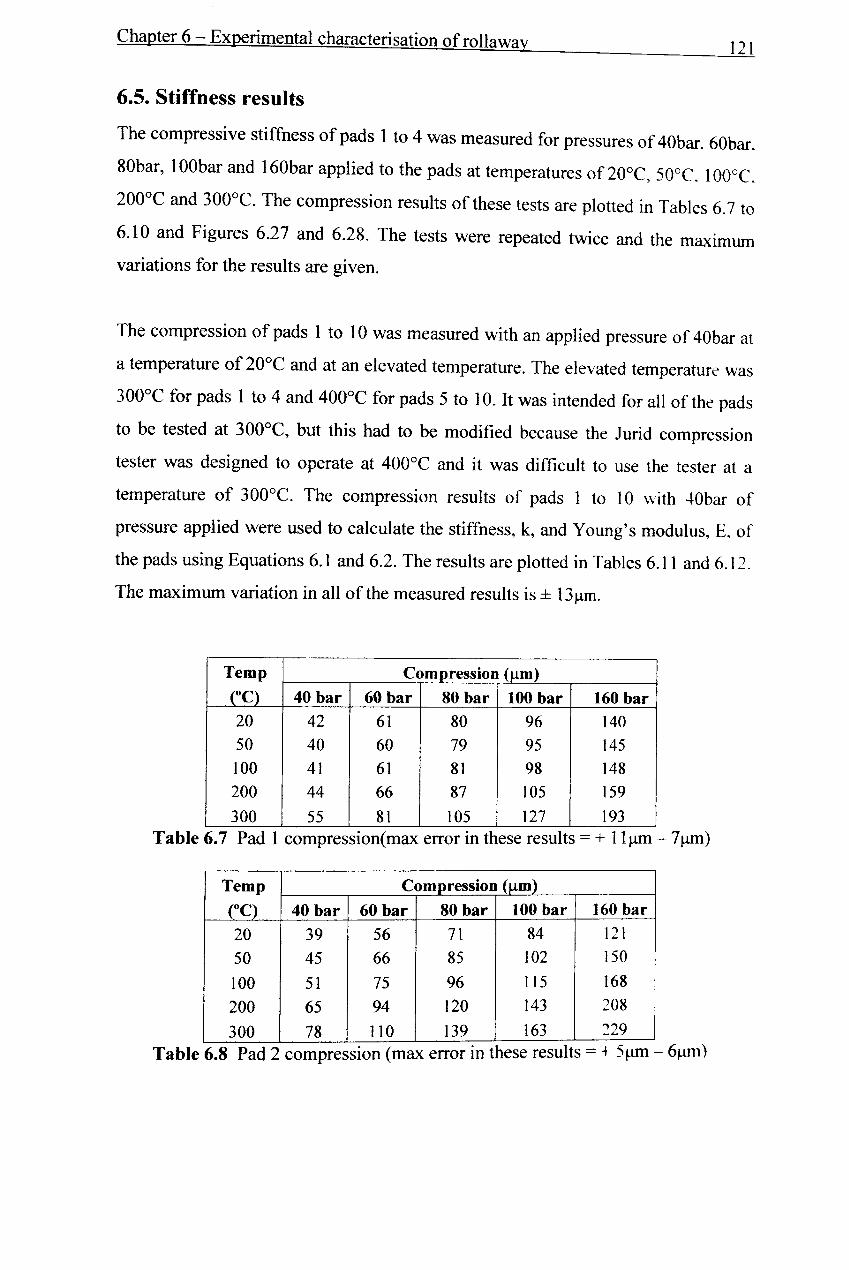
Table 6.7 Pad I compression ................................................................................. 12]
Table 6.8 Pad 2 compression ................................................................................. 121
Table 6.9 Pad 3 compression ................................................................................. 122
Table 6.10 Pad 4 compression ............................................................................... 122
Table 6.11 Compression at ambient temperature with 40bar applied ................... 123
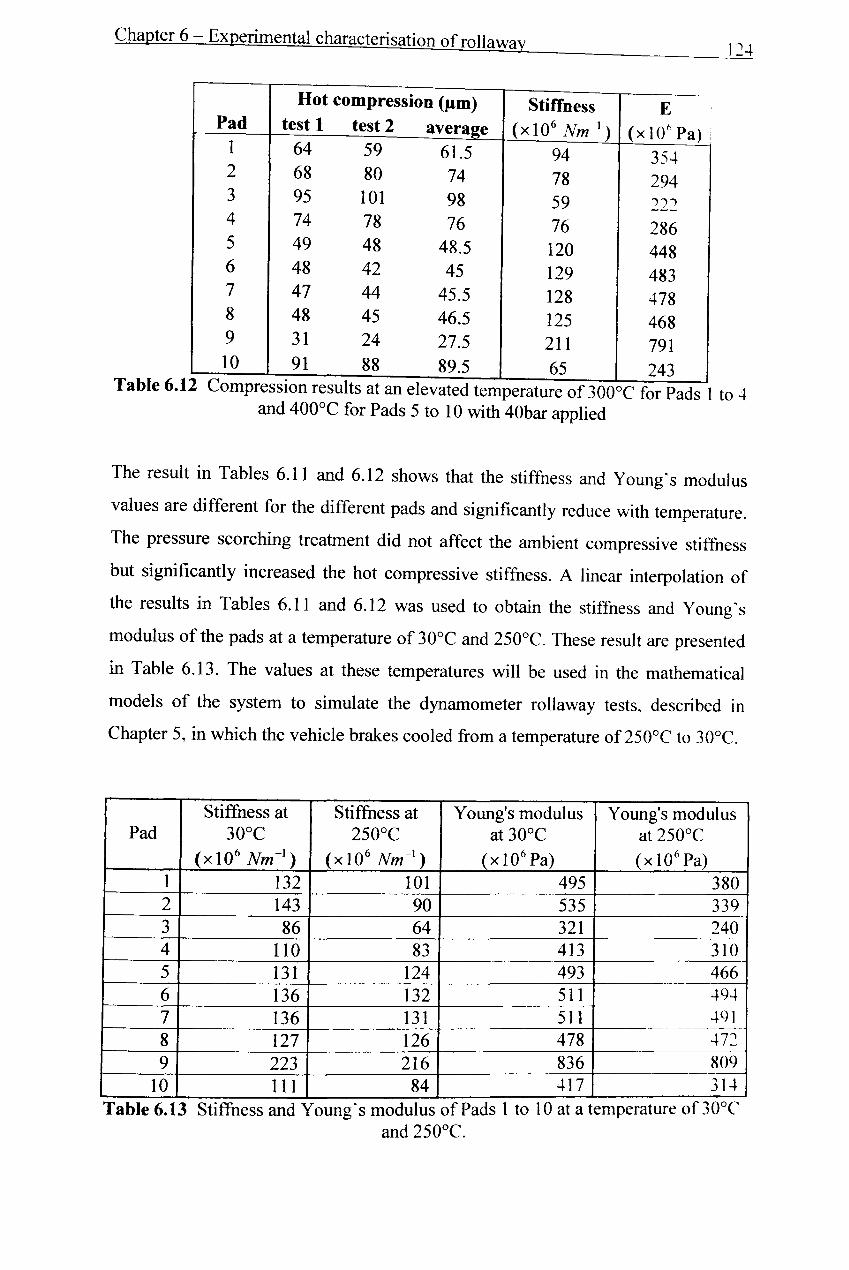
Table 6.12 Compression results at an elevated temperature of 300°C for Pads 1 to 4 and 400°C for Pads 5 to 10 with 40bar applied .................................... 124
Table 6.13 Stiffness and Young's modulus of Pads 1 to 10 at a temperature of 30°C and 250°C •••••..••...••..••.....•.•.••....•...••........•••.............•...........••....•........ 124
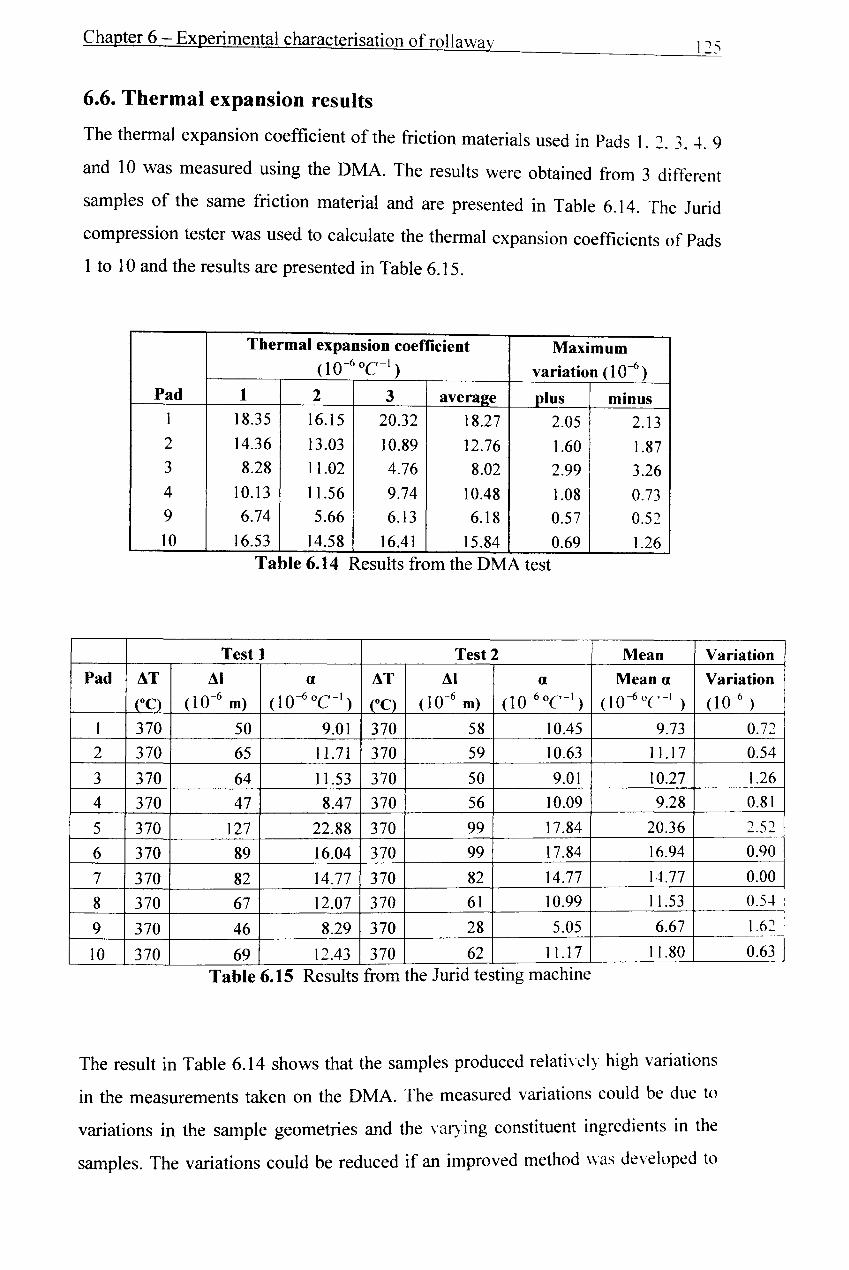
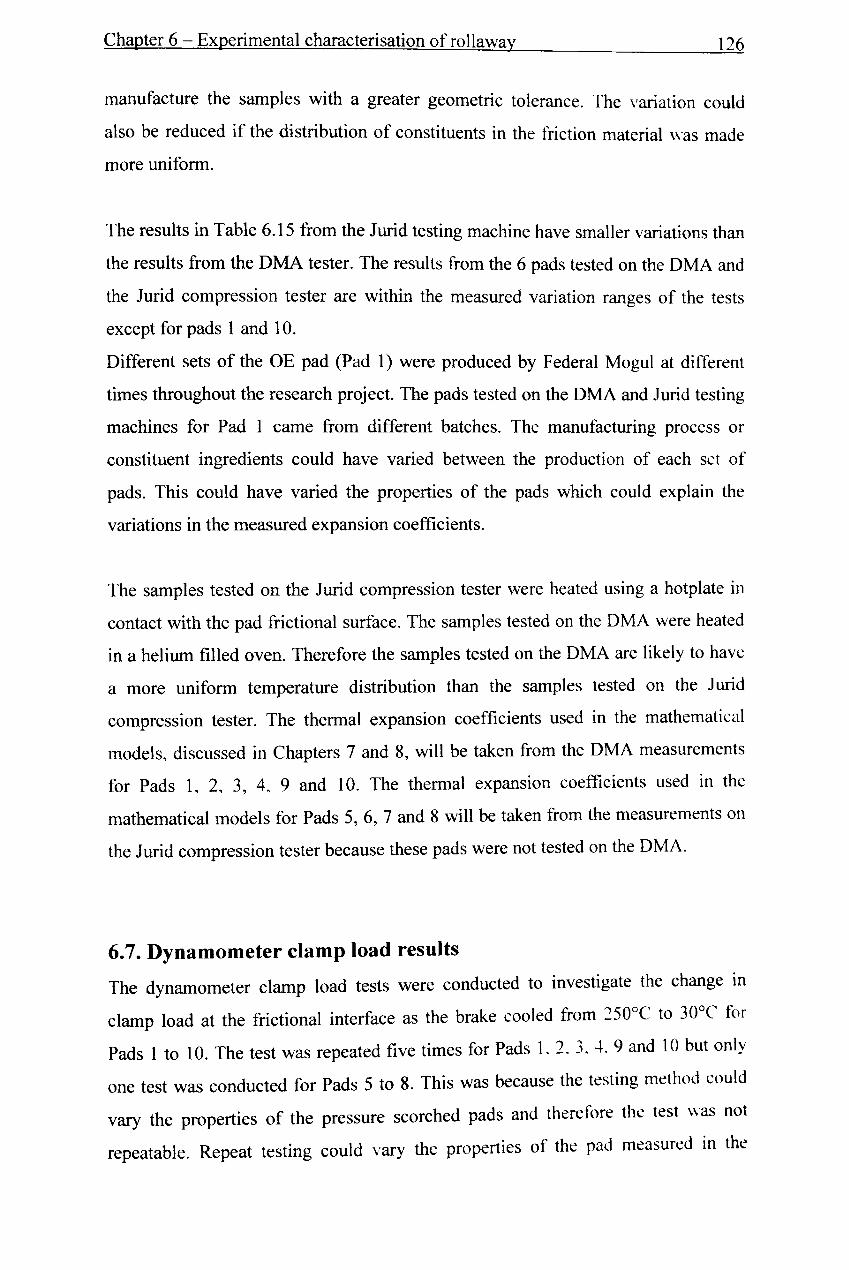
Table 6.14 Results from the DMA test .................................................................. 125
Table 6.15 Results from the Jurid testing machine ...........................•.•.................. 125
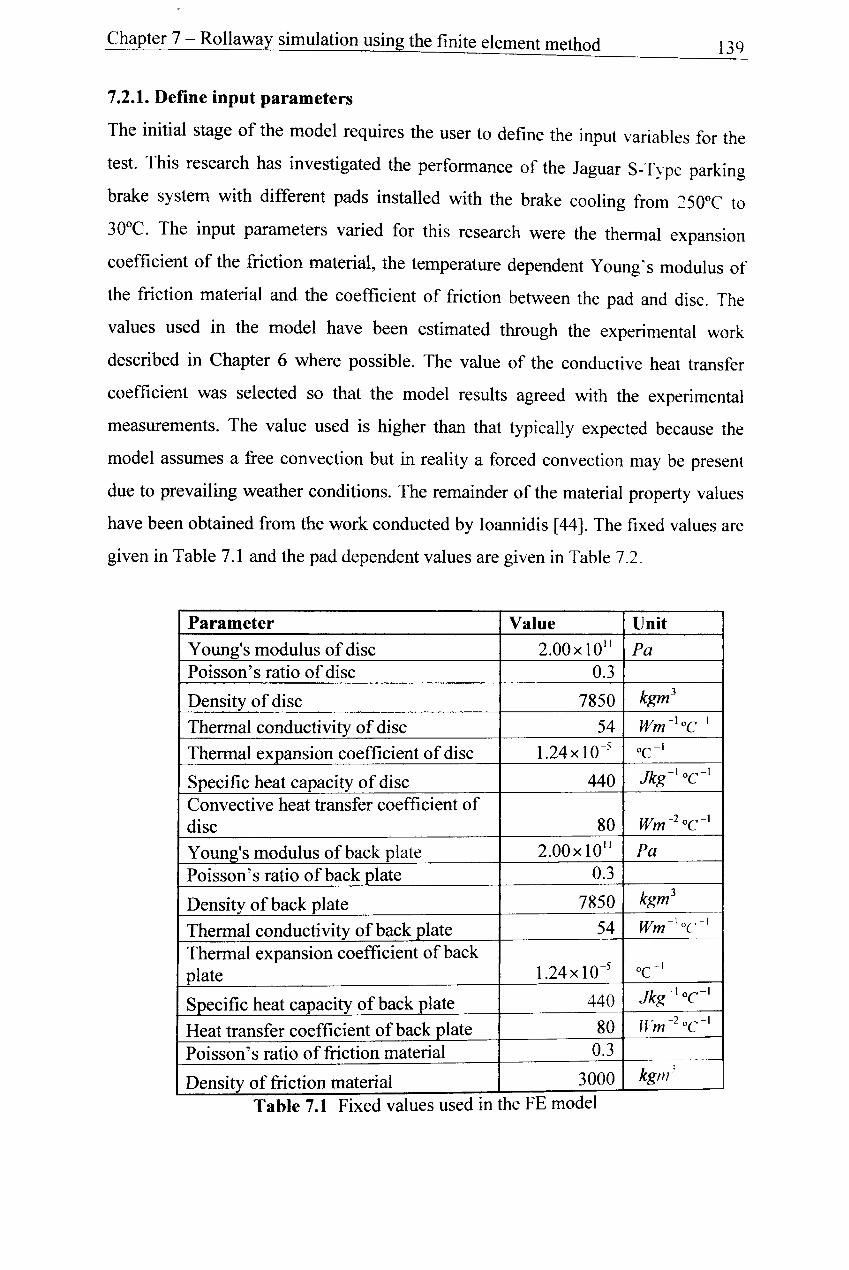
Table 7.1 Fixed values used in the FE model. ....................................................... 139
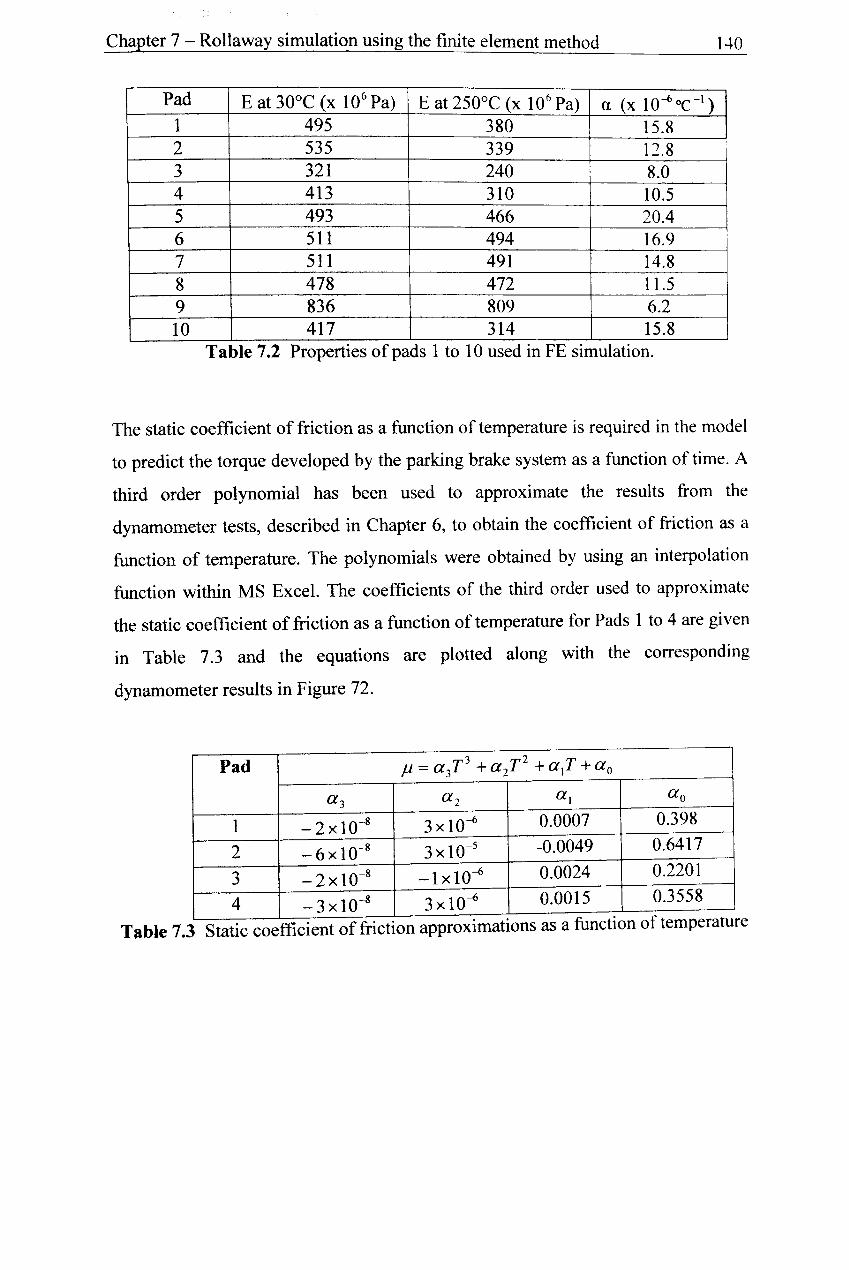
Table 7.2 Properties of Pads 1 to 10 used in FE simulation .................................. 140
Table 7.3 Static coefficient of friction approximations as a function of temperature ..................................................................................................... 140
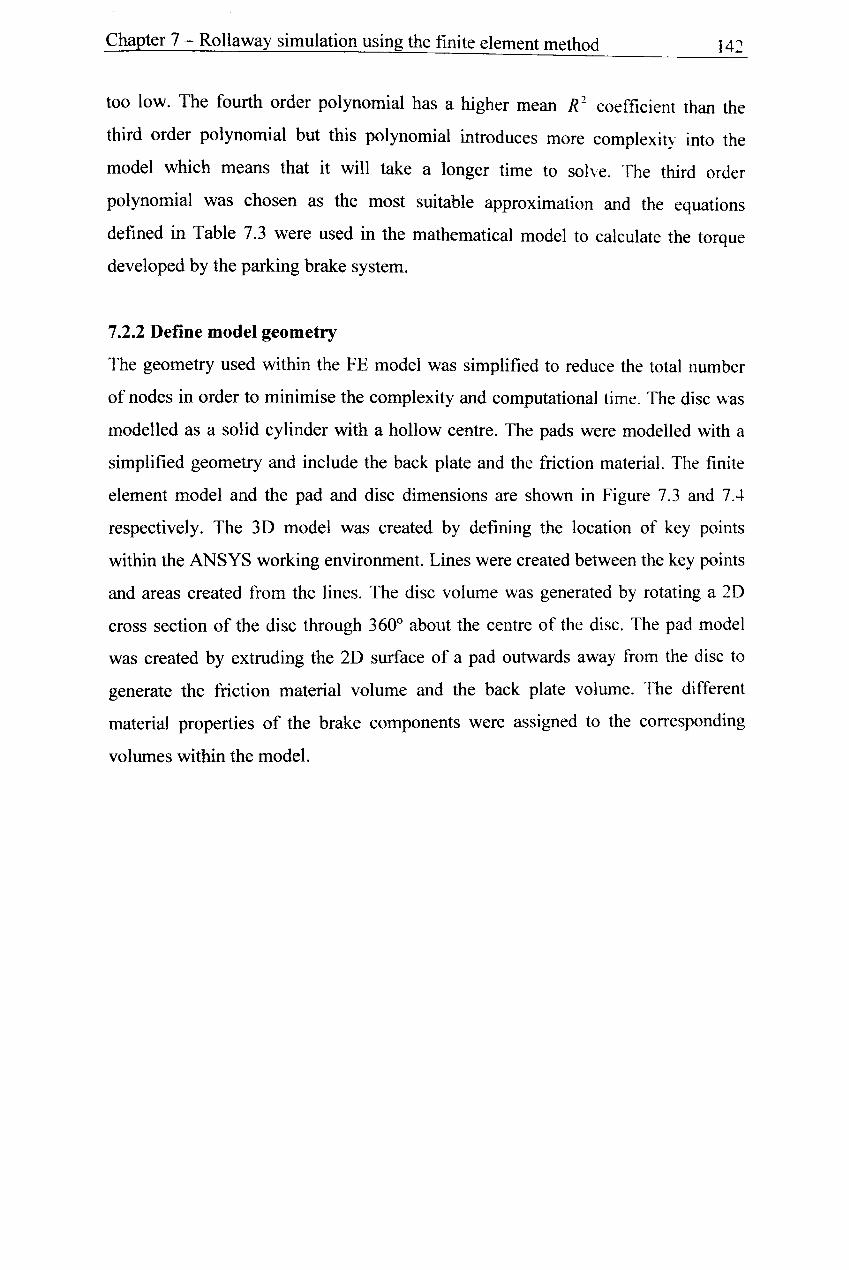
Table 7.4 R2 values from the polynomial approximations ................................... 141
Table 7.5 Properties of Pads la to Ie .................................................................... 152
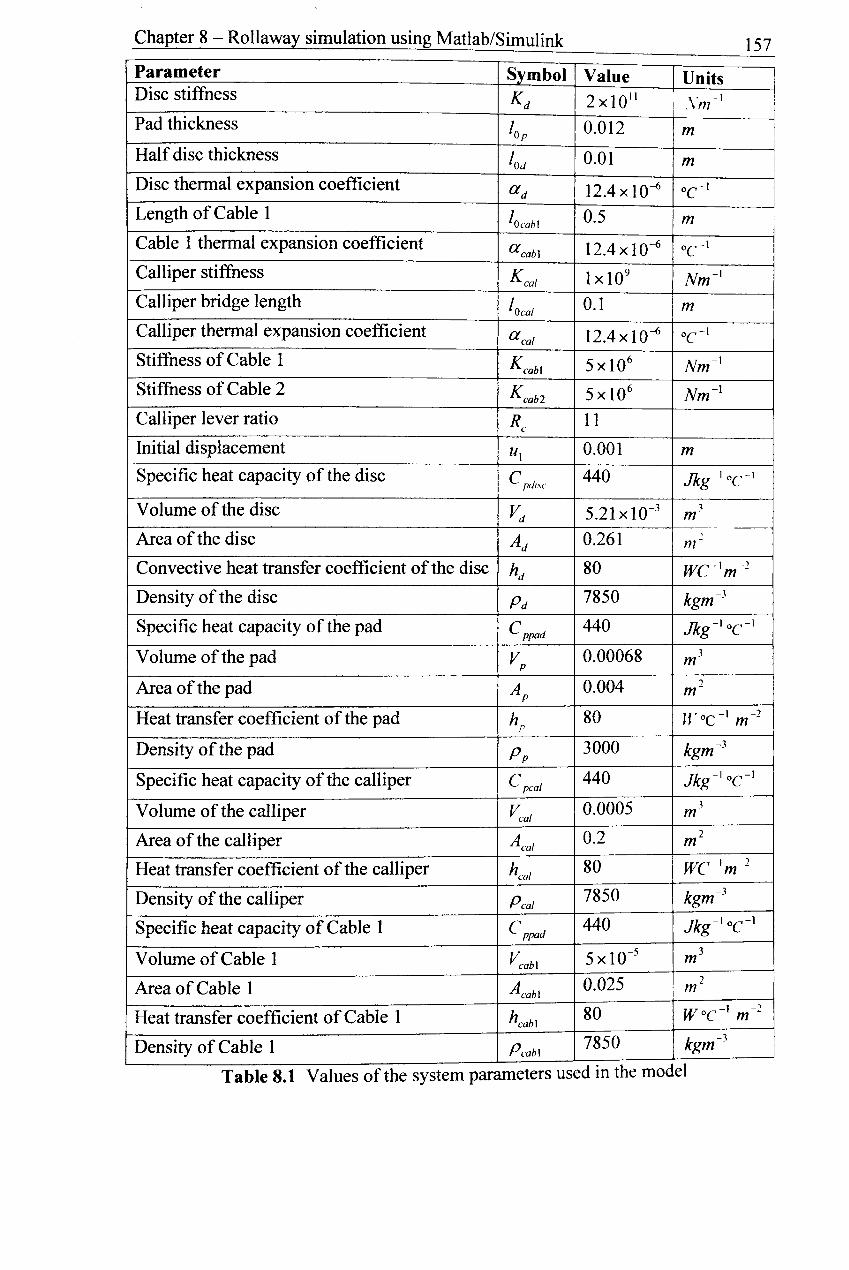
Table 8.1 Values of the system parameters used in the model. ........•.......•............ 157
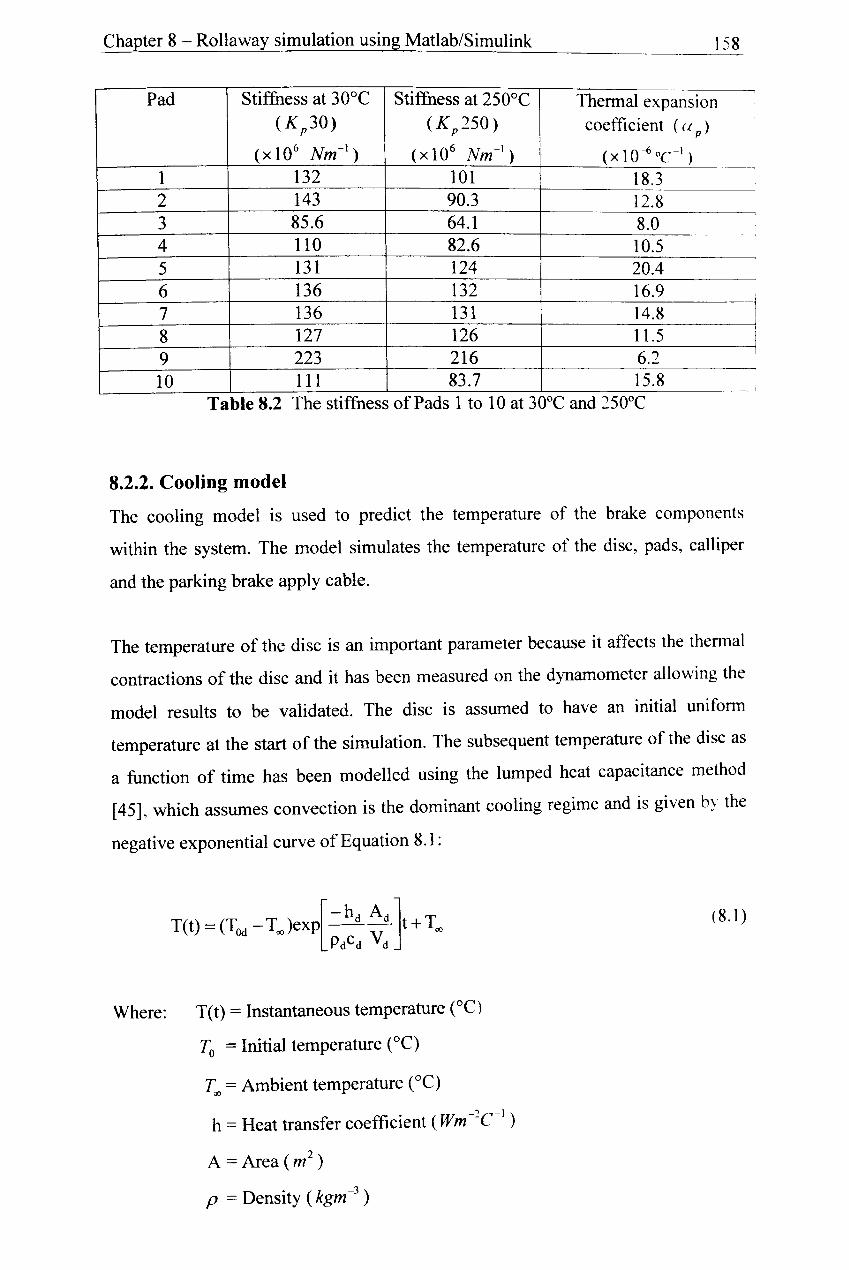
Table 8.2 The stiffness of Pads 1 to 10 at 30°C and 250°C ................................... 158
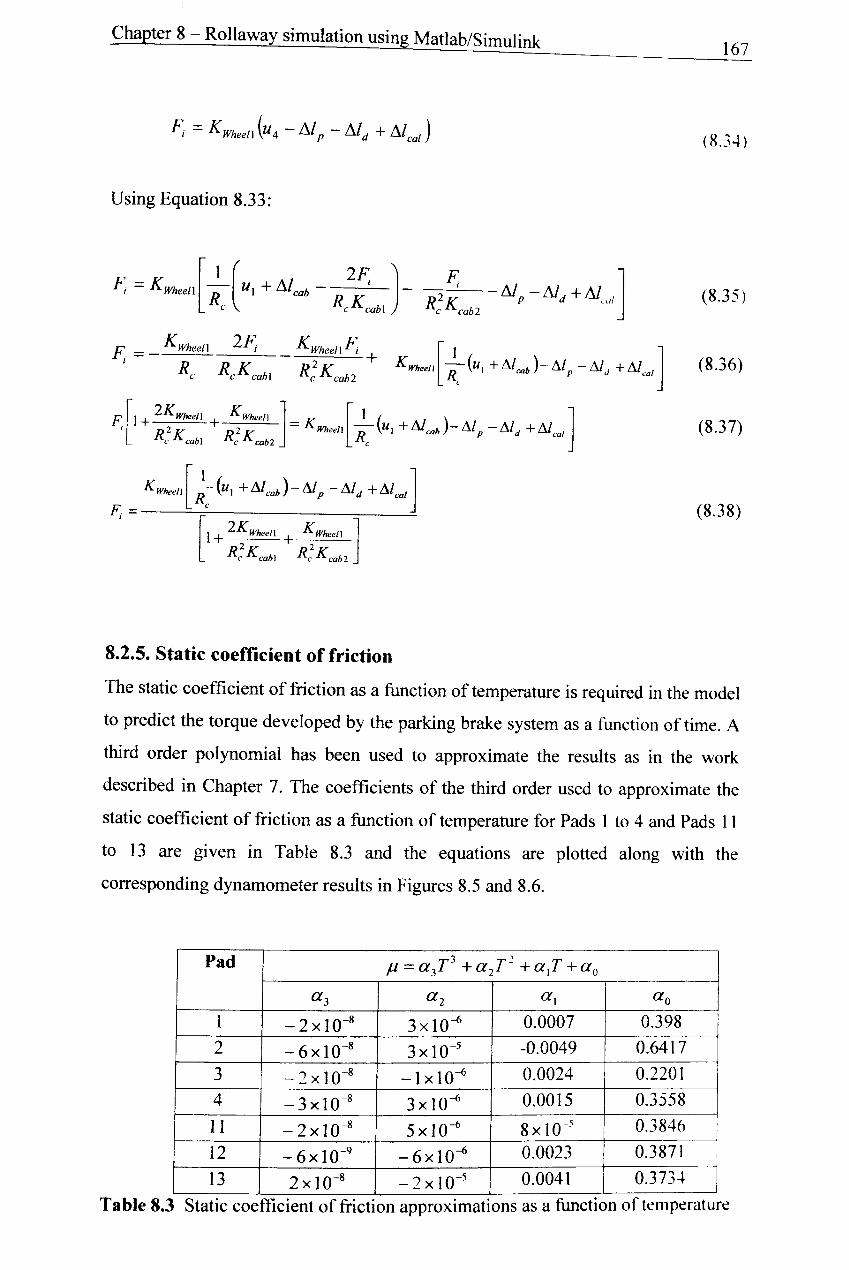
Table 8.3 Static coefficient of friction approximations as a function of tern perature ................•..........•..••.........................•........................................... 167
Table 8.4 R2 values from the polynomial approximations .................................... 169
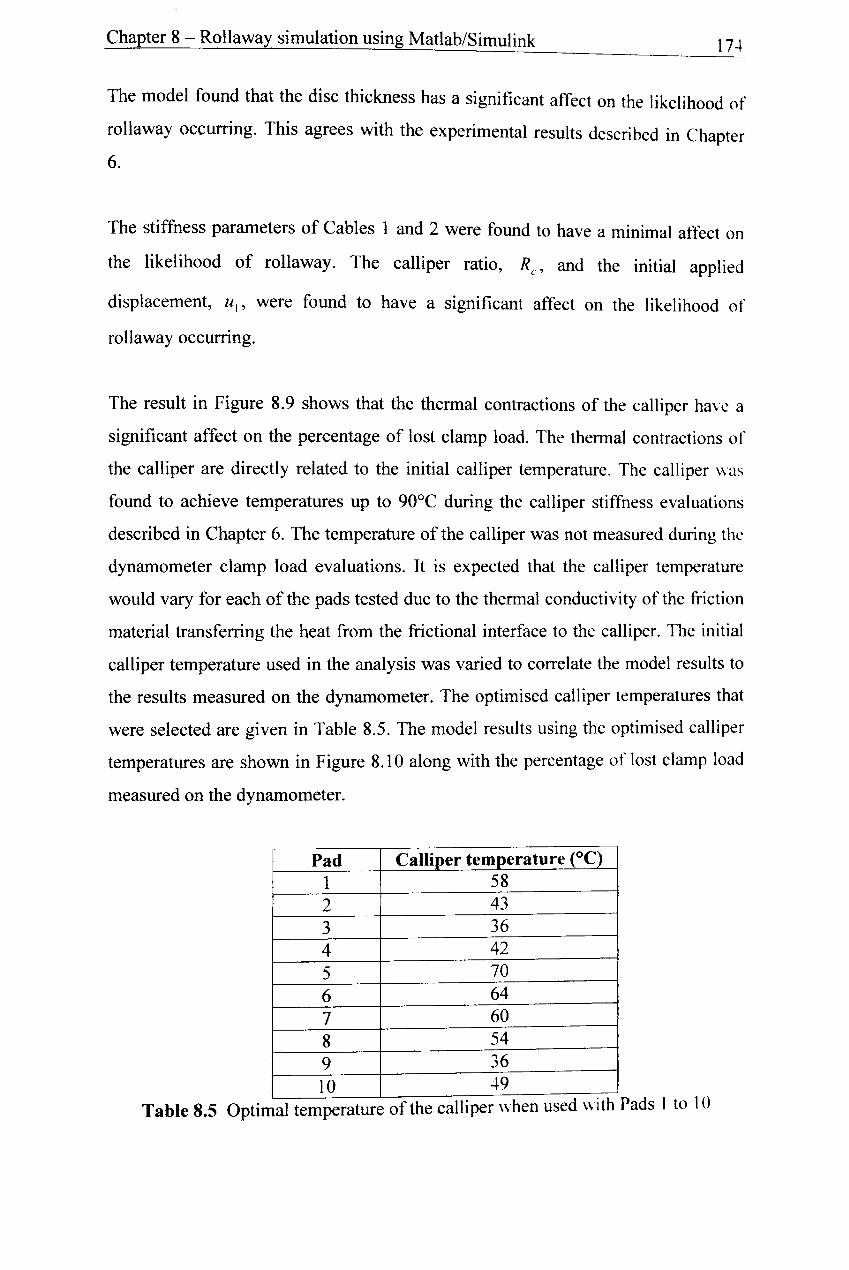
Table 8.5 Optimal temperature of the calliper when used with Pads 1 to 10 ........ 174
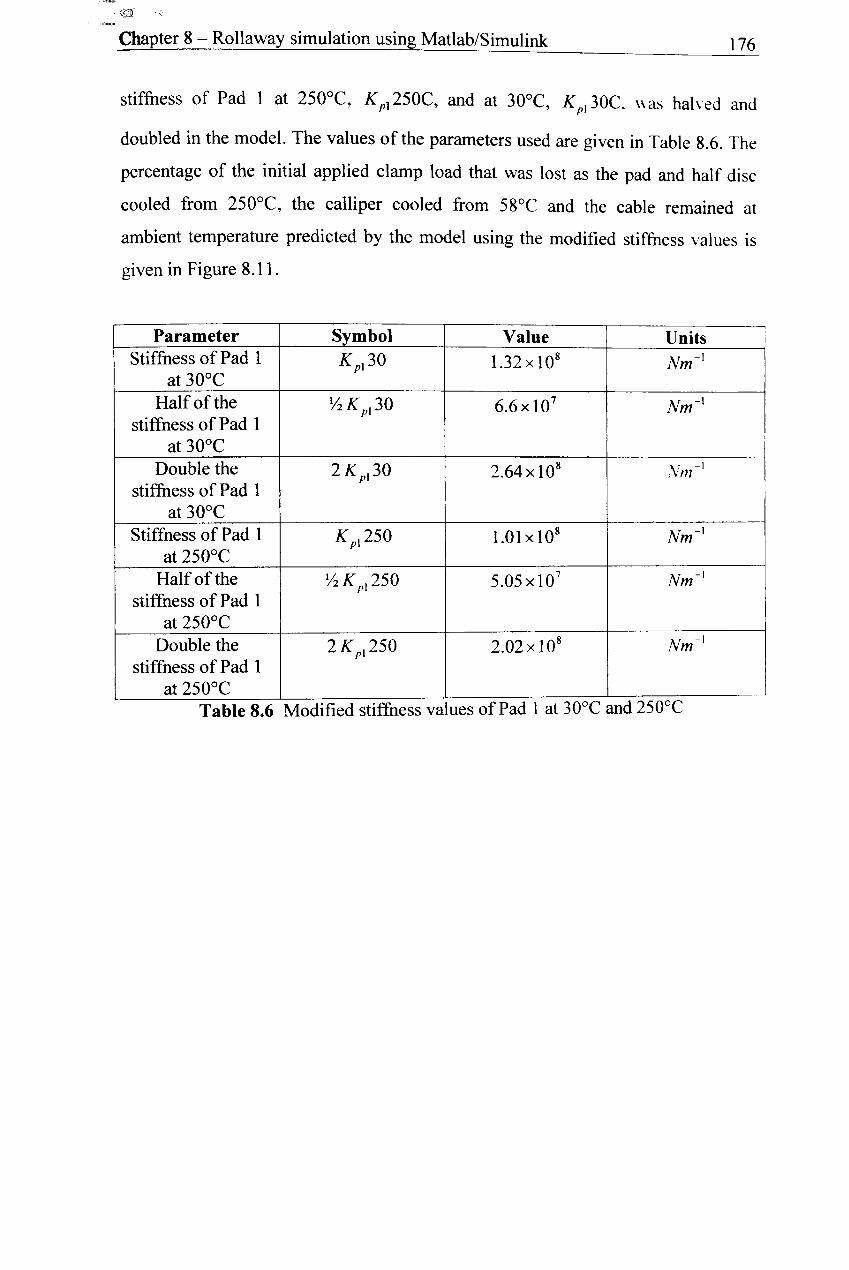
Table 8.6 Modified stiffness values of Pad 1 at 30°C and 250°C .......................... 176
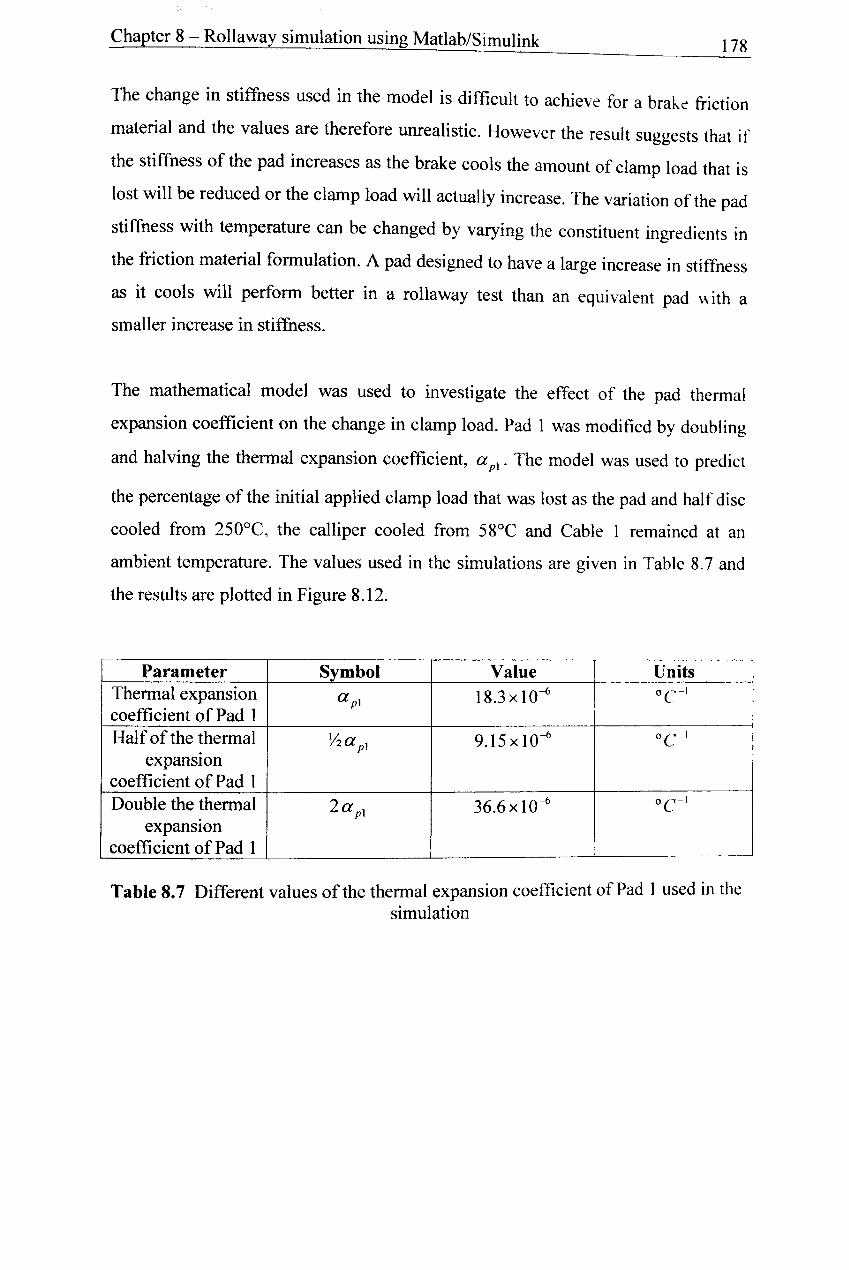
Table 8.7 Different values of the thermal expansion coefficient of Pad 1 used in the simulation ............................................................................................. 178
- XVI -
NOMENCLATURE
ABS = Anti-lock braking system
BIR = Ball in ramp
NRS = Nucap retention system
NVH = Noise vibration and harshness
DTV = Disc thickness variation
EPB = Electronic parking brake
NAO = Non asbestos organic
SUV = Sports utility vehicle
OE = Original equipment
SPL = sound pressure level
DAQ = Data acquisition
NI = National Instruments
VI = Virtual instrument
DMA = Dynamic Mechanical Analyser
L VDT = Linear variable differential transformer
FEA = Finite element analysis
APDL = ANSYS parametric design language
F = frictional force (N)
N = Normal force (N)
Jl = Friction coefficient
Ra = surface roughness
X = position along sample (m)
z = deviation from mean surface (m)
L = length of sample (m)
- XVll -
F; = Normal force at the frictional interface (N)
Fa = Force in parking brake apply system (N)
kd = Stiffness of the disc (Nm -1)
kp = Stiffness of the pad (Nm -1)
kp 30 = Stiffness of the pad at 30°C (Nm-1)
k p 250 = Stiffness of the pad at 250°C(Nm -1 )
ka = Stiffness of the parking brake apply system (Nm -1 )
lop = Original thickness of the pad (m)
IOd = Original thickness of half of the disc (m)
IOcabl = Original length of cable 1 (m)
lOcal = Original length of the calliper bridge (m)
a p = Thermal expansion coefficient of the pad (C -1 )
ad = Thennal expansion coefficient of the disc (C -1)
a cab1 = Thermal expansion coefficient of cable 1 (C -I)
a cal = Thennal expansion coefficient of the calliper (C -I)
k = Stiffness of cable 1 (Nm -1) cabl
kcah2 = Stiffness of cable 2 (Nm -I)
A p = Cross-sectional area of pad (m 2)
Ad = Cross-sectional area of disc (m 2 )
Ep = Young's modulus of the pad (Nm -2)
Ed = Young's modulus of the disc (Nm -2)
u l = Input displacement to parking brake system (m)
u 2 = Input displacement to caliper (m)
u 3 = Output displacement of caliper (m)
u 4 = Displacement of frictional interface (m)
L\ T = Change in temperature (OC)
T= Instantaneous temperature COC)
To = Temperature at start of test COC)
T h = Ambient temperature COC) am
- XVlll -
h = Heat transfer coefficient (Wm-2 C- I)
C pJm= Specific heat capacity of disc (J kg- l col)
C ppad= Specific heat capacity of the pad (J kg- l col)
C peal = Specific heat capacity of the calliper (J kg- l col)
P d = Density of disc (kg m-3)
Pp = Density of the pad (kg m-3)
Peal = Density of the calliper (kg m-3)
Pcabl = Density of cable 1 (kg m-3)
V d = Volume of disc (m3)
V p = Volume of the pad (m3)
V cal = Volume of the calliper (m3)
V cabl = Volume of cable 1 (m3)
Rc = Calliper lever ratio
~ 1= Change in length or thickness (m)
rbrake = mean rubbing radius of the pad (m)
rwheel = rolling radius of the wheel (m)
Tr = Torque required to hold vehicle on gradient (Nm)
)
-Chapter 1 - In~tion
1.1. The rollaway problem
Chapter 1
Introduction
Rollaway is a generic name that has been coined to describe a particular type of
brake system failure that is associated with the progressive decay of the actuation
load within the parking brake system. In extreme cases, this loss of load has
permitted the in-plane component of vehicle weight to overcome the net brake force
with the result that the vehicle rolls down the slope on which it is parked. The
phenomenon is most commonly encountered on vehicles fitted with a particular
brake system as discussed below.
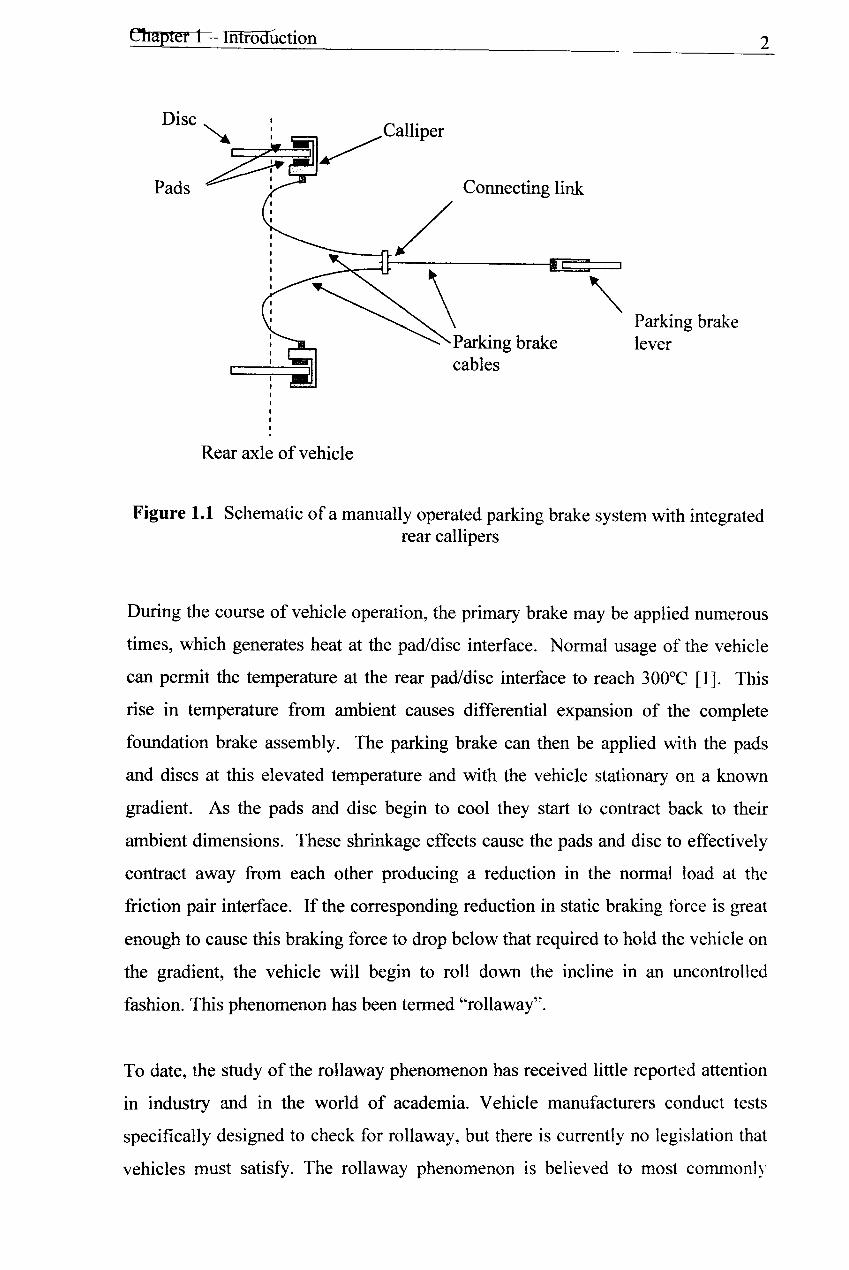
Automotive vehicles that use a rear disc brake installation with an integrated rear
calliper usually have a common set of pads to apply the primary and secondary
(parking) brakes. In each case the pads are pushed against the rear wheel discs in
order to produce the frictional force that is used for braking. When using the foot
brake, or primary circuit, the pads are actuated by increasing the pressure in the
brake lines, which in tum forces a piston to push the pads against the disc. The
parking brake (secondary circuit) is commonly operated by manually applying a
force to the parking brake lever. This causes the lever to rotate and displace the
parking brake cable that is connected to the two rear callipers via a connecting link
which transmits the load and displacement in a roughly equal proportion between
the two callipers. This cable displacement causes a shaft within each calliper to
rotate. The rotation of the shaft is converted into a linear displacement that is used to
actuate the piston, pushing the pads against the disc to produce the frictional force
required to keep the vehicle stationary whilst it is parked. A schematic of such a
parking brake system is shown in Figure 1.1.
Chapter 1 - Introduction
Pads
Rear axle of vehicle
Connecting link
Parking brake cables
Parking brake lever
2
Figure 1.1 Schematic of a manually operated parking brake system with integrated rear callipers
During the course of vehicle operation, the primary brake may be applied numerous
times, which generates heat at the pad/disc interface. Normal usage of the vehicle
can permit the temperature at the rear pad/disc interface to reach 300°C [1]. This
rise in temperature from ambient causes differential expansion of the complete
foundation brake assembly. The parking brake can then be applied with the pads
and discs at this elevated temperature and with the vehicle stationary on a known
gradient. As the pads and disc begin to cool they start to contract back to their
ambient dimensions. These shrinkage effects cause the pads and disc to effectively
contract away from each other producing a reduction in the normal load at the
friction pair interface. If the corresponding reduction in static braking force is great
enough to cause this braking force to drop below that required to hold the vehicle on
the gradient, the vehicle will begin to roll down the incline in an uncontrolled
fashion. This phenomenon has been termed "rollaway".
To date, the study of the rollaway phenomenon has received little reported attention
in industry and in the world of academia. Vehicle manufacturers conduct tests
specifically designed to check for rollaway, but there is currently no legislation that
vehicles must satisfy. The rollaway phenomenon is believed to most commonly
Chapter 1 - Introduction 3
occur on vehicles that use a disc brake with an integrated rear calliper in the parking
brake system. Vehicle manufacturers are tending to favour rear disc over drum
brakes in new car designs due to the performance advantage, and so the number of
vehicles using integrated rear callipers is increasing along with the potential for
rollaway. The increasing risk of rollaway suggests the need for a comprehensive
understanding of the subject due to the obvious catastrophic consequences that can
occur from a rollaway event. This therefore provides the motivation for the current
research project.
The industrial collaborators associated with this project, Federal-Mogul, instigated a
pilot study at the University of Leeds in 2002/03 as a fourth year MEng team project
[2]. The project delivered a basic test rig and sufficient new knowledge to support
the current program of research. The level four project was awarded 1 st prize in the
British Gear Association and IMechE transmission engineering prize.
1.2. Aim and objectives
1.2.1. Aim
The aim of the research is to characterise the rollaway phenomenon through on
vehicle and laboratory based experimental work and to produce a validated
simulation model which can be used as a design tool by an automotive brake
engineer. Use of the model will contribute to the elimination of the rollaway
phenomenon at the design stage of a new vehicle. The model can also be applied to
vehicles in service that have a parking brake system which exhibits rollaway in
order to identify system modifications that can be implemented to eliminate
rollaway.
1.2.2. Objectives
The specific objectives of the research are listed below:
• Conduct extensive on-vehicle rollaway evaluations using a vehicle that is
believed to exhibit the rollaway phenomenon.
• Complete the design and commissioning of a comprehensive laboratory
based rollaway dynamometer test facility.
Chapter 1 - Introduction
• Characterise the performance of a parking brake system known to exhibit
rollaway through extensive laboratory experiments involving dynamometer
and material testing.
• Develop a detailed 3D finite element model that is capable of replicating the
on-vehicle evaluations, and which is validated against the laboratory
experimental data
• Develop a mathematical model of a rollaway event that can be used as a
design tool by brake engineers.
• Determine through numerical trials the key system parameters that enable the
brake system engineer to control and minimise the likelihood of rolla way.
1.2.3. Structure of thesis
The remainder of this thesis is comprised of nine other chapters that are summarised
below.
Chapter 2: The brake system fundamentals for a typical automotive application are
discussed. A detailed account of vehicle parking brake systems is given.
Chapter 3: A literature review of published material relevant to vehicle rollaway is
given. A review is given of experimental and numerical methods used to evaluate
brake systems.
Chapter 4: The on-vehicle evaluations that have been conducted for this research
project are described. The vehicles were used to conduct rollaway tests to
investigate the phenomenon of rolla way under 'real world' conditions.
Chapter 5: This chapter describes how the laboratory based dynamometer test
facility and data acquisition system was developed and commissioned for this
research. Commissioning tests are described that demonstrate the functionality of
the test facility.
Chapter 6: This chapter describes the laboratory based tests that were used to
characterise the material properties of the parking brake system components. The
Chapter 1 - Introduction 5
dynamometer evaluations are also discussed that investigate the performance of the
parking brake components.
Chapter 7: The finite element model of the parking brake system is described along
with the results that have been generated.
Chapter 8: A description of the mathematical model that was developed to
investigate rollaway is presented. The model is used to investigate the sensitivity of
the likelihood of rollaway to changes in the parking brake system parameters.
Chapter 9: This chapter presents a discussion of the results and theories generated
during the research project.
Chapter 10: The conclusions made from the overall findings of the research are
discussed along with recommendations for areas of further research.
Chapter 2 - Brake system fundamentals 6
Chapter 2
Brake system fundamentals
2.1. Brake system overview
An automotive brake system is a device that is required to conduct three main
functions: [3]
1. Decelerate a vehicle including stopping.
2. Maintain vehicle speed during downhill operation.
3. Hold a vehicle stationary on a gradient in either direction and when
connected to a trailer.
A brake system typically consists of the primary foundation brake and a secondary
parking brake. The foundation brake converts the driver's muscular energy into a
braking force via a brake pedal. The pedal pushes a piston inside the master cylinder
which forces hydraulic fluid into the brake circuit. The pedal force is usually
assisted by a vacuum operated brake servo. It is important that no air is present in
the brake hydraulic circuit as air is compressible, which causes the brake to feel
. "spongy" and severely reduces braking efficiency. The hydraulic fluid is usually
split between the two front and two rear brakes by a proportioning valve which
restricts the pressure delivered to the rear brakes to prevent rear wheel lock up. Most
modem vehicles use an anti-lock braking system (ABS) to regulate the brake
pressure at each wheel to improve the vehicles stability. The brakes can be one of
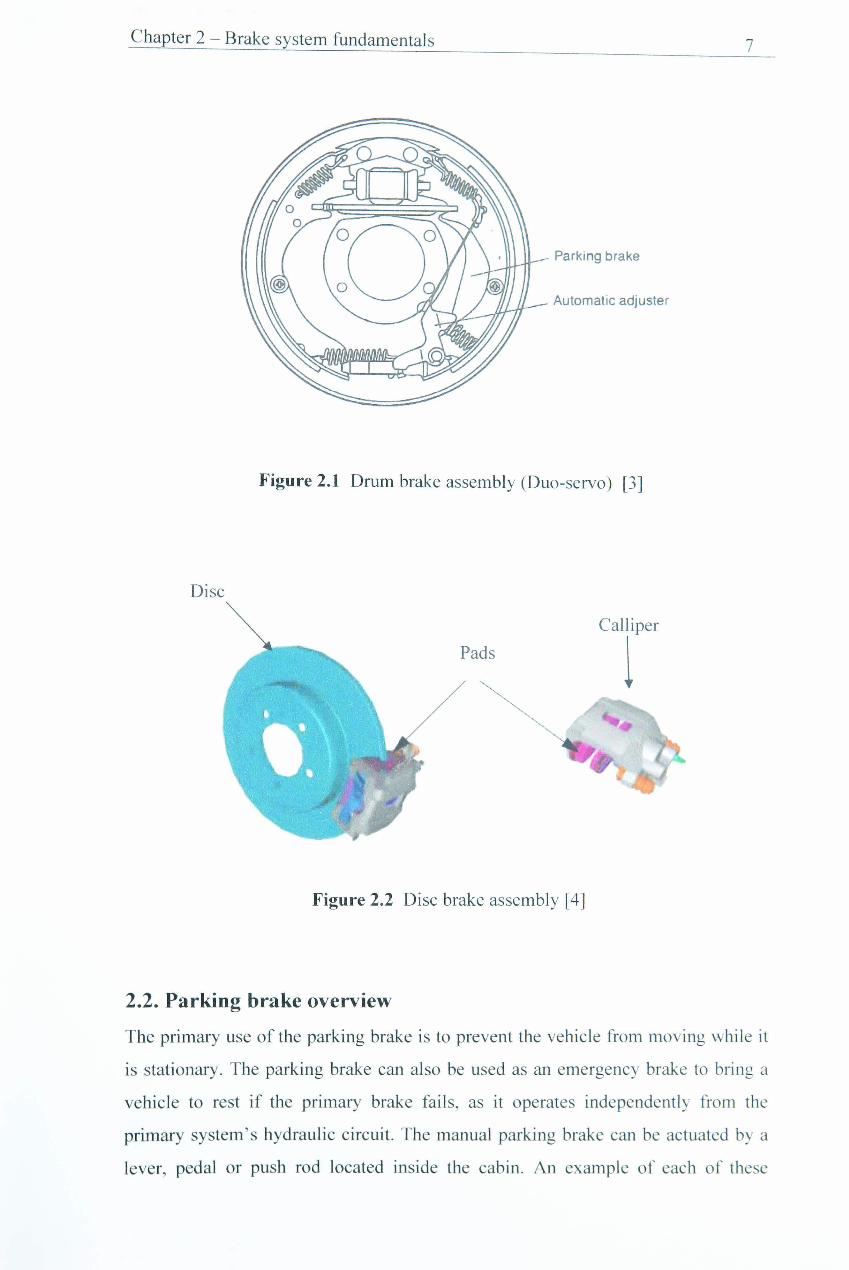
two basic geometric forms, either a disc or a drum. Drum brakes use two brake
shoes lined with an arc of friction material. The brake is actuated when the shoes are
displaced in an outward radial motion to contact with the internal surface of the
drum. The drum is attached to the wheel and hence produces a braking force when
actuated.
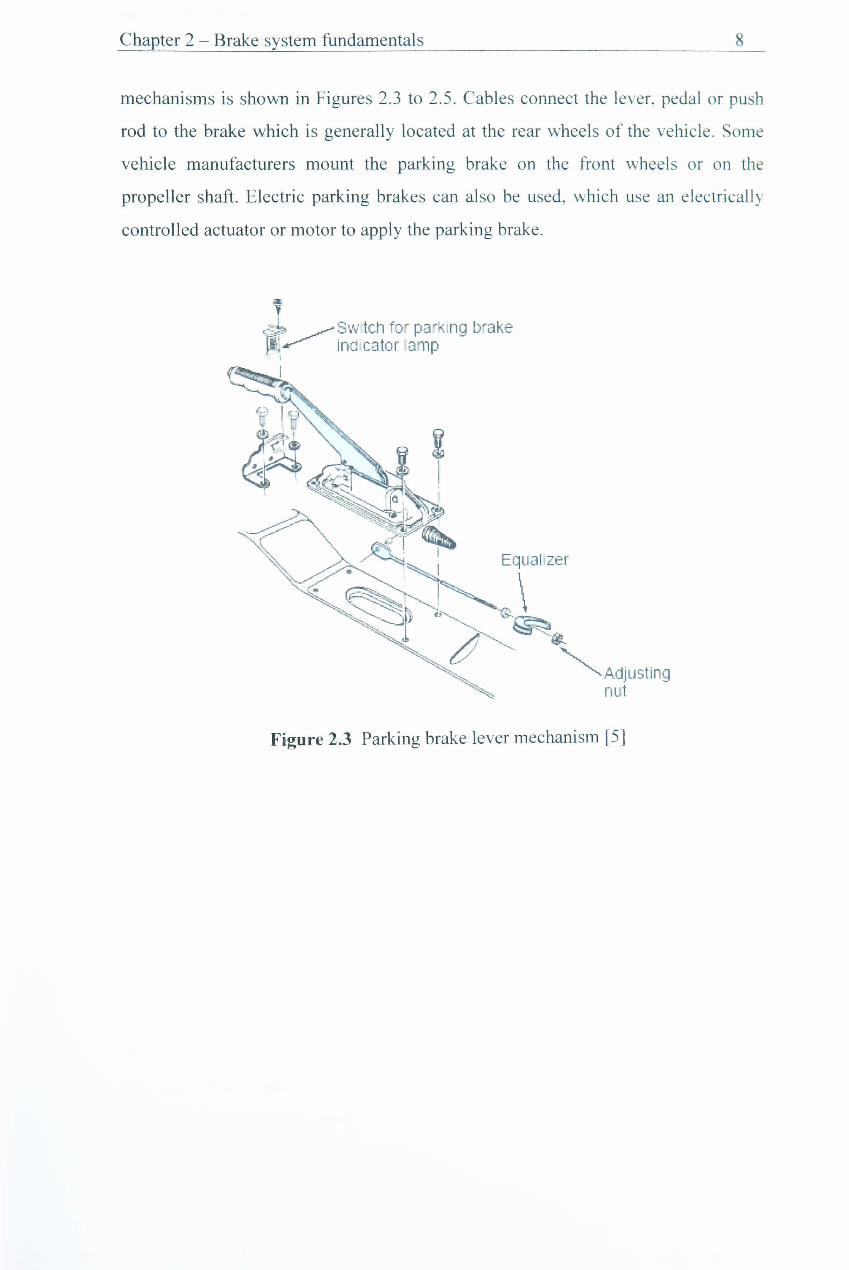
A disc brake consists of two pads located on either side of a flat disc which is
attached to the wheel stub axle. The pads are supported within a calliper assembly.
The brake is actuated when hydraulic fluid is forced inside the calliper, which causes
a piston to displace the pads in a normal direction to the disc. The contact surface
between the pad and disc surface produces the frictional force. Figures 2.1 and 2.2
illustrate the basic layout of a drum and disc brake respectively.
Chapter 2 - Brake system fundamentals 7
Parki ng brake
Automatic adjuster
Figure 2.1 Drum brake assembly (Duo-servo) [3]
Disc
~ Pads
Figure 2.2 Disc brake assembly [4]
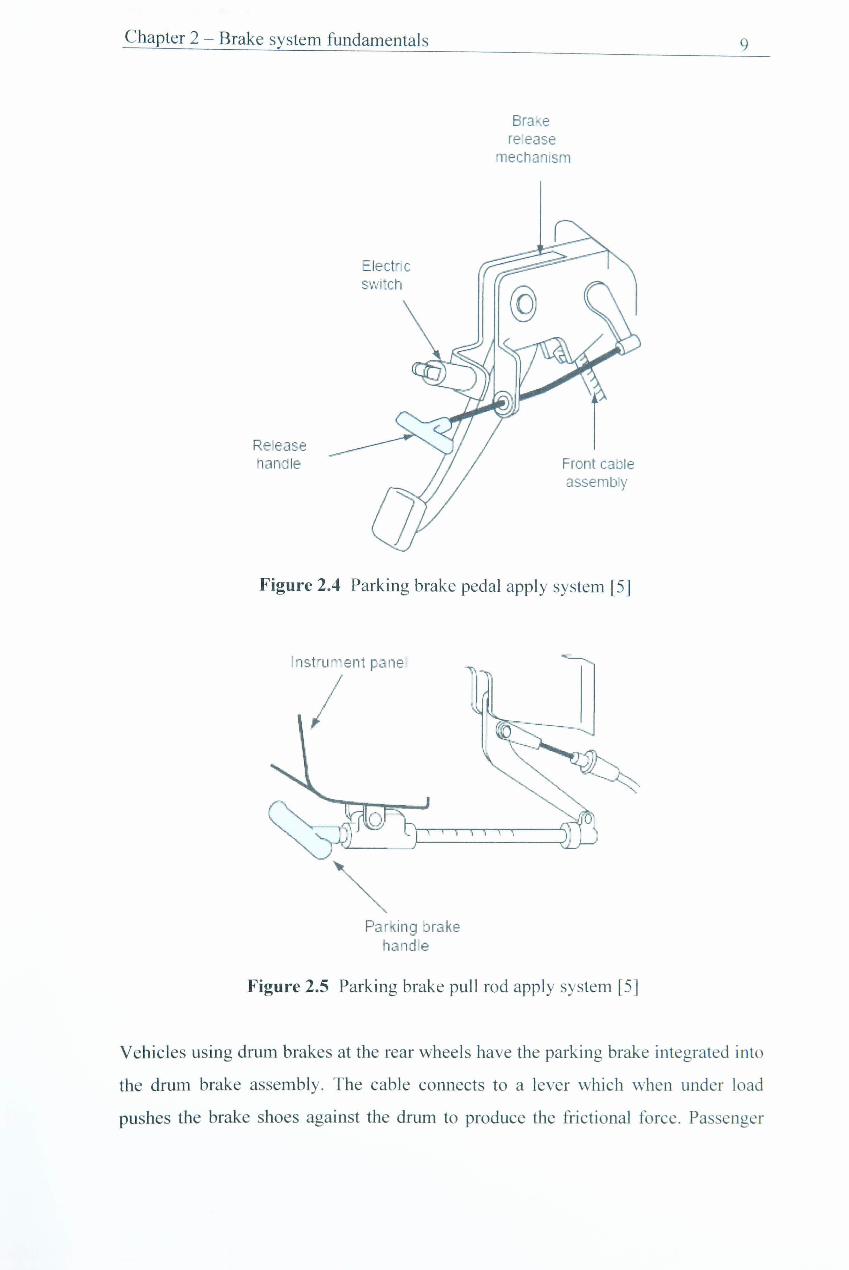
2.2. Parking brake overview
The primary use of the parking brake is to prevent the vehicle from moving while it
is stationary. The parking brake can also be used as an emergency brake to bring a
vehicle to rest if the primary brake fails, as it operates independently from the
primary system's hydraulic circuit. The manual parking brake can be actuated b _ a
lever, pedal or push rod located inside the cabin . An example of each of the c
Chapter 2 - Brake system fundamentals 8
mechanisms is shown in Figures 2.3 to 2.5. Cables connect the lever, pedal or push
rod to the brake which is generally located at the rear wheels of the vehicle. Some
vehicle manufacturers mount the parking brake on the fro nt wheels or on the
propeller shaft. Electric parking brakes can also be used, which use an electrically
controlled actuator or motor to apply the parking brake.
Figure 2.5 Parking brake pull rod apply system [5]
9
Vehicles using drum brakes at the rear wheels have the parking brake integrated into
the drum brake assembly. The cable connects to a lever which when under load
pushes the brake shoes against the drum to produce the frictional force . Pas enger
Chapter 2 - Brake system fundamentals 10
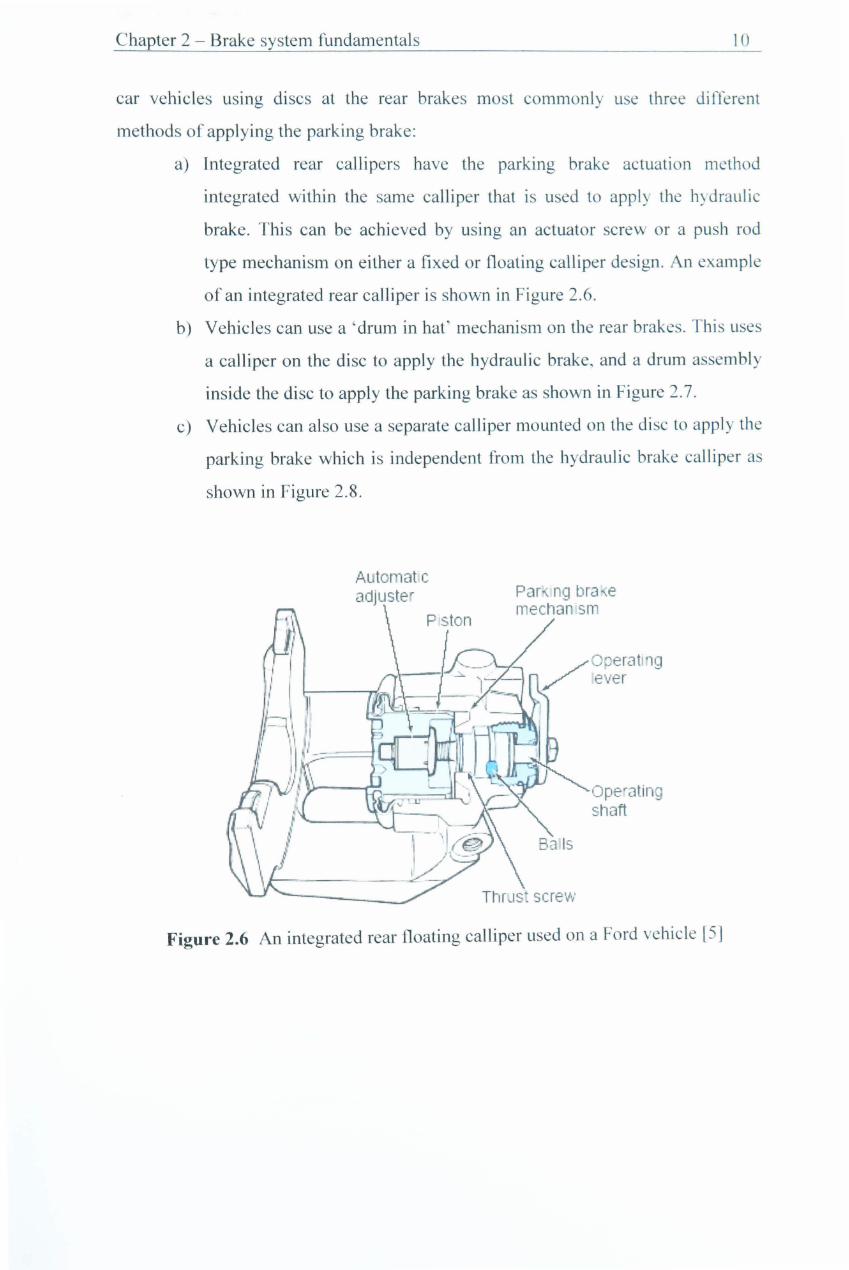
car vehicles usmg discs at the rear brakes most common1y use three different
methods of applying the parking brake:
a) Integrated rear callipers have the parking brake actuation method
integrated within the same calliper that is used to appl y the hydraulic
brake. This can be achieved by using an actuator screw or a push rod
type mechanism on either a fixed or floating calliper design. An example
of an integrated rear calliper is shown in Figure 2.6.
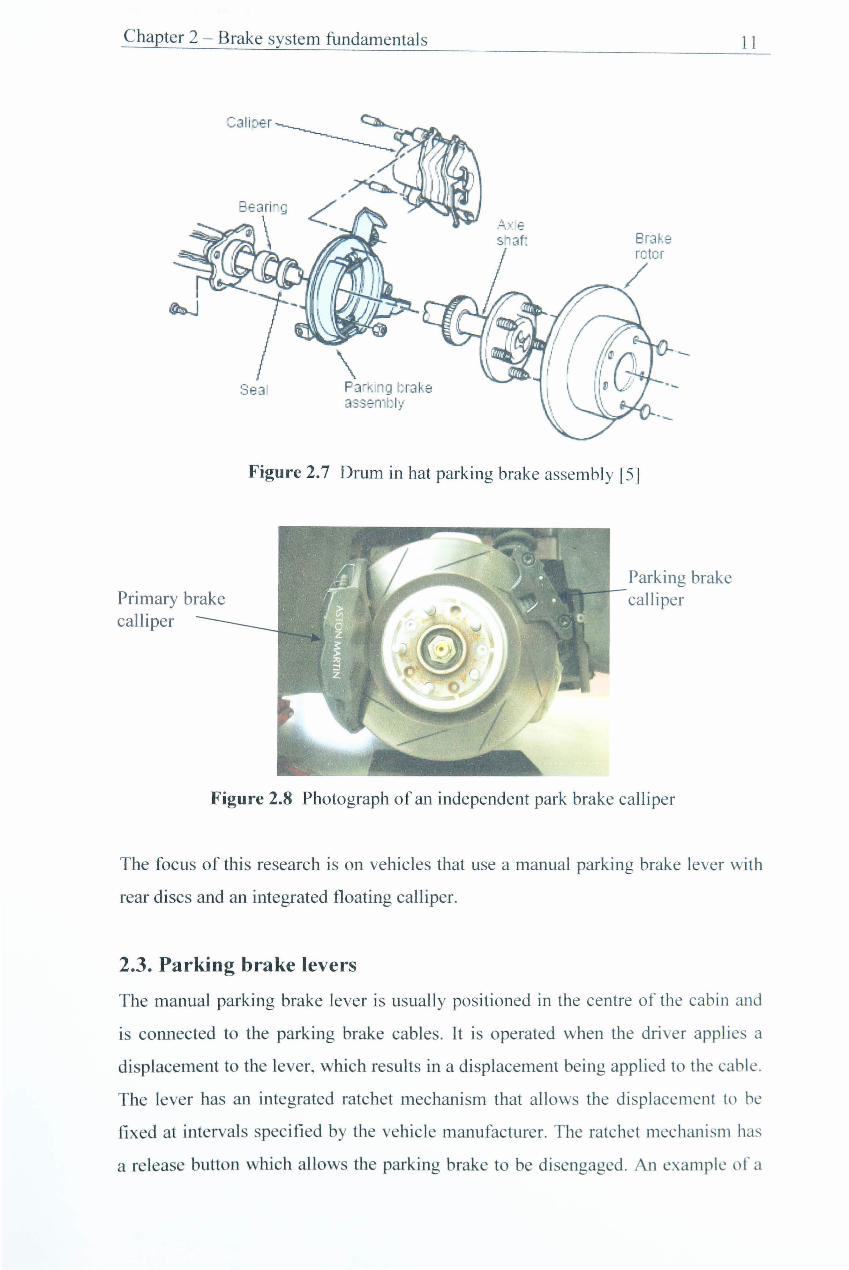
b) Vehicles can use a ' drum in hat' mechanism on the rear brakes. This uses
a calliper on the disc to apply the hydraulic brake, and a drum assembly
inside the disc to apply the parking brake as shown in Figure 2.7.
c) Vehicles can also use a separate calliper mounted on the disc to apply the
parking brake which is independent from the hydraulic brake calliper as
shown in Figure 2.8.
Automat c adjuster Par I 9 bra e
mecha Sil
Operating shaft
Figure 2.6 An integrated rear floating calliper used on a Ford vehicle [5]
Chapter 2 - Brake system fundamentals
Park ng I; r3ke assemt: I'/
-
Figure 2.7 Drum in hat parking brake assembly [5]
Parking brake Primary brake --calliper calliper
Figure 2.8 Photograph of an independent park brake calliper
11
The focus of this research is on vehicles that use a manual parking brake lever with
rear discs and an integrated floating calliper.
2.3. Parking brake levers
The manual parking brake lever is usually positioned in the centre of the cabin and
is connected to the parking brake cables. It is operated when the driver applies a
displacement to the lever, which results in a displacement being applied to the cable.
The lever has an integrated ratchet mechanism that allows the displacement to be
fixed at intervals specified by the vehicle manufacturer. The ratchet mechani m ha
a release button which allows the parking brake to be disengaged. An example of a
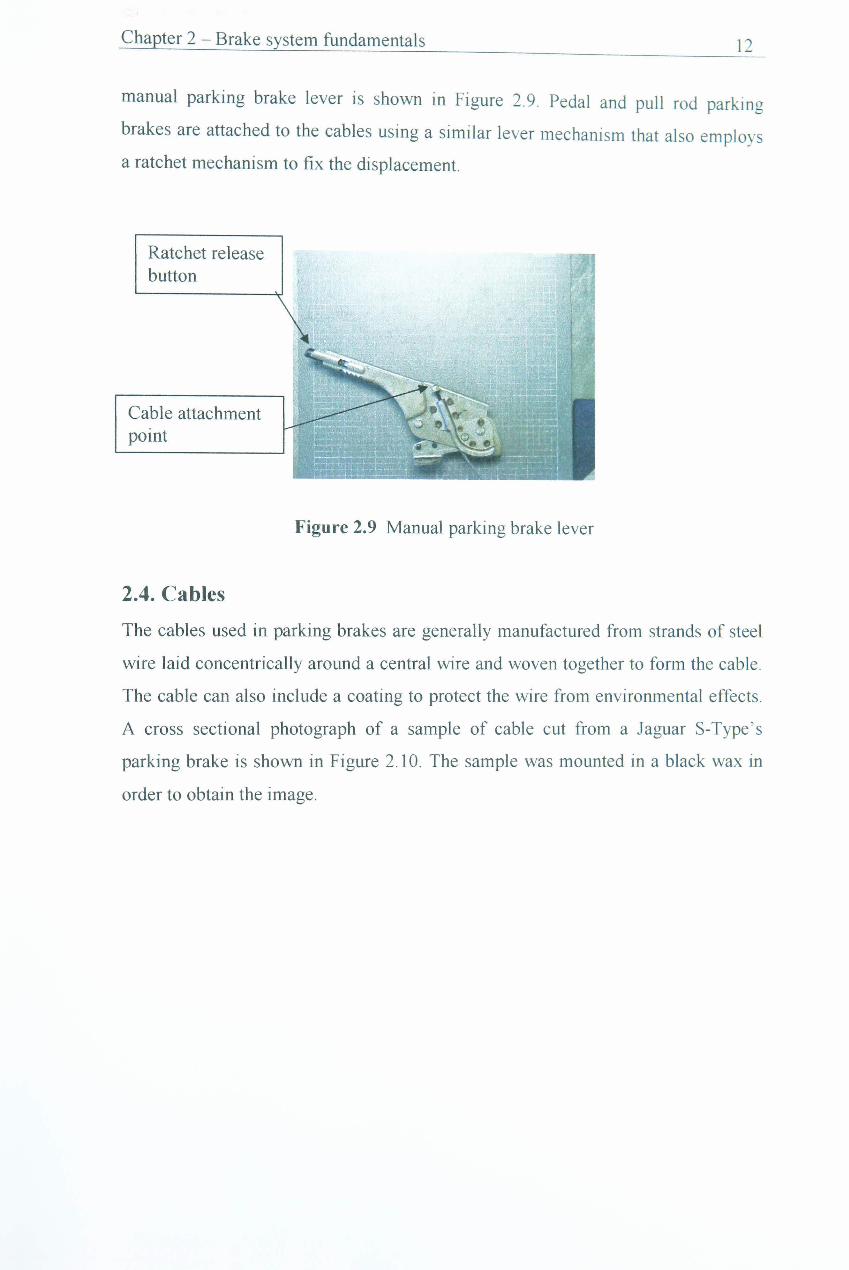
Chapter 2 - Brake system fundamentals 12
manual parking brake lever is shown in Figure 2.9. Pedal and pull rod parking
brakes are attached to the cables using a similar lever mechanism that al so employs
a ratchet mechanism to fix the displacement.
Ratchet release button
Cable attachment point
2.4. Cables
Figure 2.9 Manual parking brake lever
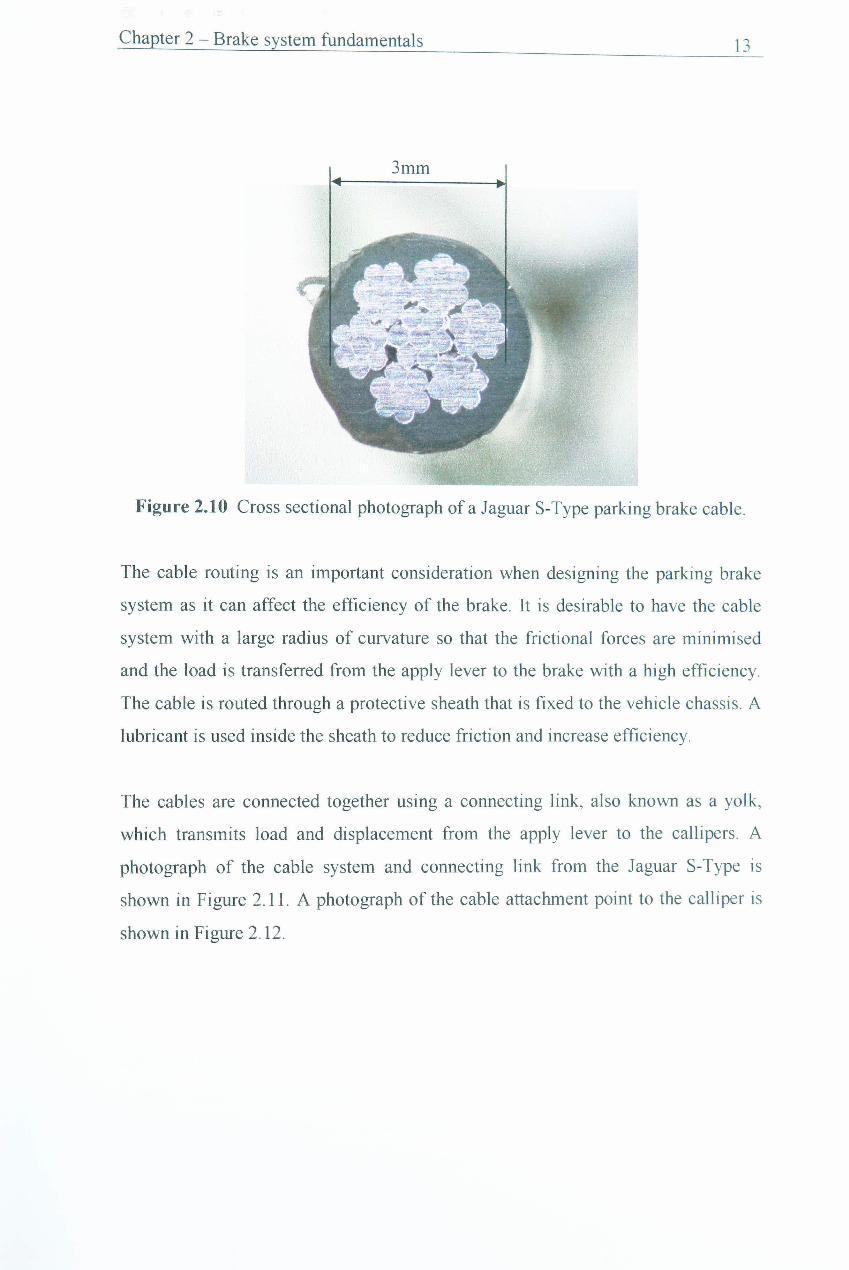
The cables used in parking brakes are generally manufactured from strands of steel
wire laid concentrically aroLmd a central wire and woven together to form the cable.
The cable can also include a coating to protect the wire from environmental efTects.
A cross sectional photograph of a sample of cable cut from a Jaguar S-Type ' s
parking brake is shown in Figure 2.10. The sample was mounted in a black wax in
order to obtain the image.
Chapter 2 - Brake system fundamentals 13
31nm
Figure 2.10 Cross sectional photograph of a Jaguar S-Type parking brake cable.
The cable routing is an important consideration when designing the parking brake
system as it can affect the efficiency of the brake. It is desirable to have the cable
system with a large radius of curvature so that the frictional forces are minimised
and the load is transferred from the apply lever to the brake with a high efficiency.
The cable is routed through a protective sheath that is fixed to the vehicle chassis. A
lubricant is used inside the sheath to reduce friction and increase efficiency.
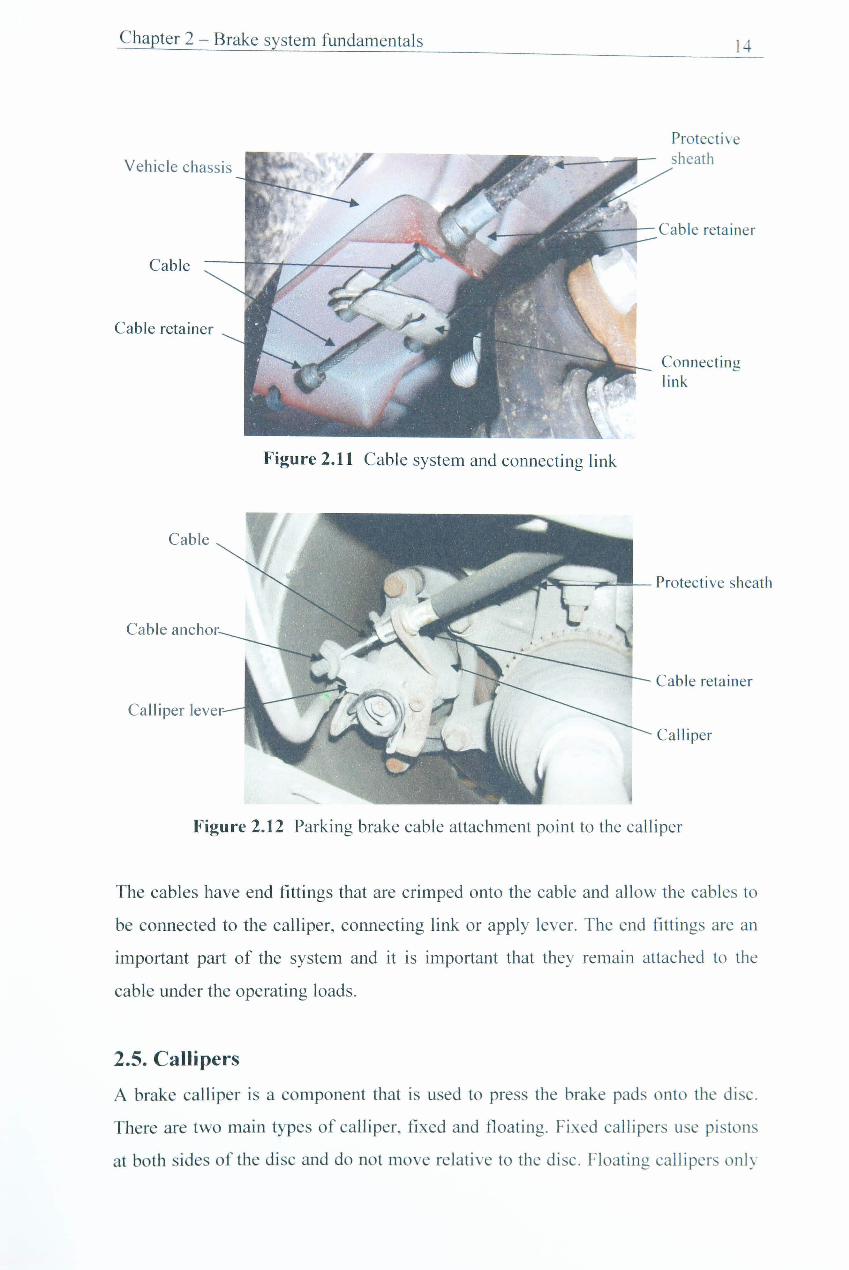
The cables are connected together using a connecting link, also known as a yolk,
which transmits load and displacement from the apply lever to the callipers. A
photograph of the cable system and connecting link from the Jaguar S-Type is
shown in Figure 2.11. A photograph of the cable attachment point to the calliper is
shown in Figure 2.12.
Chapter 2 - Brake system fundamentals
Vehicle chassis
14
Protec tive sheath
---+-- Cable reta iner
Cable
Cable retainer
Figure 2.11 Cable system and connecting link
Cable
Cable ancho
Connecting link
Protecti ve sheath
Cable retainer
Calliper
Figure 2.12 Parking brake cable attachment point to the calliper
The cables have end fittings that are crimped onto the cable and allow the cables to
be connected to the calliper, connecting link or apply lever. The end fittings are an
important part of the system and it is important that they remain attached to the
cable under the operating loads.
2.5. Callipers
A brake calliper is a component that is used to press the brake pads onto the di sc.
There are two main types of calliper, fixed and floating. Fixed callipers use pi , tons
at both sides of the disc and do not move relati ve to the di sc. Floating calliper ' only
Chapter 2 - Brake system fundamentals 15
use pistons at one side of the disc. The hydraulic pressure in a floating calliper
forces the piston and pad towards the disc and also forces the floating part of the
calliper assembly in the opposite direction, which applies the opposite pad. Floating
calliper designs offer advantages over fixed callipers because they can be smaller
and easier to package inside the wheel. They have fewer leaking points and are
easier to bleed than fixed callipers. Floating callipers tend to exhibit more degrees of
freedom than fixed callipers and are therefore can be more prone to brake squeal.
A parking brake mechanism can be integrated into a floating calliper that is used to
apply the hydraulic brake. This type of calliper is known as an integrated calliper
and is generally used on the rear brakes. The parking brake uses a mechanical
actuation system, which can be operated independently from the hydraulic circuit.
The calliper has an external lever mechanism that is connected to the parking brake
cable system. The external lever is connected to an internal piston actuation
mechanism, which can be either an actuator screw or a push rod. When the parking
brake cable is displaced the actuator screw is rotated and a helical thread on the
screw attempts to tum the piston. The piston is constrained from rotation as it is
engaged with a notch on the brake pad, which results in the piston being displaced in
a normal direction to the disc pushing the pad into contact with the disc. A push rod
system has an adjusting cam connected to the calliper lever, which when rotated
displaces a connecting rod into the push rod component, which forces the piston to
apply the pad. This mechanism is commonly used by calliper manufacturers and has
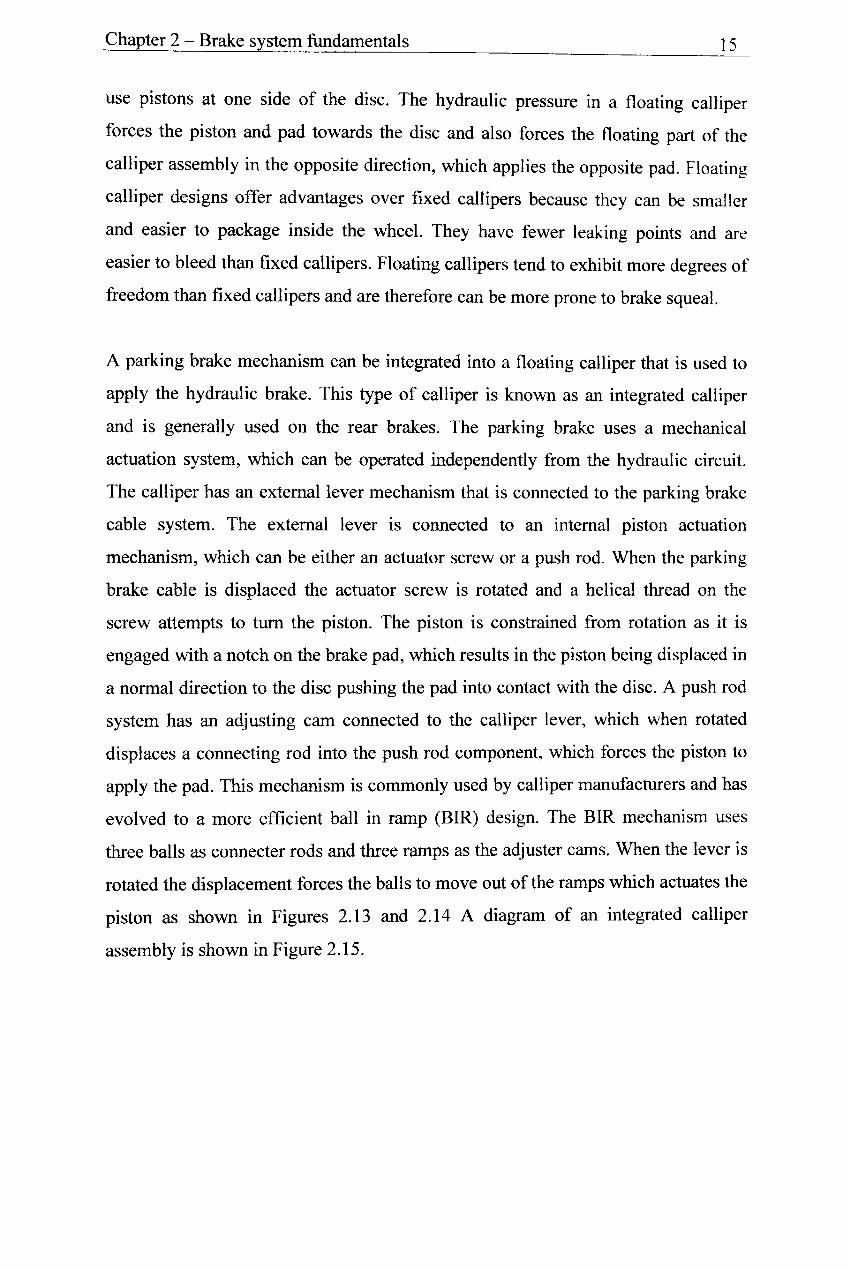
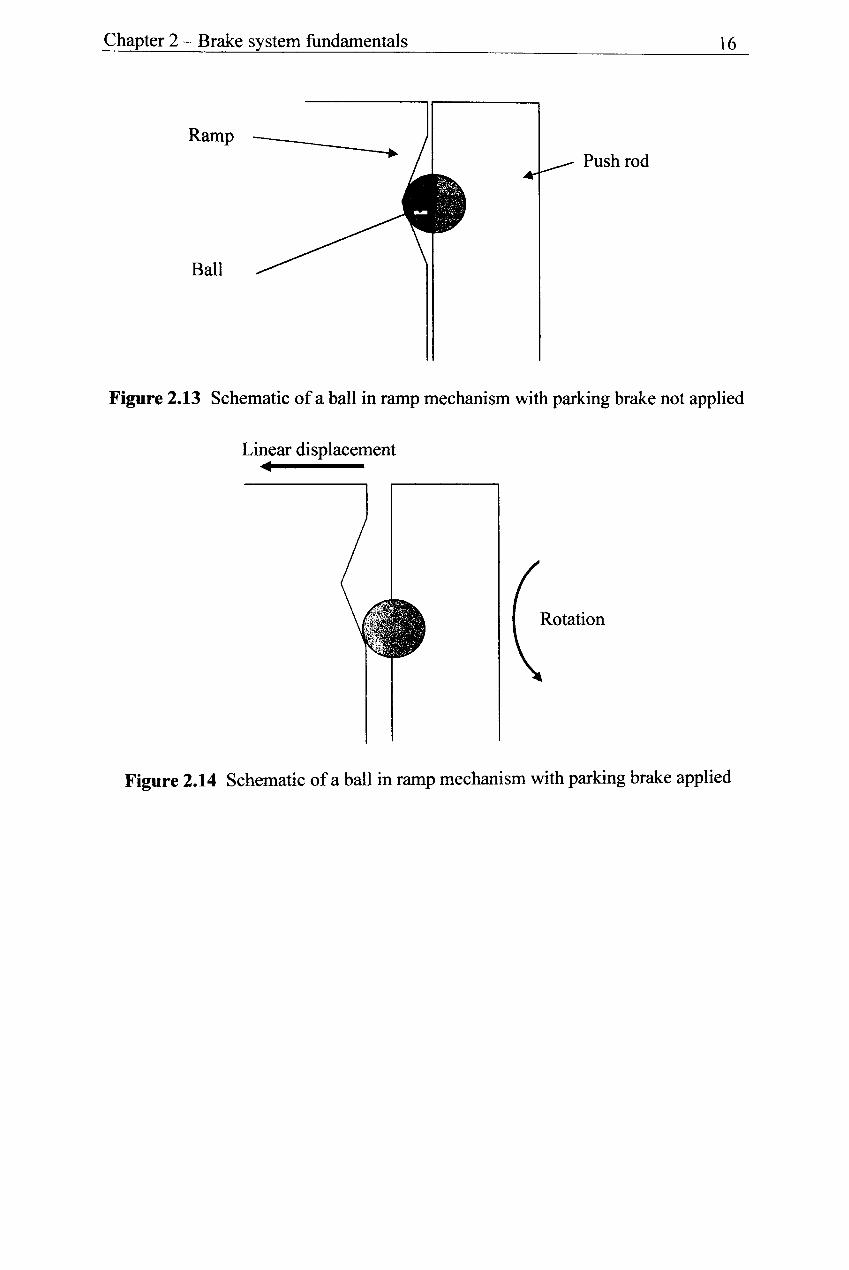
evolved to a more efficient ball in ramp (BIR) design. The BIR mechanism uses
three balls as connecter rods and three ramps as the adjuster cams. When the lever is
rotated the displacement forces the balls to move out of the ramps which actuates the
piston as shown in Figures 2.13 and 2.14 A diagram of an integrated calliper
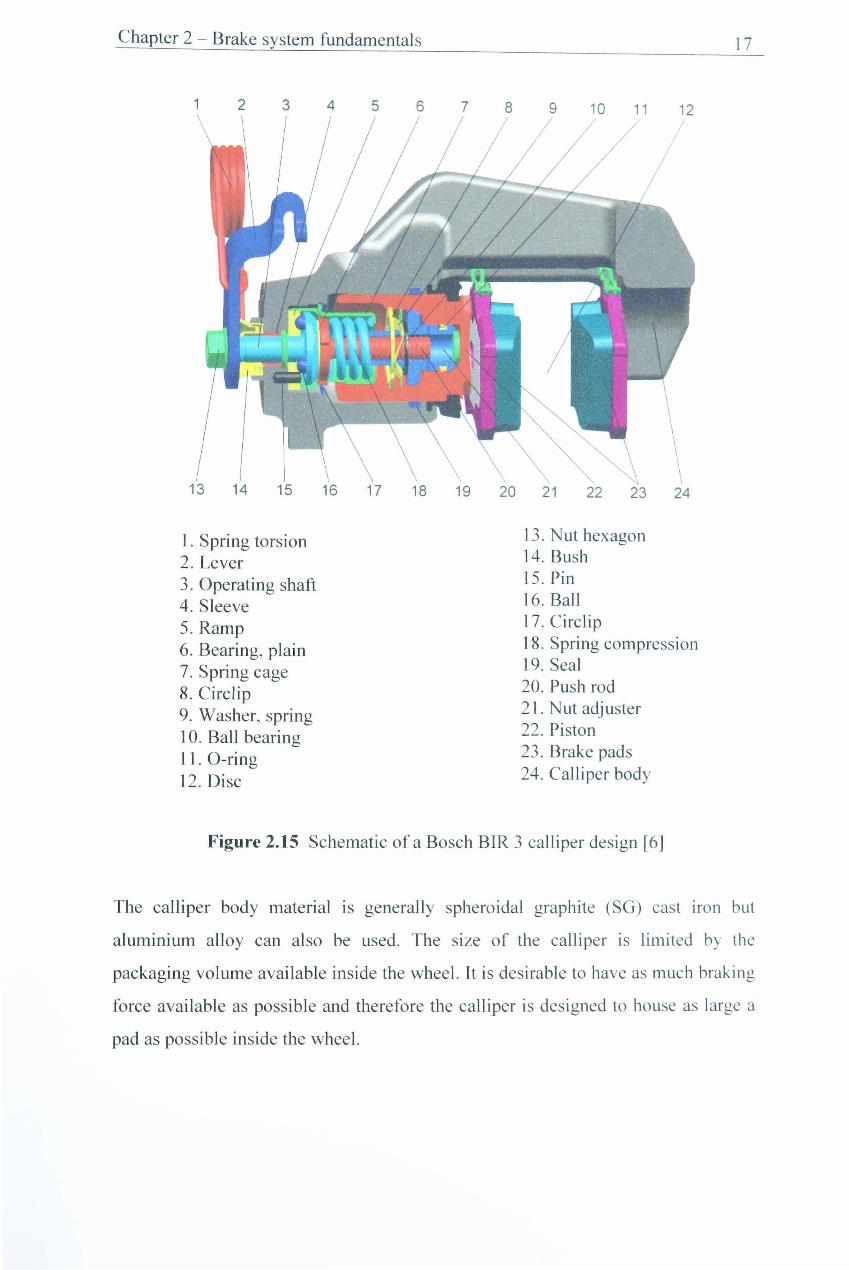
assembly is shown in Figure 2.15.
Chapter 2 - Brake system fundamentals 16
Ramp
Push rod
Ball
Figure 2.13 Schematic of a ball in ramp mechanism with parking brake not applied
Linear displacement •
Rotation
Figure 2.14 Schematic of a ball in ramp mechanism with parking brake applied
Chapter 2 - Brake system fundamentals
2 3 4 5 6 7 9 10 11 12
16 17 18 19 20 21 22 23 24
1. Spring torsion 2. Lever 3. Operating shaft 4. Sleeve 5. Ramp 6. Bearing, plain 7. Spring cage 8. Circlip 9. Washer, spring 1 O. Ball bearing 11. O-ring 12. Disc
13. Nut hexagon 14. Bush IS. Pin 16. Ball 17. Circlip 18. Spring compression 19. Seal 20. Push rod 21. Nut adjuster 22. Piston 23. Brake pads 24. Calliper body
Figure 2.15 Schematic ofa Bosch BIR 3 calliper design [6J
17
The calliper body material is generally spheroidal graphite (SO) cast iron but
aluminium alloy can also be used. The size of the calliper is limited by the
packaging volume available inside the wheel. It is desirable to have as much braking
force available as possible and therefore the calliper is designed to house as large a
pad as possible inside the wheel.
Chapter 2 - Brake system fundamentals 18
2.6. Pads
A brake pad is a key component found within a disc brake assembly. During a
deceleration or drag braking event the friction pair formed by the disc and pad
employ dynamic friction to generate in-plane force at the interface which in turn
manifests as a brake force in the tyre-ground plane which either slows the vehicle or
enables it to proceed at a constant velocity. The kinetic or potential energy, linked to
the vehicle forward motion is converted into heat at the friction pair interface and is
dissipated to the environment via the process of conduction, convection and
radiation. When a vehicle with an integrated parking brake is parked, the same
friction pair is required to hold the vehicle stationary through use of static friction
present at the friction pair interface. This process does not generate any heat as no
relative motion takes place between the pad and disc. However, the foundation brake
components may be at an elevated temperature as a result of earlier dynamic braking
events.
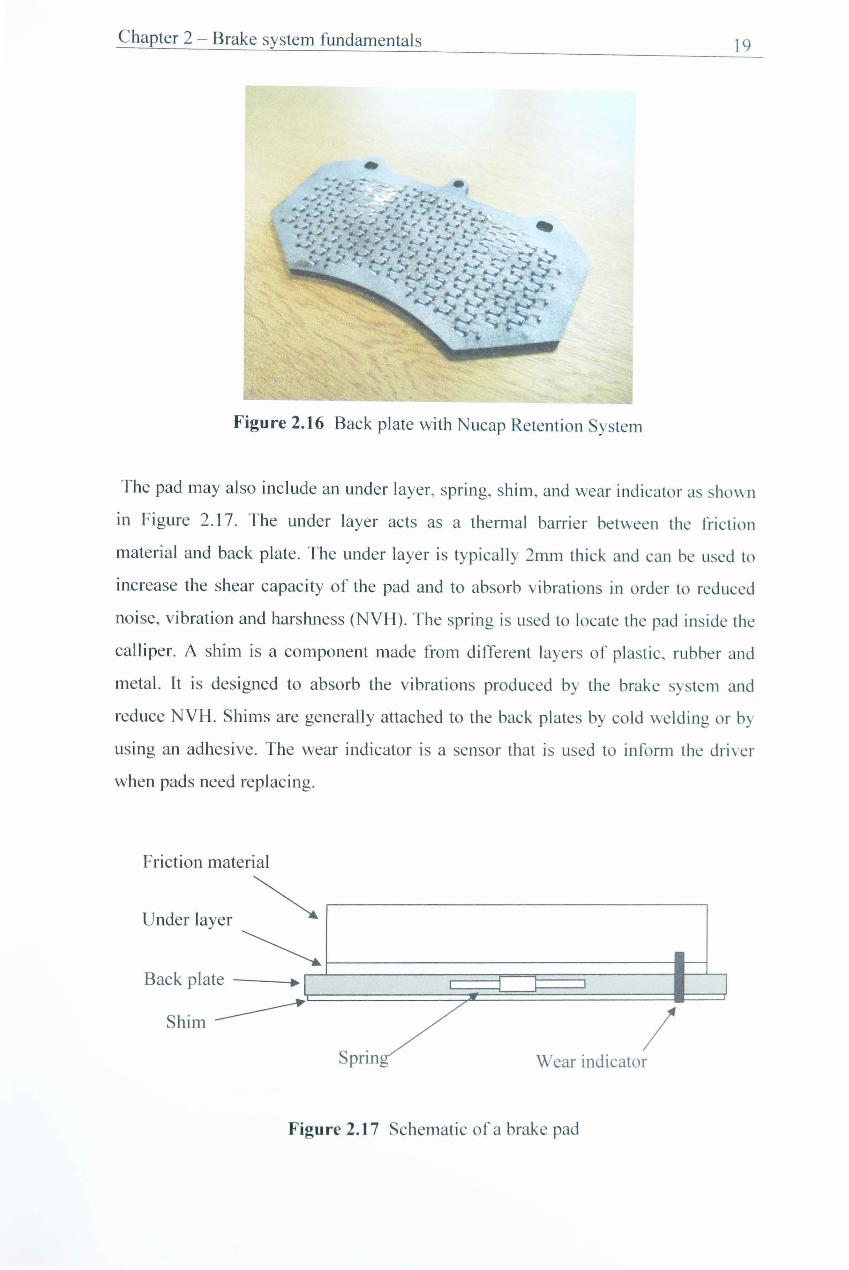
A typical commercial vehicle brake pad consists of a friction material mounted onto
a steel back plate. The friction material is generally fixed to the back plate by heat
resistant adhesive, but mechanical retention systems can also be used. Some back
plates have a mesh welded to them, which aids adhesion and shear properties. Back
plates can also use a Nucap Retention System (NRS), which uses a series of hooks
that protrude from the surface of the back plate, as shown in Figure 2.16. The NRS
aids the adhesion of the friction material to the back plate and reduces the need for
adhesives within the friction material.
Chapter 2 - Brake system fundamentals 19
•
Figure 2.16 Back plate with Nucap Retention System
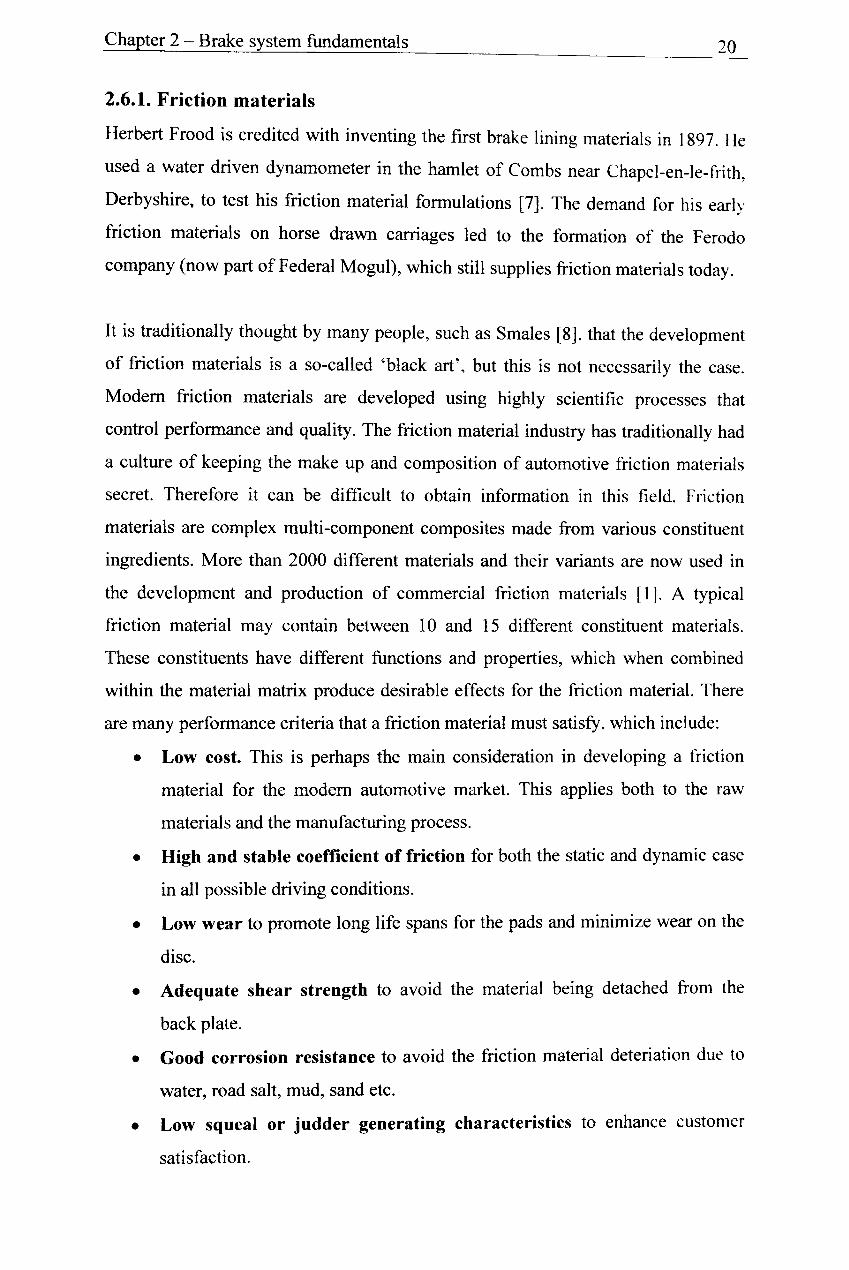
The pad may also include an under layer, spring, shim, and wear indicator as shown
in Figure 2.17. The under layer acts as a them1al barrier between the friction
material and back plate. The under layer is typically 2mm thick and can be used to
increase the shear capacity of the pad and to absorb vibrations in order to reduced
noise, vibration and harshness (NYH). The spring is used to locate the pad inside the
calliper. A shim is a component made from different layers of plastic, rubber and
metal. It is designed to absorb the vibrations produced by the brake system and
reduce NYH. Shims are generally attached to the back plates by cold welding or by
using an adhesive. The wear indicator is a sensor that is used to inform the dri ver
when pads need replacing.
Friction material
Under layer ~ ~
Back plate • r I
Shim~ SPrin7 / Wear indicator
Figure 2.17 Schematic of a brake pad
Chapter 2 - Brake system fundamentals 20
2.6.1. Friction materials
Herbert Frood is credited with inventing the first brake lining materials in 1897. He
used a water driven dynamometer in the hamlet of Combs near Chapel-en-Ie-frith,
Derbyshire, to test his friction material formulations [7]. The demand for his early
friction materials on horse drawn carriages led to the formation of the Ferodo
company (now part of Federal Mogul), which still supplies friction materials today.
It is traditionally thought by many people, such as Smales [8], that the development
of friction materials is a so-called 'black art', but this is not necessarily the case.
Modem friction materials are developed using highly scientific processes that
control performance and quality. The friction material industry has traditionally had
a culture of keeping the make up and composition of automotive friction materials
secret. Therefore it can be difficult to obtain information in this field. Friction
materials are complex multi-component composites made from various constituent
ingredients. More than 2000 different materials and their variants are now used in
the development and production of commercial friction materials [1]. A typical
friction material may contain between 10 and 15 different constituent materials.
These constituents have different functions and properties, which when combined
within the material matrix produce desirable effects for the friction material. There
are many performance criteria that a friction material must satisfy, which include:
• Low cost. This is perhaps the main consideration in developing a friction
material for the modem automotive market. This applies both to the raw
materials and the manufacturing process.
• High and stable coefficient of friction for both the static and dynamic case
in all possible driving conditions.
•
•
•
•
Low wear to promote long life spans for the pads and minimize wear on the
disc.
Adequate shear strength to avoid the material being detached from the
back plate.
Good corrosion resistance to avoid the friction material deteriation due to
water, road salt, mud, sand etc.
Low squeal or judder generating characteristics to enhance customer
satisfaction.
Chapter 2 - Brake system fundamentals 21
•
•
Good pedal feel and travel. Pads require an optimum stiffness to prevent a
spongy pedal feel, or a very stiff harsh pedal feel.
Conformance to the counter surface. The pad reqUIres a good
conformance to the counter surface in order to obtain unifonn heat
generation and wear.
• Dimensional stability is required so that the pad maintains its dimensions as
closely as possible before, during, and after a brake application.
2.7. Discs
A brake disc is a component that is attached to the wheel of a vehicle and used to
apply a torque to the wheel during a braking application. The most common material
for a disc brake is grey cast iron, although other materials such as carbon ceramic
composites and aluminium-based alloys can also be used. The design of brake discs
vary according to the vehicle manufacturer's specifications. Discs can be solid or
include extra features such as ventilation, groves, and drilled holes. The ventilation
in a disc enhances the dissipation of heat. The groves and drilled holes were
originally designed to release the gas produced at the friction surface on racing cars.
Modem friction materials are designed to release any gas through the pad and so
modem discs are grooved and drilled mainly for cosmetic reasons; although the
groves and holes can release trapped water when driving in wet conditions. They
also increase the wear rate of the friction material.
It is important that the disc surfaces are parallel with a constant thickness in order to
achieve a stable braking torque. Disc thickness variation (DTV) can result in the
brake producing cyclic variations in torque output. Forces can be induced by the
torque variations which can be felt by the driver in the form of a 'judder' on the
steering wheel or inside the vehicle cabin.
Chapter 3 - Literature review
3.1. Introduction
Chapter 3
Literature Review
22
Vehicle rollaway has received little reported attention in industry and in the world of
academia. The competitive nature of the automotive industry along with the fact that
manufacturers do not wish to highlight potential problems with their products has
meant that the only published research on rollaway has been co-written by the
author of this thesis [9] and [10]. The first paper [9] describes the development of a
rollaway dynamometer facility along with a simple mathematical model of a
rollaway event. The model predicted that by reducing the thermal expansion
coefficients of the brake pads and disc, the vehicle would be less likely to roll away.
The model had reasonable correlation with on-vehicle results but lacked the detail
required to fully understand the mechanisms involved during a rollaway event. The
mathematical model was improved and presented in [10]. The updated model
focused on the parking brake clamp force and was developed using analytical finite
element techniques. The model was validated against laboratory based dynamometer
results. The paper also describes a stick/slip phenomenon, which occurred prior to
the onset of ro II away. This indicates that an instability is present at the frictional
interface before the vehicle rolls away.
Since no additional literature is available on the subject of vehicle ro II away , the
remainder of this chapter will focus on topics related to rollaway such as parking
brake mechanisms, friction pair performance. experimental techniques and system
modelling.
3.2. Parking brake mechanisms
This section discusses published literature on parking brake mechanisms relevant to
this research project. A detailed description of each of the parking brake
mechanisms discussed is given in Chapter 2.
Harding et al [11] investigated instability in handbrakc performance which could
result in brake lock and in the shock loading of brake components. The research
Chapter 3 - Literature review
focused on leading/trailing shoe drum brakes with a strut operated hand-brake. The
experimental work was conducted on a vehicle and was complimented with
analytical results. The authors found that, in some circumstances, a trailing shoe
may operate as a leading shoe and actuate the opposite shoe via a reaction across the
strut. This was possible at nonnal levels of lining friction and can result in brake
lock and possible damage to components. The effect can be avoided by ensuring that
there is no initial ""heel and toe" contact on the trailing shoe, and by reducing the
lining arc at the trailing end. The instability effects were found to be more likely in
brakes with small diameters.
Elvenkemper [12] used Six Sigma tools to investigate the cause for high torque
output variations in a duo-servo drum park brake system. Six Sigma is a system of
practices used to systematically improve processes by eliminating defects. The
brake system investigated often failed the quasi-static test procedure simulating the
brake effectiveness of an un-bedded system under hill hold conditions. The torque
output values that he measured ranged between 450Nm and 1400Nm. He tested
three different friction material fonnulations on the parking brake system and found
that they all exhibited similar variation in measured torque output. The mean torque
output values for the three materials were different but the errors were so large that
it was difficult to distinguish between the perfonnances of the different pads.
Elvenkemper found that by changing the manufacturing process he could change the
measured torque output produced by the same friction material fonnulation. The
manufacturing process used in the study was not described. The pad grinding
process was changed and found to have no effect on the measured torque output.
Elvenkemper found that a more bedded rotor produced higher torque outputs than an
un-bedded rotor and that the grind radius of the linings had a significant effect on
the measured torque output. A thinner lining was found to produce higher torque
levels than a thicker lining of the same material. By virtue of their design the torque
output from a duo servo drum brake is extremely sensitive to changes in the friction
level between the lining and drum which could account for the reported variations.
Perkins [13] describes the operation of an electric parking brake (ErB) system. The
system described replaces the lever inside the cabin with an electronic s\\itch
connected to an electromechanical actuator. The actuator is attached to the parking
Chapter 3 - Literature review 24
brake cable system. The paper is lacking in technical detail and appears to be more
of an advertisement for the company sponsoring the research than an academic
reference piece. An alternative paper is put forward by Balnus [14] who gives a
review of current EPB systems. The EPB can be either a cable puller as described by
Perkins [13] or an integrated solution, which uses an electronic motor integrated
within the calliper design to apply the parking brake. Blanus describes the features
of the EPB and the customers' perceptions of such features. He explains that the
clamp force produced by the EPB is controlled by the vehicle's ECU, which is
supplied with information including brake temperature and road surface gradient.
This suggests that the EPB can be programmed to take rollaway into consideration
when parking and therefore eliminate the problem. Balnus explains that the EPB' s
will become more widespread in the future as they have numerous advantages over
manually operated parking brakes. The advantages are that the EPB can generate
higher clamp loads at the frictional interface without the need to apply a high input
load to a parking brake lever. The EPB does not require the cabin space necessary
for a parking brake lever, which can improve the interior styling of the vehicle and
reduce the need for strengthening of the vehicle floor. The EPB can reduce or
eliminate the need for packaging of cables within the vehicle.
3.3. Friction pair performance
The performance of the friction pair is the most important factor in the overall
performance of the brake system. This section discusses the friction level at the
frictional interface and the performance of the pads and disc. The friction material
used in the brake pad and the constituent ingredients of the friction material are
discussed as they have a significant influence on the performance of the brake. The
build up of a boundary layer at the interface and the temperature of the components
can also affect the brake performance and are discussed in this section.
3.3.1. Friction material
The constituents used in a friction material can be separated into five main groups.
binders, fibres, abrasives, lubricants, and fillers. The role of each of these groups in
the performance of the friction material is discussed in Sections 3.3.1.1 to 3.3.1.5.
Chapter 3 - Literature review 25
3.3.1.1. Binders
The binder acts as a glue to hold the composite friction material together. Binders
form the major organic portion of all modem non-asbestos organic (NAO) friction
material formulations, usually representing anywhere between 25 - 40% of the
component by volume, or around S - IS% by mass [IS]. The binder is critical to the
performance of NAO friction materials since, more than any other constituent, it
dictates the mechanical properties of the pad and in particular, the thermal load
capacity prior to failure. If insufficient binder is used, the material can be too weak
however if too much binder is used, there can be a drop off in friction at high
temperatures, known as fade.
Phenolic resins are typically used as the binding agent for automotive applications
[16]. Phenol resin is a type of polymer formed by a condensation reaction between
phenol and formaldenhyde. This condensation reaction may be initiated by acidic or
alkali catalysts, resulting in different classes of phenolic resins. For example,
phenolic resins produced using an acid catalyst and reacted with insufficient
formaldehyde are called novolac resins [17]. Novolac resins are often modified with
rubber to soften them and improve damping properties. The rubber content. type and
its dispersion within the matrix control the damping of the brake pad and
consequently contribute to one aspect of a formulation's propensity to generate
brake noise. Tribological effects of the resin components also have a strong
influence on brake noise. The rubber is used as a resin modification, a latex co
binder or as a binder for a premix. Anti-oxidants need to be compounded in with
most rubber-based systems. They can also be modified with other additives (Si, B.
P, Ti etc) to improve temperature stability.
Phenolic resins require heat to effect the cure, with processing temperatures between
lS0°C and 2S0°C. Overall resin content is determined by the granularity of the other
components in the formulation; the aim is to provide sufficient resin coverage for
mechanical integrity but not enough to fill all the voids in the matrix. Permeability
through the brake pad is important for controlling the oxidation at the friction
interface during high speed fade conditions. Cured, re-ground resin, called "friction
dust" is also used as a control on pad compressibility. Spurr [18] states that "friction
dust is generally based on a phenolic monomer which has a very long hydrocarbon
Chapter 3 - Literature review 26
side chain and makes the polymer rubbery". The friction dust assists In the
manufacture of the material, and improves its friction and wear behaviour.
Phenolic reSIns carbonise at approximately 450°C [19), and decompose at
temperatures above this by charring and evaporation. This decomposition produces
fumes that are likely to contain constituents which are poisonous. According to the
Occupational Health and Safety administration of the U.S. Department of Labour.
formaldehyde is classified as a human carcinogen that can cause nasal and lung
cancer, whilst phenol causes liver damage and blindness, amongst other effects that
are described in [17].
3.3.1.2. Fibres
Fibres are included in a friction material to maintain mechanical integrity in extreme
duty conditions. Jang et al [20] state that fibrous ingredients are primarily used to
provide mechanical strength, but they also directly affect the friction performance
because they contact the disc surface during braking. The mechanical influence of
the fibre content (elastic modulus, compressibility. flexural, compressive and
especially shear strength) is considered to be of greater significance than its
tribometric properties [21]. In order to impart these physical properties, a minimum
concentration of dispersed fibres is necessary such that fibre-overlapping is possible,
after which the pad properties are influenced by the following characteristics: [22]
• Fibre volume fraction
• Fibre orientation
• Fibre aspect ratio - influences matrix-fibre load transfer
• Fibre I binder adhesion - influences matrix-fibre energy transfer
• Fibre strength
• Fibre morphology I size - to minimize stress concentrations
Different fibres are usually selected in a friction material formulation as they
provide different properties. Carbon fibres provide high temperature stability of the
friction coefficient. aramid fibres improve strength and wear resistance, and glass
and ceramic fibres reduce the thermal conductivity [23]. Steel fibres, aramid
C'Kevlar") and various mineral fibres are common but Smales [8]. states that.
Chapter 3 - Literature review 27
"Kevlar is too expensive and can only be used in very lovv' concentrations". Glass
fibre is uncommon in friction materials used in conjunction with disc brakes as it
tends to melt on to the disc surface causing severe fade and NVH problems.
Friction material formulations used in conjunction with a disc can be classified into
three groups depending on the nature of the fibrous reinforcement. Formulations
without steel fibre, using instead both aramid and mineral fibres, such as potassium
titanate, are known as non-asbestos organic (NAO) friction materials. These
generally contain only small amounts of soft abrasives and produce typically very
low pad and disc wear with moderate temperature stability and integrity.
Formulations with up to 10% steel fibre are known as "Low Steel" formulations.
These have higher abrasive contents and are typically used for European vehicle
applications where high speeds and temperatures can be expected. Formulations
with high steel fibre or iron powder contents are known as "Semi-Metallics". These
formulations are generally resin, steel and graphite component formulations with
few other additives being used. Fade resistance, thermal conductivity and brake
noise is poor but pad and disc life is good particularly at high temperatures. Typical
applications are light trucks and Sport Utility Vehicles (SUV's) for the North
American market.
3.3.1.3. Abrasives
Bissett [23] explains that abrasive particulates are used within a friction material in
order to increase the general level of dynamic friction. Coarse particle sizes of hard
abrasives are generally not used due to the adverse effects on disc wear. Motor
racing pads are however the exception to this rule of thumb because the disc wear is
not of primary concern. The abrasive can be used to clean up the disc surface.
"Polishing" grades of alumina are common for general purpose pads. Hard sands,
such as zirconium silicate, are used in a range of sizes. Small amounts of hard
abrasives, such as fused alumina or silicon carbide are used to give "bite" to the
initial part of the brake application. Other common abrasives include chromia. silica
magnesia, and magnetite. Optimised formulations generally contain mixed abrasive
systems to get the best compromise between friction and wear.
Chapter 3 - Literature review 28
Different abrasives have optimum effects in different temperature zones. As the
temperature at the frictional interface increases, changes to the organic matrix result
in a lowering of friction, or fade, as a result of decomposition, or merely softening.
of the binder, [24]. Therefore friction material formulations typically contain several
different abrasives, each being effective at a particular temperature. A suitable hlend
of abrasives will result in a continuous but approximately constant friction level
throughout the required temperature range.
3.3.1.4. Lubrication
Lubrication content enables the engineer to maintain the balance between pad and
disc wear at an acceptable level without causing adverse effects on the friction
characteristics of the friction pair. Both natural flake and synthetic granular graphite
are in common use [23]. Controlling the ratio of these two types of graphite is a
useful strategy for controlling the compressibility of the pad. For lubrication at
higher temperatures, metal sulphides are used with molybdenum disulphide or tin
disulphide. Antimony disulphide has been used extensively in the past but is being
replaced due to environmental concerns.
Solid lubricants aid the formation of the third-body layer at the frictional interface
by breaking down alongside the softer matrix material. They provide frictional
stability over the range of operating temperatures experienced by the brakes. At
lower temperatures, materials such as graphite are most effective, while at higher
temperatures materials such as copper can be beneficial [24]. The effect of the
lubricant depends on the amount added and there is an optimum amount of lubricant
for different requirements. For example, the lubricants used in racing pad
formulations can be used to optimise the frictional stability at higher temperatures.
Lubricants are typically added in small amounts as they reduce the load bearing
capacity of the friction material.
3.3.1.5. Fillers
Fillers are generally low cost additives that are added in relatively high proportions
as bulking agents. They can also be used to enhance the performance of the friction
material. Since fillers can be added to relatively high inclusion levels. they can have
a significant effect on the performance of a friction material [24].
Chapter 3 - Literature review 29
Mineral powders are used as fillers mainly to reduce cost. However, they also have
important tribological characteristics in that they reduce wear by forming in-organic
glass. They influence the overall friction stability of the interface. The glass forming
nature ofbarytes (barium sulphate) is thought by Bissett [23] to playa major role in
the friction stability of NAO formulations. The addition of barites aids to reduce
high temperature wear and increase the density. Granular inorganic fillers, for
example mica or vermiculite, have strong synergistic effects with other formulation
components to influence friction and wear. Petroleum coke is also a common filler
often used in large amounts in brake pads. It has reasonable basic friction stability
and its porous nature helps gas flow thorough the brake pad under fade conditions.
It is available and used in a wide range of particle sizes. Hildred [25] states that,
"some fillers can also be utilised to help condition the pH levels in order to prevent
corrosive adhesion attack of the rotor". This is a reasonable assumption to make but
he does not present any evidence to quantify the reduced corrosion.
3.3.2. Friction level
Jang et al. [26] investigated the frictional characteristics of friction materials
containing different amounts of antimony trisulfide (Sb2S3 ) and zirconium silicate
(ZrSi04
). Antimony trisulfide is generally classed as a lubricant and zirconium
silicate is classed as a hard abrasive. They used a brake dynamometer with a single
piston floating calliper to conduct drag (constant speed) and stop (decreasing speed)
tests. They measured the change of the dynamic friction coefficient, torque variation
and the level of wear. They found that the friction level generally increased to a
temperature between 250°C and 350°C (depending on the formulation) and then
decreased for further increases in temperature. By increasing the level of ZrSi0.t
they found that the friction level increased and its variation with temperature also
increased. They found a formulation with lower ZrSi04 and increased levels of
Sb S had a lower friction coefficient which was stable with temperature. Jang et al. 2 3
attributed this to the lubricant which enables a third body layer to be fonned that
increases the friction stability. The third body layer reduces the effect of the hard
abrasives in the formulation which reduces the friction level.
Chapter 3 - Literature review 30
Tarr et al. [27] investigated the friction characteristics of phenolic reSin based
friction materials against grey cast iron as a function of normal load and
temperature. They used a single piston sliding calliper, a disc with a thermocouple
located at the centre of the wear track, semi-metallic and organic friction materials.
They calculated the friction coefficient by applying a constant hydraulic pressure in
the calliper, then increased the torque on the disc until rotation occurred. All the
tests were conducted after a "break-in" period, but no description of the break-in
(bedding) procedure is given. They found that the static friction force, F. obeyed the
following general equation:
Where:
F:::: j1Na(T)
F = static friction force (N)
f.l = static coefficient of friction
N = normal load (N)
a (T) = temperature dependant constant
(3.1)
With the value of a varying between 1.03 and 1.41 for the organic friction material
and between 1.10 and 1.37 for the semi -metallic friction material.
Jang et al. [28] investigated the effect of metallic fibres upon friction and wear
performance of various brake friction couples. They used a small-scale friction tester
with a hydraulic press to apply the normal load. A Labview data acquisition system
was used to record the test results. Samples of friction materials with dimensions of
2cm x 2cm x 1 cm were tested. They measured the dynamic friction level as a
function of temperature for friction materials containing copper fibres. low carbon
steel fibres and aluminium fibres against a grey cast iron rotor. The friction materials
containing copper fibres and steel fibres maintained a relatively constant dynamic
friction level. The friction material containing aluminium fibres showed a large
reduction of the friction level with increasing temperature. Jang et aI. report that this
is due to the softening of aluminium at temperatures above 200°C and that the
temperature at the interface can be much higher than the measured temperature
which can result in the aluminium fibres melting.
Chapter 3 - Literature review 31
3.3.3. Disc
Cast iron is a common material used in the design of brake discs. Mace et al [:2tJ]
explain that the graphite flake arrangement of grey cast iron microstructure provides
the high thermal conductivity requirements of brake discs, discussed in Chapter 2.
although with the brittle characteristics of cast iron. Therefore the design of cast iron
brake discs is a compromise between a thermally efficient design to reduce the
operating temperature and a design with a controlled tensile stress level to prevent
crack failure with as little mass penalty as possible.
Metzler [30] explains that, "the brake rotor has been steadily developed since the
first disc brakes were introduced in the late 50's". In his research he discusses the
development of cast iron brake discs. He explains that grey cast iron is the material
of choice for disc manufacturers due to its greater thermal conductivity, lower
modulus of elasticity and that it is thermally stable above temperatures of 500°C. He
found carbon and silicon carbide reinforced cast iron to be unsuitable due to the
""unacceptably high costs". He explains that the disc and pad manufacturers must
work together to develop the best materials combination.
3.3.4. Transfer films (third body layers)
Mace et al. [29] studied the effects of bedding in on grey cast iron brake discs to
identify causes of crack propagation and failure. They found that the disc undergoes
a light heat treatment during the bedding procedure which toughens the disc and
reduces the likelihood of cracking. They found the flake structure of carbon to be
unaffected by the heat treatment but the pearlite matrix breaks down under the high
interface temperatures. During the breakdown of pearlite, the carbon particles near
graphite flakes agglomerate around the latter, leaving large areas as ductile ferrite
around graphite/carbon couples which is thought to greatly increase the resistance to
crack propagation.
Wirth et al [31] present evidence which relates friction characteristics of the brake
pair to transfer film chemistry. They found that the friction characteristics of
asbestos free composites rubbing against grey cast iron were influenced hy the
composition of the transfer layer and to a lesser extent by the transfer film coyeragc.
Chapter 3 - Literature review
They found that, " the addition of black iron ox ide to the fri ction material destroyed
the transfer layer".
Wirth el al [32] studied the influence of friction material compositi on on transfer
film chemistry and film stability during rubbing of simpl e asbestos free fric tion
materials against grey cast iron. They used anal ytical scanning el ectron microscopy,
X-ray diffraction and X-ray photoelectron spectroscopy to study the characteri stics
of the transfer film. They found that the friction characteri stics of the pad fric tion
material against grey cast iron were influenced to a great extent by the composi ti on
of the transfer layer. The friction performance was found to be independent of the
transfer film thickness and transfer film topography.
3.3.5. Thermal effects
Okamura et al [33] studied the thermal behaviour of reverse vented di sc brakes with
varying geometries and discs both with and without holes in the neck. The ' neck' of
a disc brake is identified in Figure 3.1. They found that di scs with larger holes in the
neck cooled faster than discs with smaller holes. The di scs with smaller holes heated
up more quickly than those with larger holes and the di scs with larger holes
exhibited less coning than discs with smaller holes. They found that di scs with larger
offsets and thicker friction plates reduced coning.
Neck
~L
Wheel centre axis L __ L_ . _ . _ - - _ . I I
I
I ~ Offset
Figure 3.1 Location of the 'neck ' on a reverse vented brake di c
Chapter 3 - Literature review
Valvano et al [34] also looked at di sc coning using an analytical method to predict
the thermal distortion of brake discs. They modelled a disc with the cooling vein on
the inboard side of the disc as opposed to the outer side of the disc. known as reverse
vented discs, like the work conducted by Okamura et al [33]. Brake disc with the
cooling veins on the inboard side of the di sc are generally better at cooling the disc
than reverse vented discs due to the way the air flows over the di sc. Reverse vented
discs are generally better for reducing disc coning and stress in the disc due to them
having a longer top hat section. A diagram of an inboard vented disc brake is given
in Figure 3.2. The Jaguar S-Type uses an inboard vented brake di sc.
Wheel centre axis
Neck
~
- -+ - - - - - . -: I
I
I
I Offset -+; :44111---
Figure 3.2 Schematic of am inboard vented disc brake
3.4. Experimental techniques and testing methods
Newcomb and Spurr [35] explain that , " testing is abso lutely vital during the
development of a new friction material". They explain that the major difficulty in
brake friction material testing is to decide what the test conditions should be. Thi ' i.
because vehicles are driven over many different roads and teITain \vith \ aIy ing
conditions. The drivers of the vehicles also have "varyi ng ski ll and very different
temperament ".
Chapter 3 - Literature review 3..+
Dubensky [36] presented two experimental techniques that were used to measure the
brake rotor surface temperature and the pressure distribution on the rotor caused by
flexibility in the rotor and calliper mounting system. An inframetric 510 scanner
(thermal imaging camera) was used to obtain the temperature distribution in the
rotor and the images were calibrated against measurements taken from
thermocouples. He described the tests as requiring minimal preparation time. The
pressure distribution between the rotor and pad was measured using pre scale
pressure sensitive paper. The prescale paper provided a record of the pressure
distribution at the frictional interface for the static case. The results he obtained can
be used as inputs and validation tools for finite element models.
Fieldhouse et al [37] measured the dynamic centre of pressure during a braking
event to investigate how the centre of pressure affects noise generation. They
achieved this by embedding a pressure sensitive film within the pad. The pressure
sensitive film was bonded to a smooth pressure plate. A volume of friction material
was removed from the pad and the pressure plate was fitted into the recessed
volume. A volume of friction material was then used to fill the remaining recessed
volume to maintain the original pad geometry. The assembly is only capable of
recording the pressure distribution under one condition and therefore many repeat
tests are required to generate the pressure distribution as a function of different
brake parameters such as applied pressure and friction level. The authors found the
results to be dynamic and as a result the centre of pressure moves constantly as the
pad wears and pressure varies. Low brake pressures led to larger instabilities.
Harding et al [11] conducted handbrake instability tests and found their results to be
of a fugitive nature and non-repeatable. They describe the dynamometer tests as,
"not being a successful means of investigation", and their preferred experimental
method was on-vehicle tests. The main reason for the unsuccessful dynamometer
tests appears to be that the hand brake was actuated using air pressure or a hydraulic
system which produces different application characteristics to those produced by a
cable and lever system. Their work suggests that the complete parking brake apply
system is required for a successful dynamometer test program.
Chapter 3 - Literature review 35
Yuhas et al [38] used an ultrasonic measurement process to measure the spatial
variation of the ultrasonic velocity and attenuation of several brake pads. They
correlated the ultrasonic results to results obtained by conventional compressibility
tests to obtain the Young's modulus, shear modulus and Poisson's ratio of the pads
as a function of load. The influence of the steel back plate was removed so that the
results are only dependent on the friction material and under layer. In measuring the
elastic properties they found variations of more than 10% for samples of the same
friction material. They state that multiple measurements need to be taken to obtain
the sample average due to the variations encountered. They found reasonable
correlation between the results obtained through the ultrasonic measurement and
conventional compression tests. The elastic modulus was found to be dependant on
the applied normal load.
3.4.2. Legislation and industrial testing
The functionality of the parking brake system IS required to satisfy current
legislation and may also be required to meet additional standards specified by
vehicle manufacturers. ECE regulation 13H [39] specifies that vehicles at gross
weight must be capable of being held on a 20% hill with a maximum force of 400N
applied at the hand lever or SOON applied to the pedal. They also state that parking
brake must be capable of decelerating a vehicle from an initial speed of 30krnlh at a
rate of at least 1.5m1s 2 • These legislations ensure that the driver of the vehicle is
capable of applying the required force to park the vehicle. The current ECE
regulations do not include any parking brake tests that consider the phenomenon of
rollaway.
Vehicle manufactures have developed tests to ensure that their vehicles satisfy the
current ECE regulations [39]. Some vehicle manufacturers have also developed tests
to ensure that their vehicles do not roll away. This shows that vehicle manufacturers
are aware of the potential problem of rollaway. Ford has developed a parking brake
test to ensure that their vehicles satisfy current ECE regulations. The test requires
the vehicle to be parked on a 300/0 gradient by applying a load of 400N to the
parking brake lever and it is deemed to pass the test if the vehicle remains stationary.
The test does not take into account the temperature of the brake. Federal Mogul has
Chapter 3 - Literature review 36
developed a test that does take the brake temperature into consideration called the
Federal Mogul 20minute Hot Hill Hold test. The test requires the vehicle to be
parked on gradients of 30%, 160/0 and 12% with the disc at an initial temperature of
50°C, 100°C, 200°C and 300°C. The test requires the driver to apply the parking
brake until the vehicle is held on the gradient without the use of the foot brake. The
parking brake is then applied further until the next available notch on the ratchet
mechanism is engaged. The brake is then allowed to cool for 20 minutes. During this
time the driver of the vehicle estimates the magnitude of any movement of the
vehicle. If the vehicle moves more than 1m it is deemed to fail the test. The author
considers that the Federal Mogul Hot Hill hold test is better than the Ford test
because it considers the temperature of the brake; however it could be improved by
replacing the displacement estimates made by the driver with a sensor to record
displacement. The test could also be improved if the duration of the test was
extended to allow the brake to cool to ambient temperature rather than just 20
minutes of cooling. A summary of the Ford and Federal Mogul 20minute Hot Hill
Hold test procedures are given in Appendices A and B.
3.5. System modelling and simulation methods
3.5.1. Finite element modelling
Elvenkemper [12] produced a finite element model of a duo-servo parking brake
system. His model included the rotor and the brake linings. He used his model to
calculate the torque output produced by the parking brake system for varying
parameters. The parameters that were varied were the Young's modulus of the
friction material, the coefficient of static friction at the frictional interface and the
thickness of the friction material on the brake linings. He found that the Young's
modulus had a low influence on torque output. The friction material thickness had a
large effect on torque output with thinner materials producing a reduced torque
variation than thicker materials.
Liu et al [40] produced a finite element model of a brake pad in an attempt to reduce
high frequency brake squeal. The properties of the pad used in the model were
measured using ultrasound equipment. The results from the model \\"ere validated
against dynamometer results and were found to have. "e\:cellent correlation"". The
Chapter 3 - Literature review 37
FE model was simple and easy to build and modify with onlv the friction material
information required.
3.5.2. Friction pair modelling
Alesksendric et al [41] employed a neural network technique to predict the cold
performance of friction materials under prescribed testing conditions. The neural
network model is an excellent approach to modelling friction material performance.
In order for the model to function correctly a large amount of data is required to
setup the neural networks. The model must also employ a suitable learning
algorithm to simulate artificial intelligence. Aleksendric et al [41] investigated 15
different neural network architectures to establish which one would be best suited to
their model. They found that a one-layered neural network trained by a Bayesian
algorithm showed the best results. The model requires accurate data about the
friction material properties and so many sets of measurements are required to
characterise the materials to deliver a high level of statistical reliability which could
be a significant constraint of the model.
Busso et al [42] attempted to use a neural network technique to predict the
performance of friction materials. They encountered problems because some of the
input variables are categorical and could not be processed within the framework.
Instead they adopted a rules based ensemble learning approach which they
demonstrated to be a powerful tool for the design of friction materials. They showed
that their model was capable of predicting the performance of friction materials with
an error of less than 50/0 which is the same order as the dynamometer tests' intrinsic
deviation. The model allows the process of simplifying a mixture while maintaining
performance to be speeded up by reducing the number of experimental trials
required. This saves the friction material formulators both time and money. The
model presented is only designed to investigate frictional properties but it could be
extended to simulate properties such as wear and comfort.
A successful model of friction materials. such as the ones being developed b~
Aleskendric et al [41] and Busso et al [42]. would be a significant dc\dopment for
,-EEDS UNIVERSITY LIBRARY
Chapter 3 - Literature review 38
the friction material formulator. Although the model would not eliminate
experimental testing it would significantly reduce the number of tests required
saving both time and money.
Ostermeyer et al [43] developed a 3 dimensional surface topography model of a
brake pad. They state that, "Coulomb's friction law is good as a first approximation
but not realistic for brake systems", A theory was developed with the dynamic
interaction of friction and wear at the boundary layer. The dynamic friction law was
extended to a 3 dimensional cellular automation model to describe the surface
topography. The model includes hard particles in a softer matrix which when at the
surface of the pad change the local friction and the local temperature can reach over
I300C. The model takes into account growth and destruction of particles and when a
hard particle reaches the surface the wear next to the particle in the direction of disc
rotation is reduced due to the hard particle protecting the matrix. After a period of
time the hard particle is destroyed leaving a hill of softer matrix which exhibits high
wear until it is eventually smoothed.
3.6. Summary
The literature review conducted for this research has highlighted the need for work
on vehicle rollaway to be undertaken as there is currently no research available in
the open literature other than that previously presented by the author of this thesis.
The research on brake testing has highlighted the fugitive nature of the results and
that significant variations in the results can be common. The work conducted hy
Harding et al [11] suggests that the dynamometer for the present research should
include the complete parking brake system to fully replicate the on-vehicle system
configuration.
The investigation into friction material formulations has identified materials that
may have an effect on the friction level developed by the hrake. Jang et al [26] have
found that the addition of hard abrasives can increase the dynamic friction level of
the brake. This research can be used in this thesis to investigate if the addition of
hard abrasives can also increase the static friction level of a hrake as this can
influence the likelihood of rollaway.
Chapter 3 - Literature review 39
The third body layer developed at the frictional interface was found to influence the
friction level. Therefore bedding should be conducted for the test work in order to
generate a stable and consistent friction level in order to reduce variations in the
results.
Chapter 4 - On-Vehicle tests
4.1. Introduction
Chapter 4
On-Vehicle tests
40
To fully understand the phenomenon of vehicle rollaway it is important to observe a
rollaway event occurring on a vehicle parked on a gradient. The literature review in
Chapter 3 has highlighted the need for tests to be conducted on a vehicle to evaluate
the performance of a parking brake system under service operation conditions. This
chapter discusses the on-vehicle tests that have been conducted for this research on
two vehicles with parking brake systems believed to exhibit rollaway tendencies.
The author of this thesis was responsible for designing the test procedure. which is
described in Section 4.3. The test vehicles used for this research were driven by an
experienced Federal Mogul test driver with the author of this thesis in the passenger
seat overseeing the process and controlling the data logging equipment. The vehicles
and brake system components investigated in this chapter are discussed in Section
4.2. The test procedures used are discussed in Section 4.3 and the results are
presented in Section 4.4.
4.2. Vehicles and Components
This section describes the vehicles that have been used for this research along with
the different brake system components that have been investigated.
4.2.1. Vehicles
Two vehicles have been used for this research project that have integrated rear
callipers and are believed to exhibit rollaway. The main vehicle used throughout the
project is a Jaguar S-Type, shown in Figure 4.1. A Jaguar X-Type has also been
used to evaluate the performance of two different callipers that could not be installed
on the Jaguar S-Type. The original equipment (OE) installed on the Jaguar S-Type
has been used to characterise the performance of the parking brake system designed
by Jaguar. The OE parking brake system consists of the parking brake le\er. three
parking brake cables, a cable connecting bracket. two integrated callipers. t\\O sets
of brake pads and two discs. A diagram of the parking brake system layout is shown
in Figure 4.2. The parking brake lever has 11 notches on the ratchet Ilh:chanism to
Chapter 4 - On-Vehicle tests -+ 1
fix the cable displacement and an auto adjustment mechanism to reduce lack in the
cable. The parking brake cables are 3mm in diameter and are protected b) a
lubricated sheath. The length of the front (primary) cable is 1.04m and the t\\O rear
(secondary) cables are I .35m long. The cable connecting bracket. also kno\\ n a ' the
yoke, connects the cable from the parking brake lever, Cable 1. to the two cable
attached to the rear callipers, Cables 2 and 3, and transmits an equal load from Cable
1 to Cables 2 and 3. The rear callipers have an integrated parking brake mechanism
which uses a ball in ramp mechanism to apply the piston. The piston has a diameter
of 42.8mm and has a threshold pressure of O.5bar. The OE pads are manufactured by
Federal Mogul and are referred to as Pad I throughout this research. Pad 1 consists
of a 5.6mm thick steel back plate, a 2mm thick under layer and a friction material or 9.4mm thickness giving the pad a total thickness of 17mm. The dimensions of the
pad are given in Figure 4.3 . Three additional pads are assessed in the on-vehicle
tests and are described in Section 4.2.2. The disc is manufactured from cast iron and
has internal cooling vents. The dimensions of the disc are given in Figure 4.4 and a
cross sectional photograph of the disc is given in Figure 4 .5. The rubbing radius or
the centre of the pad on the disc is 125mm. A photograph of the Jaguar S-Type rear
brake assembly is shown in Figure 4.6. The gross vehicle weight of the Jaguar S
Type is I900kg. The rolling radius of the vehicle tyres is 317mm and the wheel base
dimensions are given in Figure 4.7.
, <
Jaguar S-Type used for the on-\ ehicle te t
Chapter 4 - On-Vehicle tests
I ~calliper
Pads Connecting link I
/ (yoke) I I
Cable 3 /: I
~ \ ~ Parking brake
Cable 2 Cable 1 lever
Rear axle of vehicle
Figure 4.2 Layout of Jaguar S-Type parking brake system
........... .... r-
50
5.;.....;. . ...:;...6 ---.. j. 4-; l:
2=--_ •• : ~
_9._4_~, •• : +-
j 17
;. .'
111
114
Figure 4.3 Dimensions of the Jaguar S-Type OE pad given in millimetres (not to
scale)
Chapter 4 - On-Vehicle tests
--.~ . ~
6.8 __ •• : ~
20
6.8
43
0 288
Figure 4.4 Dimensions of the Jaguar S-Type rear disc given in millimetres (not to
scale)
Figure 4.5 Cross section of Jaguar S-Type rear disc
Chapter 4 - On-Vehicle tests
Calliper
4.2.2. Pads
Figure 4.6 Jaguar S-Type rear brake
2909
4861
1544
1819
Figure 4.7 Jaguar S-Type wheel base dimensions [46]
Pad
Disc
Four different sets of brake pads have been investigated during the on-vehicle
evaluations which include the Jaguar S-Type OE pad (Pad 1) and three additional
brake pads, labelled Pads 2 to 4. Pads 2 to 4 were formulated and manufactured by
Federal Mogul to asses the effect of pad composition on rollaway propensity . The
friction materials used in Pads 2 to 4 were formulated from different constituent
ingredients from those used in the formulation of Pad 1. This was done to \ ary the
properties of the different pads to see if the performance of the vehicle yva atTected.
The propeI1ies of pads that were varied for thi s research include the ,tiJTness and
them1al expansion coefficient. The dimensions of Pads :2 to 4 are identical to the
dimensions of the OE pad shown in Figure 4.3.
Chapter 4 - On-Vehicle tests 45
4.2.3. Callipers
Three different sets of callipers have been used for the on-vehicle evaluations.
labelled Callipers 1 to 3. Calliper 1 is the OE calliper used in the Jaguar S-Type
parking brake system. Two additional callipers were selected. Callipers 2 and 3. to
compare the performance of different calliper materials and designs. Details of the
callipers used in this research are given in Table 4.1. The values giYen in the table
have been obtained from the work conducted by Ioannidid [44).
Calliper bridge 1 2 3 Manufacturer and TRW C48-20/10 BIR Bosch BIR3 Bosch BIR3 Model Material cast iron cast iron Aluminium Material density 7850 7850 2700 (kgm-3
)
Material Young's 200 200 70 modulus (GPa) Material thermal 10.8 x10⁻⁶ 10.8 x10---{) 22.2 x10⁻⁶
expansion coefficient (K- J
)
Calliper mass (kg) 4.25 3.5 2.2 Table 4.1 Details of the callipers used in the research
It was originally thought that the two Bosch callipers would be identical in design
but on inspection it was noticed that the designs were slightly different. The cast
iron calliper has fingers of 13mm thickness and the aluminium calliper has fingers
25mm thick. The varying calliper finger thickness could be due to the calliper
designer modifying the design to compensate for the varying material properties and
ensure that both designs had an equal stiffness. The aluminium calliper would be
preferable to vehicle manufacturers due to its reduced weight which will enhance
vehicle performance and minimise the un-sprung mass.
4.3. Methods
The on-vehicle test procedure used for this research was adapted from the Ford
parking brake and Federal Mogul 20 minute Hot Hill Hold test procedures that are
discussed in Chapter 3 and Appendices A and B. The test consists of heating the rear
brakes to a specified temperature by driving the vehicle on a test track and applying
Chapter 4 - On-Vehicle tests .+6
the brakes. Once at the correct temperature, the vehicle is driven onto the test
gradient and the parking brake lever applied to the point \\-here the vehicle is held on
the gradient without the use of the hydraulic foot brake. This is knO\\TI as the 'hold'
condition. The parking brake lever is then applied further until the next available
notch on the ratchet mechanism is engaged, known as the • park' condition. The
brakes are allowed to cool to a temperature 10°C above ambient and any movement
of the vehicle during this time is recorded. The vehicle is deemed to fail the test if it
moves more than 1 m down the gradient. The full test procedure used for the on
vehicle tests is given in Appendix C.
All of the on-vehicle tests were conducted at the Federal Mogul proving ground in
Derbyshire which has straight roads and gradients of 8%, 16.6% and 25%. All of the
surfaces were smooth tarmac and all tests were conducted in dry or slightly damp
conditions. Tests were conducted with the pads in a bedded and un-bedded
condition. The bedding procedure consisted of 200 brake stops with the vehicle
decelerating from 60kmlh to Okm/h with a constant brake pressure of 30bar applied.
The speed of the vehicle was measured using the vehicle's speedometer and the
brake line pressure was measured with a pressure sensor installed in line with the
hydraulic circuit. The temperature of the rear brakes was measured using two K-type
rubbing thermocouples located at the mean rubbing radius of the pad on the disc as
shown in Figure 4.8. The normal load applied to the parking brake lever was
measured using a load cell mounted between the parking brake lever and a handle
used to apply the load. The driver of the vehicle must pull the handle to apply the
parking brake and the load perpendicular to the parking brake is measured by the
load cell. A diagram of the parking brake lever. load cell and applying handle is
shown in Figure 4.9. A displacement transducer was used to measure the angle of
the parking brake lever. A photograph of the parking brake lever on the Jaguar S
Type is shown in Figure 4.10. Any movement of the vehicle during a rollaway test
was measured using a shaft encoder connected to one of the rear wheels. A
microphone was used to measure the sound pressure level (SPL) of any noise
associated with the test and was located on the passenger seat as sho\\TI in Figure
4.11. The SPL was filtered to record noise between 70dB and 500dB because any
noise below 70dB could not be distinguished from the background noise. All of the
Chapter 4 - On-Vehicle tests
recorded data was logged using a Federal Mogul data acqui siti on y tern in taIled in
the vehicle.
Pad
Disc
-- - ---
\
\
Them10couple position
Mean rubbing radius of pad
Figure 4.8 Position of the thermocouple on the disc
Direction of applied
load ------1 Applying handle -------••
Parking brake
lever ~
Side view
Appl ying
/handle
~----, Locating sc rew LO
Front view
fi x handle to parking brake
Parking brake lever
Load ce ll
Figure 4.9 Diagram of parking brake applying bracket
Chapter 4 - On-Vehicle tests
Parking brake applying handle and load cell
Displacement transducer
-+8
Parki ng ~~~~--f~------ brake I~\'e r
Figure 4.10 Parking brake lever with load cell and accelerometer attached.
Microphone
Figure 4.11 Microphone positioned inside the cabin
4.4. Res u Its
This section presents the results from all of the on-vehicle tests conducted a ' part or this research. The movement of the vehicle down the gradient recorded during all of
the on-vehicle tests can typically be described by one of four outcomes V\ hi ch are
summarized in Table 4.2. An example of each type of movement is shoV\n in
Figures 4.12 to 4.15 along with any noise associated with the movement. rhe
vehicle movement has been described by the four type of behavi our ' 0 that a
description of each on-vehicle test can be given without the need for a graphical
representation of every test.
Chapter 4 - On-Vehicle tests
Type
1 2 3 4
Description Example
No stick/slip, no noise, no rollaway Figure 4.1 J
Stick/slip, noise, no rollaway Figure 4.13 Stick/slip, noise, followed by rollaway Figure 4.14 Stick/slip, noise, followed by a period of movement, then Figure 4.15 stick/slip and noise continues, then rollaway
Table 4.2 DescnptlOn of the on-vehicle results
Noise --Movement
100 r ~ 1600
Q) 80 ... ::J 11)-lI)al 60 Q)"O ... -0..-
Q) 40 "0 > c Q)
::J ..J 0 20 en
0
1200
800
400
L..--__________ --.JI a
0 4 8 13 17
Time (minutes)
E E
...... ns c: Q) Q)
c: E .- Q) -I (.)
ns Q. VJ
is
.+9
Figure 4.12 Test type 1 - No movement no rollaway. Taken from the on-vehicle result for Pad 3 bedded facing up the 80/0 gradient with brake cooling down from
50°C.
I
I I
I
I l
The test result shown in Figure 4.12 indicates that the vehicle remained stationary
for the duration of the test with no movement or groan noise recorded. This is the
behaviour that is expected of a vehicle while parked and is designated Type 1. This
vehicle passed the rollaway test.
Chapter 4 - On-Vehicle tests
100
(I) 80 ~
:;, 1/)-I/)al
60 (1)"0 ~ -0.-
(I)
40 "0 > c: (I) :;, ..J 0 20 (J)
0
0 4
Noise - - Mo~ment
8 13 17 21
Time (minutes)
- 1600
25
-c: 1200 E
Q) (.) ev-
800 g. ~ 6-
400 ~
ev Q)
c: ..J
50
Figure 4.13 Test type 2 - Stick/slip, noise, no ro ll away. Taken from the on-vehicle result for Pad 2 bedded facing down the 8% gradi ent wi th brake cooling dO\-\ll from
SO°C.
The type 2 result shown in Figure 4 .13 shows that the vehic le began to move down
the slope with a stick/s lip motion. Some groan noise was associated with thi s
movement. The vehicle did not ro ll away in this case and it would have passed the
rollaway test as it did not move more than one metre.
100
~ 80 :;, 1/)-
:g!g 60 ~ -Q.Gi "0 > 40 c: (I) :;,..J
o 20 (J)
o o 8
Noise - - Mo~ment
17
Parking brake applied extra notch
25
Time (minutes)
- 1600 -c: (I) -
1200 E E (I) E (.) -
~ Q) Q,-
800 I/) .~ .- .r:. "0 Q) ~ >
400 ~ '0 c:
..J
~ 0
Figure 4.14 Test type 3 - Stick/slip, noise, fo llowed by rollaway. Taken from the on-vehicle result for Pad 1 bedded fac ing up the 8% gradient with brake cooling
down from 1 oooe.
The test type 3 result in Figure 4 .1 4 shows that the vehicle lowly mov d down the
gradient over a period of around 16 minute . The movement was a ti ckl' lip m )tion
Chapter 4 - On-Vehicle tests
and a low frequency groan noise was typicall y recorded during the slip e\ ents. After
a period of stick/slip movement the brake failed and the vehicl e began to accelerate
down the slope. After the vehicle had moved more than one meter the hand brake
lever was applied to the next notch on the ratchet mechanism and thi extra force
was sufficient to keep the vehicle stationary for the remainder of the test with no
additional movement or noise recorded.
Noise --Mo\€ment
100 1600 Q) E ~ 80 :J Parking brake 1200 E f/) -CD -f/)
Figure 4.15 Test type 4 - Stick/slip, noise, followed by a period of movement, then stick/slip and noise continues, then rollaway. Taken from the on-vehicle result for Pad] bedded facing down the 8% gradient with brake cooling down from lOOoe.
The type 4 result shown in Figure 4.15 shows that the vehicle slowly moved down
the gradient with a stick/slip motion and a groan noise was generated during the slip
event. After a period of stick/slip the brake failed and the vehicle began to accelerate
down the slope. After a short period of acceleration the vehicle slowed and stopped
without any input from the driver. The vehicle then continued to exhibit the
stick/slip motion with the groan noise until the brake failed again. This time the
vehicle continued to accelerate down the slope indicating that the brake had failed
completely. The handbrake lever was then applied an extra notch on the ratchet
mechanism and this was sufficient to keep the vehicle stationary for the remainder
of the test with no movement or noise recorded.
Chapter 4 - On-Vehicle tests 52
4.4.1. Performance of the OE parking brake system
Tests were conducted to characterise the perfonnance of the Jaguar S-Type OE
parking brake system. The tests were conducted on three different gradients of 8%.
16.6%, and 25% with the pads in a bedded and un-bedded condition. The gradients
were chosen because they were available at the Federal Mogul proving ground and
gradients of more than 250/0 are not typically found on public roads. The un-bedded
tests were conducted at a temperature of 50°C and 100°C. The temperature was not
allowed to go higher than this as it could have affected the properties of the un
bedded pads. The bedded pads were tested at temperatures of 50oe, loooe, 2000e and 300°C as these are temperatures that can be achieved at the rear brakes by
nonnal vehicle usage. The tests were conducted with the vehicle facing up and down
the gradient because vehicles can be parked in either direction. The results using the
un-bedded pads are shown in Table 4.3 and the results using the bedded pads are
shown in Table 4.4.
Grad Temp Direction Hold Notch Park Notch Result Time Result (%» (OC) (N) (No) (N) (No) (min:sec) type 8 50 Up 170 3 180 4 Held ')
~
8 50 Down 170 3 180 4 Held 2 16.6 50 Up 230 4 230 5 Rolled 03:35 3 16.6 50 Down 220 4 230 5 Rolled 17:06 3 25 50 Up 290 6 320 7 Held I 25 50 Down 280 5 280 6 Held 2 8 100 Up ]50 3 2]0 4 Rolled 18: 17 3 8 100 Down 140 3 190 4 Held 1 16.6 100 Up 180 4 210 5 Rolled 05:00 3 16.6 100 Down 180 3 200 4 Rolled 01 :02 4 25 100 Up 240 5 260 6 Rolled 00:31 3 25 100 Down 250 5 290 6 Rolled 09:29 3
Table 4.3 Un-bedded results for Jaguar S-Type OE pad (Pad I)
Chapter 4 - On-Vehicle tests 53
Grad Temp Direction Hold Notch Park Notch Result Time Result (%) ee) (N) (No) (N) (No) (min:sec) type
8 50 Up 170 3 190 4 Held 2 8 50 Down 140 3 180 4 Held 1
16.6 50 Up 200 5 270 6 Held 1 16.6 50 Down 190 4 230 5 Held 1 25 50 Up 240 5 260 6 Rolled 03:50 3 25 50 Down 210 5 270 6 Held 1 8 100 Up 150 3 190 4 Rolled 08:05 3 8 100 Down 150 3 190 4 Held 1
16.6 100 Up 230 5 260 6 Rolled 05:45 3 16.6 100 Down 170 3 180 4 Rolled 01:00 4 25 100 Up 280 6 330 7 Rolled 04:00 3 25 100 Down 200 5 270 6 Rolled 08:00 3 8 200 Up 160 3 190 4 Rolled 05:45 3 8 200 Down 160 3 200 4 Rolled '1
16.6 300 Up 260 5 270 6 Rolled 09:50 3 16.6 300 Down 220 4 250 5 Rolled 11 :25 3 25 300 Up 350 7 380 8 Held 2 25 300 Down 280 5 300 6 Rolled 12:40 3
Table 4.4 Bedded results for Jaguar S-Type OE pad (Pad 1)
The results in Table 4.3 and 4.4 show that the vehicle rolled away on all of the
gradients tested with the pad in both a bedded and un-bedded state. The results
suggest that the vehicle was more likely to roll away with an increased test
temperature. This is because the pads and discs will undergo a greater amount of
thermal contraction as the brake cools. The amount of excess applied force that was
required to move the parking brake lever from the 'just hold" to the 'park' condition
had an influence on the likelihood of rollaway occurring. The higher the amount of
excess force that was applied, the less likely the vehicle was to roll away as the
excess stored load could compensate for the load lost due to the thermal contractions
of the brake components.
The only condition in which the vehicle held consistently was the 80/0 gradient with
the brakes cooling from 50°C. This could be due to the small amount of thennal
Chapter 4 - On-Vehicle tests 54
contraction occurring in the pads and disc, and also that there is only a small amount
of brake torque required to hold the vehicle on this gradient.
4.4.2. Rollaway propensity as a function of friction pair
Tests were conducted on the Jaguar S-Type with Pads 1 to 4 installed in bedded and
un-bedded conditions. All of the tests were conducted on an 80/0 gradient with the
vehicle facing both up and down the slope. The 8% gradient was chosen as it
required the least amount of applied load to achieve the 'hold' condition. This
reduced variations in the measured loads and enabled the 'hold' and 'park' loads to
be recorded more accurately. The 80/0 gradient also produced the lowest levels of
force down the incline thereby reducing the acceleration of the vehicle and giving
more detailed stick/slip results. The results from the four different friction materials
are shown in Tables 4.5 to 4.12.
Grad Temp Direction Hold Notch Park Notch Result Time Result (%) eC) (N) (No) (N) (No) (min:sec) type 8 50 Up 120 4 150 5 Held 2 8 50 Down 120 4 150 5 Held 1 8 100 Up 140 3 140 4 Rolled 11 :56 4 8 100 Down 130 3 140 4 Rolled 09:33 3
Table 4.5 Un-bedded results from Jaguar S-Type OE pad (Pad 1)
Grad Temp Direction Hold Notch Park Notch Result Time Result (0/0) (OC) (N) (No) (N) (No) (min:sec) type 8 50 Up 110 3 130 4 Held 1
8 50 Down 90 2 100 3 Rolled 03:29 3
8 100 Up 100 3 130 4 Held 1
8 100 Down 90 3 140 4 Held 1
8 200 Up 90 2 100 3 Rolled 03:03 3
8 200 down 100 2 100 3 Rolled 03:42 3
8 300 Up 110 3 150 4 Rolled 12:00 4
8 300 Down 120 3 150 4 Held 2
Table 4.6 Bedded results from Jaguar S-Type OE pad (Pad 1)
Grad Temp Direction Hold Notch Park Notch Result Time Result (0/0) (OC) (N) (No) (N) (No) (min:sec) type
Grad Temp Direction Hold Notch Park Notch Result Time Result (%) (OC) (N) (No) (N) (No) (min:sec) type 8 50 Up 120 3 130 4 Held ') -8 50 Down 120 3 140 4 Held .., .
i
8 100 Up 130 3 140 4 Rolled 23:25 ., j
8 100 Down 120 3 150 4 Held .., :
8 200 Up 110 3 150 4 Rolled 06:32 4
8 200 Down 110 2 120 3 Rolled 01:40 3
8 300 Up 100 3 150 4 Rolled 08:06 ., j !
8 300 Down 130 3 170 4 Rolled 01 :38 3
Table 4.8 Bedded results from Pad 2
Grad Temp Direction Hold Notch Park Notch Result Time Result (0/0) (OC) (N) (No) (N) (No) (min:sec) type 8 50 Up 150 4 200 5 Held 1
8 50 Down 110 3 130 4 Rolled 12:49 3
8 100 Up 140 4 180 5 Held ..,
8 100 Down 120 3 140 4 Rolled 14:35 3
Table 4.9 Un-bedded results from Pad 3
Grad Temp Direction Hold Notch Park Notch Result Time Result (%) (OC) (N) (No) (N) (No) (min:sec) type
8 50 Up 130 3 140 4 Rolled 03:40 3
8 50 Down 150 5 180 5 Held 1
8 100 Up 140 3 150 4 Rolled 16:30 3
8 100 Down 130 3 150 4 Rolled 12: 19 4
8 200 Up 130 3 150 4 Rolled 18:07 4
8 200 Down 130 3 160 4 Rolled 22:40 3
8 300 Up 180 4 200 5 Held ')
8 300 Down 170 4 230 5 Held 1
Table 4.10 Bedded results from Pad 3
Grad Temp Direction Hold Notch Park Notch Result Time Result
(%) (OC) (N) (No) (N) (No) (min:sec) type
8 50 Up 80 2 80 3 Rolled 05:14 4
8 50 Down 90 2 100 3 Rolled 01:29 3
8 100 Up 110 3 140 4 Rolled 20:43 3
8 100 Down 100 2 100 3 Rolled 05:27 4
Table 4.11 Un-bedded results from Pad 4
Grad Temp Direction Hold Notch Park Notch Result Time Result
e/o) (OC) (N) (No) (N) (No) (min:sec) type
8 50 Up 100 3 130 4 Held 1
8 50 Down 100 2 110 3 Held 2
8 100 Up 100 3 140 4 Held 1
8 100 Down 120 3 150 4 Held I
8 200 Up 90 2 110 3 Rolled 02:59 3
8 200 Down 110 2 120 3 Rolled 02: 18 3
8 300 Up 130 3 150 4 Rolled 17: 10 3
8 300 Down 120 2 120 3 Rolled 03:12 3 !
Table 4.12 Bedded results from Pad 4
Chapter 4 - On-Vehicle tests 56
The results from the on-vehicle friction pair tests show that rollaway occurred for all -'
of the four different pads. No significant variation between the pads was observed
and therefore conclusions cannot be made as to which pad formulation performed
the best.
The results did not show evidence that the pads performed differently if they were in
a bedded or un-bedded condition and rollaway occurred for both conditions. The
results show that the temperature of the brake did not have a significant eiTect on the
results and that rollaway could occur at all of the temperatures tested.
The results illustrate that rollaway cannot be prevented by changing the friction
material formulation within the range specified for these tests. This could be because
the pads do not have a significant effect on rollaway or because the properties of the
pads used during this test are within the range that can lead to rollaway.
4.4.3. Rollaway propensity as a function of calliper design
A Jaguar X-type was used to evaluate the performance of Callipers 2 and 3 because
they would not fit onto the Jaguar S-type. The 20mm thick vented disc that was used
on the Jaguar S-Type could not fit inside callipers 2 and 3 and so a solid disc of
12mm thickness was used. The calliper tests were conducted with the OE friction
material formulation (Pad 1) installed. All the tests were conducted on a 16.60/0
gradient with the vehicle facing down the slope and the brake at an initial
temperature of 300°C. The 16.60/0 gradient was used because the 8% gradient was
not available at the time of the test due to maintenance work and the 250/0 gradient
would provide less accurate hold and park loads and recorded stick/slip movements
due to the higher accelerations down the slope. All of the tests \vere conducted with
the vehicle facing down the slope as this was the easier direction to park due to the
layout of the test circuit. An initial brake temperature of 3000e \vas chosen as this
would produce the highest level of thermal contraction of the brake components.
All of the tests followed the procedure described in Section 4.3. The test was
repeated three times for each calliper and the results are shown in Tables 4.13 and
4.14.
Chapter 4 - On-Vehicle tests 57
Grad Temp Direction Hold Notch Park Notch Result I Time Result i (0/0) (OC) (N) (No) (N) (No) , (min:sec) type I
16.6 300 Down 200 2 220 3 Rolled 13:54 3 l 16.6 300 Down 230 3 240 4 Rolled 03:00 3 16.6 300 Down 170 3 200 4 Rolled 05:30 ~
-' . Table 4.13 Results usmg CallIper 2 .
Grad Temp Direction Hold Notch Park Notch Result Time Result (%») (OC) (N) (No) (N) (No) (min:sec) type 16.6 300 Down 190 2 190 3 Rolled 01 :30 3 16.6 300 Down 190 2 200 3 Rolled 02:15 3 16.6 300 Down 190 3 230 4 Held 1
Table 4.14 Results usmg CallIper 3.
The results show that the vehicle rolled away with both callipers installed. The
vehicle rolled away for all of the tests using the cast iron calliper and rolled away for
two of the tests using the aluminium calliper. This suggests that the aluminium
calliper is less likely to cause rollaway under the test conditions. The load required
to 'just hold' the vehicle and to 'park' the vehicle was generally lower for the
aluminium calliper. The aluminium calliper has a higher thermal expansion
coefficient than the cast iron calliper which could affect the results. If the calliper
bridge is initially at an elevated temperature when the vehicle is parked then as the
calliper cools the thermal contractions of the calliper bridge will result in an increase
in the clamp load at the frictional interface. A higher thermal expansion would
produce a greater increase in clamp load as the calliper cools which could explain
why the aluminium calliper performed better than the cast iron calliper in the on-
vehicle tests.
4.5. Summary
The on-vehicle tests have proven the existence of a rollaway problem on the two
vehicles tested in this research. The vehicles both have an integrated parking brake
mechanism and it is believed that rollaway can potentially occur on any vehicle
using this type of parking brake system. A period of stick/slip motion \vas found to
occur prior to the onset of rollaway.
I I
Rollaway occurred on the vehicle with all of the different pads installed which
indicates that rollaway cannot be eliminated by changing the friction material
formulation within the range used for these tests. This suggests that rollaway may
Chapter 4 - On-Vehicle tests 58
not be prevented by the pads of friction material. It is more likely that rollaway is a
system problem and the additional parking brake components have a siunificant .....
effect on rollaway, which influenced the on-vehicle results. This highlights the need
for the parking brake components to be analysed and evaluated. It is not possible to
do this on the vehicle, and therefore a laboratory based dynamometer was required
to conduct further evaluations.
Rollaway was less likely to occur when a larger amount of excess load was applied
going from the 'just hold' condition to the 'park' condition. This is because the
excess energy stored in the parking brake system is used to overcome the lost force
from the thermal contractions of the pads and disc. The amount of excess load is
dependant on the position of the handbrake notch relative to the "just hold'
condition. If the 'just hold' condition is close to the next notch on the ratchet
mechanism a low lever of excess force will be applied. If the 'just hold' condition is
a long way from the next notch on the ratchet mechanism then a larger amount of
excess force will be developed. The level of excess force could generally be
increased if the number of notches on the ratchet mechanism was reduced. For
example if there were only two notches on the ratchet mechanism it would be
unlikely that the 'just hold' condition would be close to the next notch, and therefore
a large amount of excess force would be applied reducing the likelihood of rollaway
occurring. This may however result in poor handbrake feel and would be
undesirable to the driver.
Rollaway was found to occur on all of the gradients tested in the evaluations. The
results suggested that rollaway was more likely to occur with an increased brake
temperature, but could also occur with lower temperatures. This is due to the higher
thermal contractions of the pad and disc for the higher temperatures. Ho\vever a
small contraction can be sufficient to cause rollaway if the . park . load is close to the
"just hold' load.
The on-vehicle tests have been successful in establishing the existence of the
rollaway phenomenon on vehicles using an integrated rear calliper. To understand
the mechanisms involved during a rollaway event further work was required to
Chapter 4 - On-Vehicle tests 59
characterise the behaviour of the parking brake components. To achieve this further
laboratory based testing was required.
Chapter 5-Development of a Rollaway Dynamometer Experimental F acilitv 60
Chapter 5
Development of a Rollaway Dynamometer Experimental Facility
5.1. Introduction
A brake dynamometer is a testing machine that can be used to evaluate the
performance of vehicle brakes. Typical dynamometers use an inertia flywheel to
simulate the momentum of a moving vehicle and use the brakes to decelerate the
flywheeL For this research, a dedicated dynamometer was required to assist in the
characterisation of the behaviour of the parking brake system during a rollaway
event. A dynamometer representing the Jaguar S-Type's parking brake system was
available for use at the University of Leeds. The original machine was designed and
produced by Mckinlay et al [2] as part of a fourth year MEng project. A detailed
description of the design process used to develop the dynamometer is given in [2].
The dynamometer that was developed for this project differs from a typical design in
that it does not decelerate inertia flywheels. Instead it employs a dragging method to
heat the brakes.
This chapter discusses the process of developing the dynamometer facility to meet
the demands of the current project. The operation and functionality of the original
dynamometer facility that was developed during the fourth year MEng project are
discussed in Section 5.2. The specifications of the dynamometer that were required
for the current project and the work conducted to modify the existing dynamometer
to meet these requirements are discussed in Section 5.3. A dedicated control and
data acquisition system was developed for the dynamometer and is discussed in
Section 5.5. Upon completion of the dynamometer modifications, commissioning
tests were conducted to demonstrate the functionality of the test facility and ensure
that the dynamometer satisfied the project specifications. These tests are discussed
in Section 5.8.
5.2. Description of the original dynamometer
The original dynamometer facility was separated into two main sections. the drive
rig and the apply rig. A description of each section is given below.
Chapter 5-Development of a Rollaway Dynamometer Experimental Facility 61
5.2.1. Drive rig
The drive rig housed the brake components from the vehicle including the two rear
discs, two rear drive shafts, two spider mounting brackets (rear uprights). calliper.
pads, the parking brake cables and apply lever. The drive rig also housed an electric
motor, bearings to support the axle, a torque wheel used to apply a torque on the
axle, an extraction system, a pneumatic actuator connected to a hydraulic actuator
and hydraulic brake lines. A diagram of the drive rig layout is sho\VTI in Figure 5.1
and photographs of the drive rig components are shown in Figures 5.2 and 5.3 .
The result in Figure 5.15 proved that the dragging method used on the dynamometer
is capable of heating the brakes to a specified temperature. The maximum
temperature that was achieved during the test was above 250°C as it took a short
period of time to reduce the brake pressure to zero. The rate of heating is dependant
on the speed of disc rotation and the brake line pressure which is controlled by the
operator. With the current configuration the heating rates are prone to variations due
to operator variability, which could significantly influence the test results. The
requirements for the research state that the rollaway tests should be automated in
order to eliminate any variations produced by the operator and so the manual
controllers were deemed to be unsuitable.
5.4.2. Application of a specified constant torque
The hydraulic actuator used to apply the torque failed during the final stage of the
level four MEng project [2] and did not function at the start of this project. The
actuator was stripped, cleaned and the seals replaced before the preliminary tests
commenced. Once working, the hydraulic actuator was found to produce operating
pressures exceeding those required for the rollaway tests. After discussions with
Airdale Tubes and Fittings Ltd, it was decided that a pressure reducing valve,
installed in line with the hydraulic circuit, would enable the required pressure levels
to be developed. This work was carried out and enabled the preliminary torque
measurement test to be conducted. The load in the cable produced by the hydraulic
actuator was measured using a Graham and White DSCRA 20kN load cell in line
with the cable system. The measured cable force was multiplied by the radius of the
large pulley wheel to calculate the applied torque on the dynamometer axle. The
measured torque during a preliminary test is shown in Figure 5.16.
Chapter 5-Development of a Rollaway Dynamometer Experimental Facilit\
400 350
-- 300 e z 250 '-'
~ 200 = E" 150 0
Eo-- 100 50 0
0 500 1000 1500 2000 2500 3000 3500
Time (seconds)
Figure 5.16 Torque produced by the hydraulic actuato r ystem
It can be seen from Figure 5.16 that the torque fluctuated and generall y reduced over
time. The dynamometer is required to produce a constant torque over time to
simulate the vehicle parked on a gradient and therefore the torque appli cation
method was deemed to be unsuitable for the rollaway tests.
The test also highlighted a problem with the bracket used to attach the cab le to the
large pulley wheel , shown in Figure 5.4. The dimensions of the bracket re tricted the
cable from passing it on the large pulley wheel. Therefore the rotation of the
dynamometer axle was limited to one revolution which equates to a vehicle linear
displacement of 2m. The vehicle is deemed to fail a rollaway test if it moves more
than 1 m down the slope, but during the on-vehic le rollaway tests de cribed in
Chapter 4, the vehicle was found to exhibit a stickJs lip motion which could result in
the vehicle moving more than 2m down the slope. To capture this displacement the
dynamometer needs to be capable of simulating more than one revolution of the
large pulley wheel. The design of the bracket also meant that it was a\\ kward to
attach to the large pulley wheel which took more time than necessary . It 'v\as decided
that the original cable attachment bracket was not uitable for use on the
dynan10meter.
5.4.3. Actuating the parking brake
The parking brake on the original dynamometer was actuated using the Jaguar .'
T pe 's parking brake lever, shown in Figure 5.9. The lever fixed the cablc
Chapter 5- Development ofa Rollaway Dynamometer Experimental facilit\ 7~
displacement at one of eleven positions determined by the notche on the lever' ~
ratchet mechanism. A test was conducted to measure the cable load. and the clamp
load produced by the handbrake lever mechani sm. The cable load v,as measured
using the 2kN Novatech load cell described in Section 5.2 and the clamp load \\3
measured using a lOkN Novatecb load cell. The 10kN load cell was held inside the
calliper using two ball bearings fixed to back plates. The back plates had mall
indentations drilled into them to fix the position of the ball bearings and the 10kN
load cell was cylindrical with a hollow centre which enabled it to be held between
the ball bearings as shown in Figure 5.17. The back plates were used so that the
mechanism would fit inside the calliper. The results from the tests are shown in
Figure 5.18.
Calliper Pad back plate
.--+-+-+- 10kN load cell
Ball bearing
Figure 5.17 Layout of clamp load cell mechanism
Chapter 5- Development of a Rollaway Dynamometer Experimental Facility 7-+
12
10
- 8 z ..:.c: -"0 IV o
..J
6
4
2
o o 1 2
o Cable load _ Clamp load
3 4 5 6 7 8 9 10 11
Click on ratchet mechanism
Figure 5.18 Cable load and clamp load for each click on the Jaguar S-Type
handbrake mechani sm
The result in Figure 5.18 shows that the loads produced by the handbrake lever are
constrained by the location of the notches on the ratchet mechanism. This is a useful
result as it shows the operation of the vehic le parking brake, but it is not possible to
achieve a clamp load between the finite values set by the ratchet mechanism. This
does not comply with the requirements of the project that state the dynamometer
must be capable of producing a specified clamp load at the frictiona l interface. It
was decided that an alternative method of applying the clamp load would be
developed and used in conjunction with the parking brake lever.
5.5. Control and data acquisition system design and development
5.5.1. Introduction
A dedicated control and data acquisition (DAQ) system is the most significant
contributory component to the successful development of the dynamometer
experimental facility . This section discusses the design and development of the
system used on the rollaway dynamometer.
Chapter 5-Development of a Rollaway Dynamometer Experimental Facility 75
5.5.2. Hardware
National Instruments (NI) was chosen as the main supplier for the system hardware
due to the simple 'plug and play' type modules and the compatibility with the
system software. The NI modules allow data from the dynamometer to be streamed
quickly and reliably to a desktop PC with a 600MHz Pentium 3 processor, 392MB
of RAM and running Windows NT. The PC has aNI PCI-6040E card installed into
one of the PCI slots which connects the PC to aNI BNC-2090 rack module using a
68 pin cable. The rack module has BNC connectors and spring terminal blocks that
can read data from the dynamometer sensors and output signals to drive the
instrument controllers. Two K-type thermocouples are connected to the NI BNC-
2090 module via two AD595AD amplifiers to measure temperature of the brake
components. Rotation of the dynamometer axle is measured using a Hohoner
quadrature shaft encoder that is connected directly to the NI BNC-2090 module. A
NI SCXI 1000 chassis is connected to the NI BNC-2090 module via a 68 pin cable.
The NI SCXI 1000 chassis is a low noise chassis that can hold up to four SCXI
modules providing them with power and handling the signal routing between the
modules and the NI BNC-2090 module. The NI SCXI 1000 chassis has three
modules installed. A NI SCXI 1102 module is used to control the stepper motor
which applies the park brake cable on the modified dynamometer. A NI SCXI 1180
module is used to connect the stepper motor wiring to the NI SCXI 1000 chassis and
a NI SCXI 1121 module is used to amplify the signal from the four load cells on the
dynamometer. Two Novatech 2kN load cells are mounted between the parking brake
cable and the calliper attachment point to measure loads in the cable. A 10kN
Novatech load cell can be mounted inside the calliper to measure the clamp load. A
20kN Graham and White DSCRA load cell is positioned in line with the apply cable
to measure the torque on the dynamometer axle. An NI SCXI 1321 terminal block
module is used to connect the load cells to the NI SCXI 1121 module. An NI SCXI
1302 terminal block module is used to connect wires from the stepper motor to the
NI SCXI 1180 module. The NI SCXI 1302 module connects to a safety circuit and
stepper motor driver, which is used to drive the stepper motor. The Control
Techniques Mentor II DC drive which is used to control the Leroy Somer
LSK1604M04 45kW DC electric motor is connected to the BNC-2090 chassis and
controlled by the software outputs. The hydraulic pressure used to apply the brake is
Chapter 5-Development of a Rollaway Dynamometer Experimental Facilitv 76
controlled by a Hymid Hydraulics controller connected to the BNC-2090 module
and the pressure is measured using a Sensotec pressure sensor in line with the
hydraulic circuit. A diagram of the dynamometer hardware components is given in
Figure 5.19
Desktop PC
BNC-2090 SCX! 1000
Chassis chassis
PCI-6040E DAQ card === SCXIII02 Safety Stepper
Stepper circuit driver SCX! 1180 SCXl1302 ~ motor
SCXI 1121 SCXI 1321.t==n I I
IE 2kN load cell 2kN load cell
K-Type I 10kN load cdl Thermocouple 1:: amplifier K-Type I 20kN load cell
2xAD595AD
Quadrature encoder
To speed controller
To pressure controller
Figure 5.19 Schematic of dynamometer control and DAQ system hardware
5.5.3. Software
National Instruments LabVIEW is a graphical programming language that is widely
used throughout industry and academia. It uses a programming language called "G"
which allows the user to create block diagrams of the program rather than the
traditional text based code. The block diagrams are used to build a program called a
Virtual Instrument (VI) which is operated by the user from a front panel on the
desktop PC. Numerous VI's can be created and run simultaneously from the front
panel enabling multi-channel data logging and post processing.
The rollaway control and DAQ system uses a command script process \\hereby the
dynamometer performs a series of commands for a given test. The commands used
by the dynamometer are given in Table 5.1. The command script used to heat one
brake to a temperature of 250°C and then allow it cool to 30°C is given in Table 5.2.
Chapter 5-Development of a Rollaway Dynamometer Experimental Facilitv 77
The hydraulic brake pressure inside the calliper at the start of the test is set to Obar.
The hydraulic pressure in the hydraulic system is initially at 20bar and is isolated
from the calliper by two solenoid valves. The command script is paused at step 4 to
allow the operator to tum one of the solenoid valves off and allow the hydraulic
pressure to reach the calliper and apply the brake. This procedure is used because
the pressure controller is not capable of producing pressures below 5bar.
Command Description
Ignore Ignore the current command line and move on to the next line. Heat Wait for the temperature of a specified thermocouple to reach
above a specified temperature and then proceed to the next line. Cool Wait for the temperature of a specified thermocouple to drop
below a specified temperature and then proceed to the next line. Wait Wait for a specified period of time before proceeding to the next
line. Pause Pause the script until the operator presses the . proceed . button on
the software front panel then proceed to the next line. Ramp speed Change the speed of the motor to a specified value in a specified
period of time. Ramp pressure Change the hydraulic brake pressure to a specified value in a
specified period of time. Rotate stepper Rotate the stepper motor in a clockwise direction at a specified clockwise speed until a specified load is achieved in the parking brake cable. Rotate stepper Rotate the stepper motor in an anti-clockwise direction at a anti-clockwise specified speed until a specified load is achieved in the parking
brake cable. . Table 5.1 DescnptIOn of the software commands
Step Command Time Speed Pressure Thermocouple I 1 (seconds) (rpm) (bar) TempeC)
, Table 5.2 Command scnpt to heat a brake to 250C then allo\\ It to cool to 30e
Chapter 5-Development of a Rollaway Dynamometer Experimental Facility 78
The software is activated when the operator starts the script by pressing the 'start
script' button on the front panel. Once running the software starts logging data from
the dynamometer sensors which is also plotted in the front panel so that the operator
can monitor the test. 100 samples per second are recorded which are a\eraged e\ery
III oth of a second to produce 10 data points per second for every channel. The
software has safety alarms built into the program which shut down the dynamometer
if the value measured by one of the sensors exceeds a predefined safety limit. The
shaft encoder logging system has a limit of ± 2 x 1 022 measurements. If the data
logging system reaches this limit the encoder counter is reset so that the data can
continue to be logged. The software executes all of the command scripts and then
the dynamometer is shut down, the logging stops and the program ends. A flow
chart of the rollaway control and DAQ system program can be seen in Figures 5.20
and 5.21.
Chapter 5- Development of a Rollaway Dynamometer Experimental Facilit\ 79
Script ',.-Y ____ ---, running?
Start script N button pressed?
Y Shut down dynamometer Stop DAQ logging
Mark script as running. Clear graphs. Create results file. Start DAQ logging
Script line running?
Y
N
Process this script line. Read, write, calibrate and plot DAQ data (See Figure 5.21) Save data.
Alann conditions met?
Y ShutdO\\TI dyno. Set script and script line as not running.
script line?
Y Set script hne as not running.
Fnd of SCriPt')
Set next SCript
hnc Set scnpt hnc as runnmg 1001late thIS
SCript Ime
Figure 5.20 Operation of roll away program
y
~CI SCript a.~
IW( runnmg \ct ,(art ~Crl pi hutton a\ un-pre"cd
Chapter 5- Development of a Rollaway Dynamometer Experimental Facility 0
From Figure 5.20 (Read, write calibrate and plot DAQ data)
Read 100 analogue samples per channel from ADC buffer (This equates to I II 0 sec of data). Take mean of this data. Apply calibration factors (from instrument list) to this input data
Apply calibration factors to analogue output values, speed and pressure (from instrument list) . Wri te the output values directly to DAC channels (as specified in the instrument list).
Read the encoder position from CTRO. Apply calibration to encoder position (from encoder table). Subtract previous encoder position to calculate encoder angular velocity.
Check ir its time to update the graphs (measurement number multiple of 10)'>
N
y
Check if cow1ter CTRO y approaching overflow
CTRO > 2"22 or CTRO < -2"22
N
Return to Figure 5.20
Plot calibrated data to on screen charts
Reset counter CTRO
Figure 5.21 Read, write, calibrate and plot DAQ data sub y tem of roll<1\\a) program
Chapter 5-Development of a Rollaway Dynamometer Experimental Facilitv 81
5.6. Modifications to dynamometer
This section describes the modifications that were made to the original
dynamometer to develop it into a suitable testing facility for this project.
5.6.1. Dead weight system
The preliminary tests identified the hydraulic actuator as being unsuitable for
applying the torque on the dynamometer axle. It was decided that a dead weight
system that uses steel weights hung on the cable system would be a cost effective
and reliable alternative method of applying a constant torque on the dynamometer
axle. The number of weights that are hung on the cable can be varied to develop the
required cable load and torque on the dynamometer axle for the test. The hydraulic
actuator was retained and used to lift the weights into position to produce the
required torque. A diagram of the dead weight system layout is shown in Figure
5.22.
Torque wheel
Pulley wheels .----"
Dead weight
Hydraulic~ actuator
Figure 5.22 Diagram of the dead weight apply system
The framework of the original apply rig was modified so that it could he used to
house the dead weight system. The actuator was moved to a newly designed section
of framework which was fixed to the original apply rig frame. The new section was
designed using AutoCAD 2000 and manufactured by Lambert Engineering Ltd. :\
photograph of the modified apply rig is shown in Figure 5.23.
Chapter 5- Development of a Rollaway Dynamometer Experimental Facihty 82
Modified framework
Dead weights
New pulley wheels
Hydraulic '+'~~-4+-----;--r--r actuator
Fig 5.23 Side view of the modified apply rig
The dead weight apply system required additional pulley wheels to those on the
original apply rig and so new bearing blocks were designed to fi x the pulley wheels
to the framework. The pulley wheel assemblies were manufactured by Lambert
Engineering Ltd and can be seen in Figure 5.24 .
A new cable was required for the apply rig and was supplied by Peter Cassidy
Lifting Equipment.
Chapter 5- Development of a Roll away Dynamometer Experimental Facilitv 83
-.~
Figure 5.24 Pulley bearing blocks
The preliminary tests discussed in Section 5.4 found the bracket which attached the
cable to the large pulley wheel to be unsuitable for use on the dynamometer. A new
bracket, shown in Figure 5.25 , was designed and manufactured at the University of
Leeds that allowed the cable to make more than one revolution on the large pulley
wheel and was easy to attach.
Figure 5.25 Cable attachment bracket
The wei ahts were desirned to be located on a weight hanger that was attached to the b b
cable system via a pulley wheel fixed to the hanger. The number of weight attach d
to the hanger could be varied depending on the required test torque and en ur d that
Chapter 5-Development of a Rollaway Dynamometer Experimental Facilit" 8-l
the dynamometer could simulate a vehicle with a mass up to 1900kg parked on a
gradient up to 250/0. Each of the weights have a mass of 35kg and are held in
position on the hanger using a locking pin which passed through the weight and the
hanger. The width of the weight hanger and the weights was les than the internal
dimensions of the apply rig framework to ensure that the mechanism could be
positioned inside the rig. A diagram of the weight hanger assembly is shoY\TI in
Figure 5.26.
AIken Engineering was selected to manufacture the weight hanger and weights; the
pulley wheel assembly that was fixed to the hanger was supplied by Lambet
Figure 6.4 Position of the surface profile measurements on the pad (not to calc )
6.3.6. Calliper tests
Tests were conducted on the Jaguar S-Type OE calliper, Calliper 1, to measure the
def1ection of the calliper fingers under loads produced by the hydraulic sy tem and
loads produced by the parking brake system. The deflecti on of the calliper fingers
can be used to calculate the stiffness of the calliper assembly which may have an
influence on the propensity of the parking brake system to rollaway. The tests were
conducted at temperatures of 30°C to 90°C in increments of 10°C to investigate the
calliper stiffness as a function of temperature. The calliper was heated on the Jaguar
S-Type by driving the vehicle on the Federal Mogul proving ground and applying
brake stops. The brake stops were repeated until the calliper had reached the
required temperature. The bulk calliper temperature was measured u. ing a
contacting K-type thennocouple located on the calliper bridge. The point on the
calliper finger where the deflections were measured is sho\\TI in Figure 6.5. The
displacement was measured using a linear variable di fferential tran foml r (L DT) .
The brake line pressure was controlled by manual I appl ing the 1'0 t brak pedal.
The load from the parking brak system wa controll ed by manuall y app!) ing the
vehicle hand brake lever.
Chapter 6 - Experimental characterisation of roll away
Contacting thennocouple
104
Figure 6.S S-Type calliper with deflection measurement point 15mm from tip of
calliper finger.
Tests were conducted on Callipers 2 and 3 to compare the deflections produced by
the cast iron and the aluminium callipers. The deflections were measured at ambient
temperature from three positions on the calliper finger, shown in Figure 6.6, to
investigate how the calliper fingers deflected at varying iocations on the finger.
Calliper
....
:······· ·············~5 ····· · ········ ]1. 5 Figure 6.6 Locations of the measurement positions on the calliper finger
Chapter 6 - Experimental characterisation of rollaway 105
6.4. Original Equipment Performance Results
This section discusses the tests that have been conducted to contribute to the
characterisation of the behaviour of the Jaguar S-Type OE brake system component
during a rollaway event.
6.4.1. Compression
The results from the compression tests conducted on Pad 1 are shown in Table 6.2
and Figures 6.7 and 6.8. The test was repeated twice and the values shown in Table
6.2 are the average of the two values. The maximum variation in all of the results
was ± Ill-tm.
Temp Compression (l-tm) (OC) 40 bar 60 bar 80 bar 100 bar 160 bar
20 42 61 80 96 140
50 40 60 79 95 145
100 41 61 81 98 148
200 44 66 87 105 159
300 55 81 105 127 193 Table 6.2 Pad 1 compression at varying applIed load and temperature.
250
- 200 E ~ c: 150 0 ·en In Q)
100 ~
Q.
E 0 () 50
0
0 50 100
Pressure (ba r)
150 200
-+- 20C ____ 50C
-.- 100C
200C
300C
Figure 6.7 Compression of Pad 1 at varying pressures and constant temperature
Chapter 6 - Experimental characterisation of rollaway ]06
250
- 200 E
-+- 40bar .3-----c: 150 --~ ---- 60bar 0 ~
..:jji; )I(
'(i) en
~ ----.- BObar Q)
100 ... ! Q. : 100bar E : 0
== : . ------- 160bar () 50 ..... .... • • •
0 0 100 200 300 400
Temperature (degC)
Figure 6.8 Compression of Pad 1 at varying temperatures and constant pressures
The results show that the compressibility of the pad increases with an approximately
linear relationship with pressure at a constant temperature for the temperatures
tested. The compressibility of the pad increased with temperature in a non-linear
manner for the different applied pressures. The results suggest that the
compressibility of the friction material will reduce as the brake cools and the normal
load decreases.
The compression results were used to derive the Young's modulus of Pad 1 uSlllg
Equations 6.1 and 6.2. The Young ' s modulus of Pad 1 as a function of temperature
and applied load is plotted in Table 6.3.
Temp Young's modulus (x 106 Pa) (Oe) 40 bar 60 bar 80 bar 100 bar 160 bar 20 518 357 272 227 155
50 544 363 275 229 150
100 530 357 269 222 147
200 494 330 250 207 137
300 395 269 207 171 113 Table 6.3 Pad 1 Young 's modulus at varymg applied pressure and temp ratur
Chapter 6 - Experimental characterisation of rollaway 107
6.4.2. Thermal expansion
The thermal expansion coefficients of the Jaguar S-Type OE pad and cast iron di c
were measured using the DMA testing machine. Three samples of the pad and di c
were measured and the height of the sample during the test is plotted in Figure 6.9
to 6.14. The average thermal expansion coefficient was calculated for the samples
between the start temperature of 30°C and the final temperature of 300°C. The
results along with the variations are plotted in Table 6.4. 9.510
9505
9.500
I 9 495
I 9.490
E 9465 E-8 ~ 9 480 Q.
~ 9 475 Q.
9.470
9465
9 460
9455
9 450 26 49 50 100 150 200 250
Tem".,rotur. ('C)
Figure 6.9 Thermal expansion of a sample from Pad 1 - test 1
7530
7525
I 7520
I 7515 E E-li il 751 0 0
Q.
£ a: 7.505
7500
7.495
7.490 26 57 SO 100 150 200
Temperettre ("C)
Figure 6.10 Thermal expansion of a ample from Pad 1 - te t 2
Chapter 6 - Experimental characterisation of rollaway 108
10500
10495
I 10490
I 10495
E 10460 .s ~ 1:i 10475 0 a.
" g Q. 10470
10 465
10460
10455
10450 2665 50 100 150 200 250
Temperature rC)
Figure 6.11 Thermal expansion of a sample from Pad 1 - test 3
'0500
10495
10490
'0,",
110480
E S i 10475
~ 10470
.0465
10460
' 0<55
10450 2661 so
u '00 .SO
T~e ("'C)
Figure 6.12 Thermal expansion of a sample from a ca t iron di c - te t 1
Chapter 6 - Experimental characterisation of rollawav 109
10510
10505
110500
1 10495 E ,§. c
§ 10490 0 0-
~ 0:
10485
10460
10475
10470 2651 50 100 150
Tempe,lItlle ("C) 200 250
Figure 6.13 Thermal expansion of a sample from a cast iron disc - test 2
10.510
10505
10500
110 495
I E 10 490 ,§. c
f 10 485 0..
" il 0: 10 480
10 475
10 470
10 465
10460 26 52 50 100 150 200 250 301
Temper."", ee)
Figure 6.14 Thermal expansion of a sample from a cast iron disc - te t 3
Maximum Thermal expansion coefficient ( x IO -6 °C - I
) variation in results
Sample 1 2 3 average plus minus
Pad 1 18.3 16.1 20.3 18.3 2.05 ~ . I
Disc 12.4 12.2 12.4 12.4 0.0751 0.126
Table 6.4 Thennal ex an ion coefficient p alue of the OE p ad and di
Chapter 6 - Experimental characterisation of rolla way 110
The results in Figures 6.9 to 6.11 show that the expansion of the pad samples did not
follow a linear relationship with temperature. The pad expands up to a temperature
of around 80°C and then contracts until a temperature of around 1300 e is reached
before continuing to expand for Pad 1 tests 1 and 3. This could be caused by the
different constituent ingredients within the material expanding at different rates
potentially creating cavities within the matrix. As the material heats up the resin
becomes more fluid which allows it to flow into the cavities which could reduce the
height of the sample as seen in Figures 6.9 to 6.11.
The results in Figures 6.12 to 6.13 show that the disc expands with an approximately
linear relationship with temperature. This is to be expected because the disc is made
from solid cast iron. The results tend to be slightly non-linear below -lOoC. but it is
expected that this could be reduced if a slower heating rate was used during the test
to ensure a homogenous temperature.
The result in Table 6.4 shows that the thermal expansion coefficient of the ditTerent
pad samples varies more than the disc samples. This is because the pad is a
composite material and the samples used in the tests were small and so the mix of
constituent ingredients in each sample is expected to vary. The variations could be
reduced if larger samples were tested or the friction material mixing process could
produce a more even distribution of constituent ingredients.
The variations could be reduced further if the sample preparation method was
improved. The samples tested were produced by hand using a hacksaw and
polishing paper. This coupled with the granular nature of the friction material meant
that variations occurred in the sample geometry which could have affected the
results.
6.4.3. Dynamometer clamp load
The cable load was measured on the dynamometer as the brake cooled from 2500 e to 300 e with all of the OE components installed. The test was repeated 3 times and
the results were found to be similar for all 3 tests. A typical result from the tests is
Chapter 6 - Experimental characterisation of rollaway I I I
plotted in Figure 6.15 and the detail s of all of the tests are given in Table 6.5. The
clamp load at the frictional interface was calculated using Equation 5.1.
4
3.5
3
Z 2.5 .::t.
:; 2 ca .3 1.5
1
0.5
o o
- Cable load - Deri\ed clamp load
500 1000
Time (seconds)
1500 2000
Figure 6.15 Cable load and derived clamp load from the OE parking brake system.
Test Cable load (kN) Derived clamp load (kN) Repeat start end 0/0 lost start end % lost
Table 6.5 Cable load and derived clamp load for the Jaguar S-Type OE parking brake system.
The result in Figure 6.15 and Table 6.5 shows that the cable load decreases ov r
time losing around 33% of the initially applied load for all of the tests . The clamp
load, whjch is derived from the cable load using Equation 5.1, was found to 10 e
around 26% of the initial applied load. The amount of lost clamp load i lower than
the amount of lost cable load because the equation used to calculate the clamp load
takes the hysterecis of the system into consideration.
Chapter 6 - Experimental characterisation of roll away 1 1
6.4.4. Varying test temperature
The temperature of the brake is believed to have a primary effect on the li ke lihood
of rollaway occurring with a hotter brake being more likely to result in rollaway. It
is expected that the amount of lost clamp load at the frictional interface will increa e
as a function of temperature. To investigate this hypothesis, tests were conducted on
the Leeds hand brake dynamometer with the OE parking brake components installed.
The test was conducted at temperatures of 50°C to 300°C with increments of 50°C.
This would enable the performance of the parking brake clamp load to be e al uated
as a function of temperature. The test was repeated five times for each temperature
and the results along with the measured variations are given in Figure 6.16 .
• Cable load 0 Oeri \€d clamp load
50
40 "0 IV 0 30 ... I/) 0
20 ...J
~ 0
10
0 50 100 150 200 250 300
Test temperature (C)
Figure 6.16 Percentage of lost cable load and derived clamp load produced by the Jaguar S-Type OE parking brake system cooling from various temperatures.
The result in Figure 6.16 shows that the amount of lost clamp load is approximately
linearly proportional to the temperature of the brake. The results are used to obtain
an expression for the percentage of lost cable load as a function of the initial test
temperature, which is given in Equation 6.4.
Percentage of lost cable load = 0.l51 test temperature - 2.53 (6.4 )
Chapter 6 - Experimental characterisation of ro II away 113
The approximation given in Equation 6.4 has an R2 correlation \vith the measured
results of 0.986. The squared correlation coefficient. R2, is the proportion of
variance in one test variable that can be accounted for by knowing the other in a test
with two variables. The high R2 value in Equation 6.4 indicates that the results
follow a linear relationship.
The result shows that the lost clamp load is influenced by the reduction in
temperature that occurs as the brake cools. The brake would lose less than 50/0 of the
initial applied load if it is heated to a temperature less than 50°C. This result shows
that the likelihood of rollaway occurring can be significantly reduced if the
temperature of the brake remains low.
6.4.5. Varying pad thickness
The pad thickness is a variable that changes constantly with vehicle usage. The pad
is designed to wear which results in a reduction of the material thickness and so the
pad thickness is a relevant parameter to investigate. The pad thickness is linked to
the thermal expansion of the pad by Equation 6.5.
Where:
/j.1 = 10a/j.T
/j.1 = Change in length or thickness (m)
10 = Original length or thickness (m)
a = Thermal expansion coefficient (OC -I )
/j.T = Change in temperature (OC)
(6.5)
Equation 6.5 assumes a uniform temperature change in the pad which is unlikely to
occur due to the way the pad is heated and convects heat to the surroundings.
Equation 6.4 implies that a smaller pad thickness (/0) will result in a reduced change
in thickness (/j./), which will produce a smaller change in clamp load.
Tests were conducted on five sets of virgin Jaguar S-Type OE pads with thicknesses
of 9mm, 11 mm, 13 mm, 15mm and 17mm. The thickness of the pads was modi tied
by grinding the pads to the correct size. The fiyc sets of pads were tested on the
Chapter 6 - Experimental characterisation of rollaway 1 1-+
Leeds parking brake dynamometer with the brake cooling from 250°C to 300
following the procedure described in Section 5.3.3 . The test was repeated five time
for each set of pads and the results along with the corresponding mea ured
variations are plotted in Figure 6.17 .
• Cable load 0 Oeri\€d clamp load
45 40 35
'0 30 IV 0 25 -VI
20 0
~ 0 15 10 5 0
9 11 13 15 17
Pad thickness (mm)
Figure 6.17 Percentage oflost cable load and deri ved clamp load produced by the Jaguar S-Type OE parking brake system with pads of varying thickness.
The result in Figure 6.17 does not show any correlation between the pad thickne s
and the lost clamp load. This could be due to the thermal insulation of the friction
material preventing the whole pad reaching a uniform temperature with only the
material close to the pad surface reaching an elevated temperature. The results
suggest that the pad thickness is not a significant factor in rollaway.
6.4.6. Calliper tests
The deflection of the Jaguar S-Type OE calliper was measured when the parking
brake was applied and when the hydraulic brake was applied with the calliper at
temperatures between 30°C and 90°C. The results are plotted in Figure 6.18 and
6.19 respectively. The test was only conducted once for each mea urem nt becau ' e
a skilled Federal Mogul test driver was required to heat the calliper to the required
temperature and was only available for a limited period of time.
Chapter 6 - Experimental characterisation of rollaway 1 1 ~
The test was not conducted for temperatures above 90°C because thi \va difficult
to achieve on the Federal Mogul proving ground. There is also a risk that the brake
fluid might boil at higher temperatures which could result in brake failure.
250
200
E -3 150 c: o
:;:; ()
Q) 100 ~ o
50
o ~ ~ ~ ~ ~ ~ ~ ~ ~ ~ ~ ~
Notch
- 90°C
- 80°C
70°C
60°C
- 50°C
- 40°C
30°C
Figure 6.18 Deflections of the calliper finger for different notches on the parking brake ratchet mechanisms at different constant temperatures
250
200 -E ...:;. 150 c: o ~ Q) 100
'a; o
50
o ~ ~ ~ ~ ~ ~ ~ ~ ~ ~
Pressure (bar)
- 90°C
- 80°C
70°C
60°C
- 50°C
- 40°C
30°C
Figure 6.19 Deflections of the calliper finger with di ffe rent applied pre ' ure_ at
different constant temperature
Chapter 6 - Experimental characterisation of rollaway 116
The result in Figures 6.18 and 6.19 shows that the deflection of the calliper finger is
not affected by temperature for the range of temperatures tested. The result in Figure
6.18 shows that the parking brake system produces a greater variation in deflection
measurements at different temperatures than the hydraulic system. These variations
could be due to the parking brake apply system producing varying amounts of cable
displacements for the different tests.
The tests showed that the calliper is capable of reaching temperatures up to 90°C. It
is unlikely that the calliper would reach temperatures above 90°C during normal
vehicle usage. It is possible that the calliper could achieve temperatures above 90°C
in extreme driving conditions such as a mountain descent.
6.4.7. Dynamometer static friction
The static friction level of the OE brake system was measured on the dynamometer
as a function of temperature. One brake was isolated on the dynamometer and used
with a virgin set of pads and a new disc installed for the test. The brake underwent a
bedding procedure on the dynamometer which consisted of dragging the brake up to
a temperature of 300°C and allowing it to cool to 30°C which was repeated 50
times. The torque used to simulate the vehicle parked on a gradient was applied in
the opposite direction to the drive used to drag the brakes to the test temperature.
This simulates a vehicle parked facing up a gradient. The test procedure described in
Appendix C was used and all of the tests were repeated 5 times. The results along
with the corresponding variations in the measurements are plotted in Figure 6.20.
Chapter 6 - Experimental characterisation of rollaway I 17
0 .: 0.7 .~ c!: 0.6 .. 0 0.5 -= 0.4 .~ ~
0.3 IS Q,j
0.2 0 ~
~ 0.1 .: ~ 0 -rJ:J
0 50 100 150 200 250 300 350
Temperature
Figure 6.20 Static friction level variation with temperature for the Jaguar S-Type OE parking brake system.
The result in Figure 6.20 shows how the coefficient of static friction varies with
temperature for Pad 1. The friction level increases up to a temperatme of 200 0 e and
then decreases for temperatures between 200°C and 300°C. The result suggests that
if the Jaguar S-Type was parked facing up a gradient with the rear brakes at a
temperature of 200°C, then as the brakes cooled the coefficient of static friction
would reduce. This would lead to a drop in the frictional force produced at the
frictional interface, which if large enough would result in parking brake failure and
rollaway.
6.4.8. Surface characterization
Two of the Jaguar S-Types OE pads were used for the tests with one in an un
bedded state and one in a bedded condition. The bedding procedure took place on
the vehicle and consisted of 200 brake stops from 60 km!h to 0 km!h at a pressure of
30bar. The rubbing surface profile was measmed at a temperatme of ::woe. lOOoe
and 200C for each pad and the roughness, Ra, was calculated. The re ults from the
test are given in Table 6.6 and Figures 6.21 to 6.26. The location of the
measurement positions is defined in Figure 6.4.
Chapter 6 - Experimental characterisation of rollaway 1 18
Temperature Position Bedded pad Un-Bedded pad eC) Ra (J.1m) Ra (f.1m) 20 1 5.20 6.90 20 2 4.88 6.06 20 3 4.71 4.08 100 1 5.47 5.99 100 2 5.74 7.23 100 3 4.83 7.33 200 1 5.60 6.71 200 2 7.45 3.92 200 3 5.30 2.76
Table 6.6 Roughness values from the bedded and un-bedded pads
Table 7.2 PropertIes of pads 1 to lOused in FE simulation .
The static coefficient of friction as a function of temperature is required in the model
to predict the torque developed by the parking brake system as a function of time. A
third order polynomial has been used to approximate the results from the
dynamometer tests, described in Chapter 6, to obtain the coefficient of friction as a
function of temperature. The polynomials were obtained by using an interpolation
function within MS Excel. The coefficients of the third order used to approximate
the static coefficient of friction as a function of temperature for Pads 1 to 4 are given
in Table 7.3 and the equations are plotted along with the corresponding
dynamometer results in Figure 72.
Pad J1 = a 3T3 + a 2T
2 + air + a o
a 3 a z a) a o
1 -2x10⁻⁸ 3xlO-{i 0.0007 0.398
2 -6xl0-8 3 x 10⁻⁵ -0.0049 0.6417
3 - 2 X 10⁻⁸ -1 x 10-{i 0.0024 0.2201
4 -3x10⁻⁸ 3 X 10---6 0.0015 0.3558
Table 7.3 Static coefficient of friction approxImatIOns as a functIOn of temperature
Chapter 7 - Rollaway simulation using the finite element method 14 1
c 0 .... -~ .-~ ~ .-= ~ -rI) ~ 0 -c QJ .-~ = QJ 0 U
0.7
0.6
0.5
0.4
0.3 / 0.2
0.1
0
20 50 100 150 200 250 300
Temperature (C)
• Pad 1
• Pad 2
~ Pad 3
Pad 4
- - - - Pad 1 approximation
- - - - Pad 2 approximation
Pad 3 approximation
Pad 4 approximation
Figure 7.2 Coefficient of static friction as a function of temperature for Pads 1 to 4 as measured on the dynamometer and approximated by the mathematical model
polynomial
The result in Figure 7.2 shows that the third order polynomial is a good
approximation for the coefficient of static friction as a function of temperature for
the pads tested. An R2 correlation coefficient has been derived for the results given
in Figure 7.2. The R2 values from the third order polynomials are given in Tabl e 7.4
along with the R2 values for second and fourth order polynomials.
Pad Second order Third order Fourth order polynomial polynomial polynomial
Figure 7.8 Pressure distribution of the contact pressure produced at the pad surface for the parking brake system with Pad 1 installed when cooling from 250°C to 30
0 e.
The results in Figure 7.8 show how the pressure distribution at the frictional
interface varies as a function of temperature. Initially the pre UTe i concentrated at
the location of the calliper piston and fingers. This is les apparent a the brak 001 '
Chapter 7 - Rollaway simulation using the finite element method 1.~ 1
towards ambient temperature. The pressure could be distributed more evenl) if a
stiffer material was used for the pad.
The FE model has been used to predict the performance of Pad 1 to 10 \vi th the
brake cooling from 250°C to 30°C. The properties of Pads 1 to lOused within the
model are shown in Table 7.2. The model was used to calculate the percentage of
clamp load lost as the brakes cooled from 250°C to 30°C so that the model re ult
could be compared to the percentage of lost cable load measured on the
dynamometer. The results from the model and dynamometer are plotted in Figure
7.9.
• Dyno 0 FEA model
50 45 40
-0 35 cu 0 30 .... 25 en 0
..J 20 ~ 0 15
10 5 0
1 2 3 4 5 6 7 8 9 10
Pad
Figure 7.9 Percentage of lost clamp load of Pads 1 to 10 as measured on the
dynamometer and predicted by the FE model.
The results in Figure 7.9 show that the percentage of lost clamp load predicted by
the model has very a good correlation to the percentage of lost cable load mea 'ured
on the dynamometer except for Pads 5 to 8. The large errors in the r ult for Pads 5
to 8 could be because the dynamometer test was not repeated and the propertie ' or the pads measured in the laboratory could have varied during the dynamometer te ' t .
The imulation results predict that th propertie of the pad can affect the
percentage of clamp load lost as the brake cools. The ana] i v,:a ' th rei'ore u cd t
Chapter 7 - RoUaway simulation using the finite element method 15
investigate if the properties of Pad 1 could be modified so that the brake would 10 e
less clamp load. Five additional pads were simulated. labelled Pads 1 a to 1 e. with
the properties of the pads given in Table 7.5. The percentage of the initial applied
clamp load that was lost as the brake cooled from 250°C to 300e with Pad 1 and
Pads 1 a to 1 e installed is plotted in Figure 7.10.
The loads in the elements within the model are calculated using Hooke's law and are
given in Equations 8.8 to 8.13.
Cable 1: FaJ = KcabJ (uJ - u 2 + /)./cabl) (8.8)
Cable 2: Fa2 = Kcab2 (u 2 - u 3 ) (8.9)
Cable 3: Fa3 = Kbrake2u2 (8.10)
Pad: F; = K p (u s - U 4 - /)./ p ) (8.11 )
Half disc: F; = Kd(US -/)./d) (8.12 )
Calliper: F; = K cal (U 4 + /)./cal) (8.U)
The thennal contractions of the pad, half disc, calliper and apply cable 1 are given
by equations 8.14 to 8.17.
Chapter 8 - Rollaway simulation using Matlab/Simulink
~l p = lopa p~Tp
~ld = IOdad~Td
(8.14)
(8.15 )
(8.16)
(8.1 T)
165
The stiffness of the calliper, pad, half disc and Cable 2 are combined to give the
equivalent stiffness of brake 1, Khrakel. This is done to simplify the later calculations
of the load at the frictional interface.
(8.18)
Which becomes:
The stiffness of the calliper, pad and half disc are combined to give the equivalent
stiffness of the wheel station of brake 1, K Wh<!<!II.
1 1 1 1 ---=-+-+--KWheell K p Kd Keal
KcalKpKd KWheell :== KKK KKK cal p + cal d + p d
(8.20)
(8.21)
The calliper ratio, Rc
' is used to describe the relationship between the displacements
and loads in the system by Equations 8.22 and 8.23.
(8.22)
(8.2))
To ensure symmetry of operation the load produced in Cable 1. Fal , is assumed to
be divided equally between Cable 2 and Cable 3 giving Equations 8.24 and 8.2:'.
Chapter 8 - Rollaway simulation using Matlab/Simulink 166
(8.24 )
(8.25 )
The load at the frictional interface, F" is derived as a function of the initial parking
brake displacement, U1 , from Equation 8.8. Combining this with Equation 8.22
gIves:
(8.26)
(8.27)
(8.28)
( 8.29)
From Equation 8.9, 8.22 and 8.23:
( 8.30)
Substituting Equation 8.29 into 8.30 gives:
(8.31 )
(8.32)
(8.33 )
The equivalent stiffness of the calliper. pad and half disc from Equation 8.21 is us~d
to calculate the load at the frictional interface. F,.
Chapter 8 - Rollaway simulation using Matlab/Simulink 167
~ = K Wheel) (U 4 - /)./ p - /)./ d + /)./ cal) (8.34 )
Using Equation 8.33:
(8.35)
(8.36)
(8.37)
(8.38)
8.2.5. Static coefficient of friction
The static coefficient of friction as a function of temperature is required in the model
to predict the torque developed by the parking brake system as a function of time. A
third order polynomial has been used to approximate the results as in the work
described in Chapter 7. The coefficients of the third order used to approximate the
static coefficient of friction as a function of temperature for Pads 1 to 4 and Pads 1 1
to 13 are given in Table 8.3 and the equations are plotted along with the
corresponding dynamometer results in Figures 8.5 and 8.6.
Pad 3 ~ l1=a3T +a2T +a,T+ao
a 3 a 2 a, a o
1 -2xl0-8 3 x 10⁻⁶ 0.0007 0.398
2 - 6 xl 0-8 3 xl 0-5 -0.0049 0.6417
3 -2xI0-8 -lxIO-6 0.0024 0.2201
4 -3xI0-8 3 x 10⁻⁶ 0.0015 0.3558
I 1 -2xlO-8 5 xl 0-6 8 xl 0-5 0.3846 i 12 -6xlO-9 -6xl0-6 0.0023 0.3871 i
13 2 x 10⁻⁸ - 2 x 10⁻⁵ 0.0041 0.3734 -l ,
Table 8.3 Static coefficient of friction approximations as a functIOn ot temperature
Chapter 8 - Rollaway simulation using Matlab/Simulink 16
== 0.7 c l Pad 1 .... • ...... 0.6 CJ ....
~ • Pad 2 CJ 0.5
"..C ,E Pad 3 ~ 0.4 ...... rI:J ~
/' Pad 4 c 0.3 ......
- - - - Pad 1 approximation == ~ 0.2 .... CJ - - - - Pad 2 approximation = 0.1 ~
Pad 3 approximation c U 0
Pad 4 approximation 20 50 100 150 200 250 300
Temperature (C)
Figure 8.5 Coefficient of static friction as a function of temperature for Pads 1 to 4 as measured on the dynamometer and approximated by the mathematical model
polynomial
= 0 ~ c..I ·c ~ ,.. 0 .... = CIJ .-c..I
IS CIJ 0 c..I c..I ~ .a 00
0.7
0.6
0.5
0.4
0.3
0.2 -
0.1
0
0 100 200
Temperature ( q
300
)( Pad 13 (1.2% al)
* Pad 12 (0.6% al)
• Pad 1 (0.29% al)
Pad 1 1 (0% al)
- - - - Pad 13 approximation
Pad 12 approximation
- - - - Pad 1 approximation
Pad 1 1 approximation
Figure 8.6 Coefficient of static friction as a function of temperature for Pad 1,] 1, 12 and 13 as measured on the dynamometer and approximated b the mathemati 'al
model polynomial
The results in Figures 8.5 and 8.6 show that the third ord r pol nomial i a g od
approximation for the coefficient of static friction a a function of t mpcraturc r r
the pad t ted. An R- correlation coefficient has be n d rived fI r th ~ r ~ ult ' gi\cn
Chapter 8 - Rollaway simulation using Matlab/Simulink 169
in Figures 8.5 and 8.6. The R2 values from the third order polynomials are giyen in
Table 8.4 along with the R2 values for second and fourth order polynomials.
Pad Second order Third order Fourth order polynomial polynomial polynomial
Table 8.S Optimal temperature of the callIper \vhen used \\ lth Pads 1 to 10
Chapter 8 - Rollaway simulation using Matlab/Simulink 1 ~
• Model 0 Dynamometer
50
"0 40 ~ Q 30 -.... rIJ Q ~ 20 ':::R = 10
0
1 2 3 4 5 Pad 6 7 8 9 10
Figure 8.10 Percentage of clamp load that is lost as the brake cools from 250°C to 30°C for Pads 1 to 10 as predicted by the model and measured on the dynamometer
The result in Figure 8.10 shows that the optimised model result agree ell with
those that have been measured on the dynamometer. The initial calliper temperature
used, shown in Table 8.5, are within the expected temperature range of the calliper.
The results suggest that the calliper temperature has a significant effect on the
change in clamp load at the frictional interface. The model predicts that b
increasing the initial calliper temperature and therefore the thermal contraction of
the calliper bridge, the amount of clamp load that is lost as the brake cools can b
reduced. The calliper cools more slowly than the pad and disc because it has a
relatively small surface area compared to its mass. Therefore the clamp load will be
lost at a faster rate due to the thermal contractions of the pad and disc than the rate
of gain in clamp load resulting from the calliper contraction. This implie that
rollaway is still liable to occur on the vehicle. It is critical that the calliper
temperature remains relatively low because if the calliper becomes too hot the brake
fluid inside the calliper could boil leading to a system failure and 0 a trade off
exists.
The sensitivity study showed that the properties of the friction material can atfect
the percentage of the initial clamp load that is lost a the brake cool . The prop rties
of Pad 1 were modified within the model to in estigat how the m di Ii "d pad '
would perfoffil. The stiffness of Pad 1 a a function of t mperature \Va 111 dified by
changing the stiffness of the pad at temperature of _50° and 0°"', fh mea 'ured
@~ -
Chapter 8 - Rollaway simulation using Matlab/Simulink 176
stiffness of Pad 1 at 250°C, K p1250C, and at 30°C, K p)OC. was halved and
doubled in the model. The values of the parameters used are given in Table 8.6. The
percentage of the initial applied clamp load that was lost as the pad and half disc
cooled from 250°C, the calliper cooled from 58°C and the cable remained at
ambient temperature predicted by the model using the modified stiffness values is
given in Figure 8.11.
Parameter Symbol Value Units Stiffness of Pad 1 K p1 30 1.32 x 10⁸ Nm- I
at 30°C Half of the ~Kp130 6.6x 10⁷ Nm I
stiffness of Pad 1 at 30°C
Double the 2Kp)30 2.64x10⁸ Nm I
stiffness of Pad 1 at 30°C
Stiffness of Pad 1 at 250°C
Kp)250 1.01xl08 Nm )
Half of the stiffness of Pad 1
~Kp1250 5.05xl07 Nm I
at 250°C Double the 2Kp1 250 2.02 x 10⁸ Nm 1
stiffness of Pad 1 at 250°C
° ° Table 8.6 ModIfied stIffness values of Pad I at 30 C and 250 C
Chapter 8 - Rollaway simulation using Matlab/Simulink
80
60
40
% lost clamp load
-T_ 2 K250 -
K250 1/2 K250
1/2 K30
K30
2 K30
17
Figure 8.11 Percentage of lost clamp Load produced by changing the sti ffnes of pad 1 at 250°C and 30°C.
The result in Figure 8.11 shows how the stiffness of the pad a a function f
temperature affects the percentage of lost clamp load. The results show that if the
stiffness of the pad at 250°C and 30°C is doubled then the model predicts that the
percentage of lost clamp load increases. If the stiffness values at 250°C and 30°C ar
halved the model predicts that the percentage of lost clamp load is reduced. Thi
suggests that lower stiffness values for the pad will reduce the amount of lost clamp
load at the frictional interface.
The model predicts that the variation of stiffuess as a function of temperature ha a
significant effect on the percentage of lost clamp load. A large variation with
temperature as produced by doubling the stiffness at 250°C and hal ing th tiffne
at 30oe, produces a larger decrease in the clamp load. A mall ariation with
temperature, produced by halving the stiffness at 2500 e and doubling the titTne at
30oe , reduces the percentage of clamp load that is lost. The model predicts that th\:
clamp load will increase as the brake cools when the stiffne value f Yz K {,I -
is used with stiffuess values of K [I I 30e and 2 K [II 30e.
Chapter 8 - Rollaway simulation using Matlab/Simulink 178
The change in stiffness used in the model is difficult to achieve for a brake friction
material and the values are therefore unrealistic. However the result suggests that if
the stiffness of the pad increases as the brake cools the amount of clamp load that is
lost will be reduced or the clamp load will actually increase. The variation of the pad
stiffness with temperature can be changed by varying the constituent ingredients in
the friction material formulation. A pad designed to have a large increase in stiffness
as it cools will perform better in a rollaway test than an equivalent pad with a
smaller increase in stiffness.
The mathematical model was used to investigate the effect of the pad thennal
expansion coefficient on the change in clamp load. Pad 1 was modified by doubling
and halving the thermal expansion coefficient, a pl' The model was used to predict
the percentage of the initial applied clamp load that was lost as the pad and hal f disc
cooled from 250°C, the calliper cooled from 58°C and Cable 1 remained at an
ambient temperature. The values used in the simulations are given in Table 8.7 and
the results are plotted in Figure 8.12.
Parameter Symbol Value Units Thermal expansion a pl 18.3xl0-6 °C- I
coefficient of Pad 1 Half of the thermal ~apl 9.15xl0-6 0C 1
expanSIOn coefficient of Pad 1 Double the thermal 2ap1 36.6x 10⁻⁶ 0C 1
expanSIOn coefficient of Pad 1
Table 8.7 Different values of the thermal expansion coefficient of Pad 1 used in the simulation
Chapter 8 - Rollaway simulation using Matlab/Simulink
100
90
80
"0 70
"' .2 60 Q.
E ..!!! 50 (J .... VI 40 .2 ~ 0
30
20
10
0
112 a pi a pl ) "- a p i
Thermal expansion coefficient
Figure 8.12 Percentage of lost clamp load as the brake cools with Pad 1 in tall d with modified thermal expansion coefficients.
The result in Figure 8.12 shows that the thermal expansion coefficient of the pad ha
a significant effect on the percentage of clamp load that is lost as the brake cool .
The model predicts that a pad with a lower thermal expansion coefficient ill I e
less clamp load than an equivalent pad with a higher thennal expansion coelTici n1.
The model confirms that the thermal expansion coefficient of the pads i an
important parameter of the parking brake system for reducing the likelihood or
rollaway occurring.
8.3.3. Rollaway output model
The rollaway model was used to predict the torque produced b the parking brak
system as a function of time with Pads 1 to 4 installed. Th di c and pad c oled
from an initial temperature of 250°C, the calliper cooled from th corre ' ponding
initial temperature for each pad given in Table 8.4 and the cable r mained at
anlbient temperature of 30°C. The model was u d to imulat the Jaguar -T: pc
parked on a 16.6% gradient and the initial displacement pr duced at the par~ing
brake lever wa the same for each te t. The torque pr duced by 1h par~ing bra~ ,
Chapter 8 - Rollaway simulation using Matlab/Simulink 1 0
system with Pads 1 to 4 installed is plotted in Figure 8.l3 together with th con tant
torque required to hold the vehicle on the gradient.
400
350
~~
300
~ 'f'-.- ~ ,," -....., 250 E z '-"
Q) 200 ~ cr-L-
a f--
150
100
50
o o
~~ "-----....... ..... -
..... _---........... -
-------~-~
Required Torque Pad 1 Pad 2 Pad 3 Pad 4
I
500 I
1000 I
1500 Time (seconds)
-
-
I I
2000 2500 3000
Figure 8.13 Torque produced by the parking brake system with pads 1 to 4 in talled
The result in Figure 8.13 shows how the torque produced by the parking brak
system varies with Pads 1 to 4 installed. The initial torque values are different for
each pad because the model is run with the same initial displacement which ill
develop varying clamp loads dependant on the pad stiffness and the initial
coefficient of friction will also vary for each pad. The model predicts that the torque
produced by Pads 1, 3 and 4 will drop below that required to hold the ehicle on the
gradient resulting in roll away. The time at which rollaway is predict d to occur i
different for each pad. The model predicts that the torq ue produced by Pad - d c
not drop below that required to hold the vehicle on the gradient and the hicle \vill
not rollaway_ However the torque produced drops to a value close t that required t
hold the vehicle on the gradient which could result in the tic ' lip b ha\ i ur that
was observed during the on-vehicle te ts di cu ed in Chapter 4. he clamp load
produced by Pad 2 decreases over time as can been in Figure 8.9 but th> t rque
value general I increase du to the incr ase in tatic friction with reducing
Chapter 8 - Rollaway simulation using Matlab/Simulink 181
temperature. This suggests that the coefficient of static friction between the pad and
disc can have a significant effect on the likelihood of rollaway occurring.
The static coefficient of friction of Pad 1 was modified by producing three
additional pads (Pads 11 to 13) with levels of fused alumina of 0%. 0.6% and 1.2°'0
in the formulation. Pad 1 has 0.30/0 fused alumina in the formulation. The torque
produced by Pads 1, 11, 12 and 13 was modelled using the static friction variation
with temperature described in Table 8.7 with the clamp load variation with
temperature of Pad 1. The clamp load variation with temperature of Pad 1 was used
for all of the rollaway evaluations because the constituent ingredients of Pads 1 1, 12
and 13 are very similar to those of Pad 1 and the changes made are believed to only
affect the friction level resulting in similar thermal expansion and stiffness
characteristics. The results are plotted in Figure 8.14.
400
350
300
- 250 E z -Q) 200 ::l !!
(3. 150 f
50
1
o L __ _ o
----~---
500 1000 1500 2000 lime (seconds)
Required Torque·
Pad 11 Pad 1 Pad 12 Pad 13
2500 3000
Figure 8.14 Torque produced by Pad 1 with varying levels of fused alumina
The result in Figure 8.14 shows the torque produced by the parking brake syst~m
with Pads 1, 11, 12 and 13 installed as a function of time. The initial torque
produced by each pad is different because the coefficient of friction produced hy
each pad is different. The initial cable displacement and clamp load is th~ same ror
each of the pads. The model predicts that Pad 11 \\ill produce the lowest initial
Chapter 8 - Rollaway simulation using Matlab/Simulink 182
torque because it has the lowest coefficient of friction at the initial temperature of
250°C.
The model suggests that the formulations with varying levels of fused alumina affect
the torque produced by the parking brake system. Pad 11 with 0% fused alumina
lost the least amount of torque as the brake cooled. This is because the pad had the
most consistent level of static friction with temperature. Pad 13 with 1.2% fused
alumina produced the highest torque at ambient temperature because it has the
highest friction level at this temperature. The torque produced by all of thc pads
dropped below the level required to keep the vehicle stationary on the gradient. The
amount of torque that was lost varied for each of the pads suggesting that the
formulations can be modified to reduce the likelihood of rollaway occurring.
8.3.4. Cable temperature variation
The model was used to investigate the effect of cable temperature on the clamp load
produced at the frictional interface. The location of Cable 1 on the vchicle enables it
to potentially be heated by the vehicle exhaust system. If the cable is at an elevated
temperature when the vehicle is parked then as the cable cools the thermal
contractions will increase the load in Cable 1 which in turn will increase the clamp
load at the frictional interface. The predicted clamp load at the frictional interface
has been calculated using the model with Pad 1 and the half disc cooling from
250°C, the calliper cooling from 58°C and half of a metre of Cable 1 cooling to
ambient from temperatures ranging from 30°C to 90°C. The predicted torque from
the results as a function of time is plotted in Figure 8.15.
Chapter 8 - Rollaway simulation using Matlab/Simulink
r
450 Required Torque
Cable at 30C
400 Cable at 40C
Cable at 50C 350 H Cable at 60C
Cable at 70C
--- 300 Cable at BOC E
Cable at 90C z -; 250 :J
~ 0 200 f-f-
150 l 100
I
50 f
0 0 500 1000 1500 2000 2500 3000
Time (seconds )
Figure 8.15 Clamp load produced by Pad 1 with cable at varying initial
temperatures
The result in Figure 8.15 shows how the initial cable temperature affects the clamp
load as a function of time. The cable temperature cools to ambient quicker than the
other brake components as shown in Figure 8.5. Therefore the increased load
developed by the cable contraction occurs within the first 200 seconds of the test.
After this period the torque decreases due to the thermal contractions and sti ffnes
variations of the other brake components and the friction variation. The results how
that the amount of the initially developed torque that is lost can be reduced or the
initial torque can be increased as the brake cools by varying the initial temperature
of Cable 1. For the simulation shown in Figure 8.15 the vehicle will not ro llawa if
Cable 1 is at an initial temperature of 70°C or higher.
8.4. Summary
A mathematical model has been developed that successfull capture the behaviour
of the parking brake system during a rolla way test. The model ha been 'validat d
against results obtained from the rollaway dynamometer. A tud wa conduct d t
investigate the sensitivity of the percentage of 10 t clamp load to chang in the
model parameters. The sensiti ity study showed that the lik lih d or r Ilm\ 3)
Chapter 8 - Rollaway simulation using Matlab/Simulink 184
occurring can be reduced by reducing the thennal contractions of the pad and disc.
Rollaway can also be reduced by increasing the thennal contractions of the calliper.
increasing the initial displacement, U1, and reducing the calliper lever ratio. R, .. The
model suggests that the likelihood of rollaway can also be reduced by modifying the
friction level and pad stiffness as a function of temperature.
The model demonstrates that the reduction in brake torque that occurs as the brake
cools can be overcome by setting Cable 1 at an elevated temperature at the start of
the test. This is due to the thennal contractions of the cable increasing the loads in
the system. It may be possible to implement this mechanism on the vehicle by
heating Cable 1 using heating elements or the vehicle exhaust system.
Chapter 9 - Discussion
Chapter 9
Discussion
This chapter discusses the results and theories generated in this research.
185
A comprehensive literature survey has uncovered no published research in the area
of vehicle rollaway other than that published by the author of this research. The lack
of published research suggests the need for this study and was one of the
motivations for this research project.
The on-vehicle tests, described in Chapter 4, have proven the existence of a rollaway
problem on vehicles with an integrated rear calliper. The tests showed that the
vehicle generally exhibits a period of stick/slip prior to the onset of rollaway. A low
frequency groan noise is associated with the slip movement. The tests showed that
the Jaguar S-Type rolled away with four different pads installed. This suggests that
rollaway cannot be prevented by changing the properties of the pad friction material
within the range of the pads tested in this research. The likelihood of rollaway is
dependent on the other brake system components and therefore rollaway should be
investigated as a system problem. Rollaway occurred on all of the gradients tested
and at all of the temperatures tested.
The on-vehicle tests showed that rollaway generally occurred after a period of
stick/slip which is due to changing frictional conditioning at the interface. As the
brake cools the pads and discs contract back to their ambient dimensions. These
contractions produce a reduction in the normal force at the frictional interface.
which results in a drop in the level of brake torque. If the brake torque approaches
the limit of that required to hold the vehicle on the gradient. the stick/slip movement
begins to occur and a groan noise is associated with this movement. This stick/slip
movement and noise indicate an instability at the frictional interface. The instability
generates vibrations at the frictional interface which are then amplified by the brake
system into the audible noise that was recorded during the tests. A possible
mechanism that facilitates this problem is postulated below:
Chapter 9 - Discussion
When the pad is initially in contact with the disc there I' S a 1 I , arge rea contact ar a
with the frictional load being shared by the particles in the b ak d d h b' . r e pa an t mdtng
matrix of the pad as shown in Figure 9.1. As the pad cools th th I . , e erma contra hon
of the matrix are higher than that of the large particles as shown in Figure 9.2.
Disc~
~--------------------------~
Pad~ o
CJ o o
Matrix
Large particle
Figure 9.1 Frictional interface during stick slip event before cooling
Disc~
Pad~
o CJ
Contracting matrix
Figure 9.2 Frictional interface during stick slip event after cooling
This could be due to the matrix conducting the heat faster than the large partic] or
having a higher coefficient of thermal expansion. This results in the large particle '
protruding from the surface as the matrix contracts around them. The matri ' ill no
longer be in contact with the disc surface and therefore the real contact area h b n
reduced and the load is being carried by the large particle . Wh n the real c ntact
area has reduced by a sufficient amount the frictional force will no longer be large
enough to prevent the disc from rotating. The disc will b gin to rotat . and thi
rotation will tear or realign the large, protruding particle out f th malri. . hi ' in
turn would increa e the real contact area at the int rfac a the matri: com intl
Chapter 9 - Discussion 187
contact with the disc. This continues until the frictional force is large enough to
prevent the disc from rotating, and stick would result. The large particles that were
removed would then fall away from the interface as wear particles or \\ ould get
pressed back into the matrix at the surface. This process would continue as the
brakes cooled down.
The on-vehicle test result 'type 4' shown in Figure 4.l4 shows that the vehicle
began to roll down the gradient after a period of stick/slip and then stop without any
input from the driver. The vehicle subsequently continued to move down the
gradient with a stick slip motion before rollaway occurred. The vehicle may have
come to rest due to the variations in the disc thickness. If the disc began to rotate at a
location with a low disc thickness then as the disc rotated the thickness may have
increased. The increased thickness will increase the normal load at the brake
interface due to Hooke's law, described in Equation 8.5. The increase in normal load
may have been sufficient to prevent the vehicle from rolling down the gradient. As
the brake continued to cool and the disc continued to contract due to the thermal
contractions the normal load continued to decrease until rollaway occurred.
Rollaway was found to occur on the Jaguar X-Type with both the aluminium and
cast iron callipers installed. Rollaway was less likely to occur with the aluminium
calliper which could be due to the thermal contractions of the calliper bridge. The
thermal contractions of the calliper bridge will reduce the distance between the pad
back plate and the disc. This will offset some of the thermal contractions of the pad
and disc reducing the amount of lost clamp load. The aluminium calliper may also
be at a higher initial temperature at the start of the test due to aluminium having a
higher thermal conductivity than cast iron. The results from the Matlab model
demonstrate that this would reduce the amount of lost clamp load at the frictional
interface as the brake cooled.
A novel dynamometer test facility has been developed at the University of Leeds
that is capable of testing vehicle park brake systems. The dynamometer was
developed from an existing rig and has been modified into a fully functional testing
facility. The dynamometer and software is adaptable and can be modified to conduct
different brake system tests. This is because the software was \\Titten using Lah\"ie\\
Chapter 9 - Discussion 188
and is easy to modify. The hardware on the rig can also be easily upgraded due to
the modular nature of the National Instruments equipment. The dynamometer is
capable of testing different brake systems. This can be achie\ed by installing
different uprights on the rig and changing the coupling from the \ehicIe driye shaft
and the dynamometer drive. The dynamometer was designed this v.ay to ensure that
it can be used for future research projects. The dynamometer has demonstrated that
it is capable of:
• Heating the brakes to a specified temperature.
• Measuring the static coefficient of friction as a function of temperature.
• Measuring the change in cable load as a function of temperature.
The dynamometer showed that the nonnal clamp load at the brake frictional
interface decreased as the brake cooled with all of the pads used in this research
installed. All of the pads tested on the dynamometer lost over 29% of the initial
applied cable load. This suggests that rollaway cannot be overcome by changing the
properties of the pads within the range of pads tested for this research. The
dynamometer cable load results did show that the pad can have an effect on the
percentage of lost cable load as the brake cools. This suggests that the pad does
influence the likelihood of rollaway occurring and that other brake system
components have a significant affect on the likelihood of rollaway. It is therefore
possible to produce a pad that will reduce the likelihood of rollaway.
All of the tests conducted for this research showed that the percentage of lost cable
load is directly related to the initial test temperature. This result shows that the
likelihood of rollaway occurring can be reduced if the initial brake temperature can
be reduced. This can be achieved if the rear brake had an improved cooling
mechanism. The brake temperature could also be reduced if the rear sen ice brake
was required to conduct less work. This could be achieved if the front brake
conducted a larger proportion of the braking effort.
The increased temperature of the rear brake can lead to disc coning. The design of
the Jaguar S-Type rear disc, shown in Figure 4.5. indicates that it may be prone to
disc coning. If the disc was exhibiting significant coning it would airect the contact
Chapter 9 - Discussion 189
pressure distribution at the frictional interface, which may explain the wear
characteristics shown in Figure 6.30 and Figure 6.31. The varying contact pressure
distribution as the disc cools may affect the friction level generated by the brake.
which could lead to rollaway. No measurements of the disc deflection were taken for
this research and it is therefore not possible to quantify the effect that disc coning
has on rollaway.
The amount of excess applied force going from the just hold condition to the park
condition had an affect on the likelihood of rollaway occurring. The higher the
amount of excess force, the more stored energy would be in the parking brake
system and the vehicle would be less likely to roll away. The amount of applied
excess load would be increased if the driver of the vehicle applied the parking brake
more than one extra notch when parking the vehicle. This could be achieved by
educating the driver through instructions in the vehicle hand book.
The number of notches on the park brake ratchet mechanism could be reduced to
reduce the likelihood that the 'just hold' condition is close to the ·park· condition.
This would result in an increased probability that the amount of excess load would
be higher reducing the likelihood of rollaway. This could however result in driver
dissatisfaction due to poor lever feel.
The amount of excess applied load could also be increased by replacing the manual
parking brake lever with an electronic park brake (EPB). The EPB can he set to
apply sufficient excess load to reduce the likelihood of rolla\vay. The EPB is also
capable of monitoring the rear brake temperature and the gradient on \ .... hich the
vehicle is parked. This information coupled with the results from this thesis can he
used to program the EPB controller to ensure that the likelihood of rolla\\ay IS
minimised.
The dynamometer tests and Matlab model results showed that rollawa: can he
reduced by reducing the disc thickness. This is because the thennal contracti(JIl~ of
the disc are reduced. Reducing the disc thickness will however increase the Ji~c
temperature due to the reduced thermal mass. The thennal contraction~ of the disc
can be reduced by reducing the thermal expansion coetlicient of the disc material.
Chapter 9 - Discussion 190
Alternative disc materials such as Carbon Ceramic (CSiC) brake discs might be able
to achieve this.
The dynamometer tests showed that the thickness of the pad was found to have no
correlation with the percentage of lost cable load. The Matlab model results suggest
that the thickness of the pad does affect the percentage of lost clamp load. The
model assumes that the pad has a uniform temperature whereas the pad on the
dynamometer was unlikely to have a uniform temperature. The surface temperature
of the pad is likely to have a higher temperature that the back plate. The result
suggests that the thermal contractions of the pad can influence the likelihood of
rollaway but to a lesser extent to that predicted by the mathematical model.
The dynamometer static friction results have shown that the coefficient of static
friction varies with temperature for the pads tested. For Pads 1, 3 and -+ the friction
level generally increases with temperature from 20C to 200C. This means that if the
brake was cooling from 200C the friction level would decrease reducing the torque
developed by the parking brake. This would increase the likelihood of rollaway
occurrmg.
The tests discussed in Section 6.9.2 showed that it is possible to vary the static
friction level of the pad as a function of temperature. This was achieved by
modifying the amount of fused alumina in the friction material formulation. The
results suggest that it is possible for the friction material chemist to design a pad that
has a friction level that remains constant with temperature or increases as the
temperature of the pad reduces. This will reduce the likelihood of rollaway
occurnng.
The measured thermal expansion results for the pad had a greater variation than the
disc. This could be due to the composite nature of the friction material. The volume
of each constituent material could vary between the samples tested. which could
vary the measured results. A way to reduce the variations would be to usc larger
samples or to ensure that the constituent ingredients were dispersed evenly in the
friction material. Friction material manufacturers are constantly improving their
. d" ed more evenlv \,"ithin mixing techniques to ensure that the constituents are Ispers .
Chapter 9 - Discussion 191
the friction material. This will reduce the variations between pads from the same
formulation and will produce more consistent performance.
The finite element simulation, discussed in Chapter 7, was used to model the
performance of a park brake system as the brake cooled from an elevated
temperature. The model assumed a simplified geometry to reduce comp1exit~ and
computational time. The model demonstrated how the contact pressure at the
frictional interface varied as the brake cooled. The results predicted by the model
have a good correlation to those measured on the dynamometer. The model predicts
that the percentage of clamp load that is lost can be reduced by reducing the thermal
expansion of the pad. The model predicts that pads with a greater variation between
the Young's modulus at 30C and 250C will perform better than pads with a more
constant Young's modulus with varying temperature. This suggests that friction
material chemists can design a pad that has a large increase in Young's modulus as
the brake cools to reduce the likelihood of rollaway.
The material property tests described in Chapter 6 showed that large variations are
present in the measured material properties of the brake components. The
accumulation of these variations is present in the mathematical model results
discussed in Chapters 7 and 8. Therefore the models are not capable of giving
precise predictions of rollaway. The models are however a good tool for predicting
the trend of the parking brake performance with varying system parameters.
The Matlab model demonstrated that the amount of lost clamp load could be varied
by changing the stiffness of the pads as a function of temperature. The
compressibility of the pads can be used to overcome the thermal contractions of the
pad and disc as the brake cools. This suggests that friction material chemists can
design a pad to reduce the likelihood of rollaway occurring.
The Matlab simulation predicted that rollaway could be reduced by heating the front
parking brake cable. The load in the cable increases as the cable cools due to the
thermal contractions. The model assumed that the parking brake cables wer~ 1000
0
efficient, which would not be the case in reality. The enicienc~ of the cables would
depend on the cable routing, the lubricity of the cables outer sheath and the loads in
Chapter 9 - Discussion 192
the cable. The cable will become more in-efficient at higher loads due to the cable
stretching and an increased frictional force between the cable and outer sheath.
The model did not take the efficiency of the cable system into consideration because
the model was attempting to simulate the dynamometer conditions and results. The
cable load on the dynamometer was measured at the cable attachment point on the
calliper and therefore the cable inefficiency was not measured. The efficiency of the
cable system is dependant on the cables used, the layout of the cable system and the
loads in the cables. If the cable efficiency was taken into consideration the effect of
the increase in clamp load generated by Cable 1 cooling from an elevated
temperature would be reduced. This means that Cable 1 would have to be at a higher
initial temperature to produce the same result. If the cable efficiency was taken into
consideration the initial displacement U1 would have to be increased to achievc the
same clamp load.
The cooling rates used in the mathematical models have assumed that the brakc
components are cooling in still air. In reality the cooling rates will be atTected by
other components on the vehicle and the prevailing weather conditions. The brake
cooling will be influenced by vehicle components such as the rear uprights, dirt
shields and the geometry of the wheel arch. The cooling rate of Cable 1 will be
influenced by the surrounding vehicle components. The cable on the vehicle may be
affected by the engine exhaust which may slow the rate of cable cooling because the
exhaust will take a period of time to cool.
Chapter 10 - Conclusions and recommendations for further work 193
Chapter 10
Conclusions and recommendations for further work
This Chapter discusses the main observations and findings of the research reported
in the thesis. The chapter also includes a set of recommendations for areas of further
work.
10.1. Conclusions
This research has investigated the phenomenon of vehicle parking brake rollaway.
Many of the tests conducted were found to be of a fugitive nature with large
variations in the results. This emphasises the complexity involved in studying
vehicle parking brake systems. Experimental and computational approaches have
been employed to study the system and the results have been collaborated to identify
methods to reduce the likelihood of rollaway occurring. The main findings of the
research can be summarised as follows:
• Rollaway is more likely to occur for higher initial brake temperatures.
Therefore the likelihood of rollaway occurring can be reduced by reducing
the temperatures generated in the rear brakes. This can be achieved by
improving the cooling regime of the rear brakes or by reducing the level of
braking conducted in the rear brakes.
• Rollaway is less likely to occur with a larger amount of stored elastic energy
in the system. Stored elastic energy can be applied to the system by
increasing the parking brake lever effort when parking.
•
•
The thermal contractions of the disc were found to have a significant etTect
on the likelihood of rollaway. The thermal contractions of the disc can be
reduced by reducing the initial temperature of the brake, reducing the
thickness of the disc or by reducing the thermal expansion coetlicient of the
disc material.
The thermal contractions of the pad have an effect on the likelihood of
rollaway occurring. The thermal contractions of the pad are less signi ficant
than the thermal contractions of the disc in reducing the likelihood of
rollaway.
Chapter 10 - Conclusions and recommendations for further work 19.+
•
•
The static friction level at the pad/disc interface can vary as a function of
temperature and directly influence the torque developed by the parking brake
system. A friction pair that has a static friction level that remains constant
with temperature or increases as the brake cools can be used to reduce the
likelihood of rollaway occurring.
The Young's modulus of the pad friction material as a function of
temperature was found to have a significant affect on the likelihood of
rollaway. The likelihood of ro II away occurring can be reduced by selecting a
pad friction material that has a large increase in Young's modulus as the
brake cools.
• Rollaway can be reduced by heating the front parking brake cable before the
vehicle is parked. The thermal contractions will increase the load in the front
cable and at the frictional interface.
10.2. Recommendations for further work
Knowledge in this research area can be improved by the following suggestions for
further work:
(1) The static friction evaluations, described in Chapter 6, were conducted with the
constant torque applied in the opposite direction to which the brake was dragged.
This simulates a vehicle parked facing down a gradient. The friction level could be
investigated further by conducting tests with the torque applied in the same direction
to which the brake was dragged. The present dynamometer is capable of conducting
these tests. The dynamometer is also capable of applying different constant torques
on the dynamometer axle. This will enable to the friction level to be investigated as
a function of normal load and will simulate the vehicle parked on different gradients.
(2) The on-vehicle tests have proved that rollaway occurs on the Jaguar S-lype and
the Jaguar X-Type. It is believed that rollaway is due to a particular type of parking
brake system that uses an integrated floating rear calliper. Tests could be conducted
on alternative vehicles using integrated rear callipers to imcstigatc their
Chapter 10- Conclusions and re(:ommendations for further work 195
performance in a rollaway evaluation. These tests may identify system components
that are sensitive to the rollaway results.
(3) The mathematical models could be further developed and improved with
additional material property measurements. This could be achieved through further
testing in the laboratory to measure the thermal parameter of the materials such as
specific heat capacity and thermal conduction.
(4) The effect of disc coning on the likelihood of rollaway was not studied in detail
during this research. Further work could be conducted to measure the deflections of
the Jaguar S-Type disc as a function of temperature. These tests could be conducted
using the dynamometer test facility or the FE model could be used to investigate
disc coning. Other disc designs that have different tendencies to coning could also
be used to quantify the effect of disc coning on the likelihood of rollaway.
References 196
References
1. Pindar D (2004). Federal Mogul, Private communication
2. Mckinlay A. J., Levitt A., Heald J., Hamilton O. The Mystery of Vehicle
Rollaway. Level 4 project. The school of Mechanical Engineering, The
University of Leeds, 2003.
3. Limpert R. Brake design and safety, ISBN 1-56091-915-9, second edition.
SAE, 1999
4. Ma C.Thennal buckling of automotive brake discs, Doctor of Philosophy
thesis, The University of Michigan, 2004.
5. Owen C. E., Today's technician: Automotive brake systems. Delmar
Learning, 3rd edition, ISBN-I0: 1401838901. 2003
6. Gould P., Private communication, 2004, BOSCH Systemes de Freinagc.
France
7. Harper G. A., Brakes and friction materials - the history and development
of the technologies, John Wiley and sons, ISBN-1 0: 1860581277. 1998
8. Smales H., Friction materials - black art or science? Proceedings of the
Institution of Mechanical Enginers Part D. Vol 209 pp 151-157. 1994
9. Mckinlay A. J., Brooks P. C." Barton D. C. Bissett A. Pindar D.The
Mystery of Vehicle Rollaway, Braking 2004, International conference.
Leeds, Professional Engineering Publishing Ltd. ISBN 1 86058 464 O. 2004
References 197
10. Mckinlay A. J. Brooks P. C. Barton D. C. A study of Vehicle Handbrake
Rollaway: a theoretical. numerical and experimental assessment. Braking
2006 International conference, York, ISBN 0 85316 245X, 2006
11. Harding P. R. J., Day A. J., Instability in the hand-brake performance of
cars and vans. Institute of mechanical engineers automobile division
proceedings part D, volume 195 no. 27, p 315-323.1981.
12. Elvenkemper A. Investigation of torque output variation in a duo-servo park
brake system using six sigma tools and FE-Analysis. Proceedings of the 24th
annual brake colloquium and exhibition. SAE international, 2006-01-3199.
2006
13. Perkins S. Electronic Parking Brake: Simple lever to safety critical system.
2004 SAE world congress. SAE technical paper series, 2004-01-1732.
14. Balnus C. Customer Orientation in the design process of an
electromechanical parking brake - A vehicle manufacturer's point of view.
21 st Annual brake colloquim and exhibition, SAE technical paper series
2003-01-3310(2003).
15. Eggleston D., EURAC Technical Bulletin Series, 00010433, www.eurac
• Apply just sufficient effort to the parking brake lever to reach the first notch.
Record the applied effort.
• Repeat the first step for all other remaining notches on the handbrake lever.
Appendix A 20"
Gradient tests
• Drive the vehicle onto a 300/0 gradient facing up the slope. Stop and hold the
vehicle by applying just sufficient service brake effort to prevent the vehicle
from rolling.
• Shift transmission to neutral, apply a steady effort of 400 N to the parking
brake, and release the service brake.
• If the vehicle rolls, repeat the previous two steps using increased effort until
the maximum steady effort to prevent rolling is reached.
• If the vehicle does not roll at 400 N effort repeat the first two steps
decreasing the effort until a minimum steady effort to prevent rolling is
reached. Record the minimum steady effort to prevent rolling.
• Repeat the test with the vehicle facing down the hill
• Repeat the test on the 16% gradient
• Repeat the test on the 12% gradient
• If required repeat the test on the 12%) and 16% gradients with a trailer
attached to the vehicle.
General instructions
• Special attention must be given to the direction of the applied effort. For the
handbrake, the pulling effort must be perpendicular to the longitudinal axis
of the handbrake lever grip.
Appendix B ~()3
Appendix B
Federal Mogul Hot Hill Hold test procedure
Instrumentation
All instruments must be calibrated and have laboratory calibration records.lbe
instruments required are listed below:
• Accelerometer
• Parking brake lever effort gauge
• Parking brake lever travel gauge
• Two rubbing thermocouples on the rear discs
• On-vehicle data logging system
Equipment and facilities
• Clean dry and level paved straightway
• Gradients of 25%, 16.6% and 12% with a smooth, dry or damp concrete or
tarmac surface
Preparation
• Check that the correct brake components are installed and the vehicle tires
are in good condition.
• Install the required instruments on the vehicle.
• Load the vehicle to the required test weight.
• Burnish brakes (conduct 200 brake stops decelerating the \chide from
60kmlh to Okmlh using a constant brake line pressure of 30bar).
Procedure
Static test
• Apply just sufficient effort to the parking brake lever to rcach the first notch.
Record the applied effort.
• Repeat the first step for all other remaining notches on the handbrake Ie\ er.
Appendix B ~O-+ --"-"-------------------------- --~- ---
Gradient tests
• Drive the vehicle in an upwards direction on the 8% gradient.
• Determine the minimum line pressure for rear brakes only to hold the vehicle
stationary on the gradient.
• Apply, simultaneously, the handbrake and determine the minimum effort
required to just hold the vehicle on the slope.
• Apply the parking brake lever further until the next available notch on the
ratchet mechanism is engaged. Record the parking brake lever effort and the
number of notches on the ratchet mechanism required to park the vehicle.
• During the next 20 minutes notice parking time and brake temperature for
each movement of the vehicle.
• If the vehicle starts to roll within 20 minutes, repeat the test \\ith the
handbrake applied for one notch more as established in the fourth point.
Record the handbrake effort.
• Repeat the tests for rear disc temperatures of 100 C. 200 C and 300 C on
gradients of 80/0, 16.6% and 25%.
Appendix C 205
Appendix C
Rollaway On-Vehicle test procedure
Instrumentation
All instruments must be calibrated and have laboratory calibration records. The
instruments required are listed below:
• Accelerometer
• Parking brake lever effort gauge
• Parking brake lever travel gauge
• Two rubbing thermocouple on the rear discs
• In-line hydraulic pressure sensor
• Shaft encoder mounted on rear wheel
• Microphone inside vehicle
• On-vehicle data logging system
Equipment and facilities
• Clean dry and level paved straightway
• Gradients of 25%, 16.6% and 12% with a smooth. dry or damp concrete or
tarmac surface
Preparation
• Check that the correct brake components are installed and the vehicle tires
are in good condition.
• Install the required instruments on the vehicle.
• Load the vehicle to the required test weight.
Procedure
Un-bedded gradient tests
• • •
Use pads in an un-bedded condition
Drive the vehicle in an upwards direction on the 8% gradient.
Determine the minimum line pressure for rear brakes only to hold the \ehicle
stationary on the gradient.
Appendix C '()6
• Apply, simultaneously, the handbrake and determine the minimum etTort
required to just hold the vehicle on the slope.
• Apply the parking brake lever further until the next available notch on th~
ratchet mechanism is engaged. Record the parking brake lever efTort and the
number of notches on the ratchet mechanism required to park the vehicle.
• Allow the rear discs to cool to a temperature of ambient plus 1 OC.
• During this time the temperature of the discs, movement of the rear axle and
any noise are logged using the on-vehicle data logging system.
• If the vehicle rolls away the parking brake lever is applied to the next
available notch. The effort required to achieve the next available notch is
recorded.
• Repeat the test for temperatures of SOC and 100C with the vehicle facing up
and down the slope on gradients of 8%, 16.6% and 25%
Bedded gradient tests
• Burnish brakes (for the required tests) by conducting 200 brake stops
decelerating the vehicle from 60kmlh to Okmlh using a constant brake
line pressure of 30bar.
• Drive the vehicle in an upwards direction on the 8% gradient.
• Determine the minimum line pressure for rear brakes only to hold the
vehicle stationary on the gradient.
• Apply, simultaneously, the handbrake and determine the minimum effort
required to just hold the vehicle on the slope.
• Apply the parking brake lever further until the next available notch on
the ratchet mechanism is engaged. Record the parking brak~ lever effort
and the number of notches on the ratchet mechanism required to park the
• •
vehicle.
Allow the rear discs to cool to a temperature of ambient plus 1 OC.
During this time the temperature of the discs, movement of the rear ax Ie
and any noise are logged using the on-vehicle data logging system.
Appendix C 207
• If the vehicle rolls away the parking brake lever is applied to the ne,t
available notch. The effort required to achieve the next available notch is
recorded.
• Repeat the test for temperatures of SOC, 100C, lOOe and 300e with the
vehicle facing up and down the slope on gradients of 8%. 16.6°0 and
250/0
Appendix D
Instrumentation
• Torque wrench
Appendix D
Dynamometer setup procedure
Equipment and facilities
• Leeds parking brake dynamometer
• Parking brake dynamometer tool kit
Preparation
• Ensure that the correct brake components are installed.
• Check that the wheel nuts are tightened to a torque of 80Nm.
• Check that the calliper bolts are tightened to a torque of 55Nm.
• Lubricate the bearings on the drive rig.
• Check that the pulley wheels on the motor and drive rig are tightened to a
torque of 80Nm.
208
• Make sure that the grub screws on the drive rig are tightened to a torque of
20Nm.
• Check that the shafts on the cable rig are in the correct position with grub
screws tightened to a torque of 20Nm.
• Make sure that the correct hydraulic circuit is selected on the drive rig and
that the appropriate taps/valves are open.
• Bleed the brake system
Appendix E
Instrumentation
Appendix E
Normal load test procedure
• Two 2kN Novatech load cells in-line with the rear parking brake cables
• Two K-type rubbing thennocouples on the rear discs
209
• Hohoner quadrature shaft encoder with 720 measurement locations per
revolution.
• Sensotec hydraulic pressure sensor
• McLennon stepper motor to apply the parking brake cable
The full details and specifications of the instruments used are given in Chapter 5.
Equipment and facilities
• Leeds parking brake dynamometer
• Leeds parking brake data logging and control equipment
• Desktop PC
Preparation
• Follow the setup procedure described in Appendix D
Appendix E
Procedure
Operation
1
2
3
Description
Turn on PC
Turn on solenoid power supp] y and turn both solenoids on
Turn on stepper motor
210
Photograph
Appendix E _11
4 Turn on thermocouple amplifier
5 Tum on load cell amplifier
6 Load labview program
Appendix E J 1
7 Load force test script
8
9
Zero outputs
Turn on hydraulic controller
l ___ - 0 ......... ·---'.1-
-if
,'/ I II I 111111 , I I , I I I I I
1/11111111111' II I I , , I I I
Appendix E
10
11
12
Tum on hydraulic power pack
Set hydraulic pressure to 20bar
Check solenoids are working and the axle rotates
1'1 \11\ 1\ \\\\ \\\\\1\1\\\\\ I 1\111111\1\\\\\\\\\\\\\\\
213
Appendix E 214
13 Turn on extraction
14
15
Tum the power supply to the motor on, and reset the drive
Close cage door
DO
Appendix E 215
16 Turn on the electric motor
17
18
19
Start the labview test
Turn the appropriate solenoid(s) off when prompted to do so by labview
When the test has fini shed ensure that everything is turned off.
Appendix F 216
Appendix F
Static friction test procedure
Instrumentation
• Two 2kN Novatech load cells in-line with the rear parking brake cables
• Two K-type rubbing thennocouples on the rear discs
• Hohoner quadrature shaft encoder with 720 measurement locations per
revolution
• Sensotec hydraulic pressure sensor
• McLennon stepper motor to apply the parking brake cable
The full details and specifications of the instruments used are given in Chapter 5.
Equipment and facilities
• Leeds parking brake dynamometer
• Leeds parking brake data logging and control equipment
• Desktop PC
Preparation
• Follow the setup procedure described in Appendix D
Appendix F
Procedure
o n 1
2
3
Descri tion Turn on PC
Turn on solenoid power supply and turn both solenoids on
TruTI on stepper motor
'1
Appendix F _ 1
4 Turn on thermocouple amplifier
5 Tum on the load cell amplifier
6 Load the labview program
Appendix F
7
8
9
Load static friction test script
Zero outputs
Tum on hydraulic actuator solenoids
219
---- ---0 -- ........ -
Appendix F __ 0
10 Make sure that the hydraulic actuator is out stroked and positioned at the top of the cable rig. If the actuator is not in this position, move it to this position.
11
12
Turn on hydraulic controller
Tum on hydraulic power pack
/1///"~,1/11111",1 1 I I.
/////',/ 1/111" ",',11
\\\\""""""""11'111111
• • •
Appendix F
13
14
15
Set hydraulic pressure to 20bar
Check solenoids are working and the axle rotates
Turn on extraction
Appendix F
16
17
18
Turn the power supply to the motor on, and reset the drive
Close cage door
Turn on the electric motor
II
DO
Appendix F
19
20
21
Start the labview test
Tum the appropriate solenoid( s) off when prompted to do so by labview
When the brakes are at the correct temperature and the motor has stopped, enter the cage and turn off the motor power supply
L..........J
DO
Appendix F
22
23
24
Attach the cable bracket to the large wheel on the drive rig
Rotate the large wheel 'A'Tapping the cable around it
The hydraulic pressure will then increase to 50bar
Once at the correct height switch the hydraulic controller to neutral
Appendix F
28
29
30
The hydraulic pressure will now reduce
When the axle starts to rotate and the weights begin to fall, apply the handbrake lever to slow the acceleration of the weights. Slowly bring them down so that the locate into their original position.
Vi ait for the test to finish and the hydraulic brake press UTe will retwn to 0 bar
II 1\\ \\\1\\1\\11\\\\\ 1'11\ 1111\\\\\\ 11\\\\
1 ih \\\\H\\\\\\\"\\\ "",,,II' \\\\ \\\\1\\
11111\ 1\'111 I I I \ \ I \\ \\ \\\\ \\ \ \
" \\ll\ .. \\\\\\\\\\\\\\\\\
776
Appendix F _ 7
3] Raise the hydraulic actuator to its starting position (out stroked)
32 When the test has finished tum off all of the equipment
Appendix G
Appendix G
Compression tests with Jurid compression tester
Instrumentation
• • •
Thermocouple embedded in back plate of pad
Thermocouple embedded in hot plate
Heidenhain digital displacement transducer.
Equipment and facilities
• lurid compression tester
Preparation
• A hole is drilled into the backplate of the pad
• A thermocouple is placed inside the hole and bonded using adhesive
Procedure
• The pad is placed inside the jurid compression tester
• The data logging is started
• The hotplate is turned on and set to the correct temperature and left for 10
minutes to achieve a uniform temperature in the pad
228
• After 10 minutes the temperature of the pad back plate is checked to ensure
that the pad is at the correct test temperature.
• If the pad has not achieved the correct temperature it is left for a further
minute and re-checked.
• A load is applied on the piston equivalent to 5bar of hydraulic pressure in the
brake line.
• The load is ramped to the required load for the test over a period of 2
seconds
• The load is reduced to an equivalent hydraulic pressure of 5 bar oyer a period
of2 seconds
• The test load is applied and released a further four times
• The maximum deflection of the pad is measured each time
• The data logging is stopped
Appendix G
• The results are displayed giving the deflection of the pad as a function of
applied load and temperature.
119
Appendix H .:230
Appendix H
Thermal expansion tests using DMA
Instrumentation
• Displacement transducer probe
• Thermocouple
Equipment and facilities
• DMA testing machine
• PC
Preparation
• Turn on the helium supply to the furnace
• Tum on the water cooling supply
• Turn PC on
• Load DMA software
Procedure
• Lower the furnace
• Place furnace cover over the hole on the furnace
• Move the measurement probe to the maximum position
• Remove protective rubber bung from sample platform
• Move the probe down to the platform base
• Tare the probe
• Move the probe to the maximum position
• Place silica disc on measurement platform
• Move the probe down
• Set the probe apply force to 2mN
• Read the zero value
• Move the probe up to the maximum position
• Place the test specimen on the silica disc
• Bring the probe down
Appendix H 231
• Read the height of the specimen
• Remove furnace cover
• Move furnace up to encase the sample platfonn
• Set the furnace temperature to 30C
• Start the DMA logging software
• Hold the temperature of the specimen at 30C for 1 minute
• Increase the specimen temperature from 30C to 300C at a rate of 1 OC p~r
minute
• • • • • • • • • • • • • • •
Wait for 1 minute with the temperature at 300e
Stop the data logging
Cool the sample to 30C
Move the furnace down
Place cover over the furnace hole
Move the probe up to the maximum height
Remove the specimen
Remove the silica disc
Place protective rubber bung in sample holder
Bring the probe down
Remove furnace cover
Move furnace up to cover the sample
Turn off the PC
Tum off the water supply
Turn off the helium supply.
Appendix I
Appendix I
Thermal expansion tests using the Jurid testing machine
Instrumentation
• • •
Thermocouple embedded in back plate of pad
Thermocouple embedded in hot plate
Heidenhain digital displacement transducer.
Equipment and facilities
• J urid compression tester
Preparation
• A hole is drilled into the back plate of the pad
• A thermocouple is placed inside the hole and bonded using adhesive
Procedure
• The pad is placed inside the Jurid testing machine
• The displacement transducer is placed in contact with the back plate of the
pad
• The data logging is started
• The hotplate is turned on and set to the correct temperature and left for 10
minutes to achieve a uniform temperature in the pad
• After 10 minutes the temperature of the pad back plate is checked to ensure
that the pad is at the correct test temperature.
• If the pad has not achieved the correct temperature it is left for a further
minute and re-checked.
• Once at the correct temperature the data logging is stopped
• The hotplate is cooled back to ambient temperature