Page 1
The Phytoplankton of an enriched, soft-water lake subject to intermittent
hydraulic flushing. (Grasmere, English Lake District)
by C.S. Reynolds and J.W.G. Lund
Project Leader : C.S. Reynolds
Report Date : November 1987
Report to : North West Water
FBA Report Ref No. Wl/207/5
FBA Project No. 207
Page 2
The phytoplankton of an enriched, soft-water lake subject to intermittent
hydraulic flushing (Grasmere, English Lake District).
C.S. REYNOLDS and J.W.G. LUND, Freshwater Biological Association, Windermere
Laboratory, Ambleside, Cumbria LA22 OLP, U.K.
Running Head : Phytoplankton of Grasmere
Correspondence : C.S. Reynolds, Freshwater Biological Association, Windermere
Laboratory, Ambleside, Cumbria, LA22 OLP
Page 3
2
SUMMARY 1. The abundance and species composition of the phytoplankton of
Grasmere were monitored over a 12-year period following the commissioning
of a small sewage treatment works, upstream of the lake.
2. Although Grasmere has been subject to increased phosphorus-loading and has
quickly developed many features associated with eutrophication, the
composition of its plankton has retained the characteristics of a
mesotrophic, soft-water lake: a vernal diatom maximum, generally dominated
by Asterionella, is followed by summer growths of nanoplanktonic species,
of various colonial Chlorophyceae, before a substantial return to
Asterionella-dominance in the autumn. In cooler summers, there have been
episodes of renewed diatom growth, followed by truncated recapitulations of
the essential summer sequence. Anabaena solitaria was relatively common in
drier summers when dissolved inorganic nitrogen fell to low concentrations,
although many of the 'larger' algal species associated with stratified
eutrophic lakes (Aphanizomenon, Microcystis, Ceratium spp.) have failed to
become abundant in Grasmere.
3. Mean biomass levels (as indicated by chlorophyll concentration) have
increased in response to the enrichment, though they do not conform well
with most chlorophyll/phosphorus regression-models.
4. The key factor resisting a more complete transition to a typical eutrophic
plankton appears to be the efficiency of episodic flushing of the lake
during periods of high fluvial discharge sustained by heavy rainfall over
the extensive, mountainous catchment. The probabilities that these
limnological conditions might fail to deter the development of 'nuisance'
blooms are briefly assessed.
Page 4
3
Introduction
This paper describes some characteristic features of the phytoplankton of
Grasmere (54°27'N, 3°0'W; National Grid Reference NY 338064), one of the
smaller of the principal lakes of the English Lake District, and attempts to
relate these to distinctive physical and chemical properties of the lake. In
contrast to some of the neighbouring lakes, Grasmere does not have a long
history of intensive limnological study. It was omitted from the early
comparative surveys undertaken by Pearsall (1921, 1930) and Mortimer (1941),
although some basic data on its physical, chemical and biological features have
been accumulated since 1949 (see Lund, 1981). Published observations include
those on underwater light penetration in the lake (Tailing, 1971), major-ion
and nutrient chemistry (Gorham et al., 1974; Carrick & Sutcliffe, 1982), lake
metabolism and hypolimnetic oxygen deficits (Jones, 1972; Hall et al., 1978),
on its zooplankton (Smyly, 1968; Elliott, 1977) and its fish populations
(Pearsall & Pennington, 1973). Reference to the phytoplankton of Grasmere is
made in Pearsall & Pennington (1973), Gorham et al. (1974), Reynolds (1980) and
Lund (1981). These various studies afford no conclusive ascription of Grasmere
to any particular trophic category; while the seasonal consumption of
hypolimnetic oxygen is diagnostic of mildly eutrophic lakes, the biota were
generally characteristic of rather more oligotrophic systems.
Hydrobiological interest in Grasmere expanded in the late sixties when a
new sewage treatment works was proposed to replace existing septic-tank
arrangements in the village of Grasmere: the principal concern was that the
supposedly fine balance of the trophic condition of the lake might be
significantly altered. An activated-sludge treatment plant, discharging into
the River Rothay, some 300 m upstream above its outfall into Grasmere lake, was
eventually commissioned in June, 1971. Owing to persistent problems of
Page 5
4
storm-dilution and overflow of the untreated sewage, which detracted from
efficient operation of the plant, it became necessary to modify the disposal
arrangements. Since the end of 1982, the treated effluent has been piped
directly to a point within the lake, some distance from the shore. Thus, this
12-year period, 1971-1982 (inclusive) represents a well-defined phase in the
history of nutrient loading on the lake and it is therefore an appropriate one
over which to assess the biomass, species composition and seasonal periodicity
of the phytoplankton of Grasmere.
Limnological Features of Grasmere
Grasmere is 64.4 ha in extent and comprises two distinct basins separated
by a shallow island ridge (see Fig. lb): the eastern basin is considerably
larger and deeper (max. depth: 21.5 m)„ than the western arm (10.2 m). The
total storage capacity of the lake is 4.99 x 10⁶m3, with a mean depth of
c. 7.7 m (Ramsbottom, 1976). Nearly a dozen small streams augment the
principal inflow, the Rothay (which also drains Grasmere into Rydal Water and
thence to the North Basin of Windermere). The topographical catchment (Fig. 1a;
2 area: 27.9 km ) is almost wholly based on the unyielding Ordovician volcanic
rocks of the Borrowdale Series forming the mountainous, glacially-dissected
core of the English Lake District but which are locally covered by
catchment-derived drift or alluvium (Moseley, 1978). The altitude ranges from
745 to 65 m a.s.l. Generally thin soils support open fell-land, improved
pasture and scattered woodland.
Mean annual precipitation on the catchment (in the range 2.3 to 3.3 m),
net of evapotranspiration (c. 0.5 m annually), generates an annual discharge to
Grasmere of some 50-80 x 106m3, that is, sufficient to displace the volume
of the lake between 10 and 15 times per year. Thus, the mean retention time of
Page 6
5
Grasmere varies between 24 and 37 days but, owing to the nature of the
catchment and the variability in the intensity and seasonal distribution of
rainfall, the instantaneous retention fluctuates between 9 and > 65 days.
The natural water supplied to the lake is chemically dilute with respect
to major ions (mean alkalinity: 141 uequivalents 1-1; Carrick & Sutcliffe,
1982) and is also relatively deficient in plant nutrients, especially
phosphorus. However, the concentrations of (e.g.) nitrate and dissolved
silicon depleted as a consequence of biological production, are rapidly
restored during subsequent periods of high fluvial discharge into the lake (see
later). Moreover, "the supply of ammonium ions and of total phosphorus is
significantly augmented by the input of sewage effluent, particularly when low
fluvial discharges obtain during summer (see Hall et al., 1978).
Methods
Quantitative data presented herein are derived from 5-m vertical column
samples, collected with a flexible polyethylene hose (Lund & Tailing 1957)
close to the deepest point of Grasmere, generally at intervals of 14 days ( 7
days from 1972 to 1978, inclusive). The concentrations of nitrate (+ nitrite)
and ammonium nitrogen, of total (TP), soluble reactive phosphorus (SRP) and of
soluble reactive silicon (calculated as SiC2) were determined by the
currently-standard spectrophotometric methods adopted by the FBA (Mackereth,
1963; Mackereth, Heron & Tailing 1978). Prior to standardization on the
technique of reduction to nitrite with spongy cadmium and diazotization (Morris
& Riley, 1963) in 1972, some of the early measurements of nitrate concentration
followed the phenoldisulphonic acid method and are likely to have been
underestimated (see Carrick & Sutcliffe, 1982).
Page 7
6
Aliquots of the same original samples were also analyzed for the
concentration of chlorophyll a, which was extracted in hot 90% methanol and
estimated spectrophotometrically according to the method of Tailing & Driver
(1963); no correction has been applied for phaeophytin concentration. Further
aliquots were fixed on collection in a solution of Lugol's Iodine for later
enumeration of the individual algae. Small-celled nanoplanktonic species were
counted in subsamples concentrated from 300 ml by sedimentation and viewed
microscopically at high-magnification (x 400) in pre-calibrated slide-chambers,
according to Youngman's (1971) modification of the method of Lund (1959).
Until the end of 1979, the larger-celled and colonial species were approximated
in appropriate subsample volumes (0.1-100 ml) by the direct sedimentation and
inverted-microscope technique of Lund, Kipling and Le Cren (1958).
Subsequently, these algae were counted, at lower magnification, in the same
subsamples prepared for nanoplankton.
Supporting information pertaining to the periodic hydrological flushing of
Grasmere is derived from continuous flow-measurements made at the Newby Bridge
gauging station, located at the outfall of Windermere (see later), and was
kindly furnished by the North-West Water Authority. These records are also
archived at the Institute of Hydrology, Wallingford, Berkshire (Station 25005).
Results
General behaviour of the phytoplankton community.
A generalized synopsis of the temporal fluctuations in the abundance of
phytoplankton in Grasmere through the 12-year study period may be gained from
the representation (Fig. 2) of available measurements of the chlorophyll
content of standard 5-m column samples. In most years, the concentration of
algal chlorophyll a fluctuated within a range 0.2 to 30 µg chl a l-1, with
Page 8
7
an evident tendency towards a diacmic distribution of the biomass. The earlier
of the peaks developed during the period January to April or May of each year;
the second built up through summer, reaching its maximum level in August or
September. However, there is a good deal of fluctuation superimposed on this
basic pattern, with additional intermediate peaks sometimes reaching comparable
or even higher concentrations of chlorophyll. Notable cases were observed
during the summers of 1973, 1974, 1977, 1978, 1980 and 1982 and in the autumn
months of 1973, 1975 and 1976. The maximal (< 12 µg chl.a. 1-1) and mean
(< 6µg chl a l-1) concentrations observed in 1979 and 1980 were rather lower
than in most other years (Table 1) and indicate that significantly smaller
standing crops were supported in those years.
Few of the species encountered in the samples from Grasmere, listed in the
Appendix, regularly comprised a prominent fraction of the biomass. Those
dominating each major biomass peak are noted in Fig. 2. The diatom,
Asterionella formosa and, to a lesser extent, Dinobryon sp(p). (Chrysophyceae,
Ochromonadales), were conspicuous components of the Grasmere phytoplankton
outside the summer period of thermal stratification (generally May-September)
and, occasionally, within it (e.g. 1972, 1974). In the warmer summers, when
the stratification is assumed to have been both more intense and more prolonged
(1975, 1976, 1982), the plankton was variously dominated by motile, unicellular
Cryptophytes, Chrysochromulina and Chlamydomonas, by non-motile colonial
chlorophytes (notably Sphaerocystis), by colonial Chrysophytes (chiefly
Dinobryon spp.) and, on occasions, by the filamentous cyanobacterium Anabaena
solitaria. These organisms were often present in the cooler, wetter summers
but, with* the exception of Dinobryon, were either continuously subdominant or
dominated only briefly. It is of interest that large populations of planktonic
genera commonly associated with small, mildly-eutrophic lakes (Eudorina,
Page 9
Volvox, Aphanizomenon, Microcystis, Ceratium) have not been encountered.
Indeed, both the scale and the species composition of the phytoplankton biomass
have continued to retain their mesotrophic character, despite the increased
loading of nutrients attributable to the input of treated sewage.
Hydraulic and Nutrient Loading
Pertinent to the interpretation of the general observations on the
seasonal distribution and abundance of the phytoplankton is a consideration of
environmental constraints imposed on population development by hydraulic
displacement during high fluvial discharges and by the availability of
potential growth-limiting nutrients.
Episodes of intense flushing of Grasmere during the study period are
represented in Fig. 2. The data from which the inserted bars have been derived
actually pertain to daily discharges measured at the Newby Bridge outfall at
the south end of Windermere (SD 356852). The Windermere catchment, which
includes Grasmere, covers 230.5 km (Ramsbottom, 1976); it is reasonable to
assume that not less than 27.9/230.5 (= 0.12) of the discharge at Newby Bridge
passes through Grasmere. Thus, the symbols representing daily discharges of
< 2 x 10 and > 5 x 10⁶ d-1 respectively approximate to the
displacement of > 242 x 10 and > 605 x 103 m3 d-1 from Grasmere, i.e.
sufficient to replace the lake volume in < 20.6 or < 8.2 days. If it is
assumed that the volume of the lake (v) is also fully and continuously mixed,
then the suspended phytoplankton populations are subject to continuous dilution
by the inflow volume (q), according to the hyperbolic function:
(where N is the population at a given point in time, Nt is the residual
population after a period of time, t, and e is the base of natural logarithms).
8
Page 10
9
Solving empirically, the exponential rates of dilution during the identified
periods of high flushing approximate to > 0.048 and > 0.121 d ,
respectively.
These dilution rates are comparable with the in situ rates of specific
cellular increase in temperate lakes under conditions of winter isothermy
reported in the literature (reviewed in Reynolds, 1984a). Few species,
especially when limited by low temperatures or nutrient availability, could be
expected often to sustain sufficiently high rates of increase, net of other
sources of loss (e.g. cell mortality, sedimentation, grazing), under conditions
of short-day length and mixing through turbid, optically-deep water-columns
when simultaneously subject to relatively rapid flushing of the lake.
Moreover, populations that were severely depleted in this way must be expected
subsequently to build up from small residual stocks. Indeed, direct comparison
of the fluctuations in the standing crop of phytoplankton in Grasmere with the
distribution of flood periods (q/v > 0.05 d - 1 ) , represented in Fig. 2,
reveals not only that vernal increase of phytoplankton was typically suppressed
or delayed when such high discharges obtained (as in the early months of 1974
and 1978, cf. 1976, for instance) but that almost all flood periods were
followed by abrupt declines in biomass, especially those in autumn. It is
significant, too, that standing populations were so depleted sooner during wet
autumns than in drier ones (cf. particularly 1972, 1974, 1977 with 1973, 1975).
In this context, the ecological importance of 'wetness' lies less in a number
of rain-days or the daily inflow than in the frequency or duration of periods
of rapid displacement of water from the lake.
High fluvial discharges must nevertheless be expected to replenish the
supplies of nutrients removed by earlier episodes of phytoplankton growth and,
subsequently, to leave the medium relatively charged with reserves available
Page 11
10
for exploitation by recovering populations. Fluctuations in the instantaneous
concentrations of the principal plant nutrients believed to regulate
phytoplankton production and standing crops - phosphorus, nitrogen and, in the
special case of diatoms, silicon - are presented in Figs 3-5.
In the earlier years of the series (1971-1975) the soluble reactive
fraction of the phosphorus (SRP in Fig. 3) tended to fluctuate within low
limits (< 1 to up to 4 µg P 1 - 1 ) . So far as it is possible to make direct
comparisons with pre-1971 data, (e.g. Hall et al., 1978; Lund, 1981) mean
concentrations in the lake were raised by almost an order of magnitude
following the commissioning of the Grasmere STW. It is also apparent that
maximal concentrations have continued to rise since the mid-seventies (1976:
-1 -1 5.2 µg P 1-1) to between 11 and 22 µg P 1-1 since 1979. Except in the last
two years considered (1981/1982), epilimnetic SRP concentrations continued to
be reduced to the limits of detection (< 0.3 µg P 1-1) during the summer
stratification. Aquatic concentrations of total phosphorus (TP in Fig. 3)
scarcely moved out of the range 8-30 µg P 1-1 until 1979, since when maximal
-1 levels of 32-36 µg 1-1 have been recorded at the breakdown of the summer
stratification, as relatively P-rich, hypolimnetic water is entrained into the
full circulation. However, the mean winter concentrations ([TP]w) have
generally remained in the range 12-16 µg P 1-1
The concentrations of dissolved inorganic nitrogen sources, shown in Fig.
4 (DIN = NO3-.N + N02
-.N + NH4 +.N), have generally fluctuated
within the ranges 20-800 µg N 1-1 , with 0-140 µg N 1-1 contributed as
ammonium. Although much of the ammonium nitrogen flowing into Grasmere is
derived from sewage (Hall et al., 1978), the highest concentrations have been
found following the seasonal breakdown in thermal stratification. In contrast,
nitrate in the Rothay is largely derived elsewhere in the catchment and lake
Page 12
11
concentrations peak during the (winter) months when higher fluvial discharges
obtain; the lowest lake concentrations have been encountered during summer,
especially the drier ones (1975, 1976, 1981, 1982). There is an apparent
tendency for the limnetic DIN concentrations to have been higher since about
1977 but the change is scarcely significant.
Fluctuations in the concentration of dissolved reactive silicon, plotted
in Fig. 5 as mg Si02 1-1, have altered little over the study period, either
with respect to the scale of maximal concentrations (2.0 to 2.3 mg 1-1) or in
the temporal phasing of seasonal minima (generally in late spring or early
summer), but the extent of vernal or summer depletion has varied conspicuously,
to between < 0.02 mg 1-1 in each of the earlier years and to > 0.5 mg 1-1
through 1977 to 1980 inclusive.
There seems little doubt that, in spite of the more or less continuous
input of sewage-derived TP, episodes of phytoplankton production have continued
to be subject to phosphorus limitation, although nitrogen and silicon have on
many occasions been reduced to levels where they are likely to have been
limiting to many species. The extent of the dependence of Grasmere
phytoplankton on the available phosphorus can be assessed by reference to the
various well-tested model solutions relating relevant approximations of ambient
chlorophyll concentrations in the lake (as summarized in Table 1) to
quantitative expressions of the phosphorus supplied.
One of the most direct of these model equations, that of Dillon & Rigler
(1974), relates mean summer chlorophyll concentrations ([chl]s) to the mean
winter concentration of total phosphorus ([TP]w);
log [chl]s = 1.45 log [TP]w - 1.14
-1 Interpolating values for [TP]w of 12-16 µg P 1
-1 , [Chl]s evaluates at 2.7
to 4.0 µg Chl a 1-1. Though clearly predicting the actual observations
Page 13
12
within the correct order, the consistent underestimation is attributable to the
continued loading of phosphorus on the system during the year. The
relationship between mean summer standing crop and the mean epilimnetic
concentration of total phosphorus, evaluated for closed limnetic systems of the
'Blelham Tubes' by Lund and Reynolds (1982), applies quite well to the Grasmere
data:
log [chl]s = 0.998 log [TP]s - 0.287
With interpolated values of 8-30 µg P 1-1, this equation predicts mean summer
chlorophyll concentrations of 4.1 to 15.4 µg 1-1, a range which embraces the
observed mean values.
Vollenweider's (1976) model solution attempts to relate the mean annual
concentration of chlorophyll a ([chl]v) to the annual loading of phosphorus
on the system, corrected for mean depth (z) and the hydraulic retention time of
the system (x ):
log [chl]y = 0.91 log [L(P) (Tw/z (1 + √ T W ) ] - 0.435
In this instance, L(P), the annual specific areal load of phosphorus, is assumed to be wholly derived from the sewage effluent, which in dry, years
(i.e.when undiluted by storm run-off), amounts to some 500 m3 d-1 with a
concentration of 1 mg P 1-1 (North West Water, unpublished data). The
quantity of phosphorus introduced to the lake under such conditions is
calculated to be c. 500 g P d-1. This load may be anticipated to hold, even
when it is 'diluted' in much larger volumes of storm water. Thus, the
approximate annual load to Grasmere is calculated as 182.5 kg, or L(P) ~0.283
g P m-2 yr-1. Setting z, the mean depth of the lake, at 7.7 m and Tw the
hydrological retention time, at 1/15 to 1/10 year, the Vollenweider equation
yields mean chlorophyll concentrations of between 0.7 and 0.9 µg Chl a 1-1.
That this result is manifestly unrealistic probably owes to the fact that the
Page 14
13
average instantaneous hydraulic retention is scarcely constant. Rather, it is
erratic, often increasing to > 0.2 yr, and that the opportunity for the system
to accumulate phosphorus, supplied at the same rate of loading, is
significantly enhanced at low hydraulic discharges. At even 5 percentile flows
(i.e. < 30 x 103 m3 d-1 ), instantaneous hydraulic retention increases to
c. 0.5 year and which, at steady state and constant loading permits a TP
concentration of 11 µg 1-1 to be maintained, according to the Vollenweider
(1976) derivation.
The principal opportunities for the development of large standing crops of
phytoplankton will occur when removal due to outwash is minimal but the
available phosphorus is relatively abundant and other factors (light, nitrogen)
are saturating. Reynolds' (1978) relationship between the maximum sustainable
biomass and the phosphorus available to support it, viz.
log [chl]max = 0.585 log [TP] + 0.801
is appropriate to describe the observed chlorophyll maxima (Fig. 2) of c. 30 µg
chl a 1-1 against preceding TP concentrations of between 12 and 16 µg P
1 . The effect of periodically high throughput volumes must be to postpone
or reduce in scale the TP-limited maximum, especially when conditions of poor
insolation and depressed water temperatures obtain during winter.
Trends in the temporal distribution of individual species.
Fluctuations in the standing crops of several species prominent in the
plankton of Grasmere between 1972 and 1982, inclusive, are represented in Figs.
6-15.
Asterionella formosa (Fig. 6) was relatively more abundant each year
during a spring phase, peaking between late March (as in 1976) and early June
(1980), and then during an autumn phase, occurring between September and
Page 15
14
November. It is apparent that the scale and the timing of these maxima were
influenced, in part, by the distribution of flood periods: maxima developed
earlier in the relatively dry springs of 1972 and 1976 and populations also
persisted for longer in the drier autumns of 1973 and 1975. The alga was also
briefly abundant during periods in the summer, notably in 1973, 1974 and 1977;
corresponding peaks in years with warm summers and more persistent, stable
stratification ( 1975, 1976, 1982) tended to be smaller.
Considering the 12-year period as a whole, it is apparent that the
Asterionella maxima increased in size between 1972 and 1976 (from the order of
5 000 to 10 000 cells ml - 1, then declined until 1979 (crops < 1000 ml -1)
but recovered somewhat (c. 1000 ml -1) in 1981 and 1982.
Changes in the abundance of another diatom, Tabellaria flocculosa var.
asterionelloides are represented in Fig. 7. Save that the alga was always much
less abundant than the previous species during the early months in the year,
the seasonal distribution of population maxima is similar to that of
Asterionella. The largest population (of c. 1000 cells ml was observed
during the summer of 1972, since when the seasonal maxima have declined
steadily in magnitude.
Of the several genera of colonial Chrysophyceae showing distinctive
seasonal distributions, the most conspicuous was Dinobryon (Fig. 8). Much of
the material examined from some populations could safely be ascribed to D.
divergens but other species have been represented, sometimes in abundance (see
Appendix). Dinobryon populations were present every year, generally in mid- to
late-spring but sometimes extending into summer and, occasionally, well into
autumn (1973, 1974, 1980). Typical maximal crops of 100-300 cells ml were
exceeded in 1976 (c. 1000 cells ml ) and, especially, in 1979 and 1980 when
populations of 1000 to 2000 cells ml were also more persistent.
Page 16
15
Significant populations of colonial Chlorophyceae developed sporadically
throughout the study period. The most consistent of these was recognised as
Sphaerocystis schroeteri (Fig. 9), whose relative abundance was largely
confined to the late-spring and early-summer months of each year, producing
populations of > 5000 cells ml in 1973, 1978 and 1981. Sphaerocystis
maxima were usually preceded by the growth of Gemellicystis (Fig. 10), which
produced its larger crops (300-1000 cells ml-1) in 1974, 1977 and 1982), and
were generally succeeded by populations of either Dictyosphaerium (Fig. 11:
especially in 1973) or Paulschulzia (Fig. 12: especially in 1976). Taken
collectively, populations of colonial Chlorophyceae were generally more
prominent in Grasmere between 1972 and 1978 than subsequently, although some
recovery has been apparent during 1981 and 1982.
Anabaena solitaria (Fig. 13) produced significant populations ( > 100
cells ml ) during the summers of 1975, 1976, 1981 and 1982, but was rare
cell ml ) in most other years. This distribution coincides with the warmer
and drier summers, marked by relatively long phases of stable thermal
stratification and low fluvial discharge: under such circumstances, the supply
of nutrients becomes increasingly dependent upon the sewage effluent. The low
ratio of DIN:TP relative to the requirements of most algae is reflected in the
DIN concentrations observed in the summers of the relevant years, having
remained < 150 µg N 1-1 for two to three months on end in each of the years
concerned. These conditions are acknowledged to favour the selection of
nitrogen-fixing cyanobacteria of the Nostocales, including Anabaena (Reynolds,
1984b). All the populations were observed to develop high ratios of
heterocysts to vegetative cells, the maximum (in August 1981), being 0.02.
Several forms of Cryptomonas, including those ascribable to C. ovata s.l.,
C. erosa and, possibly, other smaller species, were represented in almost all
Page 17
16
of the quantitative samples (see Fig. 14). Collectively, their populations
tended to be greater in spring and summer and to become relatively sparse
during autumn and through winter. Maximal populations increased through the
early years of the study period, from c. 100 to c. 300 ml-1 between 1974 and
1976, declined between 1977 to 1980 (to generally < 100 ml ) but recovered
again to 300-400 ml-1 in 1981 and 1982.
Populations of nanoplanktonic (or p.-) algae also featured prominently
through most years. Relative abundance tended to be greatest during two annual
peaks, the earlier building up to a maximum in April or May, the later
generally in July or August. In terms of composition, these maxima usually
comprised several species simultaneously, the most conspicuous at given times
being noted in Fig. 15. In most of the earlier years, the vernal growth was
dominated first by Rhodomonas and then by Chlorella. In several years (1972,
1973, 1977) this sequence was repeated in the summer growth period. In 1973,
Chlorella dominated throughout the summer. In the summers of 1975 and 1976
and, briefly, in 1977, 1978 and 1980, Chrysochromulina parva became the most
numerous species. Different sequences developed in 1979, when a spring
population of Cyclotella pseudostelligera was replaced by Rhodomonas in summer,
and in 1980, when the vernal Rhodomonas-dominated population was eventually
succeeded by species of Chrysococcus and Chlamydomonas. Chlamydomonas spp.
were also abundant at times in 1981 and 1982, as were a Monodus sp., in 1981,
and an Ankistrodesmus sp. in 1982. The demise of the latter populations
especially, as well as many others that developed in spring, coincided with the
presence of large populations of planktonic rotifers (mostly of Keratella,
Polyarthra spp.), ciliates (Coleps, a.o.) and, at times, cladocera (Daphnia
Page 18
17
Except in 1971, 1979 and 1980, maximal populations of µ-algae regularly
exceeded 10 000 cells ml-1 and, in one case (May, 1973) exceeded 100 000
cells ml . The recorded maxima during 1979 and 1980, however, were < 5 000
cells ml
Community Structure and Organisation
The foregoing presentation of primary observational data, assembled over
the period 1971-1982, reveals a number of general characteristics of the
phytoplankton of Grasmere and its responses to broad fluctuations in the
environment. It suggests, for instance, that intermittent flood events are
extremely effective in removing large proportions of the suspended biomass on
each occasion and that subsequent development is often founded on relatively
small residual populations (inocula). According to the ecological theories of
Margalef (e.g. 1961), flood events represent severe externally-imposed
disturbances which destroy a great deal of the information and diversity
hitherto acquired by the community but which nevertheless re-open the
environment for renewed exploitation by pioneer communities.
The species re-establishing populations must be presumed to be not only
those for which the 'new' environmental conditions are suitable but either to
be those most likely to have maintained the largest residual stocks of
vegetative cells or viable resting propagules (cysts, spores, etc), assuming
sufficient provision had been made by earlier vegetative populations, or to be
those able to sustain superior rates of growth in situ. In this context, it is
pertinent (i) that many of the species that have dominated the plankton of
Grasmere have done so frequently and with an approximately seasonal regularity
and (ii) that, generally, they are among the faster-growing,'r-selected'
colonists rather than the slow-growing, 'K-selected', equilibrium species
Page 19
18
associated with the later stages of phytoplankton successions (e.g. Ceratium,
Peridinium, Microcystis, Coelosphaerium spp.). Seasonal prominence of these
latter species is substantially dependent upon their ability to compensate slow
rates of growth through the maintenance of a stock of perennating propagules
and a potential inoculum of vegetative cells when favourable growth conditions
prevail (Reynolds, 1984a). It may be hypothesised that the apparent failure of
such species, all of which have been recorded sporadically in the lake, to
become established in Grasmere, is attributable to an insufficient opportunity
to recruit benthic, overwintering propagules, adequate to form the basis of a
dominant population in subsequent years, before the meagre vegetative
populations have been flushed from the lake. Thus, the interludes between
flood events have continued to be marked by the development of weakly
structured communities consisting of successive or co-occurring populations of
colonist species.
That these episodes nevertheless conform to distinctive patterns is
supported by the derived data presented in Figs 16-18. These plots relate the
sequential changes in abundance of individual species of phytoplankton,
expressed against a common scale of approximate aggregate cell volume, through
periods of relative hydrological constancy. The first group (Fig. 16) compares
community development through three vernal periods, each following a late
autumnal or winter flood, until the seasonal onset of thermal stratification.
In 1975, Rhodomonas was initially dominant until it was succeeded by a large
population of Asterionella in April. In 1981, Rhodomonas, then Dinobryon and,
ultimately, Asterionella constituted the dominant population after a cold
February with extensive periods of ice cover. In 1978, the
invasive growths of Chrysochromulina and, especially, Cryptomonas.
Page 20
19
The second group of sequences (Fig. 17) embraces warmer summers in which
the lake remained stably stratified and relatively free from flood events.
Perhaps the most straightforward of these is the 1981 sequence, in which the
collapse of the vernal Asterionella maximum was followed by successive phases
of dominance by populations of nanoplankton (especially Monodus), a mixture of
Sphaerocystis and Gemellicystis, of Dinobryon and, eventually, of Anabaena
solitaria, the August maximum of which coincided with the near exhaustion of
DIN. Cryptomonas spp. were strongly represented throughout the period,
constituting dominant populations between the peaks of the other species. The
1982 sequence was essentially similar, save that the nanoplanktonic stage was
represented by Rhodomonas and then Chlamydomonas. The latter, together with
Cryptomonas, dominated over a Sphaerocystis/Gemellicystis - Anabaena-Dinobryon
sequence of larger species. In 1976, Anabaena and then Paulschulzia were
subdominant to Chrysochromulina and. Cryptomonas, after Dinobryon had briefly
dominated the immediate post-stratification phase. In 1975, Rhodomonas and
then Cryptomonas continued to dominate summer populations of Sphaerocystis and
Dinobryon.
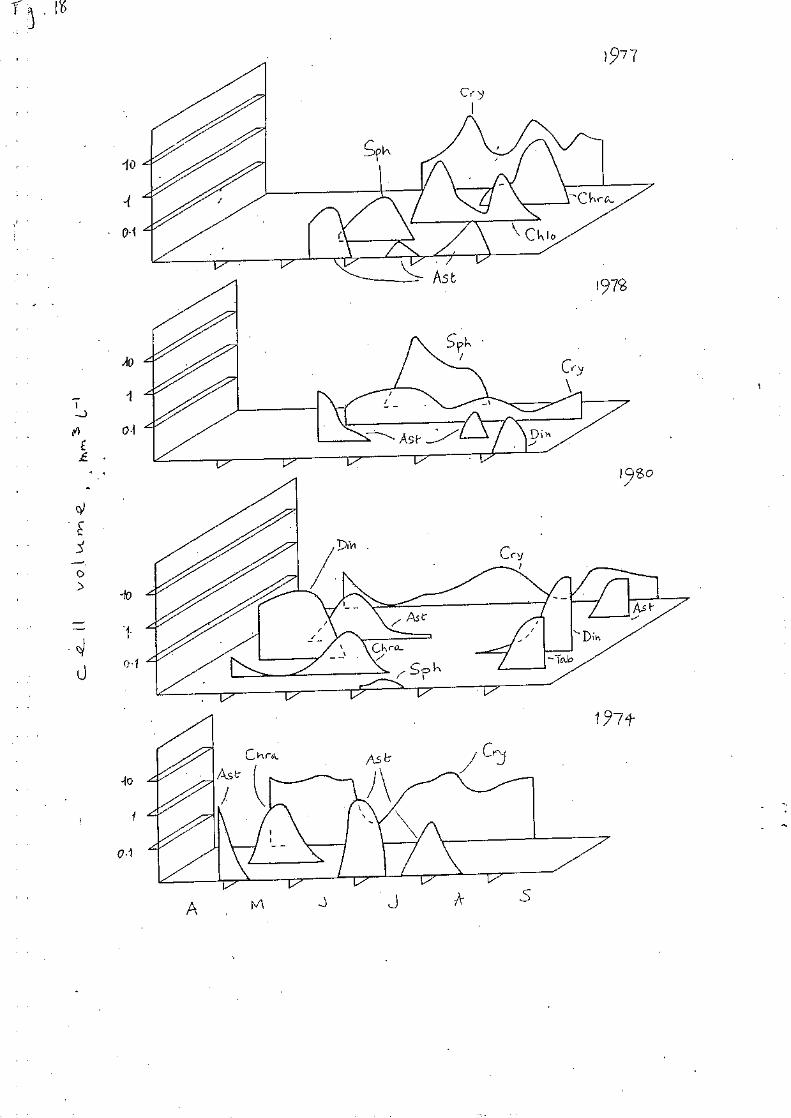
The third group of sequences (Fig. 18) are representative of summers which
were either cooler and windier or cooler and wetter than those shown in Fig.
17. The 1977 sequence progressed from vernal Asterionella dominance to a phase
in which Cryptomonas and Sphaerocystis and then Chlorella were abundant. A
small July pulse of Asterionella was followed by dominant populations of
Cryptomonas and Chrysochromulina. In 1978, Cryptomonas was subdominant to a
large post-vernal Sphaerocystis population but persisted through an August
pulse of Asterionella. In 1980, Asterionella and then Cryptomonas followed a
post-vernal prepondernace of Dinobryon and Chryscochromulina; there was a brief
growth of colonial chlorophyceae (Sphaerocystis, Gemellicystis) and then one of
Page 21
20
Dinobryon in August. The latter genera were scarcely represented during the
disturbed summer of 1974, when Cryptomonas and Asterionella alternated in
dominance following a post-vernal pulse of Chrysochromulina.
If the nanoplankton/Cryptomonas->Sphaerocystis/Dinobryon->Anabaena
solitaria (->Ceratium/Peridinium) sequence of dominance represents the basic
summer successional series of Grasmere and, indeed, of other mesotrophic
temperate lake systems (see Reynolds 1980, 1984b), then the tendency among the
series of increasingly-disturbed summers is towards the prolongation of growth
of more opportunistic, faster-growing species of the early successional stages
(nanoplankton and Cryptomonas) and, eventually, towards the species whose
growth is tolerant of relatively more mixed environments (Asterionella,
Cryptomonas). Frequent but intermittent disturbances, whether generated by
short episodes of high fluvial discharge or of increased wind-mixing presumably
impede the typical development of vertical structure in the limnetic
environment and, hence, serve to depress the rate of successional progress
towards an equilibrium community. Moreover, episodes of efficient hydraulic
flushing of the lake, albeit less frequent, have the effect of returning the
organisation of the community to a more primitive stage, open to pioneer,
colonist species.
Discussion
As is the case in many previous investigations of the seasonality of
phytoplankton in particular lakes, its periodicity in Grasmere is essentially
governed by interactions involving the availability of nutrients, and the often
overriding effects of physical variability (Reynolds, 1980). The seasonal
patterns that have been established following the commissioning of the Grasmere
Sewage Treatment Works in 1971 generally involve the progression from a vernal
Page 22
21
maximum, dominated by Asterionella and Cryptomonads, through an early summer
period in which nanoplankton (notably Rhodomonas, Chrysochromulina and
Chlorella) are relatively most abundant, to a mid-summer phase in which
colonial Chlorophyceae (especially Sphaerocystis, Gemellicystis) and
Chrysophyceae (e.g. Dinobryon) are prominent. Variable episodes of summer
wind-mixing may precipitate renewed diatom- or cryptomonad-growth, perhaps
followed by a truncated recapitulation of the nanoplankton ->Chlorophyte/
Chrysophyte sequence, before a substantial return to Asterionella dominance in
the autumn. In the drier, more stable summers, there has been a tendency for
epilimnetic DIN concentrations to fall to levels favouring the development of
populations of nitrogen-fixing Anabaena solitaria. Colonial Chrysophyceae,
especially Dinobryon, figured in most of the annual sequences, either towards
the end of the vernal period or at various stages through the summer. The
scale and seasonal distribution of its population maxima in any given year and
their relation to those of other species convey an impression that the relative
abundance of Dinobryon has, in part, depended upon poor performances of the
other conspicuous species. In this context, it may be significant that its
apparent prominence during 1979 and 1980 obtained when the populations of
Asterionella, Chlorophyceae (including nanoplanktonic species) and Cryptomonads
were markedly reduced. The reasons for the depressed standing crops of these
other species are not clearly apparent in any of the data presented. These
were cooler, wetter years than those of the mid-seventies and early-eighties
and the Water Authority was experimenting at this time with alum dosing of the
sewage effluent as a means to reduce P-loadings on Grasmere (North West Water,
personal communication). Coincidentally, there was a significantly more
prolific development of submerged macrophytic vegetation in the lake (Mycock,
1981); whether this was a cause or a consequence of relatively depressed
phytoplankton growth, or was quite incidental, is also unresolved.
Page 23
22
Apart from interannual differences in mean standing crop, it has been
argued that the relative contributions made by the most common species reflect
variability in the stability of the summer stratification and the extent of
hydraulic flushing. In all events, the periodic abundances of the
phytoplankton have not exceeded the demonstrable nutrient-limited carrying
capacity but its composition has generally retained the character of a
mesotrophic lake, in spite of the increased nutrient loadings to which it has
been subject since the sewage works were constructed. Thus, while the
outbursts of nanoplankton, the maximal populations of diatoms and the
occasional dominance of Anabaena are all indicative of the increased fertility
of its water, Grasmere has not so far supported large populations of many other
species associated with the anthropogenic eutrophication of lakes (Eudorina,
Aphanizomenon, Oscillatoria, Microcystis and Ceratium), all of which are common
in such chemically-similar lakes of the Windermere catchment as Esthwaite Water
and Blelham Tarn (see Lund, 1972, 1978). This, together with the irregular
episodes of severe reduction in the phytoplankton standing crop of Grasmere,
may be reasonably attributed to periodic flood events and the efficient
hydraulic flushing of the lake. Assuming that such 'eutrophic' species have
arrived in the lake (in fact, only Aphanizomenon has still to be recorded in
planktonic collections)and that their minimal energy and nutrient requirements
are substantially satisfied, then their failure to produce dominant populations
or to recruit significant stocks of overwintering propagules to the sediment
before the onset of autumnal flushing of the meagre vegetative populations is
all the more remarkable.
From the point of view of acceptable standards of water quality and
amenity interest, the hydrological characteristics of Grasmere have proved to
be adequate in avoiding such undesirable consequences of increased phosphorus
Page 24
23
loading. Nevertheless, a cautionary note should be sounded inasmuch as there
is little reason to doubt that the water chemistry of Grasmere would be
amenable to the eventual establishment of (say) Ceratium or Microcystis in a
warm, dry summer (such as has been observed in four out of the twelve years
considered here) or that an overwintering stock of propagules could be
recruited to the sediment during a relatively dry autumn ( twice observed, in
1973 and 1975). The probability that suitable summer conditions might be
followed by a suitably dry autumn may be deduced to be greater than 1 in 20.
When once realized, it is likely that the phytoplankton of Grasmere will assume
a more eutrophic character than presently obtains.
Acknowledgements.
We wish to record our thanks to J.D. Allonby and M.J. Nield who collected
most of the water samples from Grasmere since 1971, and to Dr G.H. Hall who has
supplied many additional records and incidental observations obtained whilst he
was working on contract to the Department of the Environment. We are also
grateful to J. Heron, Dr J. Hilton, E. Rigg, C. Woof and N. Hetherington who,
between them, have performed most of the chemical analyses used in this paper.
Special thanks are due to Julie Waterhouse who typed the manuscript. The
permission of the National Trust to work on Grasmere and the information
supplied by the North-West Water Authority are also gratefully acknowledged.
The paper was prepared in partial fulfilment of the terms of a contract placed
with the FBA by the North-West Water Authority.
Page 25
24
References
Carrick T.R. & Sutcliffe, D.W. (1982) Concentrations of major ions in lakes
and tarns of the English Lake District. Occasional Publications of the
Freshwater Biological Association, No. 16, 168 pp.
Dillon P.J. & Rigler, F.H. (1974) The phosphorus-chlorophyll relationship in
lakes. Limnology and Oceanography, 19, 767-773.
Elliott J.I. (1977) Seasonal changes in the abundance and distribution of
planktonic rotifers in Grasmere (English Lake District). Freshwater
Biology, 7, 147-166.
Gorham E., Lund, J.W.G., Sanger, J.E. & Dean, W.E. (1974) Some relationships
between algal standing crop, water chemistry and sediment chemistry in the
English Lakes. Limnology and Oceanography, 19, 601-617.
Hall G.H., Collins, V.G.,, Jones, J.G. & Horsley, R.W. (1978) The effect of
sewage effluent on Grasmere (English Lake District) with particular
reference to inorganic nitrogen transformations. Freshwater Biology, 8,
165-175.
Jones J.G. (1972) Studies on freshwater microorganisms: phosphate activity in
lakes of differing degrees of eutrophication. Journal of Ecology, 60,
777-791.
Lund J.W.G. (1972) Changes in the biomass of blue-green and other algae in an
English Lake from 1945-1969. Proceedings of the Symposium on Taxonomy and
Biology of Blue-green Algae (Ed. T.V. Desikachary pp. 305-327. University
of Madras Press, Madras.
Lund J.W.G. (1978) Changes in the phytoplankton of an English lake, 1945 - 1971. Hydrobiological Journal, 14(1), 6-21.
Page 26
25
Lund J.W.G. (1981) Investigations on phytoplankton, with special reference to
water usage. Occasional Publication of the Freshwater Biological
Association, No. 13, 64 pp.
Lund J.W.G., Kipling, C. & Le Cren, E.D. (1958) The inverted microscope
method of estimating algal numbers and the statistical basis of estimates
by counting. Hydrobiologia, 11, 143-170.
Lund J.W.G. & Reynolds, C.S. (1982). The development and operation of large
limnetic enclosures in Blelham Tarn, English Lake District, and their
contribution to phytoplankton ecology. Progress in Phycological Research,
Vol. 1 (Eds. F.E. Round, & D.J. Chapman, pp. 1-65. Elsevier Biomedical
Press B.V., Amsterdam.
Lund J.W.G; & Tailing, J.F. (1957) Botanical limnological methods, with
special reference to the algae. Botanical Reviews, 23, 489-583.
Mackereth F.J.H. (1963) Some methods of water analysis for limnologists.
Scientific Publications of the Freshwater Biological Association, No. 21,
71 pp.
Mackereth F.J.H., Heron, J. & Talling, J.F. (1978) Water analysis: some
revised methods for limnologists. Scientific Publications of the
Freshwater Biological Association, No. 36, 120 pp.
Margalef R. (1961) Communication of structure in planktonic populations.
Limnology and Oceanography, 6, 124-128.
Morris A.W. & Riley, J.P.(1963) The determination of nitrate in sea water.
Analytica Chimica Acta, 29, 272-279.
Mortimer C.H. (1941) The exchange of dissolved substances between mud and
water in lakes. Journal of Ecology, 29, 280-329.
Moseley, F.(1978) The Geology of the Lake District. Yorkshire Geological
Society, Leeds.
Page 27
26
Mycock E.R. (1981) The macrophyte flora of Grasmere - Summer 1980.
(Cyclostyled) North West Water Authority, Warrington.
Pearsall W.H. (1921) The development of vegetation in English lakes
considered in relation to the general evolution of glacial lakes and rock
basins. Proceedings of the Royal Society of London B, 92, 259-284.
Pearsall W.H. (1932) Phytoplankton in the English lakes. II. The composition
of the phytoplankton in relation to dissolved substances. Journal of
Ecology, 20, 241-258.
Pearsall W.H. & Pennington, W. (1973) The Lake District. Collins, London.
Ramsbottom A.E. (1976) Depth charts of the Cumbrian lakes. Scientific
Publications of the Freshwater Biological Association, No. 33, 40 pp.
Reynolds C.S. (1978) Phosphorus and the eutrophication of lakes - a personal
view. Phosphorus in the Environment : its Chemistry and Biochemistry
(Eds. R. Porter, & D. FitzSimons, pp. 201-228. Excerpta Medica,
Amsterdam.
Reynolds C.S. (1980) Phytoplankton assemblages and their periodicity in
stratifying lake systems. Holarctic Ecology, 3, 241-159.
Reynolds C.S. (1984a) The Ecology of Freshwater Phytoplankton. University of
Cambridge Press, Cambridge.
Reynolds C.S. (1984b) Phytoplankton periodicity: the interactions of form,
function and environmental variability. Freshwater Biology, 14, 111-142.
Smyly W.J.P. (1968) Observations on the planktonic and profundal Crustacea of
the lakes of the English Lake District. Journal of animal Ecology, 37,
693-708.
Talling J.F. (1971) The underwater light climate as a controlling factor in the production ecology of freshwater phytoplankton. Mitteillungen der
internationale Vereinigung fur theoretische und angewandte Limnologie, 19,
214-243.
Page 28
27
Tailing J.F. & Driver, D. (1963) Some problems in the estimation of
chlorophyll a in phytoplankton. Proceedings of the Conference on Primary
Productivity Measurement, marine and freshwater. U.S. Atomic Energy Comm.
(TID 7633), 142-146.
Vollenweider R.A. (1976) Advances in defining critical loading levels for
phosphorus in lake eutrophication. Memorie dell'Istituto italiano di
Idrobiologia, 33, 58-83.
Youngman R.E. (1971) Algal monitoring of water supply reservoirs and rivers.
Technical Memoranda of the Water Research Association, No. TM63, 26 pp.
Page 29
28
APPENDIX
List of species recorded in phytoplankton samples from Grasmere, 1971-1982
inclusive, with authorities. Classification and nomenclature generally follow
Reynolds (1984a); synonyms are given in parenthesis. 'S' denotes
seasonally-abundant species; 'R', infrequently abundant, and '+', recorded
infrequently.
CYANOBACTERIA (= CYANOPHYTA, MYXOPHYTA, SCHIZOPHYTA)
Order: Chroococcales$
+ Aphanothece clathrata w. et G.S. West
+ Coelosphaerium kuetzingianum Nag.
+ Microcystis aeruginosa Kutz. emend. Elenkin
Order: Nostocales
+ Anabaena flos-aquae Breb. ex Born. et Flah.
R Anabaena solitaria Klebs
Order: Oscillatoriales
+ Oscillatoria bourrellyi Lund
(=Oscillatoria bornetii f. tenuis Skuja)
+ Oscillatoria limnetica Lemm.
(Note: this may be a gas-vacuoleless state of 0. redekei Van Goor)
+ Oscillatoria sp. not determined
+ Pseudanabaena sp. not determined
CRYPTOPHYTA
S Cryptomonas erosa Ehrenb. (sensu lato).
S Cryptomonas ovata Ehrenb. (sensu lato)
S Cryptomonas spp. not determined
Page 30
29
S Rhodomonas minuta var. nannoplanktica Skuja
(= R. lacustris Pascher et Ruttner)
PYRRHOPHYTA
Order:Peridiniales
+ Ceratium hirundinella O.F. Mull
R Glenodinium sp. not determined
+ Gymnocinium spp. not determined
+ Peridinium cinctum (O.F. Mull) Ehrenb.
+ Peridinium sp. not determined (GLD 25 um)
RAPHIDOPHYTA
Order: Raphidomonadales (= Chloromonadales)
Genus, species unidentified
CHRYSOPHYTA
Order: Ochromonadales (= Chrysomonadales)
+ Dinobryon bavaricum Imhof.
+ Dinobryon crenulatum W. & G.S. West
S Dinobryon divergens Imhof
+ D. sertularia Ehr.
+ D. suecicum Lemm
+ Dinobryon sp(p) not determined
+ Mallomonas akrokomos Ruttner
+ Mallomonas caudata Iwanoff
+ Mallomonas (at least 3 unidentified species)
+ Synura uvella Ehrenb.
R Uroglena americana Calkins
Page 31
Order: Chromulinales
+ Chrysococcus rufescens Klebs
+ Chrysolykos skujae (Nauwerk) Bourrelly
+ Kephyrion spp. not determined
+ Monochrysis sp. not determined
+ Pseudopedinella sp. not determined
Order: Stichogloeales
S Chrysochromulina parva Lackey
Order: Biddulphiales:
+ Cyclotella comensis Grun.
+ Cyclotella cf. meneghiniana Kutz.
R Cyclotella pseudostelligera Hust.
+ Melosira ambigua (Grun.) 0. Mull.
(= Aulacosira ambigua (Grun.) Simonsen)
R Melosira italica (Ehr.) Kutz. subsp. subarctica Mull.
(= Aulacosira italica subsp. subarctica (0. Mull.) Simonsen)
R Rhizosolenium cf. eriensis H.L. Smith
+ Stephanodiscus astraea (Ehrenb.) Grun.
(= S. rotula (Kutz.) Hendey.)
Order: Bacillariales
+ Achnanthes sp. not determined
S Asterionella formosa Hass.
+ Fragilaria capucina Desmaz.
+ Fragilaria crotonensis Kitton
+ Gomphonema sp. not determined
+ Navicula so(p) not determined
30
Page 32
31
+ Nitzschia sp(p) not determined
+ Synedra ulna (Nitzsch)Ehrenb.
R Synedra sp. not determined
+ Tabellaria fenestrata (Lyngb. ) Kutz
+ Tabellaria flocculosa (Roth) Kutz.
R Tabellaria flocculosa (Roth) Kutz. var. asterionelloides (Roth) Knuds.
Order: Mischococcales (= Heterococcales)
R Monodus sp. not determined
EUGLENOPHYTA
Order: Euglenales
+ Lepocinclis sp. not determined
+ Phacus sp. not determined
+ Trachelomonas varians Defl.
+ Trachelomonas sp. not determined
CHLOROPHYTA
Order: Volvocales
S Chlamydomonas sp. not determined
R Chlamydomonas dinobryonae G.M. Smit.
+ Chlamydomonas epibiotica Ettl.
+ Chlamydomonas gloeophila Skuja.
R Eudorina elegans Ehrenb. (sensu stricto)
+ Gonium pectorale Mull.-
R Gonium sociale Warming
R Pandorina cf. morum Bory + Pteromonas (?) sp, not determined
Page 33
33
Order: Tetrasporales
S Gemellicystis cf. neglecta Teiling
(= Pseudosphaerocystis lacustris (Lemm.) Novacova).
+ Gloeocystis sp. not determined
R Paulschulzia sp. not determined
Order: Chlorococcales
R Ankistrodesmus falcatus (Corda) Ralfs (several varieties)
+ Ankyra judayi (G.M. Smith) Fott
+ Botryococcus braunii Kutz.
S Chlorella sp(p) not determined
+ Coccomyxa sp. not determined
R Dictyosphaerium pulchellum Wood
+ Dictyosphaerium tetrachotomum Printz
+ Didimocystis sp. not determined.
R Elakatothrix gelatinosa Wille
+ Kirchneriella lunaris (Kirchn.) Moeb.
+ Lagerheimia sp. not determined
R Micractinium pusillum Fres.
+ Monoraphidium spp. not determined
+ Oocystis lacustris Chodat
+ Radiococcus planctonicus Lund
+ Selenastrum bibraianus Runsch (= Ankistrodesmus bibraianus (Reinsch)
Korsh.)
+ Scenedesmus quadricauda (Turp.) Breb.
S Sphaerocystis schroeteri Chodat
(- Eutetramorus fottii (Hind.) Kom.; Coenococcus fottii Hind.)
Page 34
Order: Ulotrichales
+ Koliella sp. not determined
+ Stichococcus sp. not determined
Order: Zygnematales
+ Cosmarium abbreviatum Racib.
+ Closterium cf. kuetzingianum
+ Staurastrum chaetoceros (Schr.) G.M. Smith
+ Staurastrum cingulum (W. et. G.S. West) G.M. Smith
+ Staurastrum pingue Teiling
33
Page 35
34
TABLE I Mean Annual ([chl]v) and 'summer' ([chl]s, for the period 1
March- 30 September) concentrations of chlorophyll a in the upper 5 m of
Grasraere, in µg 1-1 . Numbers in brackets are the standard errors of the
mean; *denotes insufficient data for a meaningful quantity to be calculated.
Page 36
Captions to Figures
FIG. 1(a) Sketch map of the Grasmere catchment (hatching denotes land over
300 m a.s.l.
(b) Bathymetric map of Grasmere (contours in m). (after Ramsbottom,
1976).
FIG. 2 Seasonal variations in the concentration of chlorophyll a (in µg
1 , uncorrected for phaeopigments) in the upper 5 m of Grasmere,
1971-1982 inclusive; species dominating phases of abundance
identified thus: Ans = Anabaena solitaria; Ast = Asterionella
formosa; Chla = Chlamydomonas; Chlo = Chlorella sp.; Chra =
Chrysochroiaulina parva; Cry = Cryptomonas spp; Dic = Dictyospherium
pulchellum; Din = Dinobryon (usually D. divergens); Mon = Monodus
sp. ; Pan = Paulschuzia sp.; Rho = Rhodoinonas minuta var.
nannoplanktica; Sph = Sphaerocystis schroeteri; Tab = Tabellaria
flocculosa var. asterlonelloides; Uro = Uroglena americana Symbols
above each plot denote periods of high throughput, as indicated
*
when flows at Newby Bridge weir (see text) exceeded 2 x 10
(uppermost line of symbols in each row) and 5 x 10⁶ m3 d-1
(lower line), respectively calculated to correspond to
displacements of 0.05 and 0.12 of the volume of Grasmere each day.
FIG. 3 Variations in the concentrations (in µg 1 -1) of soluble reactive
phosphorus (SRP) and total phosphorus (TP) in the upper 5 m of
Grasmere, 1971-1982.
FIG. 4 Variations in the aggregate concentrations of nitrate-, nitrite-
and ammonium nitrogen (DIN, in µg l-1)and of ammonium nitrogen
FIG. 5 Variations in the concentration of soluble reactive silicon, as .
Si02 (in mg 1 - 1 ) , in the upper 5 m of Grasmere, 1971-1982.
35
Page 37
FIG. 6 Semilogarithmic representation of the changes in concentration of
Asterionella formosa (in cells ml ) in the upper 5 m of
Grasmere, 1972-1982, (No records available for 1971)
FIG. 7 Semllogarithmlc representation of the changes in concentration of
Tabellaria flocculosa var. asterionelloides (in cells ml-1) in
the upper 5 m of Grasmere, 1972-1982. (No records available for
1971).
FIG. 8 Semilogarithmic representation of the changes in concentration of
Dinobryon spp. (mostly D. divergens) (in cells ml-1) in the upper
5 m of Grasmere, 1972-1982. (No records available for 1971).
FIG. 9 Semilogarithmic representation of the changes in concentration of
Sphaerocystis schroeteri (in cells ml ) in the upper 5 m of
Grasmere, 1972-1982. (No records available for 1971).
FIG. 10 Semilogarithmic representation of the changes in concentration of
Gentellicystis neglecta (in cells ml-1) in the upper 5 m of
Grasmere, 1972-1982. (No records available for 1971).
FIG. 11 Semilogarithmic representation of the changes in concentration of
Dictyosphaesium pulchellum (in cells ml ) in the upper 5 m of
Grasmere, 1972-1982. (No records available for 1971).
FIG. 12 Semilogarithmic representation of the changes in concentration of
Paulschulzia sp. (in cells ml-1) in the upper 5 m of Grasmere,
1972-1982. (No records available for ±971).
FIG, 13 Semilogarithmic representation of the changes in concentration of
Anabaena solitaria (in cells ml-1) in the upper 5 m of Grasmere,
1972-1982. (No records available for 1971). Fig 14. Semilogarithmic representation of the changes in concentration of Cryptomonas spp. (in cells ml-1) in the upper
5 m of Grasmere 1972-1982. (No records available for 1971).
36
Page 38
37
FIG. 15 Semilogarithmic representation of the changes in the aggregate
concentrations of nanoplanktonic species of phytoplankton (or
µ-algae; in cells ml-1) in the upper 5 m of Grasmere, 1972-1982.
Most abundant genera at given points in time indicated by the same
symbols used in Fig. 2, plus Cyc = Cyclotella pseudostelligera;
Chrs = Chrysococcus sp.)
FIG. 16 Sequences of abundance (as aggregate approximate specific cell
volume, in mm 1 , in semilogarithmic format) through selected
vernal (pre-stratified) periods.
FIG. 17 Sequences of abundance, through selected periods post-
stratification, in some drier, warmer summers, plotted as Fig. 16.
FIG. 18 Sequences of abundance through selected periods post-
stratification, in some cooler, wetter summers, plotted as Fig. 16,