No. SSI-HPLC-020 ■ Introduction Since the legalization of cannabis in several US states and, recently, Canada, the quantitative determination of cannabinoids in cannabis products has been of great interest. There are more than 100 cannabinoids that can be found in the plant or extracts (1) . Tetrahydrocannabinol (THC) and cannabidiol (CBD) are two of the highest priority in potency testing along with their acidic forms. The acidic forms, Tetrahydrocannabinolic acid (THCA) and cannabidiolic acid (CBDA), are primarily found in the plant, subsequently converting to THC and CBD through decarboxylation from exposure to heat and light (2) . Traditional HPLC is the gold standard for cannabinoids analysis, including the acidic forms, providing nearly complete separation of the cannabinoids, and robust quantitation. Several methods have been developed for optimal results of resolution, sensitivity, and throughput. To assist in optimizing for high throughput while maintaining sensitivity and resolution, this application note proves a 4.5-minute isocratic method using a UHPLC system. ■ Experimental Potency analysis was performed using a Shimadzu Nexera-i (LC-2040C 3D) UHPLC with a photodiode array detector. The method conditions are shown in Table 1. Historically, 276 nm is ideal for acidic cannabinoids, but non-acidic cannabinoids give weak responses. Consistent with previous literature, a wavelength of 228 nm was chosen as an acceptable compromise (3) . Experimentation with the PDA supported this finding (Figure 1). Table 1: Instrument Method Parameters Liquid Chromatography Nexera-i (LC-2040C 3D) Mobile Phase A Water, 5 mM Ammonium Formate, 0.1% Formic Acid Mobile Phase B Acetonitrile, 0.1% Formic Acid MP Composition Isocratic, 25/75 Column Shimadzu NexLeaf CBX II, 1.8 μm, 3.0 x 100mm (220-91525-75) Shimadzu NexLeaf CBX II Guard, 1.8 μm (220-91525-76) Oven temperature 30°C Flow rate 1.0 mL/min Wavelength Monitored 228 nm 0.00 0.25 0.50 0.75 1.00 1.25 1.50 1.75 2.00 2.25 2.50 2.75 3.00 3.25 3.50 3.75 4.00 4.25 min 200 225 250 275 300 325 350 375 400 nm High Performance Liquid Chromatography The Potency Determination of 16 Cannabinoids by UHPLC with Diode-Array Detection No. HPLC-020 Figure 1: PDA contour plot showing wavelengths 190 to 400 nm
Transcript
No. SSI-HPLC-020
■ Introduction Since the legalization of cannabis in several US states and, recently, Canada, the quantitative determination of cannabinoids in cannabis products has been of great interest. There are more than 100 cannabinoids that can be found in the plant or extracts(1). Tetrahydrocannabinol (THC) and cannabidiol (CBD) are two of the highest priority in potency testing along with their acidic forms. The acidic forms, Tetrahydrocannabinolic acid (THCA) and cannabidiolic acid (CBDA), are primarily found in the plant, subsequently converting to THC and CBD through decarboxylation from exposure to heat and light(2). Traditional HPLC is the gold standard for cannabinoids analysis, including the acidic forms, providing nearly complete separation of the cannabinoids, and robust quantitation. Several methods have been developed for optimal results of resolution, sensitivity, and throughput. To assist in optimizing for high throughput while maintaining sensitivity and resolution, this application note proves a 4.5-minute isocratic method using a UHPLC system.
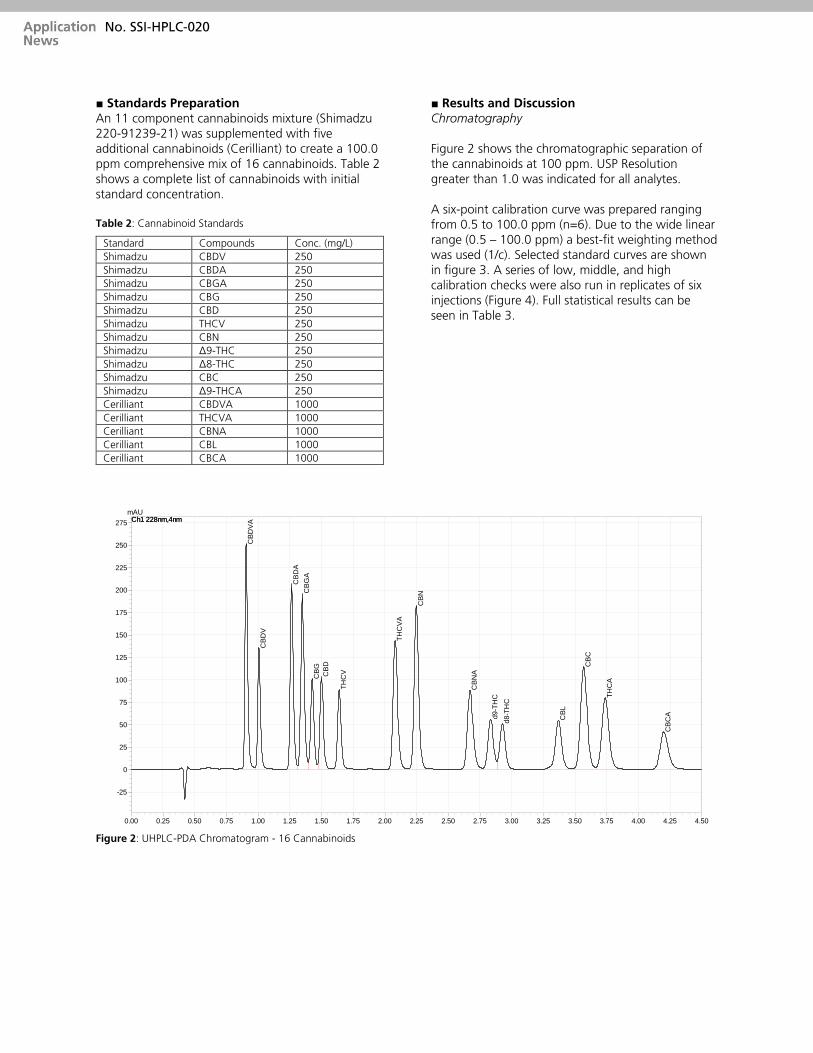
■ Experimental Potency analysis was performed using a Shimadzu Nexera-i (LC-2040C 3D) UHPLC with a photodiode array detector. The method conditions are shown in Table 1. Historically, 276 nm is ideal for acidic cannabinoids, but non-acidic cannabinoids give weak responses. Consistent with previous literature, a wavelength of 228 nm was chosen as an acceptable compromise(3). Experimentation with the PDA supported this finding (Figure 1).
Table 1: Instrument Method Parameters
Liquid Chromatography Nexera-i (LC-2040C 3D)
Mobile Phase A Water, 5 mM Ammonium Formate, 0.1% Formic Acid
Mobile Phase B Acetonitrile, 0.1% Formic Acid
MP Composition Isocratic, 25/75
Column
Shimadzu NexLeaf CBX II, 1.8 µm, 3.0 x 100mm (220-91525-75) Shimadzu NexLeaf CBX II Guard, 1.8 µm (220-91525-76)
■ Standards Preparation An 11 component cannabinoids mixture (Shimadzu 220-91239-21) was supplemented with five additional cannabinoids (Cerilliant) to create a 100.0 ppm comprehensive mix of 16 cannabinoids. Table 2 shows a complete list of cannabinoids with initial standard concentration. Table 2: Cannabinoid Standards
Standard Compounds Conc. (mg/L)
Shimadzu CBDV 250
Shimadzu CBDA 250
Shimadzu CBGA 250
Shimadzu CBG 250
Shimadzu CBD 250
Shimadzu THCV 250
Shimadzu CBN 250
Shimadzu Δ9-THC 250
Shimadzu Δ8-THC 250
Shimadzu CBC 250
Shimadzu Δ9-THCA 250
Cerilliant CBDVA 1000
Cerilliant THCVA 1000
Cerilliant CBNA 1000
Cerilliant CBL 1000
Cerilliant CBCA 1000
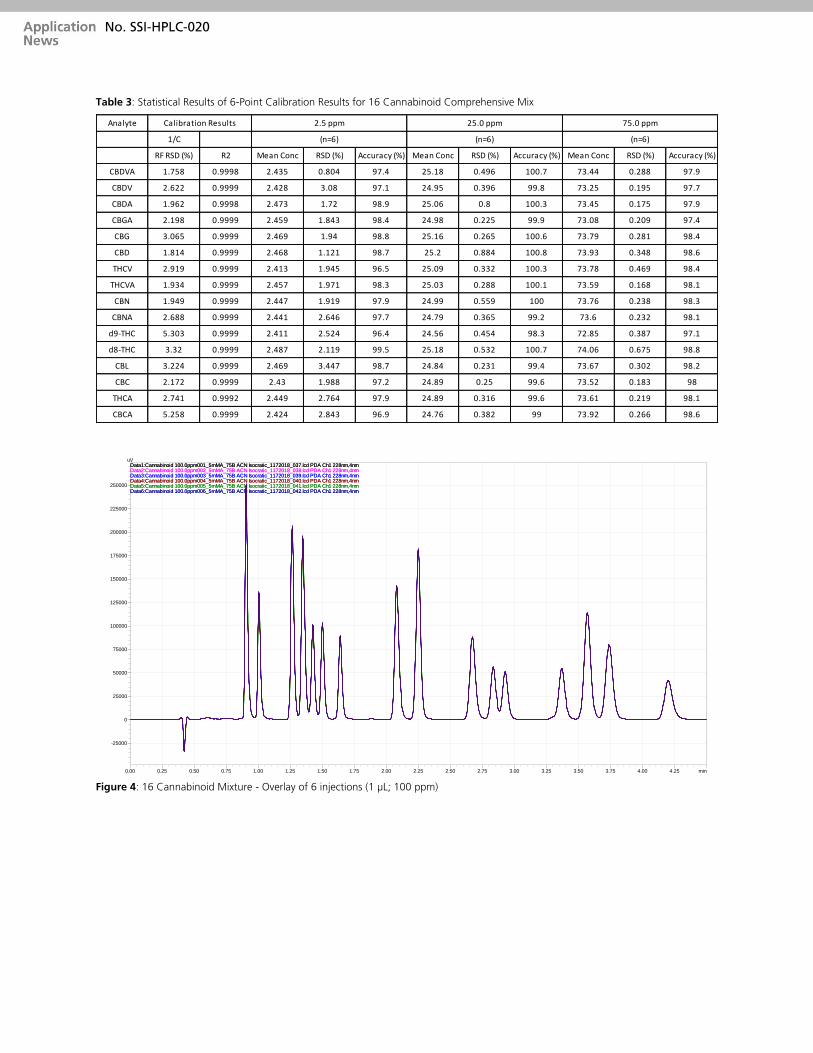
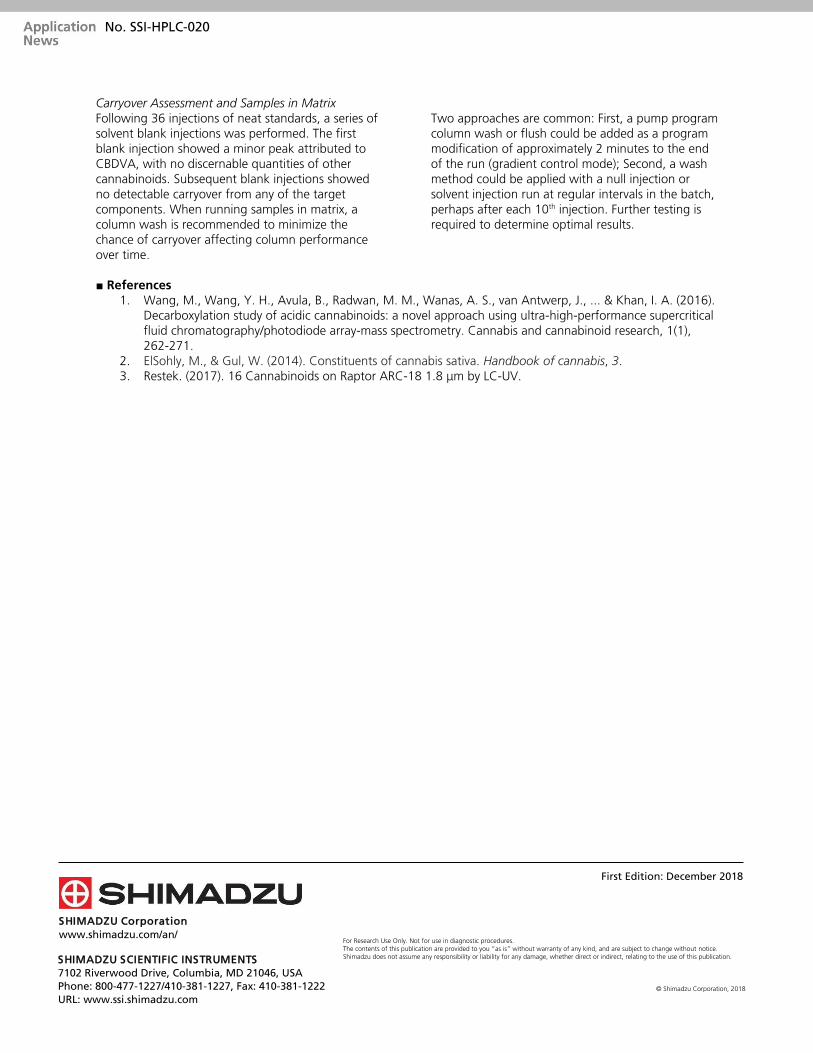
■ Results and Discussion Chromatography Figure 2 shows the chromatographic separation of the cannabinoids at 100 ppm. USP Resolution greater than 1.0 was indicated for all analytes. A six-point calibration curve was prepared ranging from 0.5 to 100.0 ppm (n=6). Due to the wide linear range (0.5 – 100.0 ppm) a best-fit weighting method was used (1/c). Selected standard curves are shown in figure 3. A series of low, middle, and high calibration checks were also run in replicates of six injections (Figure 4). Full statistical results can be seen in Table 3.
Carryover Assessment and Samples in Matrix Following 36 injections of neat standards, a series of solvent blank injections was performed. The first blank injection showed a minor peak attributed to CBDVA, with no discernable quantities of other cannabinoids. Subsequent blank injections showed no detectable carryover from any of the target components. When running samples in matrix, a column wash is recommended to minimize the chance of carryover affecting column performance over time.
Two approaches are common: First, a pump program column wash or flush could be added as a program modification of approximately 2 minutes to the end of the run (gradient control mode); Second, a wash method could be applied with a null injection or solvent injection run at regular intervals in the batch, perhaps after each 10th injection. Further testing is required to determine optimal results.
■ References
1. Wang, M., Wang, Y. H., Avula, B., Radwan, M. M., Wanas, A. S., van Antwerp, J., ... & Khan, I. A. (2016). Decarboxylation study of acidic cannabinoids: a novel approach using ultra-high-performance supercritical fluid chromatography/photodiode array-mass spectrometry. Cannabis and cannabinoid research, 1(1), 262-271.
2. ElSohly, M., & Gul, W. (2014). Constituents of cannabis sativa. Handbook of cannabis, 3. 3. Restek. (2017). 16 Cannabinoids on Raptor ARC-18 1.8 μm by LC-UV.
For Research Use Only. Not for use in diagnostic procedures.
The contents of this publication are provided to you “as is” without warranty of any kind, and are subject to change without notice. Shimadzu does not assume any responsibility or liability for any damage, whether direct or indirect, relating to the use of this publication.