1 The Potential Impact of Sugar‐Sweetened Beverage Taxes in New York State A Report to the NYC Department of Health & Mental Hygiene Y. Claire Wang, MD, ScD Assistant Professor Department of Health Policy & Management Mailman School of Public Health Columbia University New York City
Transcript
1
The Potential Impact of Sugar‐Sweetened Beverage Taxes
in New York State
A Report to the NYC Department of Health & Mental Hygiene
d.2. Substitution and cross‐price elasticity...................................................................... 15
d.3. Does the tax differentially impact the poor?............................................................ 15
d.4. Public acceptability of soda tax................................................................................ 17
3. Impact of the Proposed Tax Scenarios........................................................................ 17
a. Framework of analysis........................................................................................... 17
Figure 6. Logical pathway of health and economic impact of taxes on SSB....................... 18
b. Impact on price and consumption ......................................................................... 18
b.1. Impact on price........................................................................................................ 18
b.2. Impact on consumption ........................................................................................... 18
Figure 7: Shift of consumption distributions ................................................................... 20
c. Predicted impact on diabetes in New York ............................................................ 20
c. 1. Incidence of diabetes .............................................................................................. 20
c.2. Impact of SSB tax on diabetes risk............................................................................ 20
c.3. Cost savings from prevention of diabetes................................................................. 21
3
Table 3. Potential Impact of proposed tax on disease burden of diabetes in New York State............................................................................................................................... 22
d. Predicted impact on energy balance and obesity in New York................................ 22
d.1. Impact on energy intake .......................................................................................... 22
d.2. Impact on weight and obesity.................................................................................. 23
Table 4. Potential Impact of proposed tax on body weight and obesity in New York State....................................................................................................................................... 24
e. Health benefit in race‐ethnic minority and among low‐income individuals ............ 24
Table 5. Potential Impact of proposed tax among race‐ethnic minorities and lower‐income individuals.......................................................................................................... 24
f. Impact on tax revenue............................................................................................ 25
Table 6. Expected revenue from the proposed 1 cent per ounce excise tax on soft drinks for New York State ................................................................................................................ 25
g. Impact on individual and household spending........................................................ 25
h. Sensitivity analysis ................................................................................................. 26
4. Discussions and Conclusions ............................................................................................. 28
5. Literature Cited................................................................................................................. 29
A. Data sources................................................................................................................ 35
B. Calculating disease burden averted ............................................................................. 36
4
Executive Summary
The increasing consumption of sugar‐sweetened beverages (SSBs), including soda, fruit punches, sweetened tea, sports drinks, energy drinks and all other beverages with added caloric sweeteners, has been linked to increases in obesity and several chronic diseases, most notably type 2 diabetes. In the face of a dual epidemic of obesity and diabetes, the Institute of Medicine (IOM) recently advocated fiscal policies and local ordinances as a possible strategy to discourage the consumption of foods and beverages such as SSBs that are high in calories but low in nutritional value.1 In addition to existing sales taxes levied in several states, public health experts have proposed an excise tax on these beverages to further discourage consumption of these “empty calories”. This report evaluates the potential economic and health impact of a hypothetical penny‐an‐ounce tax for New York State.
We estimate that the proposed tax has the potential to result in a 20‐25% increase in
SSB prices in retail outlets and a 15‐20% reduction in the overall consumption of these beverages among New York State residents. From a health perspective, the expected reduction in SSB consumption could potentially prevent ~37,400 diabetes cases within the next decade, saving approximately $1.2 billion dollars in medical costs. In addition, the tax could potentially prevent 145,000 adults from becoming obese, translating into $2.1 billion dollars of direct savings from medical expenditure attributable to obesity. The health benefit and medical savings are larger among African Americans and Hispanics than among non‐Hispanic Whites. Lower income individuals are expected to accrue a disproportionally larger share of the health benefit. An excise tax will also generate tax revenue close to $1 billion each year for the State, a significant fiscal resource that could be used to support education programs and infrastructure designed to promote healthy eating and active living for the New York State population.
5
1. Background – Sugar‐Sweetened Beverages (SSBs) and Health
a. Sugar‐sweetened beverage consumption
Sugar‐sweetened beverages—including soda, fruit punches, sports drinks, energy drinks,
sweetened tea, and other carbonated or uncarbonated drinks that are sweetened with sugar, corn syrup, or other caloric sweeteners—are the largest source of added sugar in the American diet today. Every 20‐ounce bottle of a typical soda drink contains nearly 17 teaspoons of sugar. High consumption of sugar‐sweetened beverages (SSBs) has been linked to greater risks for obesity, diabetes, and heart disease,2‐5 making a compelling case for the need to curb consumption of these beverages.
Public health researchers have suggested that excess intake of these sugary beverages
“may be the single largest driver of the obesity epidemic”.6 Calories in liquid forms are not as well‐regulated by the human body, and do not result in a corresponding reduction in the intake of other foods or beverages.7 Calories coming from sweetened beverages usually become “extra calories” that lead directly to higher total energy intake and subsequent weight gain.8 Americans consume about 250–300 more daily calories today than they did several decades ago, and nearly half of this increase reflects greater consumption of SSBs.6 Several recent systemic reviews established the causal role of SSB consumption, weight gain, and the risk of overweight/obesity in both children and adults,3, 4, 9 although research funded by the beverage industry shows less consistent associations.10‐12 Experimental and observational studies also find that reducing consumption of SSBs results in lower total caloric consumption, better weight management, and a lower risk of overweight/obesity.5, 13‐15
For adults, the most pressing health concern related to SSB intake and obesity is type 2
diabetes. The link between excess weight gain and diabetes is very strong: diabetes incidence increases with body mass index (BMI). Adults with healthy weight (BMI between 18.5 and 25 kg/m2) have a 20% lifetime risk of diabetes, but those who are overweight or obese have lifetime risk of diabetes of 30% and 70%.16 Not surprisingly, increased consumption of SSBs in adults has been linked with higher incidence of type 2 diabetes.2, 17 A large body of literature has established the effect of SSBs on the risk of type 2 diabetes and the metabolic syndrome*. 2 The longest follow‐up study showed an 83% increased risk of developing diabetes among women consuming at least one SSB per day. Similar results were replicated among African‐American women 18 and other cohorts.2, 19, 20
* Metabolic syndrome is a name for a group of risk factors that occur together and increase the risk for coronary artery disease, stroke, and type 2 diabetes. According to the American Heart Association and the National Heart, Lung, and Blood Institute, metabolic syndrome is present if the patient has three or more of the following signs: Blood pressure equal to or higher than 130/85 mmHg; Fasting blood sugar (glucose) equal to or higher than 100 mg/dL; Large waist circumference (Men≥40 inches, Women≥35 inches); Low HDL cholesterol (Men <40 mg/dL, Women <50 mg/dL); Triglycerides≥ 150 mg/dL.
6
Researchers have also found that increased diabetes risk may be only partly mediated by body weight. This emerging research focuses on the potential effect of SSBs on inflammation, insulin regulation, and lipid metabolism. Evidence is rapidly accumulating that relates the role of SSB consumption to cardiovascular risk, including the development of hypertension, adverse lipid parameters, inflammation, and clinical coronary heart disease (CHD), even after controlling for diabetes and BMI. 2, 21 Health Effects of Excess SSB consumption
Excess caloric intake Displacing more healthful food/beverages Obesity and overweight Diabetes and pre‐diabetes Dyslipidemia Metabolic syndrome Coronary Heart Disease Dental Caries
b. Consumption trends of SSBs in the U.S. and New York
Over the past thirty years, U.S. children and adolescents have dramatically increased
consumption of these beverages 22, 23. Today, the average American consumes 50 gallons of sugar‐sweetened beverages (SSBs) each year 24 and approximately 22 teaspoons of sugar from SSBs per day, far surpassing the recommended 5 to 9 teaspoons/day level. Although an increasing trend is observed across all age groups, SSB consumption is highest among adolescents and young‐to‐middle age adults (Figure 2). Soda and fruit punches constitute the top two categories of SSB calories, although sports and energy drinks represent one of the fastest growing product categories, especially among adolescents 23. In 1999‐2004, adolescents who reported any SSB on the surveyed day consumed an average of 356 calories from SSB, accounting for almost 16% of their daily energy intake. Since the mid‐1990s, children’s intake of sugared beverages surpassed that of milk (Figure 1). Marketers spend close to $500 million dollars a year to reach children and adolescents with messages about SSBs, more than they spend on any other category.† High levels of SSB consumption are seen among boys and girls of all ages and socio‐economic groups.
† Berkeley Media Studies Group. Sugar Water Gets a Facelift: What Marketing Does for Soda. September 2009.
7
Figure 1. U.S. trends in per capita calories from beverages
From Brownell et al. New England Journal of Medicine, 2009. 11
Figure 2: Per capita consumption of calories from SSBs, by type (NHANES 1999‐2004)
Per Capita Consumption of Sugar Sweetened Beverages (kcal), by Type, 1999‐2004
0
50
100
150
200
250
300
350
Age 2‐5 Age 6‐11 Age 12‐19 Age 20‐44 Age 45‐65 Age 65+
kcal
Other
Sport Drinks
Fruit Punch
Soda
Source: National Health and Nutrition Examination Survey, 1999‐2004.
Modified from Wang and Bleich et al. 23, 25
In 2007‐2008, approximately one in three adults in New York City consumed at least one SSB a day. Based on the NYC Community Health Survey (NYCCHS), SSB consumption is highest among those New Yorkers who are most at risk for diabetes and obesity – those with low
8
household incomes, living in low‐income neighborhoods, and belonging to certain ethnic groups (Blacks and Hispanics). As shown in Figure 3, 40% of New Yorkers between the ages of 20 and 44 consume 1+ SSB per day, while 28% and 25% of adults of age 45‐64 and 65+ consume one or more SSB a day, respectively. Adults who fall into the highest consumption category (2+ SSB/day) are: 24% (age 20‐44), 15% (age 45‐64) and 13% (age 65+). In addition to the differences by age, higher proportions of non‐Hispanic Black and Hispanic adults in New York City consume at least one SSB a day compared with non‐Hispanic White adults. Among New York City high school students, available data suggests similar trends with soda consumption: 31.6% of students in South Bronx schools consume one or more soda per day compared to 22.5% of students in less deprived neighborhoods (YRBS 2007).
Figure 3: High consumption of SSBs among New York City adults (NYCCHS)
SSB Consumption ≥ 1 per Day
27
1921
49
36 36
53
41
33
0
10
20
30
40
50
60
20‐44 45‐64 65+
Age Group
% White
Black
Hispanic
SSB Consumption ≥ 1 per Day
49
3329
34
2422
0
10
20
30
40
50
60
20‐44 45‐64 65+
Age Group
%
<200%FPL
200%+FPL
2. State SSB Taxes – History and Impact
9
As of January 2009, 33 states in the U.S. imposed a sales tax on soft drinks sold in grocery stores and vending machines at an average rate of 5.2 %. Including all states with or without a specific tax on SSBs, the nationwide average tax rate is 3.4 % on these beverages. In contrast, the average tax rate for all food and beverages is 1%.26, 27 However, the tax rate is never more than 10% of the price. Experts suggest that a tax rate and the associated price increase in this range may not result in sufficient change in purchase behavior. In addition, as sales tax is added at check out, after the purchase decision is made, the moderate increase in price consumers pay is less likely to have an intended impact on discouraging consumption.
Recently, several states, including New York and Maine have proposed additional excise
taxes or substantial increases in the sales tax rate on SSBs in order to curb the current high levels of SSB consumption, and, by extension, curtail the rise of adult and childhood obesity and reduce the burden of type 2 diabetes.6
An SSB Tax is also expected to generate considerable revenue. Notably, the U.S. Senate
Finance Committee considered a national excise tax on SSBs to help finance health care reform, but ultimately rejected the option.28 New York State’s Governor David Patterson has re‐proposed a 1 cent per ounce excise tax in his State’s 2010‐2011 budget after removing the proposal from the current year’s budget in the face of opposition.29
Experts argue that a per‐volume excise tax has a number of benefits over a sales tax as a
fraction of price because:
Sales taxes encourage substitutions to lower cost options, such as store brands or larger serving‐size containers (with lower cost per ounce), while a per‐ounce excise tax does not.
An excise tax is levied on the producers and is therefore likely to be passed on to the product’s price tag, sending a price signal at the point of purchase, whereas a sales tax is added at check out registries, after the purchase decision was already made.
An excise tax will include syrups for fountain drinks (based on final volume), constituting a large share of SSBs consumed in stores and restaurants.
An excise tax would likely have an impact on purchases made through the Supplemental Nutrition Assistance Program (SNAP, often referred to as the food stamp program), which currently exempts its purchasers from state and local sales taxes 30.
a. Existing variations of state‐level sales tax rates on BMI
A review of studies examining the relationship between state‐level SSB taxes and
population weight distribution suggests weak evidence of a relationship.26 These studies often rely on ecological analyses that link state‐level tax rates to the BMI of the state population. Most of these evaluations suffer from limited power to detect a difference, due to either the small number of units (states or individual subjects) or the limited range of intervention dose
10
(tax rates). Current tax rates across all states are unlikely to provide the sufficient variability that is desired in a natural experiment setting.
Using a large, nationally representative Monitoring the Future (MTF) survey from 1997
to 2006, Powell et al. 31 found a weak effect of vending machine soda tax rates on BMI among teens at risk for becoming overweight but no effect on overall BMI. The authors estimated that a one percentage point increase in the vending machine tax rate was associated with a 0.006 kg/m2 reduction in BMI among adolescents at risk of being overweight (p = .09). Kim and Kawachi 32 used adult self‐reported BMI data from the Behavioral Risk Factor Surveillance System (BRFSS) and found no difference in obesity rates between states with and states without a > 5 percent tax between 1991 and 1998. However, they found that states repealing a soft‐drink or snack‐food tax had an increase in obesity prevalence.
Fletcher et al.33 examined the impact of state‐level tax rates on child and adolescent SSB
consumption and BMI using more detailed 24‐hour dietary recall data and objectively measured BMI in the National Health and Nutrition Examination Surveys (NHANES). They found soda taxes had no effect on BMI or the probability that a youth would consume soda, although they found that a 1 % increase in the tax rate is associated with approximately 8 fewer calories from soda consumed (p<.05), an approximate 6% reduction. However, the authors also noted that this decrease was offset by an increase from whole milk (p<0.01), resulting in no net changes in total calories consumed. They found no substitution to diet drinks in this population. Although beverages were not distinguished, Miljkovic et al. estimated that a 10% increase in the price of sugar products was associated with a decrease in the prevalence of people who are overweight by 2% and of obesity by 8%34.
In sum, current studies provide weak evidence that soda taxes have much of an effect
on BMI. Researchers suggest that substantial tax increases will be necessary to have potent effects. 30, 35
b. Soft drink tax evaluated for New York State
The proposed tax scenario evaluated in this report is a 1‐cent per ounce excise tax on all beverages that contain any caloric sweetener, similar to proposals made by several public health experts.6 More specifically, the proposed tax includes all sweetened beverages with 10 or more calories per 8‐oz serving and fruit/vegetable drinks with less than 70% natural juice. This tax is different than current state sales policies, in that it would exclude diet drinks and soft drinks with less than 10 calories per 8‐oz.
c. Rationales for SSB tax in New York State
Obesity and diabetes are at epidemic levels in New York City and New York State. The proportion of New York adults who are obese (BMI≥30 kg/m2, or more than 192 lb for someone who is 5’7”) has doubled since 1995, almost parallel to the national trend. The latest nationally
11
representative examination survey data (NHANES, objectively measured BMI) suggest that 33% of Americans 20 years of age or older are obese. Applying this ratio to the State, approximately 5 million adults in New York State fall into the obese category.
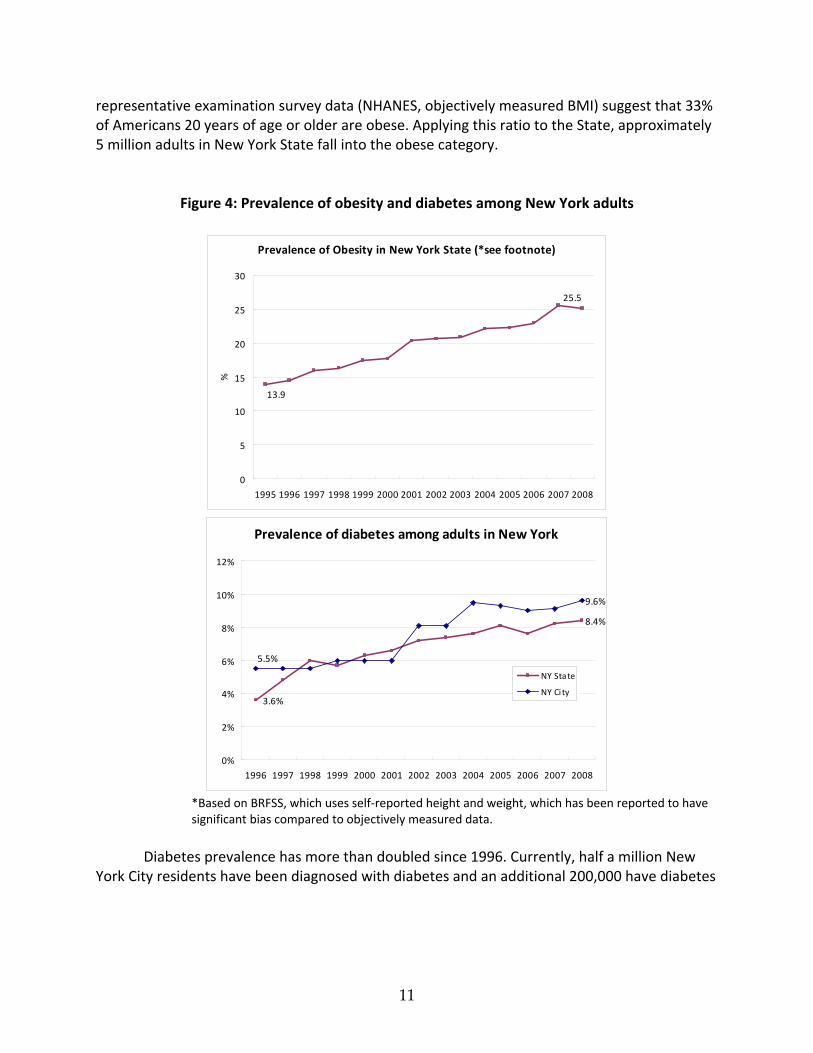
Figure 4: Prevalence of obesity and diabetes among New York adults
Prevalence of Obesity in New York State (*see footnote)
*Based on BRFSS, which uses self‐reported height and weight, which has been reported to have significant bias compared to objectively measured data.
Diabetes prevalence has more than doubled since 1996. Currently, half a million New
York City residents have been diagnosed with diabetes and an additional 200,000 have diabetes
12
but are unaware of their condition.‡ This means one in 8 New York City adults has diabetes. Diabetes and diabetes‐associated cardiovascular disease are among the leading causes of death, both nationwide and in New York State. Diabetes also imposes substantial disability, as well as loss of quality of life and productivity, on the population affected. Uncontrolled diabetes is the leading cause of blindness, end‐stage renal disease, and non‐traumatic lower extremity amputations in adults.
In New York City, close to 2,000 deaths every year are directly attributable to diabetes,
the fourth‐leading cause of death§. In 2007, out of every 100,000 New Yorkers, 18 died from
diabetes. ** Each year, there are more than 20,000 hospitalizations with a principal diagnosis of diabetes in New York City. The cost of these hospitalizations, which reflects only a small portion
of diabetes‐related costs, amounted to $481 million in 2003.†† The burden of obesity and diabetes disproportionally affects black and Latino New
Yorkers, as well as those living in low‐income households (Figure 5). Residents of the poorest neighborhoods of New York City are more than twice as likely as those in the wealthiest neighborhoods to die from diabetes (27/100,000 vs. 11/100,000).‡‡
The substantial burden of obesity and diabetes in New York makes a strong case for the
potential benefit on public health of a tax levied on SSBs to reduce consumption levels. Revenue generated from such tax also represents potential funding for interventions targeted to promote the population’s health and wellbeing.
‡ NYC Vital Signs, Vol. 8, No.5. November 2009. Diabetes among New York City Adults. http://www.nyc.gov/html/doh/downloads/pdf/survey/survey‐2009diabetes.pdf § United States. New York City. Department of Health and Mental Hygiene. Vital Statistics 2008. New York City, 2010. http://www.nyc.gov/html/doh/downloads/pdf/vs/2008sum.pdf ** United States. New York City. Department of Health and Mental Hygiene. NYC Vital Signs: Diabetes
among New York City Adults. Vol. 8:5 New York City, 2009.
Print.http://www.nyc.gov/html/doh/downloads/pdf/survey/survey‐2009diabetes.pdf †† United States. New York City. Department of Health and Mental Hygiene. Diabetes in New York City:
Public Health Burden and Disparities. New York City, 2007.
http://www.nyc.gov/html/doh/downloads/pdf/epi/diabetes_chart_book.pdf ‡‡ NYC Vital Signs, Vol. 8, No.5. November 2009. Diabetes among New York City Adults. http://www.nyc.gov/html/doh/downloads/pdf/survey/survey‐2009diabetes.pdf
13
Figure 5: Prevalence of obesity and diabetes among New York City adults, by income §§
Prevalence of Obesity and Prevalence of Diagnosed Diabetes, by Household Income
26.5
22.9
17.9
11.8
8.86.4
0
5
10
15
20
25
30
<200% FPL 200-400% FPL >400% FPL
%Obese
Have Diabetes
Source: Community Health Survey 2007, NYC DOHMH
Obese
537000
216000
354000
<200% FPL
200-400% FPL
>400% FPL
Source: Community Health Survey 2007, NYC DOHMH
Diagnosed Diabetes
242000
118000
75000
d. SSB tax issues and concerns
d.1. Price elasticity
The expected impact of a change in the price of SSBs relies on the concept of price
elasticity, which is the percentage change in purchased quantity in response to a 1% change in price. This quantity is usually negative as consumption tends to decrease as price increases, and a larger absolute value indicates that the consumers respond to the price change by changing their demand for the product. For instance, the price elasticity of demand for cigarettes is in the
§§ Community health survey, 2007. http://www.nyc.gov/html/doh/downloads/pdf/community/CHS2007‐Diabetes‐Obesity.pdf
14
range of ‐0.3 to ‐0.6 for adults or ‐0.6 to ‐0.7 for youths***, suggesting that a 10% increase in the price of cigarettes would translate to a 3‐6% reduction in consumption among adults and a 6‐7% reduction among youths.
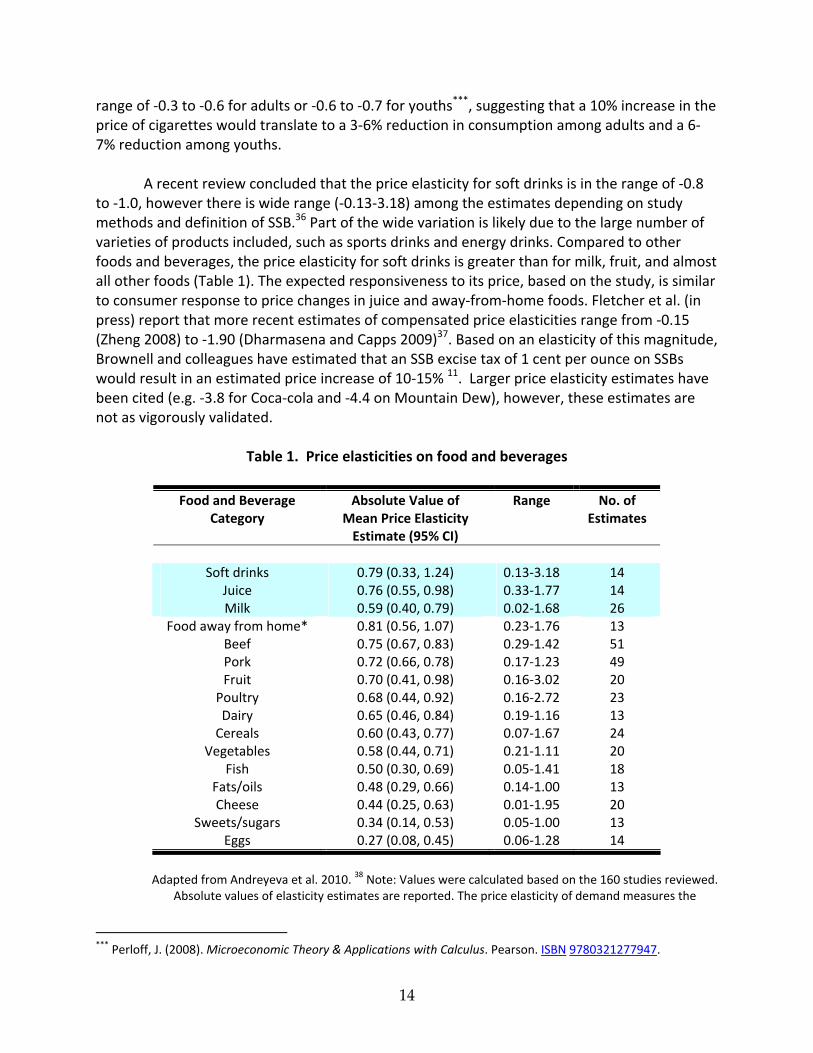
A recent review concluded that the price elasticity for soft drinks is in the range of ‐0.8
to ‐1.0, however there is wide range (‐0.13‐3.18) among the estimates depending on study methods and definition of SSB.36 Part of the wide variation is likely due to the large number of varieties of products included, such as sports drinks and energy drinks. Compared to other foods and beverages, the price elasticity for soft drinks is greater than for milk, fruit, and almost all other foods (Table 1). The expected responsiveness to its price, based on the study, is similar to consumer response to price changes in juice and away‐from‐home foods. Fletcher et al. (in press) report that more recent estimates of compensated price elasticities range from ‐0.15 (Zheng 2008) to ‐1.90 (Dharmasena and Capps 2009)37. Based on an elasticity of this magnitude, Brownell and colleagues have estimated that an SSB excise tax of 1 cent per ounce on SSBs would result in an estimated price increase of 10‐15% 11. Larger price elasticity estimates have been cited (e.g. ‐3.8 for Coca‐cola and ‐4.4 on Mountain Dew), however, these estimates are not as vigorously validated.
Table 1. Price elasticities on food and beverages
Food and Beverage Absolute Value of Range No. of Category Mean Price Elasticity Estimates
Adapted from Andreyeva et al. 2010. 38 Note: Values were calculated based on the 160 studies reviewed.
Absolute values of elasticity estimates are reported. The price elasticity of demand measures the
*** Perloff, J. (2008). Microeconomic Theory & Applications with Calculus. Pearson. ISBN 9780321277947.
15
percentage change in purchased quantity or demand with a 1% change in price *Including restaurant meals and fast food.
d.2. Substitution and cross‐price elasticity
A key determinant of the net impact of the proposed tax is what beverage consumers
would substitute in place of the eliminated sweetened beverages. From a caloric standpoint, substitution with food or other beverages with equal or higher energy content (e.g. milk, juice) will offset the caloric impact from reducing SSB intake. On the other hand, consumers may also substitute water or other zero‐ or low‐calorie beverages to compensate for SSB consumption generated by taxation, resulting in a net reduction in total calories. While observational studies have directly measured the net calorie impact of substituting SSBs with water vs. other beverages,8, 15 there is very limited data on how consumers would switch to other options in response to a tax on SSBs.
Brownell et al. (2009a) provide a “conservative” estimate that 25 percent of calories
from SSB consumption reduced by SSB taxation would be replaced from other sources, but do not provide a source for this estimate. Fletcher et al. (in press) estimated that a 1% higher soft drink tax led to a decrease of 8 calories from soft drinks, but an increase in calories from whole milk and from juice drinks. As such, the authors conclude that the decrease in calories from SSB consumption was entirely compensated through substitution. However, the study is based on cross‐sectional data and state‐level tax rates, instead of observations of the substitution effect among the same individuals. The study also only considers whole milk and juice as substitutes for SSBs, rather than a whole range of beverages. One should be cautious about making causal inferences based on this study.
Another useful method for indirectly predicting the substitution effect is cross‐price
elasticities. Cross‐price elasticity represents the percent change in consumption due to a 1 percent change in the price of another related good. For example, Dharmasena and Capps37 provide estimates for 10 beverage categories, including regular and diet soft drinks. In their compensated results, they find that a 1 % increase in the price of soft drinks led to a 1.9 % reduction in soft drinks, a 0.49 % reduction in diet soft drinks, a 0.49 % increase in high‐fat milk, a 0.29 % increase in low‐fat milk, and a 1.15% increase in fruit juice consumption. However, the literature on this topic remains hugely lacking. More in‐depth research on beverage cross‐price elasticities would be necessary to better describe and predict the expected substitution of alternative caloric beverages following implementation of an SSB tax.
d.3. Does the tax differentially impact the poor? Food cost takes up a higher percentage of household spending for lower income
households. As expected, opponents of these taxes criticize them as being “regressive.” A regressive tax is one for which the poor pay a higher percentage of their income than the rich
16
do—essentially, a tax that hits the poor more than the rich. A traditional view of excise taxes as being highly regressive has long been demonstrated in the case of cigarette tax. For example, New York City’s new combined city, state, and federal cigarette taxes are $3.39 per pack, making the tax bill more than $1200 per year for a pack‐a‐day smoker—real money to many poor people. The two main reasons cigarette taxes are often found to be regressive are: (1) the poor spend a larger share of their income on consumption (the only exceptions are goods disproportionally consumed by the wealthy, i.e., luxury goods), while the rich save or invest a larger share of their income; and (2) the prevalence of smoking is higher among the poor, so cigarettes are disproportionally consumed by the poor. Another example that has invoked the regressivity argument would be sales taxes on lottery tickets.
An excise tax on SSBs is likely to encounter similar arguments, as lower income individuals spend a larger share of their income on food and beverages, and currently consume more SSBs than their higher income counterparts. On the basis of share of total household budget, however, the increase in spending due to taxes on SSBs is likely very small.39 Moreover, for many goods including cigarettes, low‐income individuals are more responsive to tax.40 If low‐income SSB consumers are indeed more price sensitive, they would cut back on intake more than the rich, consequently increasing their tax expenditures to a lesser degree than those of the rich. On that basis, a tax increase could be driven toward progressivity. Nevertheless, the evidence is currently mixed on how the effect of taxes on SSBs differs by income. For low‐income consumers, Yen et al. obtained a soda price elasticity of ‐0.8 with little effect of soda prices on the consumption of other beverages.41 In the study by Fletcher et al., the tax appears to have greater effect among lower‐ and higher‐income adults than those in the middle of the income range.42 On the other hand, the national household purchase pattern based on the Nielsen homescan data may suggest that high‐income consumers are more responsive to the price of SSBs than the lower‐income population.39
While one may object to the tax on the basis of its potential regressivity, several
balancing arguments are extremely important to note. First, SSBs are not necessary for survival, and an alternative (i.e., tap water) is readily available at little or no cost. When such a tax shifts intake from SSBs to water, the poor can benefit both by improving health and by lowering expenditures on beverages. Second, the cost of the tax should be weighed against the economic burden caused by excess intake of SSBs—primarily disability, premature deaths, and lost productivity from obesity and from diabetes. This economic burden is disproportionately shouldered by low‐income New York residents. As shown in Figure 5, of the estimated 435,000 New York City residents diagnosed with diabetes (and with income information available), more than half (~242,000) reside in households with income lower than 200% of the Federal poverty level (FPL). More than half of the obese New Yorkers (~537,000) are at this income level. Finally, It should be noted that, in the case of the cigarette tax , part of the revenue generated through taxation was used to fund anti‐smoking programs targeting the poor and for youth.11 Designating revenues generated from SSB taxes for programs promoting childhood nutrition, obesity prevention, or health care for the uninsured would preferentially help those most in need.
17
d.4. Public acceptability of soda tax With obesity in children and adults on the rise, the issue is becoming a pressing and
highly visible public health issue. Public support for taxes on unhealthy food and beverages has increased steadily. Support for food taxes rose from 33% in 2001 to 41% in 2003 and then to 54% in 2004. 11 The way in which the issue is framed has significant impact on the public’s viewpoint and level of support. A 2008 poll of New York State residents showed that while 52% of respondents support a soda tax, 72% would support such a tax if the revenue is used to support programs for the prevention of obesity in children and adults.6 When the tax is introduced in the context of promoting health and when the revenues are earmarked for programs promoting childhood nutrition or obesity prevention, then greater public support is gained for the tax.
3. Impact of the Proposed Tax Scenarios
To quantitatively evaluate the impact of the proposed penny‐per‐ounce tax for New
York State, we incorporated state‐specific epidemiological data and published literature in a model framework (Figure 6).
a. Framework of analysis
The analytic framework as depicted in Figure 6 represents the logical pathways through which the potential health and economic impact are evaluated in this report. The proposed increase in tax on these beverages results in an increase in average retail price of these beverages on a per volume basis, i.e., 1 cent per fluid ounce, regardless of serving/container size. Based on the concept of price elasticity, we surveyed the literature and estimated the possible reduction in SSB intake among New York residents in response to the average price increase as a percentage reduction of their current consumption level. The difference between the current level of intake and the hypothetical, lower level of intake as a result of the tax would be translated to two key health outcomes separately: diabetes and obesity.
In regard to the diabetes burden, we presented the potential impact of tax on the number of new diabetes cases prevented across New York State, and on the total savings from medical costs associated with treating diabetes and its complications. We used estimates from published follow‐up studies that reported changes in diabetes risks among study subjects who increase or reduce their SSB intake over time.
For the tax’s potential impact on reducing obesity, we first predicted the per capita
change in calories consumed from SSBs (kcal/day) for each consumption category. The expected caloric change is then adjusted for possible compensatory substitutions with other
18
beverages to result in a decline in total daily energy intake. Finally, we used a published model by Hall et al. 43, 44 to translate net reduction in daily energy to changes in population mean body weight. Their model predicts an average of 1 lb lower body weight for each 10 kcal/day reduction of energy intake for an average size adult at steady state. State‐specific data inputs are used whenever possible. The analysis is conducted in Excel.
Figure 6. Logical pathway of health and economic impact of taxes on SSB
b. Impact on price and consumption
b.1. Impact on price
The analysis evaluates a state‐wide excise tax at 1 cent per ounce on all beverages sweetened with caloric sweeteners such as sugar or high‐fructose corn syrup. According to a study commissioned by the American Beverage Association, the nationwide price for carbonated soft drinks averages to 4.5 cents per ounce. 45 The proposed tax rate, as a result, represents a 22% increase assuming 100% of the taxed amount on these beverages is passed through to their price tags. This is a realistic, if not conservative, estimate—one study has shown the pass‐through ratio can be as high as 129%. 46
b.2. Impact on consumption
Excise tax on SSB
Increase in Price
Reduced SSB Consumption
Lower Incident Type 2 Diabetes
Lower Obesity Lower Medical Cost
Net Increase Tax Revenue
Lower Daily Caloric Intake
19
Distribution of SSB consumption levels are derived from the NYC Community Health Survey (NYCCHS) 2007‐2008. NYCCHS is a population‐based telephone survey conducted annually since 2002 among non‐institutionalized adults ages 18 years or older (details on the survey can be found at http://www.nyc.gov/html/doh/html/survey/chs‐methods.shtml). The survey had two questions about the respondent’s SSB consumption frequency, one specifically about soda and the other about non‐carbonated sugar‐sweetened beverages. On average, in 2007‐2008, approximately one in three New York City adults consumes at least one SSB a day. As shown in Table 2, consumption declines with age: 40% of New Yorkers between the ages of 20 and 44 consume 1+ SSB per day, while 28% and 25% of adults of age 45‐64 and 65+ consume one or more SSB a day, respectively. The percentage of adults falling into the highest consumption category (2+/day) is: 24% (age 20‐44), 15% (age 45‐64) and 13% (age 65+). In addition to the differences by age, higher proportions of non‐Hispanic Black and Hispanic adults in New York City consume at least one SSB a day, compared with non‐Hispanic White adults (Table 2).
Based on a price elasticity of ‐0.8 from a recent systemic review of literature, 36 a 22% increase in SSB price translates into an 18% reduction in consumption under ideal situations, consistent with previous study by Brownell et al.6, 11 Applying this level of consumption reduction across the entire New York State population, the proposed tax is expected to reduce the proportion of adults consuming one or more drink a day by 2‐4 percentage points, and the proportion of adults consuming two or more drinks a day by 2‐6 percentage points (Figure 7). The reduction in high SSB consumers is most substantial among younger groups (age 20‐44) and among race‐ethnic minorities and lower income groups, the groups with the highest baseline consumption.
Table 2. Baseline and predicted shift in high consumption of SSB before and after proposed tax
%Adults consuming 1 or more SSB/day %Adults consuming 2 or more SSB/day
Group NYC, 2007‐8 With Tax Difference NYC, 2007‐8 With Tax Difference
Age 20‐44 Overall 39.6 36.9 ‐2.7 24.3 20.0 ‐4.3 Black 48.7 45.9 ‐2.8 33.0 27.1 ‐5.9
% Consume at least 1 SSB/day, Before vs. After Tax
45.4
31.5
26.3
42.4
28.9
24.2
34.3
24.5 24.3
31.8
22.4 22.1
0
5
10
15
20
25
30
35
40
45
50
20-44 45-64 65+
Age Group (Years)
%
Male(Baseline)
Male (tax)
Female(Baseline)
Female (Tax)
c. Predicted impact on diabetes in New York
c. 1. Incidence of diabetes Based on Centers for Disease Control and Prevention (CDC), the age‐adjusted incidence
of diagnosed diabetes is 7.8 per 1000 population in 2007. However, the incidence of type 2 diabetes drastically increases with age, ranging from 4.4 (per 1000 population) among age 18‐44 to 12.5 among age 65‐79. Furthermore, the risk is slightly higher in men than in women, in Blacks (10.5 per 1000) and Hispanics (9.6 per 1000) than in Whites (7.1 per 1000), and is 20% higher among lower‐income individuals.
Accounting for a New York State‐specific make‐up of age, gender, and race‐ethnicity groups, we estimated that approximately 124,000 new cases of diabetes are diagnosed in New York every year, roughly 34% of whom are Black or Hispanic and 31% of whom are from households with income lower than 200% poverty level. Most of these diabetes cases are preventable.
c.2. Impact of SSB tax on diabetes risk
21
The potential impact of an SSB tax on the disease burden of diabetes in New York State
is estimated based on its expected benefit in preventing new diabetes cases, i.e., reducing diabetes incidence. The best clinical evidence on the long‐term diabetes risks as a function of SSB intake is from a prospective cohort study conducted by Schultz et al.5 They followed 91,249 women free of diabetes and other chronic diseases at baseline and recorded 741 incident cases of type 2 diabetes from 1991 to 1999. They found that women who consume one or more soft drinks per day increased their risk of type 2 diabetes by 83%‐98% (adjusted for age and other factors), compared to those who consume less than one drink a week.
Based on the age‐adjusted results in Schultz et al., we estimated the corresponding relative risk for each consumption levels to be 1 (<1/week), 1.32 (1‐6.9/week), 1.63 (1‐1.9/day) and 2.37 (≥2/day). Applying a population impact fraction (PIF) framework (Appendix B.c), we estimated the proportion of new diabetes cases that would have been prevented if current consumption levels had been lowered to a post‐tax level, as described in the previous section. The analyses were conducted separately by gender and age groups.
By reducing 18% of SSB consumption in New York State, the proposed tax is expected to prevent 3.5% of new cases of diabetes in men and 3.0% in women. Although the health benefit of reducing SSB intake may take several years to realize, over the course of 10 years, the tax is expected to prevent more than 37,000 cases of type 2 diabetes state wide. The preventive benefit is greater among younger adults, due to their greater baseline consumption. In fact, approximately 30,000 new diabetes cases prevented are under the age of 65, representing an important societal benefit for the health, productivity, and quality of life of young and middle‐aged New Yorkers.
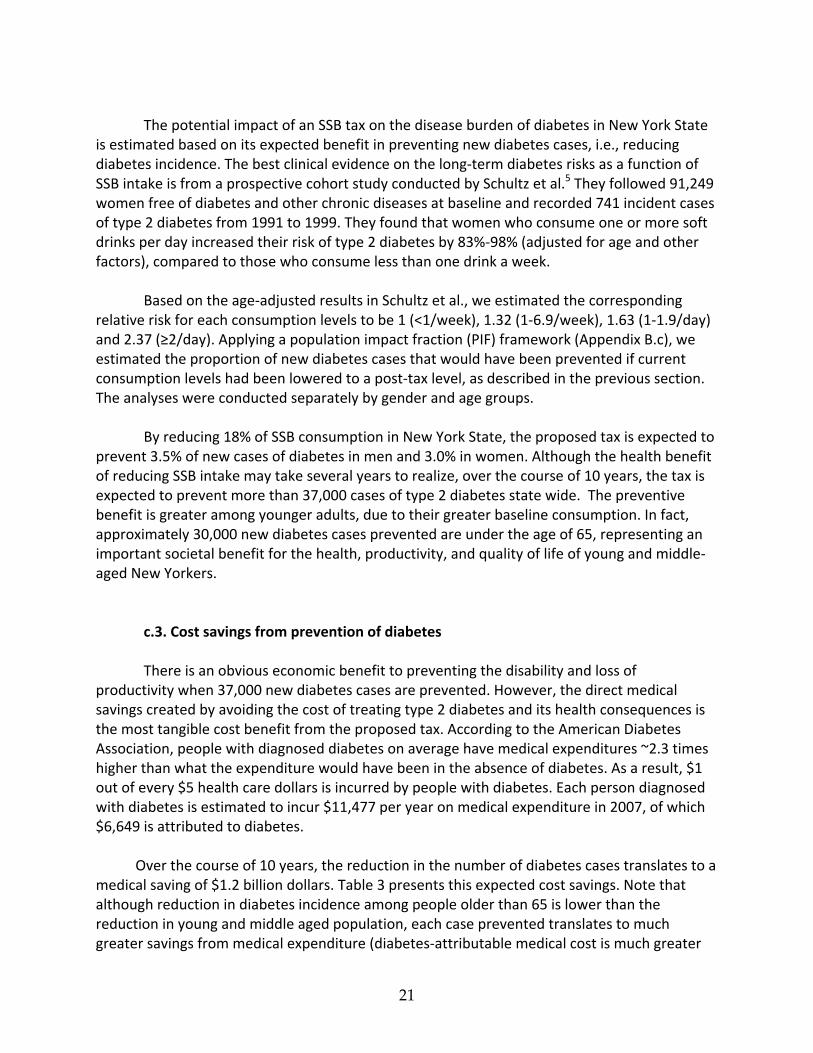
c.3. Cost savings from prevention of diabetes There is an obvious economic benefit to preventing the disability and loss of
productivity when 37,000 new diabetes cases are prevented. However, the direct medical savings created by avoiding the cost of treating type 2 diabetes and its health consequences is the most tangible cost benefit from the proposed tax. According to the American Diabetes Association, people with diagnosed diabetes on average have medical expenditures ~2.3 times higher than what the expenditure would have been in the absence of diabetes. As a result, $1 out of every $5 health care dollars is incurred by people with diabetes. Each person diagnosed with diabetes is estimated to incur $11,477 per year on medical expenditure in 2007, of which $6,649 is attributed to diabetes. Over the course of 10 years, the reduction in the number of diabetes cases translates to a medical saving of $1.2 billion dollars. Table 3 presents this expected cost savings. Note that although reduction in diabetes incidence among people older than 65 is lower than the reduction in young and middle aged population, each case prevented translates to much greater savings from medical expenditure (diabetes‐attributable medical cost is much greater
22
as one gets older, i.e., $10,199 per person per year for age 65+, compared to <$6000 for patients younger than 65). Therefore, the $1.2 billion dollar savings represents a conservative estimate of the tax’s long‐term impact.
Table 3. Potential Impact of proposed tax on disease burden of diabetes in New York State
All adults Age 20‐44 Age 45‐64 Age 65+
Diabetes in NYS
Incidence Rate (Per 1000 population) 7.8 4.4 11.7 12.5 Newly diagnosed diabetes cases each year 124,400 33,700 59,400 31,300 Per‐case medical cost attributable to diabetes (per patient, per year, in 2010 dollars) 47 $6,981 $3,998 $5,349 $10,199
Impact of SSB tax on diabetes over 10 years Predicted cases avoided from tax 37,400 12,600 17,100 7,700 No. of person‐years with diabetes prevented 205,500 69,100 93,800 42,600 Predicted medical savings ($, in millions) $ 1212 $276 $502 $435
d. Predicted impact on energy balance and obesity in New York
d.1. Impact on energy intake
Based on the median intake level estimated from NYC CHS, regular SSB drinkers (i.e.,
consumes at least one SSB a day) on average consume 250‐750 kcal/day assuming a serving size of 20 oz bottle (contains about 250 kcal). The downward shift in consumption level across the whole population translates to a per‐person reduction of 15‐35 kcal/day in calorie intake. The highest reduction is seen among young adult males—34 kcal/day fewer calories from these sweetened drinks. Aggregating over the population, this reduction amounts to 366 million calories a day, 134 billion calories a year, or 1.3 trillion calories over 10 years of “empty calories” eliminated among New York State population.
As reviewed previously, a portion of these calories would be substituted by other caloric beverages. There is virtually no empirical evidence on how consumers would choose alternative beverage options to quench their thirst in place of SSBs. Several studies attempted to approach this question via cross‐price elasticity; that is, how would an increase in SSB price affect consumption of non‐SSB beverages. One study argues that the entire caloric deficit from such a tax could be offset if consumers switch to milk or 100% juice. However, none of the studies was able to adequately capture changes in plain water consumption as a result of reducing SSB intake, arguably the key strategy to fully realize the caloric benefit of reducing SSB intake.
Stookey and colleagues15 examined the net impact on daily energy intake from replacing sweetened caloric beverages with drinking water, diet, or other beverages. They found the caloric deficit from replacing SSBs with water was not negated by compensatory increases in other food or beverages. The authors estimated that the net reduction in daily energy intake
23
from replacing SSB with water is 9 kcal/day for each unit of SSB replaced, replacing SSBs with diet drinks is 6 kcal/day, and replacing SSBs with other caloric beverages is 1 kcal/day. In other words, replacing SSBs with diet drinks maintains 2/3 of the caloric reduction compared to replacing SSBs with water. Based on these observations, we assume that 1/3 of the consumption of SSBs reduced due to the proposed tax would be replaced with water, 1/3 with diet drinks, and the other 1/3 with caloric beverages such as milk and juice. As a result, we assumed approximately 39% of the SSB calories reduced would be compensated for, resulting in 61% net reduction in daily energy intake (33%*100% [water]+ 33% * (6/9) [diet] + 33%*(1/9) [other beverages]).
d.2. Impact on weight and obesity The equation for translating energy balance to weight change (i.e., calories to lbs) is an
area with much controversy and misunderstanding.48 Based on the model developed by Hall et al.,43, 44 we predicted the impact of a per‐person reduction of 15‐35 kcal/day from the proposed tax on mean body weight of New York State population. This model accounts for human physiology of energy regulation and predicts an approximate 10 kcal/day reduction in food energy to result in one pound of weight loss at steady state.
Using this model, the proposed tax is expected to reduce mean body weight of the
population by 1‐2.5 lbs, larger among younger adults and smaller among older adults. This moderate reduction in weight can be translated into reduction in mean body mass index (BMI), which is measured as weight in kilograms divided by height in meters squared (1 kg=2.205 lbs). For US adult of average height (5’9” or 177cm for men, 5’4” or 163 cm for women), the expected shift of body mass index (BMI) in New York State would be 0.17‐0.30 kg/m2 (Table 4). Applying the shift in BMI to the NYS population, the “post‐tax” BMI distribution translates to an approximately 144,900 fewer obese adults in New York State, more than half of which are younger than age 45.
Consider the estimated medical expenditure attributable to obesity from the Medical Expenditure Panel Survey. Obese individuals spend an average of $1,443 dollars a year more than normal weight individuals, including increased use of inpatient (+$424/year), outpatient (+$448/year), and prescription drugs (+$574/year).49, 50 Reductions in obesity and average body weight represent potentially substantial savings to Medicare, Medicare, and private insurers alike.49 Across New York State, the predicted annual savings from the proposed tax from obesity prevention alone amounts to $209 millions or approximately $2 billion over 10 years. This again represents a conservative estimate: medical spending attributable to obesity‐related conditions increases exponentially in older ages (Table 4), therefore the true savings will take several decades to realize. Preventing obesity earlier in life (as expected from a tax on SSB that has the largest impact on younger adults) can lead to a significant savings on medical expenditure over one’s lifetime.
24
Table 4. Potential Impact of proposed tax on body weight and obesity in New York State
All adults Age 20‐44 Age 45‐64 Age 65+
Obesity in NYS Current prevalence of obesity 33.4% 31.4% 37.7% 30.4% Number of obese adults in New York State 4,970,000 2,304,300 1,890,000 776,000 Average medical cost attributable to obesity ($/person, per year, in 2010 dollars)
$1443 49 $335 (M) $600 (F)50
$1425 (M) $2200 (F)50
$2350 (M) $3550 (F)50
Impact of SSB tax on obesity, over 10 years Predicted average reduction in mean weight (lb), at steady state
‐1.5 ‐2.1 (M) ‐1.6 (F)
‐1.4 (M) ‐1.1 (F)
‐1.1 (M) ‐1.0 (F)
Reduction in obese NYS adults 144,900 83,800 41,700 19,400 Predicted after‐tax prevalence of obesity 32.4% 30.2% 36.9% 29.6% Predicted 10‐year medical savings* $2,090,000,000 $380,000,000 $740,000,000 $600,000,000 Predicted medical savings (per year)* $209,000,000 $38,000,000 $74,000,000 $60,000,000
* assuming steady state, savings equally distributed over 10 years time, and no discounting.
e. Health benefit in race‐ethnic minority and among low‐income individuals
Race‐ethnic minority and lower‐income individuals in New York State are disproportionally affected by a greater burden from obesity and diabetes. The average consumption level of SSBs is also higher in these groups. Taxation on these beverages will potentially provide greater health benefit and cost savings to these minority and lower‐income groups (Table 5).
Table 5. Potential Impact of proposed tax among race‐ethnic minorities and lower‐income individuals
All NYS Black Hispanic Lower Income (<200% FPL)
Percent NYS population 100% 15% 16% 29% Reducing burden of diabetes Current incidence of diagnosed diabetes (number of new cases/year)
124,400 21,500
21,200
38,200
10‐year reduction in diabetes cases 37,400 8,100 8,800 13,700
10‐year cost savings from diabetes prevented, in millions (% total NYS savings)
$1212 (100%)
$249 (21%)
$231 (19%)
$526 (35%)
Reducing burden of obesity
Current number of obese adults 4,970,000 932,000 729,000 1,377,000
Expected reduction in mean weight (lb) ‐1.5 ‐2.6 ‐2.7 ‐2.4
10‐year reduction in obese adults 144,900 40,900 41,500 62,200
10‐year cost savings from obesity prevented, in millions (%total NYS savings)
$2090 (100%)
$480 (28%)
$430 (25%)
$670 (39%)
*Over 10 years. FPL: Federal poverty level.
25
f. Impact on tax revenue
The proposed tax on SSBs is expected to generate substantial revenue. Based on per capita post tax consumption level (732,020,156 gallons in 2010), it is estimated that a penny‐per‐ounce excise tax would generate approximately $937,000,000 a year in revenue for New York State (Revenue calculator for soft drink taxes, Rudd Center for Food Policy and Obesity, http://www.yaleruddcenter.org/sodatax.aspx). The revenue expected for New York City is $404,000,000 a year. These tax revenues could potentially be used to generate even more health benefits for New York residents by funding programs to promote healthy eating and active lifestyles for adults and children.
Data obtained from Rudd Center for Food Policy and Obesity, http://www.yaleruddcenter.org/sodatax.aspx
g. Impact on individual and household spending
As we hypothesize that consumers will bear 100% of the proposed tax (i.e., 100% pass‐
through), a net increase in costs is expected despite the reduction in consumption. On an annual basis, each person pays an average of $49 of additional tax for SSBs. A US Department of Agriculture (USDA) report estimates that per capita spending on food and non‐alcoholic beverages amounted to $3832 in 2008 (including at home and away from home spending). The proposed increase in spending from an SSB tax represents 1.3% of total food spending.
A Consumer Expenditure Survey conducted by the Bureau of Labor Statistics estimates that high‐income individuals spent $3,080 in 2006 on foods and beverages and low‐income individuals spent $1,980. Nonetheless, lower‐income individuals in New York tend to be younger and consume approximately twice as many SSBs at baseline on a per capita basis (i.e., 0.68 serving/day state‐wide vs. 1.39 serving/day among low‐income). As a result, lower income individuals would be paying an average of ~$100 per year on SSB taxes, representing approximately 5% of their total food and beverage spending.
Table 6. Expected revenue from the proposed 1 cent per ounce excise tax on soft drinks for New York State
2010 2015
Type of Beverage Gallons Tax Revenue Gallons Tax Revenue
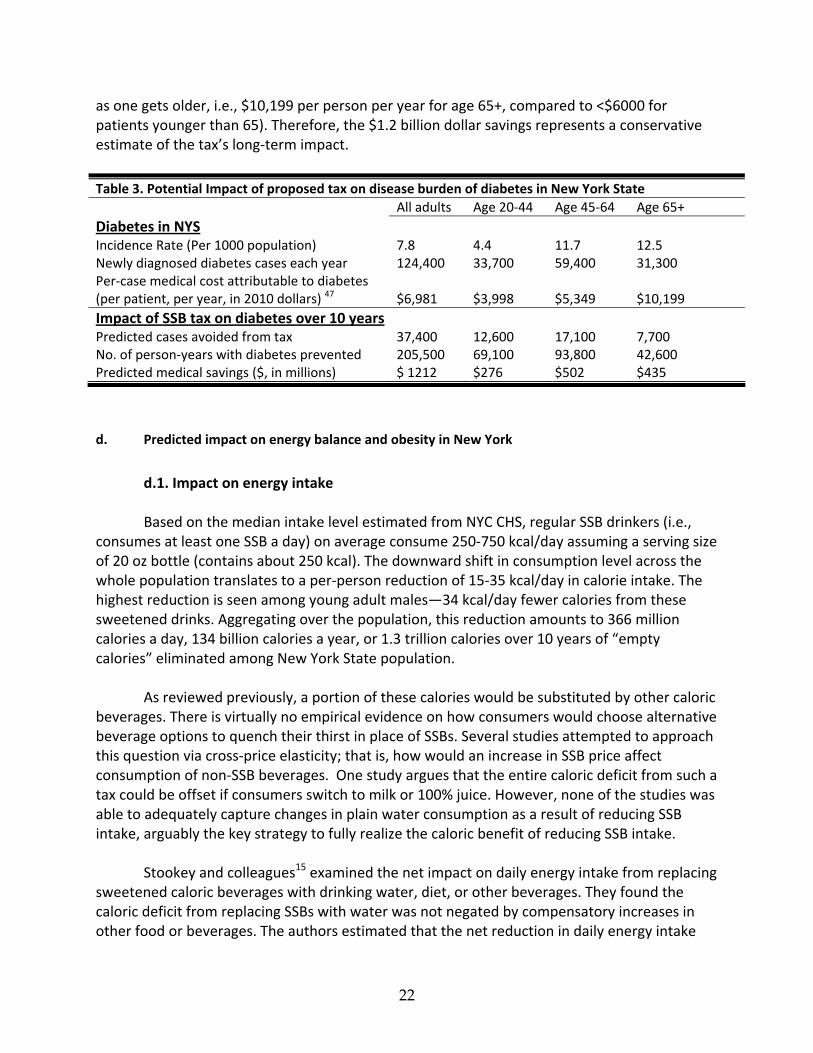
We conducted two sensitivity analyses to reflect the key uncertainties in the main analysis and their impact on expected impact from the proposed tax. The first sensitivity analysis is on the average retail price of SSB and the associated cost increase from the one‐penny‐per‐ounce tax (Table 7a and Figure 8). The greater the relative price increase is—for example, for the most inexpensive SSB on sale (~2 ¢/oz), likely in supermarkets and in bulk—the greater the potential health impact will result from the excise tax. Another great uncertainty implied here is the pass‐through rate. If the excise tax was only partially passed through to price, the corresponding increase in retail price will be less than the base case assumption of 22% price increase (e.g. only 10% increase). The resulting health and economic benefit will substantially diminish, although the magnitude of medical savings (e.g. $545 millions from diabetes and $939 millions from obesity treatment) remains significant even in the most pessimistic scenario.
Table 7. Sensitivity analysis
Table 7a. Sensitivity analysis (1): Varying average retail price of SSB (base case: 4.5 ¢/oz, resulting in 22% increase in price from proposed tax) and associated clinical and economic benefit from preventing type 2 diabetes and obesity
Base price: * 2 ¢/oz 4.5 ¢/oz
(Base case) 5 ¢/oz 10 ¢/oz
%Price Increase from a 1¢/oz tax 50% 22% 20% 10% Reduction in new diabetes in NYS over 10 years 83,900 37,400 33,600 16,800 Medical Savings from Diabetes (in millions) over 10 years $2,723 $1,212 $1,089 $545 Reduction in obese adults in NYS (at steady state) 325,400 144,900 130,100 65,100 Medical Cost Savings from obesity (in millions, over 10 years) $4,696 $2,091 $1,878 $939
* The base case price was based on the American Beverage Association Report;45 the lower bound (2 ¢/oz) was chosen from Nielsen sales data reflecting primarily supermarkets purchases; 5 and 10 are based on assumption
The second sensitivity analysis hinges on the assumed price elasticity, or the sensitivity of consumer response to a change in price. From the published 95% confidence interval of (0.33, 1.24), Table 7b and Figure 8b demonstrate the corresponding changes in anticipated health and economic benefit. Generally speaking, the smaller the absolute number of the price elasticity, the less change in consumption there will be and therefore less health and medical savings can be accrued from the propose tax.
27
Table 7b. Sensitivity analysis (2): Varying price elasticity (base case: ‐0.8, resulting in 18% reduction in consumption from proposed tax) and associated clinical and economic benefit from preventing type 2 diabetes and obesity
%Price Increase from a 1¢/oz tax ‐0.33 ‐0.8
(Base case) ‐1.24
Reduction in new diabetes in NYS over 10 years ‐7% ‐18% ‐28%
Medical Savings from Diabetes (in millions) over 10 years 15,400 37,400 57,900
Reduction in obese adults in NYS (at steady state) $500 $1,212 $1,879
Medical Cost Savings from obesity (in millions, over 10 years) 59,800 144,900 224,500
%Price Increase from a 1¢/oz tax $862 $2,091 $3,241
*‐0.33 and ‐1.24 are the high‐ and low‐bounds of the 95% confidence interval for soft drink price elasticity (point estimate is ‐0.8) based on Andreyeva et al.
Figure 8. Sensitivity analyses of (1) average price/%price increase and (2) price elasticity total cases of diabetes and obesity prevented and associated aggregate cost savings over the course of 10 years
Sensitivity Analysis 1. Number of Diabetes and Obesity Reduced, by base price & % price increase
325,400
83,900
130,100 144,900
65,10033,600
37,40016,800-
50,000
100,000
150,000
200,000
250,000
300,000
350,000
0% 10% 20% 30% 40% 50% 60%
Ca
se
s a
vo
ide
d
Obesity
Diabetes
Base Case:4.5¢/oz, 22% price increase
(10¢/oz) (5¢/oz) (2¢/oz)
Sensitivity Analysis 1. Cost Savings from Diabetes and Obesity Reduced, by base price & % price increase
$4,696
$2,723
$939
$2,091$1,878
$545$1,212
$1,089
$0
$1,000
$2,000
$3,000
$4,000
$5,000
0% 10% 20% 30% 40% 50% 60%
Med
ical
sav
ing
s ($
mil
lio
ns)
Obesity
Diabetes
Base Case:4.5¢/oz, 22% price increase
(10¢/oz) (5¢/oz) (2¢/oz)
28
Sensitivity Analysis 2. Number of Diabetes and Obesity Reduced, by price elasticity
Sensitivity Analysis 2. Cost Savings from Diabetes and Obesity Reduced, by price elasticity
$862
$2,091
$3,241
$500
$1,212
$1,879
$0$500
$1,000$1,500
$2,000$2,500
$3,000$3,500
-1.5 -1 -0.5 0Price Elasticity
Med
ical
sav
ing
s ($
m
illi
on
s)
Obesity
Diabetes
Base Case:-0.8
4. Discussions and Conclusions
The proposed penny‐per‐ounce excise tax on sugar‐sweetened beverages is likely to
produce modest health benefits from its projected prevention of obesity and type 2 diabetes. The direct savings in medical expenditure from these two conditions alone can be substantial, especially among race‐ethnic minorities and lower‐income individuals. The tax revenue generated from such tax can reach over a billion a year, representing a much‐needed potential funding source for programs targeted at education, childhood obesity prevention, and community health.
29
5. Literature Cited 1. Institute of Medicine, Committee on Childhood Obesity Prevention Action for Local Governments. Local government actions to prevent childhood obesity. Washington, DC: Institute of Medicine;2009. 2. Malik VS, Popkin BM, Bray GA, Despres J‐P, Hu FB. Sugar‐Sweetened Beverages, Obesity, Type 2 Diabetes Mellitus, and Cardiovascular Disease Risk. Circulation. March 23, 2010 2010;121(11):1356‐1364. 3. Malik VS, Schulze MB, Hu FB. Intake of sugar‐sweetened beverages and weight gain: a systematic review. Am J Clin Nutr. Aug 2006;84(2):274‐288. 4. Vartanian LR, Schwartz MB, Brownell KD. Effects of soft drink consumption on nutrition and health: a systematic review and meta‐analysis. Am J Public Health. Apr 2007;97(4):667‐675. 5. Schulze MB, Manson JE, Ludwig DS, et al. Sugar‐sweetened beverages, weight gain, and incidence of type 2 diabetes in young and middle‐aged women. JAMA. Aug 25 2004;292(8):927‐934. 6. Brownell KD, Frieden TR. Ounces of Prevention ‐‐ The Public Policy Case for Taxes on Sugared Beverages. N Engl J Med. Apr 8 2009. 7. Almiron‐Roig E, Chen Y, Drewnowski A. Liquid calories and the failure of satiety: how good is the evidence? Obes Rev. Nov 2003;4(4):201‐212. 8. Wang YC, Ludwig DS, Sonneville K, Gortmaker SL. Impact of change in sweetened caloric beverage consumption on energy intake among children and adolescents. Arch Pediatr Adolesc Med. Apr 2009;163(4):336‐343. 9. Pereira MA. The possible role of sugar‐sweetened beverages in obesity etiology: a review of the evidence. Int J Obes. 0000///print 2006;30(S3):S28‐S36. 10. Forshee RA, Anderson PA, Storey ML. Sugar‐sweetened beverages and body mass index in children and adolescents: a meta‐analysis. Am J Clin Nutr. June 1, 2008 2008;87(6):1662‐1671. 11. Brownell KD, Farley T, Willett WC, et al. The Public Health and Economic Benefits of Taxing Sugar‐Sweetened Beverages. N Engl J Med. October 15, 2009 2009;361(16):1599‐1605. 12. Lesser LI, Ebbeling CB, Goozner M, Wypij D, Ludwig DS. Relationship between funding source and conclusion among nutrition‐related scientific articles. PLoS Med. Jan 2007;4(1):e5. 13. Ebbeling CB, Feldman HA, Osganian SK, Chomitz VR, Ellenbogen SJ, Ludwig DS. Effects of decreasing sugar‐sweetened beverage consumption on body weight in adolescents: a randomized, controlled pilot study. Pediatrics. Mar 2006;117(3):673‐680. 14. James J, Thomas P, Cavan D, Kerr D. Preventing childhood obesity by reducing consumption of carbonated drinks: cluster randomised controlled trial. BMJ. May 22 2004;328(7450):1237. 15. Stookey JD, Constant F, Gardner CD, Popkin BM. Replacing Sweetened Caloric Beverages with Drinking Water Is Associated with Lower Energy Intake. Obesity. December 1, 2007 2007;15(12):3013‐3022. 16. Narayan KM, Boyle JP, Thompson TJ, Gregg EW, Williamson DF. Effect of BMI on lifetime risk for diabetes in the U.S. Diabetes Care. Jun 2007;30(6):1562‐1566. 17. Hu FB, Malik VS. Sugar‐sweetened beverages and risk of obesity and type 2 diabetes: Epidemiologic evidence. Physiology & Behavior. 2010;100(1):47‐54.
30
18. Palmer JR, Boggs DA, Krishnan S, Hu FB, Singer M, Rosenberg L. Sugar‐Sweetened Beverages and Incidence of Type 2 Diabetes Mellitus in African American Women. Arch Intern Med. July 28, 2008 2008;168(14):1487‐1492. 19. Bes‐Rastrollo M, Sanchez‐Villegas A, Gomez‐Gracia E, Martinez JA, Pajares RM, Martinez‐Gonzalez MA. Predictors of weight gain in a Mediterranean cohort: the Seguimiento Universidad de Navarra Study 1. Am J Clin Nutr. February 1, 2006 2006;83(2):362‐370. 20. Dhingra R, Sullivan L, Jacques PF, et al. Soft Drink Consumption and Risk of Developing Cardiometabolic Risk Factors and the Metabolic Syndrome in Middle‐Aged Adults in the Community. Circulation. July 31, 2007 2007;116(5):480‐488. 21. Fung TT, Malik V, Rexrode KM, Manson JE, Willett WC, Hu FB. Sweetened beverage consumption and risk of coronary heart disease in women. Am J Clin Nutr. April 1, 2009 2009;89(4):1037‐1042. 22. Nielsen SJ, Popkin BM. Changes in beverage intake between 1977 and 2001. Am J Prev Med. Oct 2004;27(3):205‐210. 23. Wang YC, Bleich SN, Gortmaker SL. Increasing caloric contribution from sugar‐sweetened beverages and 100% fruit juices among US children and adolescents, 1988‐2004. Pediatrics. Jun 2008;121(6):e1604‐1614. 24. Duffey KJ, Popkin BM. Shifts in Patterns and Consumption of Beverages Between 1965 and 2002. Obesity. November 1, 2007 2007;15(11):2739‐2747. 25. Bleich SN, Wang YC, Wang Y, Gortmaker SL. Increasing consumption of sugar‐sweetened beverages among US adults: 1988‐1994 to 1999‐2004. Am J Clin Nutr. Jan 2009;89(1):372‐381. 26. Chaloupka FJ, Powell LM, Chriqui J. Sugar‐sweetened beverage taxes and public health: a research brief. . Healthy Eating Research, Robert Wood Johnson Foundation. Available online at http://www.rwjf.org/files/research/20090731ssbbrief.pdf. 2009. 27. Chriqui JF, Eidson SS, Bates H, Kowalczyk S, Chaloupka FJ. State sales tax rates for soft drinks and snacks sold through grocery stores and vending machines, 2007. J Public Health Policy. Jul 2008;29(2):226‐249. 28. Pear R. Tax proposals draw critics in talks on financing health insurance. The New York Times. May 20, 2009. 29. Hakim D., Confessore N. Paterson seeks huge cuts and $1 billion in taxes and fees. . The New York Times. January 20, 2010. 30. Powell LM, Chriqui J, Chaloupka FJ. Associations between state‐level soda taxes and adolescent body mass index. J Adolesc Health. Sep 2009;45(3 Suppl):S57‐63. 31. Kim D, Kawachi I. Food taxation and pricing strategies to "thin out" the obesity epidemic. American Journal of Preventive Medicine. May 2006;30(5):430‐437. 32. Fletcher J, Frisvold D, Tefft N. Can soft drink taxes reduce population weight? Contemporary Econonomic Policy. 2010;28(1):23‐35. 33. Miljkovic D, Nganje W, de Chastenet H. Economic Factors Affecting the Increase in Obesity in the United States: Differential Response to Price. Food Policy. 2008;33(1):48–60. 34. Powell LM, Chaloupka FJ. Food prices and obesity: evidence and policy implications for taxes and subsidies. Milbank Q. Mar 2009;87(1):229‐257. 35. Andreyeva T, Long MW, Brownell KD. The Impact of Food Prices on Consumption: A Systematic Review of Research on the Price Elasticity of Demand for Food. Am J Public Health. Dec 17 2009.
31
36. Andreyeva T, Long MW, Brownell KD. The Impact of Food Prices on Consumption: A Systematic Review of Research on the Price Elasticity of Demand for Food. Am J Public Health. December 17, 2009 2009:AJPH.2008.151415. 37. Dharmasena S, Capps O. Demand Interrelationships of At‐Home Nonalcoholic Beverage Consumption in the United States. Paper presented at: Agricultural & Applied Economics Association, AAEA & ACCI Joint Annual Meeting; July 26‐29, 2009; Milwaukee, Wisconsin. 38. Lin B, Smith TA, Lee J‐Y. The effects of a sugar‐sweetened beverage tax: consumption, food energy, obesity, and tax by income. In Press. 39. Response to Increases in Cigarette Prices by Race/Ethnicity, Income, and Age Groups‐‐United States, 1976‐1993. JAMA. December 16, 1998 1998;280(23):1979‐1980. 40. Yen S, Lin B, Smallwood D. Demand for Nonalcoholic Beverages:The Case of Low‐Income Households. Agribusiness. 2004;20(3):309‐321. 41. Fletcher J, Frisvold D, Tefft N. The effects of soft drink taxes on child and adolescent consumption and weight outcomes2009. Located at: RWJF Scholars in Health Policy Research Program. Available at: http://www.healthpolicyscholars.org/sub‐news/working_papers/w44_Frisvold.pdf. 42. Hall KD, Guo J, Dore M, Chow CC. The progressive increase of food waste in America and its environmental impact. PLoS One. 2009;4(11):e7940. 43. Hall KD, Jordan PN. Modeling weight‐loss maintenance to help prevent body weight regain. Am J Clin Nutr. Dec 2008;88(6):1495‐1503. 44. Besley TJ, Rosen HS. Sales taxes and prices: an empirical analysis. National tax journal. 1999;52(2):157. 45. Economic costs of diabetes in the U.S. In 2007. Diabetes Care. Mar 2008;31(3):596‐615. 46. Katan MB, Ludwig DS. Extra Calories Cause Weight Gain‐‐But How Much? JAMA. 2010;303(1):65‐66. 47. Finkelstein EA, Trogdon JG, Cohen JW, Dietz W. Annual Medical Spending Attributable To Obesity: Payer‐And Service‐Specific Estimates. Health Aff. September 1, 2009 2009;28(5):w822‐831. 48. Wee CC, Phillips RS, Legedza AT, et al. Health care expenditures associated with overweight and obesity among US adults: importance of age and race. Am J Public Health. Jan 2005;95(1):159‐165.
1. Institute of Medicine, Committee on Childhood Obesity Prevention Action for Local
Governments. Local government actions to prevent childhood obesity. Washington, DC: Institute of Medicine;2009.
2. Malik VS, Popkin BM, Bray GA, Despres J‐P, Hu FB. Sugar‐Sweetened Beverages, Obesity, Type 2 Diabetes Mellitus, and Cardiovascular Disease Risk. Circulation. March 23, 2010 2010;121(11):1356‐1364.
3. Malik VS, Schulze MB, Hu FB. Intake of sugar‐sweetened beverages and weight gain: a systematic review. Am J Clin Nutr. Aug 2006;84(2):274‐288.
4. Vartanian LR, Schwartz MB, Brownell KD. Effects of soft drink consumption on nutrition and health: a systematic review and meta‐analysis. Am J Public Health. Apr 2007;97(4):667‐675.
32
5. Schulze MB, Manson JE, Ludwig DS, et al. Sugar‐sweetened beverages, weight gain, and incidence of type 2 diabetes in young and middle‐aged women. JAMA. Aug 25 2004;292(8):927‐934.
6. Brownell KD, Frieden TR. Ounces of Prevention ‐‐ The Public Policy Case for Taxes on Sugared Beverages. N Engl J Med. Apr 8 2009.
7. Almiron‐Roig E, Chen Y, Drewnowski A. Liquid calories and the failure of satiety: how good is the evidence? Obes Rev. Nov 2003;4(4):201‐212.
8. Wang YC, Ludwig DS, Sonneville K, Gortmaker SL. Impact of change in sweetened caloric beverage consumption on energy intake among children and adolescents. Arch Pediatr Adolesc Med. Apr 2009;163(4):336‐343.
9. Pereira MA. The possible role of sugar‐sweetened beverages in obesity etiology: a review of the evidence. Int J Obes. 0000///print 2006;30(S3):S28‐S36.
10. Forshee RA, Anderson PA, Storey ML. Sugar‐sweetened beverages and body mass index in children and adolescents: a meta‐analysis. Am J Clin Nutr. June 1, 2008 2008;87(6):1662‐1671.
11. Brownell KD, Farley T, Willett WC, et al. The Public Health and Economic Benefits of Taxing Sugar‐Sweetened Beverages. N Engl J Med. October 15, 2009 2009;361(16):1599‐1605.
12. Lesser LI, Ebbeling CB, Goozner M, Wypij D, Ludwig DS. Relationship between funding source and conclusion among nutrition‐related scientific articles. PLoS Med. Jan 2007;4(1):e5.
13. Ebbeling CB, Feldman HA, Osganian SK, Chomitz VR, Ellenbogen SJ, Ludwig DS. Effects of decreasing sugar‐sweetened beverage consumption on body weight in adolescents: a randomized, controlled pilot study. Pediatrics. Mar 2006;117(3):673‐680.
14. James J, Thomas P, Cavan D, Kerr D. Preventing childhood obesity by reducing consumption of carbonated drinks: cluster randomised controlled trial. BMJ. May 22 2004;328(7450):1237.
15. Stookey JD, Constant F, Gardner CD, Popkin BM. Replacing Sweetened Caloric Beverages with Drinking Water Is Associated with Lower Energy Intake. Obesity. December 1, 2007 2007;15(12):3013‐3022.
16. Narayan KM, Boyle JP, Thompson TJ, Gregg EW, Williamson DF. Effect of BMI on lifetime risk for diabetes in the U.S. Diabetes Care. Jun 2007;30(6):1562‐1566.
17. Hu FB, Malik VS. Sugar‐sweetened beverages and risk of obesity and type 2 diabetes: Epidemiologic evidence. Physiology & Behavior. 2010;100(1):47‐54.
18. Palmer JR, Boggs DA, Krishnan S, Hu FB, Singer M, Rosenberg L. Sugar‐Sweetened Beverages and Incidence of Type 2 Diabetes Mellitus in African American Women. Arch Intern Med. July 28, 2008 2008;168(14):1487‐1492.
19. Bes‐Rastrollo M, Sanchez‐Villegas A, Gomez‐Gracia E, Martinez JA, Pajares RM, Martinez‐Gonzalez MA. Predictors of weight gain in a Mediterranean cohort: the Seguimiento Universidad de Navarra Study 1. Am J Clin Nutr. February 1, 2006 2006;83(2):362‐370.
20. Dhingra R, Sullivan L, Jacques PF, et al. Soft Drink Consumption and Risk of Developing Cardiometabolic Risk Factors and the Metabolic Syndrome in Middle‐Aged Adults in the Community. Circulation. July 31, 2007 2007;116(5):480‐488.
33
21. Fung TT, Malik V, Rexrode KM, Manson JE, Willett WC, Hu FB. Sweetened beverage consumption and risk of coronary heart disease in women. Am J Clin Nutr. April 1, 2009 2009;89(4):1037‐1042.
22. Nielsen SJ, Popkin BM. Changes in beverage intake between 1977 and 2001. Am J Prev Med. Oct 2004;27(3):205‐210.
23. Wang YC, Bleich SN, Gortmaker SL. Increasing caloric contribution from sugar‐sweetened beverages and 100% fruit juices among US children and adolescents, 1988‐2004. Pediatrics. Jun 2008;121(6):e1604‐1614.
24. Duffey KJ, Popkin BM. Shifts in Patterns and Consumption of Beverages Between 1965 and 2002. Obesity. November 1, 2007 2007;15(11):2739‐2747.
25. Bleich SN, Wang YC, Wang Y, Gortmaker SL. Increasing consumption of sugar‐sweetened beverages among US adults: 1988‐1994 to 1999‐2004. Am J Clin Nutr. Jan 2009;89(1):372‐381.
26. Chaloupka FJ, Powell LM, Chriqui J. Sugar‐sweetened beverage taxes and public health: a research brief. . Healthy Eating Research, Robert Wood Johnson Foundation. Available online at http://www.rwjf.org/files/research/20090731ssbbrief.pdf. 2009.
27. Chriqui JF, Eidson SS, Bates H, Kowalczyk S, Chaloupka FJ. State sales tax rates for soft drinks and snacks sold through grocery stores and vending machines, 2007. J Public Health Policy. Jul 2008;29(2):226‐249.
28. Pear R. Tax proposals draw critics in talks on financing health insurance. The New York Times. May 20, 2009.
29. Hakim D., Confessore N. Paterson seeks huge cuts and $1 billion in taxes and fees. . The New York Times. January 20, 2010.
30. Powell LM, Chaloupka FJ. Food prices and obesity: evidence and policy implications for taxes and subsidies. Milbank Q. Mar 2009;87(1):229‐257.
31. Powell LM, Chriqui J, Chaloupka FJ. Associations between state‐level soda taxes and adolescent body mass index. J Adolesc Health. Sep 2009;45(3 Suppl):S57‐63.
32. Kim D, Kawachi I. Food taxation and pricing strategies to "thin out" the obesity epidemic. American Journal of Preventive Medicine. May 2006;30(5):430‐437.
33. Fletcher J, Frisvold D, Tefft N. Can soft drink taxes reduce population weight? Contemporary Econonomic Policy. 2010;28(1):23‐35.
34. Miljkovic D, Nganje W, de Chastenet H. Economic Factors Affecting the Increase in Obesity in the United States: Differential Response to Price. Food Policy. 2008;33(1):48–60.
35. Sturm R, Powell LM, Chriqui JF, Chaloupka FJ. Soda Taxes, Soft Drink Consumption, And Children's Body Mass Index. Health Aff. April 1 2010.
36. Andreyeva T, Long MW, Brownell KD. The Impact of Food Prices on Consumption: A Systematic Review of Research on the Price Elasticity of Demand for Food. Am J Public Health. Dec 17 2009.
37. Dharmasena S, Capps O. Demand Interrelationships of At‐Home Nonalcoholic Beverage Consumption in the United States. Paper presented at: Agricultural & Applied Economics Association, AAEA & ACCI Joint Annual Meeting; July 26‐29, 2009; Milwaukee, Wisconsin.
34
38. Andreyeva T, Long MW, Brownell KD. The Impact of Food Prices on Consumption: A Systematic Review of Research on the Price Elasticity of Demand for Food. Am J Public Health. December 17, 2009 2009:AJPH.2008.151415.
39. Lin B, Smith TA, Lee J‐Y. The effects of a sugar‐sweetened beverage tax: consumption, food energy, obesity, and tax by income. In Press.
40. Response to Increases in Cigarette Prices by Race/Ethnicity, Income, and Age Groups‐‐United States, 1976‐1993. JAMA. December 16, 1998 1998;280(23):1979‐1980.
41. Yen S, Lin B, Smallwood D. Demand for Nonalcoholic Beverages:The Case of Low‐Income Households. Agribusiness. 2004;20(3):309‐321.
42. Fletcher J, Frisvold D, Tefft N. The effects of soft drink taxes on child and adolescent consumption and weight outcomes2009. Located at: RWJF Scholars in Health Policy Research Program. Available at: http://www.healthpolicyscholars.org/sub‐news/working_papers/w44_Frisvold.pdf.
43. Hall KD, Guo J, Dore M, Chow CC. The progressive increase of food waste in America and its environmental impact. PLoS One. 2009;4(11):e7940.
44. Hall KD, Jordan PN. Modeling weight‐loss maintenance to help prevent body weight regain. Am J Clin Nutr. Dec 2008;88(6):1495‐1503.
45. Hahn R. The potential economic impact of a U.S. excise tax on selected beverages: A report to the American Beverage Association. August 31 2009.
46. Besley TJ, Rosen HS. Sales taxes and prices: an empirical analysis. National tax journal. 1999;52(2):157.
47. Economic costs of diabetes in the U.S. In 2007. Diabetes Care. Mar 2008;31(3):596‐615. 48. Katan MB, Ludwig DS. Extra Calories Cause Weight Gain‐‐But How Much? JAMA.
2010;303(1):65‐66. 49. Finkelstein EA, Trogdon JG, Cohen JW, Dietz W. Annual Medical Spending Attributable
To Obesity: Payer‐And Service‐Specific Estimates. Health Aff. September 1, 2009 2009;28(5):w822‐831.
50. Wee CC, Phillips RS, Legedza AT, et al. Health care expenditures associated with overweight and obesity among US adults: importance of age and race. Am J Public Health. Jan 2005;95(1):159‐165.
35
Appendix. Assumptions and Methods A. Data sources New York City Community Health Survey (http://www.nyc.gov/html/doh/html/survey/survey.shtml) The Community Health Survey is an annual, random digit dialing, computer‐assisted telephone survey of approximately 10,000 non‐institutionalized adults older than age 18 years residing in households with a landline telephone. The survey collects self‐reported data modeled after the Behavioral Risk Factor Surveillance System using a stratified random sample with neighborhood sampling strata. Data from the 2007 and 2008 surveys were combined to estimate the distribution of SSB consumption among adult New York residents from the following questions:
INTERVIEWER: The next three questions are about how often you drink sugar sweetened soda, other sweetened beverages and diet soda. One drink would equal a 12 ounce can, bottle or glass. How often do you drink sugar sweetened soda? Do not include diet soda or seltzer. How often do you drink other sweetened drinks like sweetened iced tea, sports drinks, fruit punch or other fruit‐flavored drinks? Do not include diet soda, sugar free drinks, or 100% juice.
In our analysis, we assume SSB consumption levels among NYC residents are similar to all NY state. National Health and Nutrition Examination Survey (NHANES) (http://www.cdc.gov/nchs/nhanes/nhanes_questionnaires.htm) The National Health and Nutrition Examination Survey is a periodic, cross‐sectional survey to assess the health and nutritional status of adults and children in the United States. The survey contains an interview, 24‐hour dietary recall, physical examination, as well as a number of lab and imaging studies. The NHANES is conducted by the National Center for Health Statistics under CDC with a nationally representative sample of 5,000 persons each year. Since 1999, the ongoing NHANES survey data are available every two years (1999‐2000, 2001‐2, 2003‐4, 2005‐6, and 2007‐8). New York City Health and Nutrition Examination Survey (NYC HANES) (http://www.nyc.gov/html/doh/html/hanes/hanes.shtml) NYC HANES was a household‐based examination survey conducted among non‐institutionalized NYC adults aged 20 and older. The survey is based on the NHANES. NYC HANES used a 3‐stage cluster sample to achieve a representative sample of NYC adults. Household and participants were randomly selected from 144 city neighborhoods. Those individuals comprising the sample participated in a health interview and brief examination. Interviews were conducted in English and Spanish; interpreters were used from other languages. EpiQuery: NYC Interactive Health Data (https://www.nyc.gov/health/EpiQuery/) Epiquery is an interactive health information system providing basic data analyses on several datasets on the health of the population of New York City. The available data are statistics on
36
overall mortality, mortality by cause, and the top 10 leading causes of death and birth statistics by year since 2000 with death trends since 1994. It also provides neighborhood‐level data on a variety health factors and characteristics. EpiQuery NYC contains data modules from the Community Health Survey, Communicable Disease Surveillance System, NYC Health and Nutrition Examination Survey, the Youth Risk Behavior Survey, the World Trade Center Health Registry Baseline Survey, and the U.S. Census. The Behavioral Risk Factor Surveillance System (BRFSS) ‐ New York State (http://www.health.state.ny.us/nysdoh/brfss/) The Behavioral Risk Factor Surveillance System is mechanism of data collection through a statewide telephone survey performed monthly and conducted on the non‐institutionalized adult household population, aged 18 years and older. It examines risk behaviors and other factors that contribute to major causes of mortality and morbidity in New York. The data is used for planning, initiating, and supporting health programs at the state and federal level. Youth Risk Behavior Survey (YRBS) (http://www.nyc.gov/html/doh/html/episrv/episrv‐youthriskbehavior.shtml) The Youth Risk Behavior Survey is a survey that assesses health‐risk behaviors and the prevalence of obesity and asthma among youth and young adults. It is a school‐based survey conducted by the CDC with local surveys administered by state and local governments and schools. The NYC YRBS cited in this report is conducted by NYC Department of Health and Mental Hygiene (DOHMH) and Department of Education (DOE).
B. Calculating disease burden averted We estimated the proportion of new diabetes cases that would have been prevented if current consumption level had been lowered to a post‐tax level. This metric is known as the population impact fraction (PIF; Drescher and Becher 1997; Eide and Heuch 2001; Walter 1980). We conducted analyses separately by sex and age groups based on NYC CHS consumption and published data on diabetes incidence.
PIF= 1 1
1
'n n
i i i ii i
n
i ii
PRR P RR
PRR
,
where i(=1, 2, …n) corresponds to exposure levels 1 through n; RRi is the relative risk at exposure level i, Pi is the population distribution of exposure; and Pi’ represents the alternative population distribution of exposure. In the context of the current analysis, “exposure” corresponds to different levels of SSB intake (i.e. less than once a week, at least once a week but less than one a day, at least one a day, and
37
at least 2 a day). These categories are mutually exclusive. Relative risks correspond to the risk ratios for developing diabetes or obesity associated with different levels of intake. The resulting PIF therefore represents the proportional reduction (i.e. 12% from base case analysis) of disease incidence from a post‐tax SSB consumption distribution (P’) compared to the pre‐tax consumption distribution we currently observe (P).
38
Appendix Table: Key assumption and sources for parameter inputs
Model Input Estimates Methods and Assumptions Sources
Population size (Age 2 and older)
N=18,810,744; 24% are under age 20; 36% age 20‐44; 27% age 45‐64; 14% age 65+
Used as basis to calculate number of new diabetes cases, number of obese adults, total revenue, and total medical cost.
U.S. Census Bureau population estimates for New York State, Vintage population estimates 2007.
Income distribution
Approximately 30% of adults in NYS are defined as low income.
Low income is defined as household income <200% Federal poverty level (FPL)
2008 American Community Survey 1‐year estimates
Tax effect on average SSB price
$0.01/oz excise tax increases SSB price by 22% (average carbonated soft drink price is 4.5 cent/oz).
Assuming 100% pass through to retail price
Report to American Beverage Association 45.
Price elasticity for soft drinks
‐0.8 (base case), range (‐1.24, 0.33) based on 95th confidence interval reported
Systemic review of 160 studies and meta‐analysis by Andreyava et al. 36 on elasticity for food and beverages.
Baseline SSB consumption
40% young adults (20‐44y) consume 1 or more SSB a day, 24% 2 or more a day. Consumption decline with age and is higher in men, race‐ethnic minorities, and lower‐income individuals.
Based on reported frequency of consumption on regular soda and other sugar sweetened beverages. We assume consumption levels of NYC respondents are representative of the State.
NYC Community Health Survey, 2007‐2008 combined, prepared by NYC DOHMH, Bureau of Epidemiology Services and Bureau of Chronic Disease, Prevention March 2010
Relative Risks (RR) of high SSB consumption on incident diabetes
Estimates are adjusted for multiple covariates (age, activity, alcohol use, family history, smoking, etc) but not BMI or total caloric intake. Assuming RR same for men and women. RR for 1‐1.99 servings/day and 2+/day are linearly extrapolated from Schultz
Schultz et al. JAMA 2004 5 based on 8‐year (1991‐1999) follow up of 91249 women free of diabetes and other chronic disease at baseline, 741 incident cases of type 2 diabetes during 716300 person‐years.
39
data.
Incidence of Diabetes
4.4 per 1000 for age 18‐44y, 11.7 per 1000 for age 45‐64, and 12.5 per 1000 for age 65+, slightly higher in men than in women.
Incidence ratios by race‐ethnic groups and by income groups were applied to age‐specific incidence.
Centers for Disease Control and Prevention (CDC), 2007 statistics. http://www.cdc.gov/diabetes/statistics/incidence_national.htm
Prevalence and Incidence of Obesity
25% of New York residents are obese (BMI≥30 kg/m2), up from 21% in 2003.
Incidence of obesity is calculated based on prevalence trends 2003‐2008.
These costs include services to directly treat diabetes and a portion of total costs to treat diabetes‐attributable cardiovascular, neurological, renal, and other complications.
Estimates by the American Diabetes Association in its report “Economic costs of diabetes in the US in 2007”47 using a combination of data bases, including MEPS, NAMCS, and NHAMCS.