52
The Power of Advanced Planning Tools EyeOn Belgium – Industry Network Event Antwerp – April 19, 2017

The Power of Advanced Planning Tools EyeOn Belgium – Industry Network Event
Antwerp – April 19, 2017

Agenda
APS : Getting started and tool selection
The APS Compass : User requirements, design & implementation
Team capabilities & organizational changes
2
APS Characteristics
– There are some generally accepted APS characteristics:
• Constraint-based
• Optimization
• Scenario simulation
• Coverage of multiple stages in the supply chain (if fully deployed)
– ERP tells you what is going on, APS what should be going on
3

APS Prerequisites
4
– APS can be part of your solution in dealing with planning complexity if a number of prerequisites are fulfilled:
• Synchronized processes
• Knowledgeable people
• Organizational discipline
• Solid master data management
– APS can be a part of your problem in dealing with planning complexity when the prerequisites are not met

APS Functionality
5
1. Some of the typical APS offerings
Constrained planning
Scenario simulation
E2E visibility ( when fully deployed)
2. Optimisation through heuristics & solvers are useful, but very dependent on correct inputs and configuration
3. Revenue & margin management is not always a typical APS offering

APS is a key enabler for decision making
6
Set clear planning objectives
Pay attention to the decision making process

APS elements to consider
7
FEASIBLE PLAN
PLAN ADHERENCE
PLAN INTEGRATION

Typical approach
8
51 42
Objectives & scope• Objectives connected
to goals• Target operating
Model ( TOM), Stadtler (scope), SCOR (process), data flow model (integration)
Analysis• Assess current
state• Gap analysis
Design• Starting from decisions• ‘what do you need to
receive, do and provide to make that decision’
• Integration (‘handovers’) with other functions
Implement• Cutover to new
process• Planning solution and
master data updates/ changes
• Training & change management
Decision drivenTake decisions at place (horizon, scope, aggregation) where quality is best
3
Tool Selection• Business case • Functional
requirements• Selection process
(RFI/ RFQ/ Demo/…)

Scoping : Stadtler as a tool to define scope
9
Integration between the different planning layers / processes
Clear distinction of decisions per planning layer
Long term
Mid term
Short term
Rough Cut CapacityPlanning (RCCP)
Material Requirements
Planning (MRP) ATP & Demandfulfillment
Demand PlanningDistribution Resource
Planning (DRP)
Sales & Operations Planning (S&OP)
Scheduling Transport planning
Strategic Network Design
Supply Network Planning
Purchasing Production Distribution Sales
Bucket Detail Frequency
+ + +

Positioning Stadtler within other approaches like SCOR
10
Source: supply chain council Source: Stadtler & Kilger, 2005
Functions in relation to each otherLinear, process level

There is more than Business and Functional Requirements !
11
Requirement Type Requirement Scope
Business Requirements Higher level statements of the goals, objectives, or needs of the enterprise
Stakeholder Requirements
Statements of the needs of a particular stakeholder or class of stakeholders. They describe the needs that a given stakeholder has and how that stakeholder will interact with a solution
Solution Requirements Characteristics of a solution that meet business requirements and stakeholder requirements
Functional Behaviour and information that the solution will manage
Non-functional Describe environmental conditions under which the solution must remain effective or qualities that the systems must have
Transition Requirements Describe capabilities that the solution must have in order to facilitate transition from the current state of the enterprise to a desired future state
Business Analysis Body of Knowledge® (BABOK® Guide)

Target Operating Model : the first step
Purpose of the Target Operating Model
The planning principles do not include process descriptions, but describe principles, improvements in current WOW , process implementation risks with regard to elements enabling a successful implementation 12
Last changed: 30/05/2016 (BLA)
Level Description
Level 1Generic
• Planning principles
Level 2Configuration
• Differentiate complexity• Differentiate the businesses & supply chain models (MTO/ MTS/ …)
Level 3Process blocks
• Main process blocks• Swimming lanes• Metrics related to tasks
Level 4Workflow of tasks
• Workflow of tasks:• Sequence of steps• Input / Output
Level 5Work instruction
• Work instructions• System transactions

Implementation phasing - example
13
Demand Planning is in general a good starting point
Start per function, highest impact improvements first
Combined NRP& RCCP – next logical step
Supply Planning MPS & Detailed Scheduling
Inventory Planning & DRP as the last step
– Base level and standardized plant / warehouse alignment
– Inventory control
– Optimize in the plants– Drive supply KPI
– Inventory optimization– Full close loop planning to execution

Tooling Selection – Abundance of Choice - SC Magazine IT Subway
14 http://itsubwaymap.com/
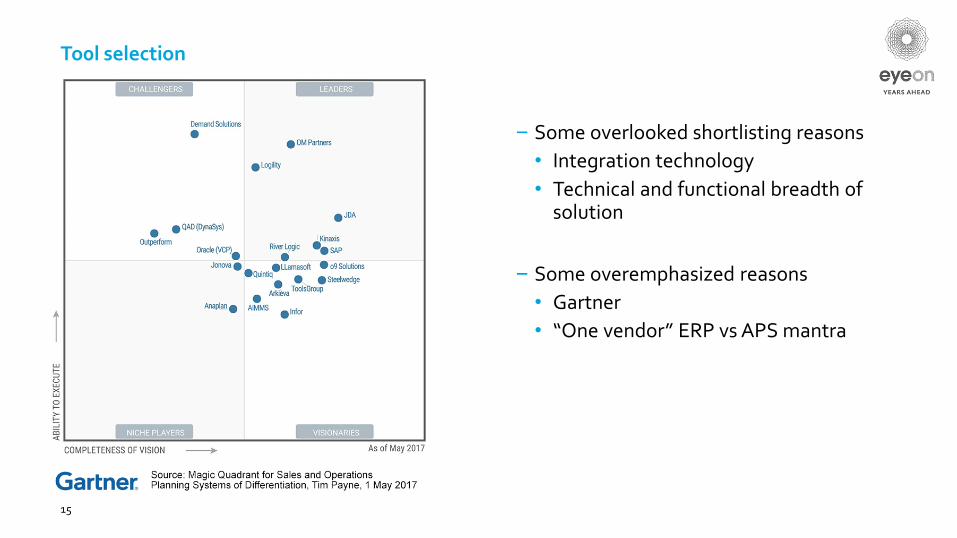
To0l selection
– Some overlooked shortlisting reasons
• Integration technology
• Technical and functional breadth of solution
– Some overemphasized reasons
• Gartner
• “One vendor” ERP vs APS mantra
15

10 step selection process for planning tools
1. Check (high level) process design &
requirements
2. Define functional requirements
3. Create short list/ Send out Request for
Information (RfI)
4. Send out Request for Proposal (RfP)
5. RfP discussion meeting 6. Review suppliers
7. Prepare scripts for demo sessions
8. Demo sessions with suppliers
9. Final selection 10. Negotiation
Milestone: main activities of to-be process
Milestone: required functionality must have and nice to have
Milestone: send out RfP Milestone: get to know supplier and review critical requirements
Milestone: short list of potential suppliers
Milestone: decide on suppliers to consider in next phase
Milestone: determine differentiators in req. between suppliers
Milestone: 1st preferred supplier2nd best supplier
Milestone: define demo script to make final selection
Milestone: agree on contract with supplier
Create business case (costs)
Create business case (benefits)

Thoughts on tool selection
– Short list based on existing tool knowledge, not only analyst lists
– Requirement based, organize second line of review
– Dig deeper on delivery technology (cloud, on premise, SaaS, …..)
– Set service requirements for the APS vendor
17
Agenda
APS : Getting started and tool selection
The APS Compass : User requirements, design & implementation
Team capabilities & organizational changes
18

19
Design

Designs trade offs : Make it work
Central vs local
Aggregated vs level of detail
Analytical vs transactional
Fast scenarios vs single outcome
Heuristics / solver vs manual
Graphical representation vs numeric
20

Managing design tracks: best practices
– Planned order, process / production order, sales, purchasing cycles
– Master data integration
– Cross systems integration
21
Overall Design
Core IntegrationPrinciples
Functional Design
Integration Design
Master Data Design

Key messages for design
22
Translate requirements to tangible concepts like cycles, actions, interfaces
Integrally consider functional, master data, integration and performance aspects
Master data design and location standardization can be sacrificed, if specific business process requirements are key and integration does not suffer

Understand your supply chain
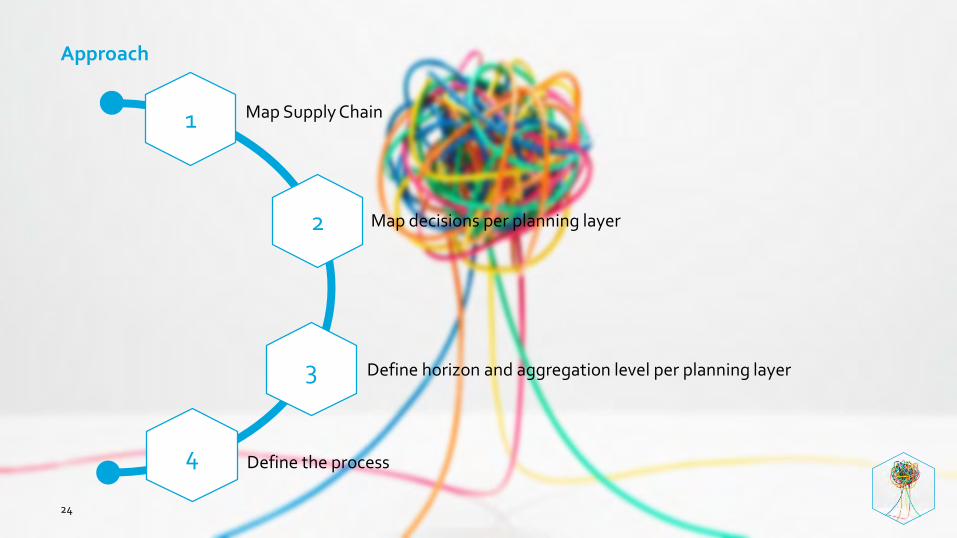
Approach
24
Define horizon and aggregation level per planning layer
1
2
3
Map Supply Chain
Map decisions per planning layer
4 Define the process
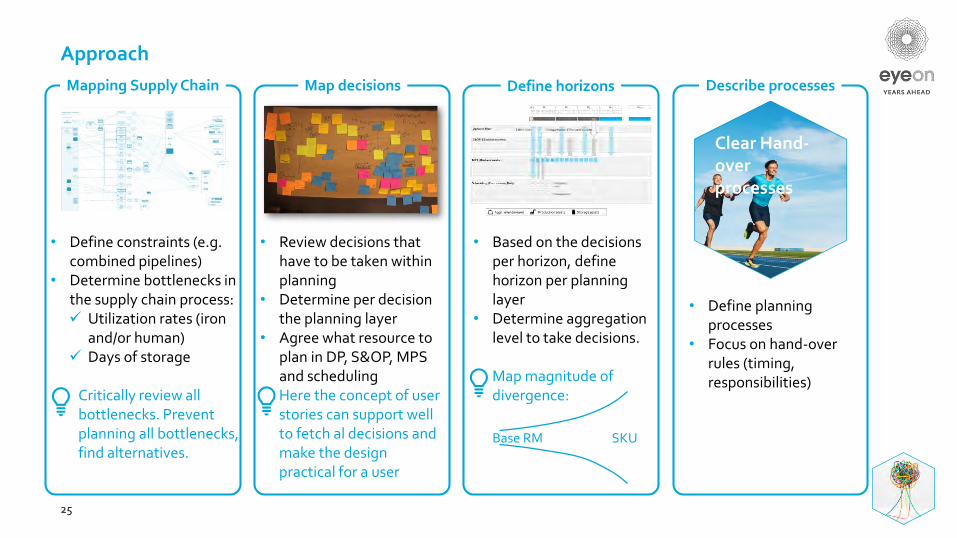
Approach
25
Mapping Supply Chain Define horizons
• Based on the decisions per horizon, define horizon per planning layer
• Determine aggregation level to take decisions.
Map magnitude of divergence:
Map decisions
• Review decisions that have to be taken within planning
• Determine per decision the planning layer
• Agree what resource to plan in DP, S&OP, MPS and schedulingHere the concept of user stories can support well to fetch al decisions and make the design practical for a user
Describe processes
• Define planning processes
• Focus on hand-over rules (timing, responsibilities)
• Define constraints (e.g. combined pipelines)
• Determine bottlenecks in the supply chain process:✓ Utilization rates (iron
and/or human)✓ Days of storage
Critically review all bottlenecks. Prevent planning all bottlenecks, find alternatives.
Clear Hand-over processes
SKUBase RM

26
Clear Hand-over processes

Think cycles and set clear responsibilities
27
Close open orders
Interface stock/ sales
orders
Run MRP
Evaluate schedule
6:00
8:00
Receive S&OP plan
Create MPS
Determine capacity
constraints
Day 15
Day 17Receive forecast update
Evaluate stock
position
Determine
new MPS plan
Monday
Tuesday
Daily
Weekly
Monthly
MPS Process
S&
OP
Pla
nn
er
MP
S P
lan
ner
Sa
les
Pro
du
cti
on
Sch
ed
ule
rC
SR
Ra
w M
ate
ria
l p
lan
ne
r
DailyMonthly5th Weekly
Planned anticipation
stock
Production Calendar
Stock Targets
Outcome S&OP
Process
Current Stock Level
Constraint Demand
Plan
Netting of
Demand based
on new
forecast
Determine
Requirement
s MA
Review
Alerts
Solve alert
by adjusting
GMN
planning
Weekly
Production
Meeting
Process
outcome of
meeting
Review
Alerts
Plan supply
MA
Current Stock Level
Netting of
Demand based
on new
forecast
Sales Order Book
Demand
Control
Process
Current Stock Level
Sales Order Book
ATP Process Back Orders
Review
Alerts
Check
starting
stock
position
Possible to
solve w/o
interfering
fixed
horizon?
Run alerts
based on
orders (no
forecast)
Alert
solved?
Confirm new
schedule
Consult
product mng
for
prioritization
No
Yes
Yes
No
Updated process orders
Updated process orders
Confirmed
Schedule
Production
performance
day-1
Updated planned orders
Updated planned orders
Planning rules
Planning rules &
component availability
Planning rules &
component availability
Planning rules: min, target stock level, max stock level (storage capacity), sequencing rules
Component availability: availability of raw materials and packaging material
Run MRP
Order long
lead-time
components
Discuss with MPS
planner to align
planning in case
insufficient supply
Run MRP
Order raw
materials/
packaging
Discuss with
scheduler to align
planning in case
insufficient supply
Projected Stock level
RM/
Packaging
ordered
RM/Packaging
ordered
2
2
Current Stock Level
Current Stock Level
PO
PO
Agreed
Schedule
Determine Req
bottleneck
production
lines
Plan supply
at bottleneck
resources
Push supply to
low utilized
production
lines
Evaluate
impact on
bulk raw
materials
Evaluate
impact on
bulk raw
materials
Order bulk
raw
materialsing
Discuss with
scheduler to align
planning in case
insufficient supply
Projected Stock level
Storage Capacity
tanks
Bulk RM ordered
1
Current Stock Level
PO
1
1
Handover
Schedule
D+1
Process
orders (REL)
Planned
Production
Required # of
people
...
Harmonized snap shot
6:22
SAP
SAP
Month
Week
Day
Define swim lane
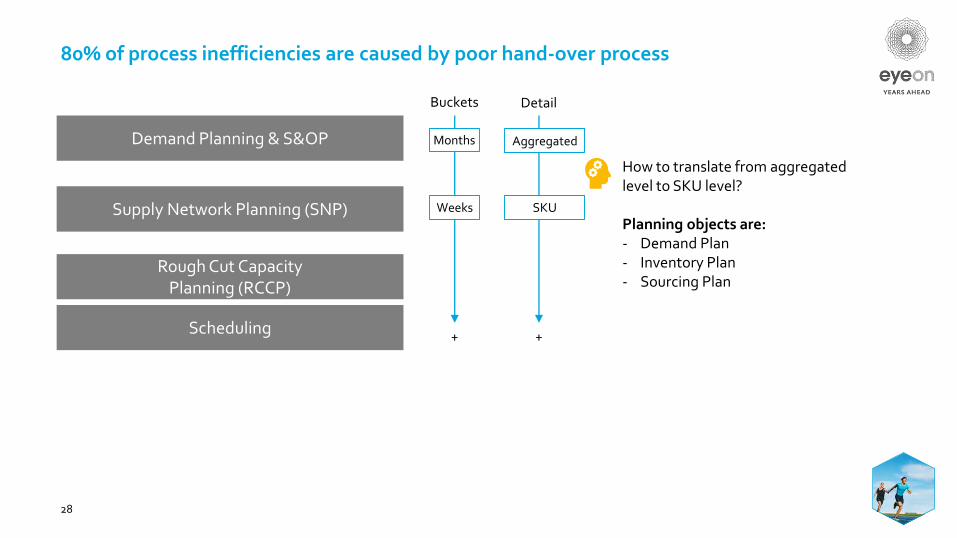
80% of process inefficiencies are caused by poor hand-over process
28
Demand Planning & S&OP
Supply Network Planning (SNP)
Rough Cut CapacityPlanning (RCCP)
Scheduling
DetailBuckets
+ +
Months
Weeks
Aggregated
SKU
How to translate from aggregatedlevel to SKU level?
Planning objects are:- Demand Plan- Inventory Plan- Sourcing Plan

Integrate and don’t overcomplicate

Optimization? If Excel is the starting point….
30
30
Network Requirements File Allocation File
First and second stage plan NPI Planning
DSP Daily Schedule DSP Batch Schedule by Hour
Packing ScheduleUSP Daily Schedule
Scheduling Level of Detail Master Planning Level of Detail
No
t Co
nn
ecte
d

Optimization? Let’s start with visualization
31
Use the available alerting functionality:1. Planned vs target inventory2. Capacity utilization3. Component availability4. Demand Changes5. ...
Understand degree of freedom by combine with type of demand:Does my alert still exists when I only considered confirmed demand?
VISUALIZEALERTING

Don’t plan every resource, but apply upstream restriction in planning rules
32
• Apply Single Point of Planning, the rest will follow!• Production processes can consist of multiple upstream steps• Most likely these processes will have separately different constraints• To avoid multiple review of the planning per process step, include the upstream constraint in the
planning rules of the last step
>

Manage volatility

Stop Forecast .... Manage Volatile Demand
34
Why forecasting?
Capacity Management
Make financial forecast
Sourcing of raw materials
Ordering of critical components
Replenishment of stock
?

Use the right replenishment strategy!
– Most process industry companies prefer stability in their manufacturing processes.
• Batch size driven systems (EOQ) trigger replenishment based on stock levels.Timing of replenishment orders is uncertain, quantity is certain.
• Periodic replenishment systems (EPEC) trigger replenishment based on timing.Timing of replenishment is certain, quantity is uncertain
35
8 4 4 2 1 1
Week 2
Week 1
Week 4
Week 3
Flexibleslots
Fixedrhythm

80-90% of companies use rule-of-thumb to set safety stocks
36
In a world that is full of dynamics can we suffice with such aneasy method?
• All customers are equal, but some are more equal thanothers: S&OP guidance on service offering
• Consider the relevant factors: demand uncertainty, target service level, shelf lifes, supply uncertainty and productioncapabilities.
• Mind the signal and the noise:it is not about the most advanced statistics, just rigor statistics

37
Feasible plan
Feasible Planning

Average production times is only correct in 50% of the cases...
38
+ Average batch times work fine within production planningNote: planning to maximum capacity of < 100%
- Average batch times in scheduling will result in plan adherence issuesNote: planning to all available machine hrs
For scheduling use production batch times with e.g. a 90% upper bound percentile
Pull forward demand when production is running well.
Scheduling
RCCP

Closing the loop for advanced planning systems
Define top parameters
• Using simulation determine to which parameters the outcome is most sensitive
Integrate in APS
• Integrate real-time to APS and transactional systems as parameters
• Use variance as input to safety stock and scenario calculations
Define true parameter value
APS’s have grown to support real-time, data driven insights. However: the data loop is not closed
• Determine the true parameter valuebottom up, using e.g. movement data
“Exactly Wrong”
Advanced Planning
Estimated Data

40
Optimal team

Thoughts on organizational set-up for demand planning
Centralized• Simple governance structure• Alignment of supply chain, financial & overall business goals• Process standardization• Lower bias • Career paths more attractive: better recruiting and retention
Decentralized• Proximity to market: sense demand• Flexibility to shape demand (NPI, promoted products)• Autonomy to match (local) supply to demand in best way
Sales & Marketing• Clear accountability
Operations / Supply Chain management• Independent• Expertise with planning
41

Thoughts on organizational setup for supply planning
Decentralized• Short lead times• Special / local / production resources• High degree of tacit knowledge• Intederpendencies amongst production lines within
the site
Centralized• Normal / long lead times• Common production resources• Production rules are clear and well described• Limited interdependencies between lines
All levels integrated in one function• Isolated product groups• Necessity to perform Production Planning
at low level of detail (e.g. in case of campaign planning)
• Unreliable production resources
Benefit: reduces amount of handover moments, hence inefficiencies
Multiple functions• Multi-sourcing production base• Complex supply chain network
• multiple warehouses • high level of intedepencies
Benefit: prevents that planner is driven by short term issues and midterm planning gets no attention
Supply Network Planning
RCCP
Scheduling

43
Closing, tips and tricksClosing

What to do tomorrow?
44
Think cycles and be 100% clear about hand-over process
Don’t try to forecast it all, plan for flexibility to manage
uncertainty in demand & supply
Visualize first, optimize later
Stimulate right behaviorIf you can avoid a hand-over,
avoid the hand-over!
Start scheduling as late as possible

Working for the purpose of documenting…..or the other way around?
45
Testing
• Testing: cover requirements• But: prevent too narrow and functional focus
Formal Documentation as a necessity
• SOP, work instructions• Master data management• Functional and technical design
Vision Booklet
Reference Documentation as enabler
• Quick reference cards• Process vision• Championed behaviours

Key Engineer
Go Live
46
Business Process
Key UserOrganize for Quick Analytics• Forecast results, # orders interfaced, total inventories• Try and find side effects (orders missing, status changing, etc)

Agenda
APS : Getting started and tool selection
The APS Compass : User requirements, design & implementation
Team capabilities & organizational changes
47

Move people with H3-ladder
H3- change ladder
– 7. lead: lead others in the change
– 6. ownership: show commitment and ownership of the change
– 5. execute: experiment
– 4. commit: want to do it, willing to accept consequences.
– 3. believe: convinced “I can do it” and believe the change will be of benefit
– 2. understand: see “what does it mean for me”
– 1. aware: aware of the change through communication of the stakeholder driving the change
– unaware: unaware of the change
1
2
3
4
5
6
7
unaware
aware
understand
believe
ownership
execute
lead
commit
Hands
Heart
Head
48

Ingredients for a successful APS implementation
• Commitment of organizational members to system application usage and new processes
But also
• Organizations are supposed to improve the system as well as the organization process- Clear objective of APS system automation vs different way of working
• Training develop documentation both on new system and new business processes- Sufficient resources, but also expert resources (e.g. key user approach)
• Include data & change management as part of the program
• Step-by-step implementation of modules and network- Scope of the project, starting points, what’s next and how (e.g. different locations)
49

Critical Success Factors
The most important critical success factors: • Top management support• Project team work and composition• Project management • Change management culture and programme
Factors also regularly mentioned are • Communication • Project champion • Business process reengineering
Taking into account at least those seven critical success factors mentioned above should result in less uncertainty, better understanding among employees, and more commitment, and as a result of that lower resistance to change and higher project success rates.
50

Mentimeter session
51

eyeon.nleyeon


