1 or companies willing to invest the time and effort, Six Sigma is a powerful tool in the quest to achieve a significant competitive advantage. A data-driven quality management program developed by Motorola in the 1980s, Six Sigma is aimed at improving performance and driving down defects to almost infinitesimal levels: as low as 3.4 per million. Six Sigma utilizes statistical analysis methods to eliminate variations in service and quality that negatively impact customer satisfaction. When implemented properly, Six Sigma results in enhanced performance, increased customer satisfaction, and improved profitability. Companies that successfully adopt Six Sigma reap dramatic benefits. At Motorola, for example, the company saved an estimated $15 billion in the first 10 years following the launch of the program. Hard-disk manufacturer Seagate Technology achieved a savings of more than $750 million between 1998-2003. Implementing a Six Sigma program is not an easy task, however. Built on an extremely rigid methodology, Six Sigma requires wide-ranging organizational change that can be very disruptive. Six Sigma programs require the collection and analysis of extensive amounts of data; the adoption of consistent, repeatable processes; and the ability to communicate detailed project information across an entire organization. The Microsoft Office Solution Accelerator for Six Sigma was developed to enable companies to achieve the full benefits of a Six Sigma program. Built on the Microsoft Office Enterprise Project Management (EPM) platform, the Office Solution Accelerator for Six Sigma automates and streamlines common Six Sigma tasks while providing comprehensive technology support for Six Sigma management methods. Because the Microsoft Office Solution Accelerator for Six Sigma uses familiar, integrated tools, it can make it dramatically easier to implement Six Sigma. “Companies are adopting Six Sigma because they know it can make them more competitive,” says Microsoft Senior Product Manager Tim Low. “The flip side is that Six Sigma methods are quite burdensome. The Six Sigma Solution Accelerator eliminates a lot of the pain that companies experience when they begin to tackle Six Sigma.” The starting point for Six Sigma is a five-step methodology usually referred to as “DMAIC,” for Define Opportunities, Measure Performance, Analyze Opportunities, Improve Performance, and Control Performance. The Office Solution Accelerator for Six Sigma automatically configures the Microsoft EPM Solution to conform to the requirements of DMAIC methodology, while enabling the people who manage Six Sigma initiatives to take advantage of the rich project management tools that Microsoft EPM provides. In This Issue: 1 The Six Sigma Revolution 4 Pcubed Perspective: It’s all Process...Now Let’s Install a Tool 6 Ask Brian 7 Project Reporting in Excel 10 MPUG-Global Enters US North Central Market: Twin Cities Chapter Launches 11 Customizing Your Microsoft Project Toolbar 13 Adding Information to Your Gantt Charts MPUG-Global sponsored by: The Newsletter of the Official Association for Microsoft ® Project Volume 8, Issue 2–2004 The Project Network Continued on page three The Six Sigma Revolution: Transforming Quality Management with the Microsoft EPM Solution and the Microsoft Office Solution Accelerator for Six Sigma F www.mpug.org This shows the Six Sigma financial information feeding through to the Project Center portfolio view.
Transcript
1
or companies willing to invest the time and effort, Six Sigmais a powerful tool in the quest to achieve a significantcompetitive advantage. A data-driven quality management
program developed by Motorola in the 1980s, Six Sigma is aimedat improving performance and driving down defects to almostinfinitesimal levels: as low as 3.4 per million. Six Sigma utilizesstatistical analysis methods to eliminate variations in service andquality that negatively impact customer satisfaction. Whenimplemented properly, Six Sigma results in enhanced performance,increased customer satisfaction, and improved profitability.
Companies that successfully adopt Six Sigma reap dramaticbenefits. At Motorola, for example, the company saved anestimated $15 billion in the first 10 years following the launch ofthe program. Hard-disk manufacturer Seagate Technologyachieved a savings of more than $750 million between 1998-2003.
Implementing a Six Sigma program is not an easy task, however.Built on an extremely rigid methodology, Six Sigma requireswide-ranging organizational change that can be very disruptive.Six Sigma programs require the collection and analysis ofextensive amounts of data; the adoption of consistent,repeatable processes; and the ability to communicate detailedproject information across an entire organization.
The Microsoft Office Solution Accelerator for Six Sigma wasdeveloped to enable companies to achieve the full benefits of a SixSigma program. Built on the Microsoft Office Enterprise ProjectManagement (EPM) platform, the Office Solution Accelerator forSix Sigma automates and streamlines common Six Sigma taskswhile providing comprehensive technology support for Six Sigmamanagement methods. Because the Microsoft Office SolutionAccelerator for Six Sigma uses familiar, integrated tools, it canmake it dramatically easier to implement Six Sigma.
“Companies are adopting Six Sigma because they know it canmake them more competitive,” says Microsoft Senior ProductManager Tim Low. “The flip side is that Six Sigma methods arequite burdensome. The Six Sigma Solution Acceleratoreliminates a lot of the pain that companies experience when theybegin to tackle Six Sigma.”
The starting point for Six Sigma is a five-step methodologyusually referred to as “DMAIC,” for Define Opportunities,Measure Performance, Analyze Opportunities, ImprovePerformance, and Control Performance. The Office SolutionAccelerator for Six Sigma automatically configures the MicrosoftEPM Solution to conform to the requirements of DMAICmethodology, while enabling the people who manage Six Sigmainitiatives to take advantage of the rich project managementtools that Microsoft EPM provides.
In This Issue:
1 The Six Sigma Revolution
4 Pcubed Perspective: It’s all Process...Now Let’s Install a Tool
6 Ask Brian
7 Project Reporting in Excel
10 MPUG-Global Enters US North CentralMarket: Twin Cities Chapter Launches
11 Customizing Your Microsoft ProjectToolbar
13 Adding Information to Your Gantt Charts
MPUG-Global sponsored by:
The Newsletter of the Official Association for Microsoft® Project Volume 8, Issue 2–2004
The Project Network
Continued on page three
The Six Sigma Revolution:Transforming Quality Management with the Microsoft EPM Solution
and the Microsoft Office Solution Accelerator for Six Sigma
F
www.mpug.org
This shows the Six Sigma financial information feeding through to theProject Center portfolio view.
2
“We at Microsoft recognize MPUG-Global as the officialinternational community supporting Microsoft OfficeProject. We recommend MPUG as a vital resource to anylevel of the Microsoft Office Project user seeking a communityof peers to enhance their experience with this tool.”
Chris Capossela, Corporate Vice PresidentInformation Worker Product Management Group, Microsoft Corporation
he projects that we all work on arevery much constrained by time. Iknow that I would sometimes
prefer there to be a 36-hour day, but thenI’m still not certain I would get everythingdone! Either way, whilst we all know thatprojects can slip, where possible we stickto the timeline and get the job done. Iknow for one, that the newsletter is aproject that must be completed by the due date; otherwise youwouldn’t be enjoying reading this editorial right now!
This issue of the newsletter examines ways to save you time, andensure that you get the best out of Microsoft Project, so at leastthe solution won’t stop you delivering on time – even if otherexternal forces do! The cover article examines Six Sigma andhow it will revolutionise the way that we collect data, ensuringthat it is managed more effectively across the enterprise. IndeedRich Weller and Ken Jamison both examine how to customisethe Microsoft Project toolbar and Gantt Chart respectively,highlighting how to maximise functionality and save time toensure that the solution provides the most importantinformation. Indeed, whilst Microsoft focuses on theeffectiveness of the Six Sigma program within the EPM solution,Dennis Smith looks at how Microsoft Project can work withExcel to ensure that information gathered can be analysedeffectively. Brian Kennemer, as ever, keeps on providing us withpractical tips on the intricacies of the solution – something thatwe can forget when examining the bigger picture. On the theoryside, Pcubed Perspective’s William Raymond looks at theprocesses behind installing Microsoft Project. What’s the pointin implementing the solution if your organisation isn’t ready—again, it wastes time and productivity—and in the projectmanagement world, there should be little tolerance for that!
Time is a precious commodity, and whilst your projects maycome to an end, MPUG-Global just keeps on going…providingwell needed support to those leveraging Microsoft Project. I havebeen with MPUG-Global for more than three of its seven years,however my journey has come to an end and I have made thedecision to leave this fantastic organisation to work in a newindustry. There have been some very memorable moments; Ihave enjoyed the opportunity to work with so many of you ondifferent projects, providing me with a real understanding ofwhat a diverse membership we have with MPUG-Global. Beingbased in London, I have really valued meeting so many of youat PM events throughout the US and Europe, and some of youwho have come to visit us again and again have truly becomefamiliar faces! Thanks to everyone who has made these threeyears as great as they have been!
Editorial content: Articles, case studies, and tips are welcome! Please [email protected]. Entries may be edited for clarity and length.
Advertising: Advertising is open to any authorized Microsoft Office Project Consultantor Service Provider. For a Media Kit, email [email protected].
The Project Network is a quarterly publication dedicated to inform themembership of MPUG-Global. The information published herein is believed to bereliable; however, the editor and other individuals associated with this periodicalassume no responsibility for inaccuracies or omissions. Publication ofadvertisements in this newsletter does not necessarily constitute an endorsementby MPUG-Global. Signed columns are the opinions of their writers and notnecessarily the opinion of the publishers.
To provide MPUG-Global members with a forum to exchangeideas, support, and experience in order to improve understanding
and utilization of Microsoft Office Project.
MPUG-Global is an independent organization formed with thesupport and recognition of Microsoft.
T
Best regards,
Liz Curwen, Editor
3
Typically, creating 4-up slides is a fairly labor intensive manualprocess for Six Sigma Green Belts or Black Belts. With theMicrosoft EPM platform and solution accelerator for Six Sigma,the data collection is automated, and so is the formatting of thatdata to create the slides.”
While Six Sigma adoption is a single company-wide program, itunfolds as an ongoing series of hundreds—or even thousands—of smaller projects. That means the Microsoft EPM Solutionsplays a critical role. With the Office Solution Accelerator for SixSigma, Microsoft EPM automatically provides a single view intoSix Sigma projects across an entire company, giving executivesthe information they need to ensure that Six Sigma efforts alignwith overall corporate goals. The Microsoft EPM Solution alsoprovides the necessary framework for implementing consistentproject management processes across the entire organization.And, in combination with the Office Solution Accelerator for SixSigma, it delivers the analysis tools required for measuring thefinancial impact of Six Sigma projects.
“There’s no doubt that Six Sigma methodology can deliverremarkable results,” says Low. “But until now, the price ofimplementing Six Sigma has been pretty steep. By taking thetools and technologies that make up the Microsoft EPMSolution, plus complementary features from Microsoft Office,and configuring them specifically to meet the needs of Six Sigmausers, Microsoft is making the disruptions inherent in Six Sigmamuch more manageable. That makes the goals of a Six Sigmaprogram much more achievable.”
“The Office Solution Accelerator lets you leverage the entirefeature set of Microsoft EPM in service of Six Sigma, includingtools for resource management and project portfoliomanagement,” says Low. “In addition, the accelerator adds toolssuch as a financial management module that provides a greatframework for the financial project analysis that is a cornerstoneof Six Sigma.”
The Office Solution Accelerator targets three critical areas:information management, data sharing, and data mining andreporting. One of the biggest challenges that companies face inimplementing Six Sigma is the complexity inherent in collectingand managing information from across business units. Becauseit is built on easily integrated Microsoft technologies and tools,the Office Solution Accelerator streamlines the job ofaggregating critical data. And because the Microsoft EPMSolution is designed to work with Microsoft products such asMicrosoft Windows SharePoint Services, Microsoft BizTalkServer, and the Microsoft Office System, it provides thecommunication, collaboration, and connectivity tools needed tooperate easily within an enterprise environment.
In addition, with the Office Solution Accelerator for Six Sigma,many key data mining and reporting tasks are dramaticallystreamlined.
“With the Solution Accelerator for Six Sigma, project, humanresource and financial data can be automatically exported intoMicrosoft PowerPoint,” says Low. “For example, 4-upPowerPoint slides are a standard way to report Six Sigma data.
The Sixth Sigma RevolutionContinued from page one
View inside Project Professional showing custom project guide in a DMAIC project
4
Pcubed (www.pcubed.com) specializes in EPM, server-based solutions, software implementation and technicalsupport. Drawing on vast customer experience andexpertise, Pcubed Perspective provides a blend of strategicand technical content, with a varied look at how MicrosoftProject is being utilized within the marketplace.
Pcubed Perspective
It’s all Process...Now Let’s Install a ToolWilliam Raymond, Microsoft Project MVP, Pcubed (Member, Boston Chapter)
e all say it. We all mean it. But unfortunately, we do notalways live it. Of course I am referring to the idea ofimplementing a software product, like Microsoft
Project, before some very important decisions are made. SinceMicrosoft Project is a fairly easy-to-use software tool, it issometimes considered ‘easy enough’ to install and use right out ofthe box. In some regards this statement is true. However, it is notas easy to know the best way to manage resources, adjust timelines,track earned value, store a baseline and generally manage yourproject from beginning to end. This takes training, practice andpatience. It also requires a working knowledge of how and whyMicrosoft Project calculates your schedule the way it does.
More importantly, if the bulk of your organization is still tryingto decide how to accomplish things like defining budgets,estimating resources and developing business cases, this shouldraise a red flag or two (or three). You might first considerstepping back and taking a look at the foundational groundworkthat needs to be laid to deliver a successful rollout. For example,implement a Project Management (PM) Maturity level studyfirst. Going through this exercise will help you identify not justwhere you want to go with project management, but where youneed to start. For some organizations, Project Managers arehighly trained professionals in that field and are knowledgeablein PM best practices. In other organizations there are pockets ofknowledge and some Project Managers are playing that rolesimply because they are a subject matter expert. Knowing whereyou are on the PM Maturity level will help you get your armsaround a Microsoft Project rollout and make it easier tounderstand where the risk areas are.
If your organization is on the lower spectrum of a PM Maturitylevel, this is a sign that you might want to hold off onimplementing the tool and first put some PM fundamentals inplace through training and mentoring. It is also important todecide what effect the tool will have on your people and whatprocesses need to be defined. By realistically “sizing up” whereyour organization is at, you will get a much better feel for justhow much functionality to rollout within Microsoft Project.
Now, you might have already selected Microsoft Project becauseit is the market leader or maybe you even got it by default withyour Microsoft licensing plan. Well, if you have it and the CD issitting on your desk, why not install it and get going, right?Well, probably not. It is tempting and you will have people thatwant to get started right away, so let’s instead try to figure outhow you can have your cake and eat it too.
As you may have already made up your mind to use MicrosoftProject, consider a pilot that is 50% process and training. The other50% might represent a Microsoft Project Sandbox environment totest ideas and functionality. This “kick the tires” approach will help
your organization get acquainted with the new way projects will bedeveloped and maintained. This method should also help gaininternal traction. Whether we admit it or not, having a repeatable,documented process with a tool that supports it makes our livesmuch easier. Of course, not everyone will admit this, but youknow that is what they are thinking.
This might be obvious, but it is important to remember thatMicrosoft Project is not a one-size-fits-all application. Forexample, your Sandbox testing may highlight a need to integratewith your line of business systems or other custom internalapplications. That is where expert support is needed. I, alongwith my Pcubed colleagues, have experience working withmany companies to expedite surfacing particular needs andhave provided end to end solutions to fill any gaps with acustom or a range of 3rd party tools.
Once you have developed your specific internal project deliverypolicies and a select group of Microsoft Project users have beentrained, consider a phased rollout of the solution. Companiesthat “beta” the product for a period of time tend to be the mostsuccessful in providing a solid architecture and retainingongoing users. This beta period might be for several months andinclude a core team of users that you know will be strongchampions for the product. Since this core team will havealready hit any major roadblocks, it will be natural for them toprovide hands-on mentoring and training to new users of thesystem as they come on board.
With this approach, you should have a successful rollout ofMicrosoft Project with a willing and fully trained usercommunity. With this said, remember to keep in mind thepower of support resources available to you. Most peoplereading this article are already members of MPUG-Global andwill benefit from the ongoing stream of information to continueenhancing your use of the system. Consider encouraging yourcolleagues and clients to join as well, as the more educated andtrained your user community is…the better for all.
In conclusion, walk; don’t run to implement your MicrosoftProject system. And remember to follow these steps for asuccessful rollout of Microsoft Project:
Continued on page five
W
5
1. Make sure you fully understand the audience for the tool andwhat they can handle.
2. Develop a working relationship with the potential users andmake sure you have buy-in and testing built into the process.To get buy-in, ensure you know what your users want out ofMicrosoft Project too.
Continued from page four
*Offer ends on July 31, 2004
3. Work with Microsoft Project while you are developing yourprocesses and methodologies. This will help you identify gapsin the functionality and will provide you with some real-world, hands-on training for your team.
4. Do not try to re-invent the wheel. Pcubed, as an EnterprisePremier Partner, has talented people using configurableprocesses who more than likely have already addressed thebusiness or tool problems you are having.
5. Train, train, train your team in the business processes and thetechnology!
6. Beta test the tool with people that really are excited aboutusing it and want the project to be a success. As more peopleare familiar with the tool, you will have a better internalsupport base. Hopefully, this will foster a team environmentwhere people can call on each other and share experiencesbefore they give up on using the solution.
7. Rollout Microsoft Project after you have addressed the criticalissues found throughout your testing.
7-point Checklist for a SuccessfulMicrosoft Project Rollout
1. Understand your audience2. Get buy-in3. Work with the tool4. Don’t reinvent the wheel5. Train your team!6. Beta test7. Roll-out
6
Ask Brian
Managed Time PeriodsChanging periods is something that you don’t want to do often.Hopefully, you will be able to pick a period “size” and stick withit. However, there will be circumstances when you need tochange the periods “in mid-stream”. The thing to remember isthat you cannot change a period that already has actual work init. So, if a resource has already submitted timesheets in a period,there is nothing you can do – you cannot change that period.However, you will want to plan ahead so that you change thedate ranges for FUTURE periods.
Yes Virginia, Project Really CAN do SpiralDevelopment MethodologiesSeveral years ago I heard someone say that Microsoft Project wasoutdated because it was only suitable for projects that used a socalled “waterfall” scheduling methodology. I heard it again recentlyand was struck again at how inaccurate this statement really is. I’mnot sure if this thinking comes from the need to reject the old andembrace the new trends in the software development business orif it has to do with the zealotry with which people embrace theirfavorite software development methodologies, but it has to stop. Inmy opinion, saying that Microsoft Project (or for that matter any ofthe other scheduling software, such as Primavera, Niku, Artemis)cannot model a spiral or iterative development lifecycle is justbeing intellectually dishonest.
First let’s look at waterfall and spiral methods very briefly. What isa “waterfall” methodology? It is the term given to a lifecycle whereall the design is done before any of the development starts andwhere all the development is done before any of the testing starts.Its Gantt chart looks like a waterfall with each phase joined witha finish-to-start relationship.
What is a spiral or iterative methodology? It is a lifecycle where thedesign, develop, test phases are repeated several times before theend product is complete. There are several different flavors of thismethodology but in general it is characterized by many repeatedsmall cycles of the general phases of a waterfall methodology.Practitioners of this methodology like to describe this visually witha spiral diagram where each phase is repeated as the spiral goes intoward the center (or sometimes out). This visual representationmight be part of the problem where these same people think thatMicrosoft Project cannot model the method.
Both of these methods are valid for different kinds of projects.Just like no one Task Type in Microsoft Project is appropriate forall tasks in a project and no one kind of hammer is best for allkinds of construction; different software developmentmethodologies are appropriate for different kinds of projects. Ifyou have all the requirements you need up front and they will
stay static, then a waterfall methodology is fine. However, if youdo not have all the facts up front or you expect them to changethen a form of spiral development might be best.
Here is the fun part. What do you suppose that nice spiraldiagram would look like if you unrolled it and laid it out acrossa timescale…a waterfall maybe? :-) Yes! It would look like awaterfall remarkably like the one for the waterfall methodology;it is just that this waterfall would have more phases. It wouldhave several design phases, several develop phases – and yeseven several test phases – and then it would have a final testphase at the end. If you can lay it out on a timescale, then youcan model it in Microsoft Project (or any other schedulingapplication). I think it is often the case that people involved insomething new or innovative can get a little carried away withthe whole cool nature of being cutting edge. Don’t get mewrong, I think that many of the “new” methodologies offer somegreat benefits. However, when the “coolness” of your tool getsintoxicating to the point that you stop seeing the benefits ofother things that are different, there is a problem!
In the end, the third design iteration of a spiral project or a“sprint” in a SCRUM project or the Testing Phase in a waterfallproject all have some things in common; they all have a start andfinish date, they all require work to complete, and they all needresources to complete them. No matter how special you make theframework, these are still just tasks that need to be scheduled.
In thinking and talking about this issue with some experts in suchmethodologies, I think the heart of the issue is that most spiral oriterative methods do not lend themselves well to knowing when aproject will be finished. This is because you rarely know how manyspirals you need to do in order to finish the product. Howeverwaterfall methods are best used for projects where all therequirements are known up front, as their schedules are somewhatdeterministic of their finish date. You can lay out all your tasks upfront, and Microsoft Project provides a nice neat path to the Finishdata, which makes managers very happy! However, in an iterativemethod, you might know up front there will be at least fouriterations but the very essence of an iterative method is that duringany iteration you might discover the need for one or moreadditional iterations. This means that the schedule does not showa real model of how the project will look at the end, which makesmanagers very sad!
This sadness highlights another common project in MicrosoftProject: schedules should never be seen as 100% deterministic. Theyshould be seen as the current best guess of what the project does orwill look like. When discussing your project you should say: “withwhat we know right now about the project, the projected finish dateis XXX”. I would recommend you avoid saying “the project willfinish on XXX”. It is easy, when using Microsoft Project to use thelatter wording when talking about finish dates. I think that’s whypractitioners of iterative methods might feel uncomfortable usingMicrosoft Project or any other software, because of their owntendency to see a Gantt chart as deterministic.
The moral of the story is that Project can be used for spiral oriterative methods as long as those doing so are clear on the factthat the schedule should be seen as a model of what youcurrently know about the project, and not deterministic of theactual finish date.
Brian Kennemer is a Microsoft Office Project MVP and ProjectSpecialist for QuantumPM. Along with penning this column,Brian is also the Vice President for the MPUG-Global PugetSound Chapter.
Ask Brian covers topics appearing in the Microsoft Office ProjectSupport Newsgroup, where people with questions aboutMicrosoft Office Project can interact and seek solutions.Members can find this newsgroup and many more in theMembers Only Section, www.mpug.org/members.asp
7
Introduction
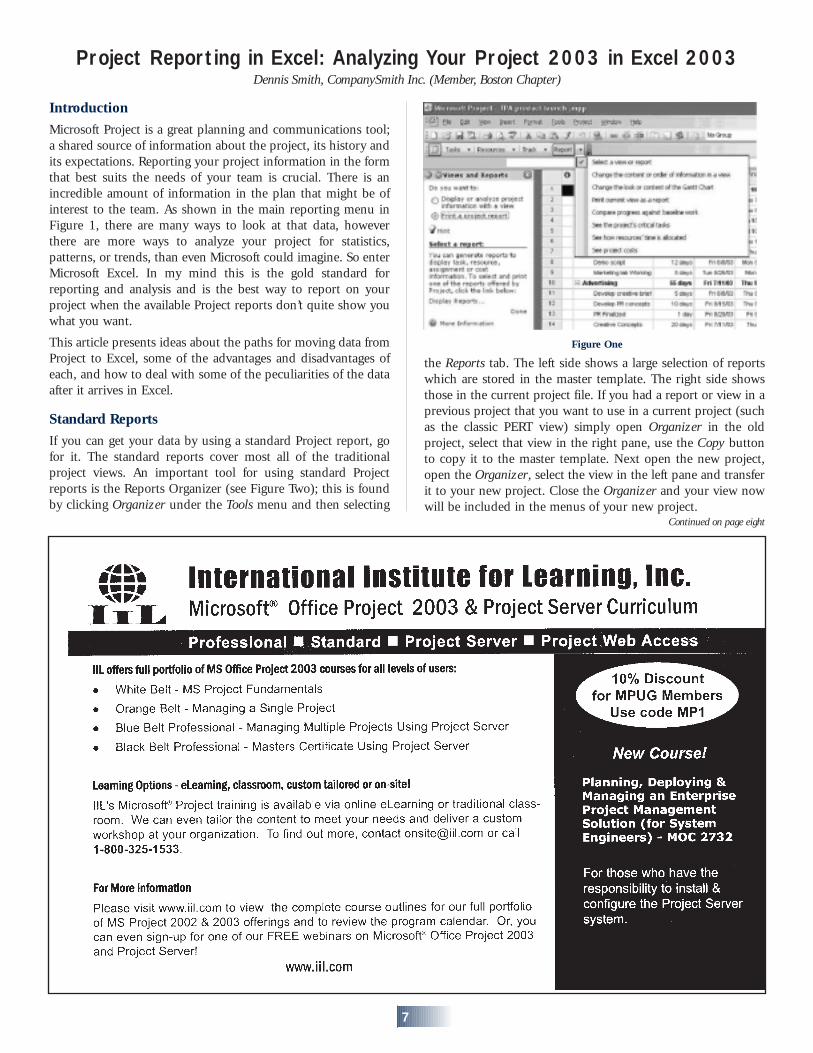
Microsoft Project is a great planning and communications tool;a shared source of information about the project, its history andits expectations. Reporting your project information in the formthat best suits the needs of your team is crucial. There is anincredible amount of information in the plan that might be ofinterest to the team. As shown in the main reporting menu inFigure 1, there are many ways to look at that data, howeverthere are more ways to analyze your project for statistics,patterns, or trends, than even Microsoft could imagine. So enterMicrosoft Excel. In my mind this is the gold standard forreporting and analysis and is the best way to report on yourproject when the available Project reports don’t quite show youwhat you want.
This article presents ideas about the paths for moving data fromProject to Excel, some of the advantages and disadvantages ofeach, and how to deal with some of the peculiarities of the dataafter it arrives in Excel.
Standard Reports
If you can get your data by using a standard Project report, gofor it. The standard reports cover most all of the traditionalproject views. An important tool for using standard Projectreports is the Reports Organizer (see Figure Two); this is foundby clicking Organizer under the Tools menu and then selecting
Continued on page eight
the Reports tab. The left side shows a large selection of reportswhich are stored in the master template. The right side showsthose in the current project file. If you had a report or view in aprevious project that you want to use in a current project (suchas the classic PERT view) simply open Organizer in the oldproject, select that view in the right pane, use the Copy buttonto copy it to the master template. Next open the new project,open the Organizer, select the view in the left pane and transferit to your new project. Close the Organizer and your view nowwill be included in the menus of your new project.
Project Reporting in Excel: Analyzing Your Project 2003 in Excel 2003Dennis Smith, CompanySmith Inc. (Member, Boston Chapter)
Figure One
8
Figure Two
I need to focus on the characteristics of the linkages betweentasks, an area not over by standard reports. To complete thisanalysis, I move the Microsoft Project data to Excel.
Exporting Reports to Excel
I have not found any data in Microsoft Project that cannot beexported. The Microsoft Office Project 2003 export wizardprovides options that allow you to export any subset orgrouping of your project data to meet your needs, and to savethat data collection as a Map for later reuse. To start the wizard,select Save-as under the File menu. As the wizard starts, you canchoose from Access, Excel Workbook, XML, plain text, and a fewother formats. We’ll follow Excel through the Wizard.
The next step in the Wizard is to choose between the ProjectExcel Template and Selected Data. If you choose the ProjectExcel Template and click finish, your Excel file will contain ID,Name, start, finish, predecessors, outline level, and notes. To getthe exact data you want, choose Selected Data.
After you choose Selected Data, the wizard provides you withanother choice whether you want to use an existing map ordefine a new one. The existing maps cover a range of data-setsthat might meet your needs, as shown in Figure Three.
Figure Three
If these standard data export maps meet your need, great! If not,but one is close to what you want in your export, you can startwith one of those maps and modify it to meet your particularneeds. As you continue through the wizard, you have theopportunity to select subsets of the data or to add or delete anydata fields you choose. The screen where you can modify anexisting map is shown in Figure Four.
Figure Four
To make your own, choose New Map instead of using an existingmap. While it might take a few minutes to an hour or moredepending on the complexity of what you want to transfer toExcel, once you have made your own Map using the ExportWizard, you can easily reuse it for this project. You can also usethe Organizer mentioned above to move it to the mastertemplate and then copy it into any of your project files.
When you save the project data file from Microsoft Excel youwill notice that the Excel export format from Project is read byExcel as being in Excel 95 format. When you get that notice,simply tell Excel to save in its normal format by selecting yes asshown in Figure Five.
Figure Five
Copy and Paste
You can also grab any of the tabular data that you can see inMicrosoft Project by highlighting it and using the Copy featureunder the Edit menu. After you Paste the data into Excel, a greatfirst step is to highlight all of the imported columns and then useAutoFit Selection under the Column selection of the Formatmenu. Sometimes using the screen view as a visual reportbuilding tool allows you to be more certain that you have thecorrect data fields and may be faster than using the ExportWizard for a one-time data transfer.
Continued on page nine
Project Reporting in ExcelContinued from page seven
9
Fixing the Formatting in Excel
Once you have the data in Excel, you might want to do anoptional cleanup. A typical export from the Project ExcelTemplate method looks like Figure Six.
The start and finish dates are imported as normal Excel dataformats, so their date format can be changed by selecting the
dates, right-clicking in the selection, and choosing FormatCells… from the pop-up context menu. Next click on Date inthe category selection and choose your date format from theType selection on the right side of the window. Click OK andyour dates are reformatted. Figure Seven shows what it lookslike with an international date format:
Continued on page ten
Continued from page eight
Is your organization EPM seaworthy?
9085 East Mineral CircleSuite 235Centennial, CO 80112
It's a challenge to keep an organization safe and healthy onthe journey to attain strategic goals. Enterprise Project Management (EPM) provides companies with efficient waysto collaborate through managing projects & resources, and providing views into project performance information at different levels across the organization.
Let QuantumPM help you chart your course!As a Microsoft Premier Project Partner, QuantumPM can improve your organizational bottom line through effectiveEPM solutions. We are the most experienced provider of Microsoft Project 2003 hosting services. Our experts have authored articles on project management processes & tools, including Brian Kennemer‘s, “Ask Brian” MPUG series.
Sail your way through QuantumPM‘s Hosted Pilots! Experience the power of the Microsoft EPM solution without incurring the time and investment required for an onsite deployment. Let us host your software for you--all you needis a browser. Contact us about 30-day hosted trials, or visit www.quantumpm.com/hosting.asp.
Figure Six
Figure Seven
Changing the duration into an Excel-friendly format requiresone more step. While this looks like a text field, it is actually anumber field with the character d appended. This makes it easierto use than it first appears.
First you can just use the field as-is for most calculations. If youadd 2 to it (=C4+2) the sum will be correct and the d will carrythrough to the result. If you multiply it by a fixed value (=C4*2)the answer will be correct, however the d will be lost.
10
To change it to a normal number-only format, simply highlightthe numbers, right click, select Format Cells… click on Numberin the category selection, choose your numeric format and click
OK. Figure Eight shows the table without the d, all cleaned upand ready to go.
Please note: The Export Wizard seems to convert all dates intoone unit (e.g. it converts weeks to days) when it exports toExcel, but the copy and paste approach does not make thatconversion. If you use multiple units for durations in yourproject plans and the copy/paste method, your duration columnwill include multiple time units and you will have to edit yourExcel sheet to reconcile the units.
Other Automation
There are many more ways to manipulate your data withinMicrosoft Project to make your work easier after you export.These include using macros and formulas with custom Project
Figure Eight
fields. A great introduction to the power of formulas can befound in Volume 7, Issue 4 of MPUG-Global’s Project Networknewsletter starting on page eight.
Project Reporting in ExcelContinued from page nine
arch 2004 welcomed the launch of the MPUG TwinCities Chapter in Minnesota, USA. The launch meetingwas hosted at the Microsoft North Central District
Office, providing members and guests in that region with anexcellent opportunity to network and further their knowledge ofMicrosoft Project. Tom Moen, Microsoft Productivity TechnicalSpecialist (BPTS), provided the keynote, demonstrating howWindows SharePoint integrates with Microsoft Project. Thepresentation was well received, sparking questions, commentsand lively debate from the nearly 50-strong crowd. In addition,Tim Cermak, MPUG-Global’s Chapter Relations Director,
showcased the association’s value proposition, including an in-depth tour of one of MPUG’s chief member benefits—the“Members Only” content library of the MPUG website.
The Twin Cities launch event facilitated opportunities forMPUG-Global to meet with representatives from both Microsoftand PMI, and gain an understanding of how MPUG-Global canimpact the local marketplace. These discussions provedincredibly valuable for all parties involved, and demonstratedhow important an MPUG presence will be in providing thisvalue-added resource to professionals who leverage MicrosoftProject in their careers and businesses.
MPUG-Global Enters US North Central Market:Twin Cities Chapter Launches
M
Tim Cermak facilitates a networking opportunity for MPUG Chapter Officers and Sponsors. (left to right) Daniel Renier, Twin Cities President & Chapter
Sponsor (Milestone Consulting Group); Tim Cermak; Tom Moen, Microsoft BPTS; Daniel Rohwer, Microsoft BPS, Twin Cities Chapter Sponsor and host of
the launch event; and Stan Berger, Twin Cities Treasurer. (Officers missing are Rich Garlock & Rich Schlegel).
11
ome things I’ll never understand, like why the sky is blueand why my toast always lands butter side down, andwhy a few buttons are not on the standard toolbar within
Microsoft Project! I have taught a number of classes focusing onthe basics of Microsoft Project, and even before I enter the firsttask, I always show my students how to add buttons to theirtoolbar. These buttons make updating your schedule moreefficient and prove to be a lot less time consuming. I’ll bet overthe course of my project management career, these buttons havemanaged to save me a few very precious hours of time!
Follow these instructions to insert the buttons:
1. Open Microsoft Project
2. Click on View, Toolbars, then Customize
3. Click on the Commands Tab
4. Now click on the Edit Command
5. The first option to add is the Delete Row button
6. Simply scroll down and click on Delete Row. Now drag it upand place it wherever you would like on your standard tool bar.(See Figure One).
Customizing Your Microsoft Project ToolbarBy Rich Weller, Pcubed (R.E.P. Officer, Southeast Michigan Chapter)
Continued on page twelve
S
Figure OneNote: The screenshots used are from Microsoft Project 2003,
but will work as a guide for any version.
12
7. Now scroll down and click on Hide Column.
8. Drag it up to your toolbar. (See Figure Two)
Figure Two
Customizing Your Microsoft Project ToolbarContinued from page eleven
Newsletter Authors Wanted!Do you have a Microsoft Project case study, tip or trick toshare with your fellow MPUG-Global members? We arealways looking for informative articles that showcase yourinsight and expertise. If you have an idea or an article that youwould like to submit, please email [email protected].
Now that you have a feel for this process, here is the entire listof buttons that I recommend you add:
Under Edit• Delete Row• Hide Column
Under Insert• Insert Task• Column (Inserts Column)
Under Format• Font (Quickly change font style and color)
I promise these five buttons will speed your work tremendously.There are a lot of other buttons you can use, so feel free to addthose that you need to use on a regular basis.
13
Continued on page fourteen
Adding Information to Your Gantt ChartsKen Jamison, Applied Project Management (President, Western New York Chapter)
Introduction
If you use the Gantt Chart View to schedule tasks, you are notalone – it is probably the most used view type. The fact theGantt Chart is the default view has a lot to do with this, but it isalso because most users of Microsoft Project use this viewprimarily to schedule tasks. If you use the Gantt Chart to createschedules and not just to display them, you may want it to havesome characteristics of the Network Diagram. For example youmay want it to display more fields around the bars, or perhapsconditionally display fields based on the task’s data. One way todo this is to put combinations of fields into a custom text fieldand display the custom text field in the chart area with the bars.Positioning data values with corresponding symbols in the chartarea helps the project manager to visualize the relative nature ofthe data in the plan. It also helps to find situations whererequirements finish after design, or testing finishes beforedevelopment ends, and also highlights which minor tasks maysuddenly appear critical. Adding data to the graphic display isuseful, allowing any anomaly to be seen immediately. Any datathat you display in the chart area can also be put into a table.The disadvantage of using a table is that it can be difficult tomanage with a lot of columns, and the data is also not inimmediate proximity to the bar. Using a table tends to drive youto scroll left and right frequently or add horizontal gridlines andas a consequence smear the screen with finger prints! In thisarticle I will look at some examples about how to addinformation to your Gantt Charts.
How much Total Slack and Free Slack is there?
If you have ever manually leveled resources or shortened aschedule, you will know that slack is a critical measure of howmuch time is either available for optimizing or lacking in aproject. When looking at slack, knowing that the bar is blue orred is not all that helpful. However, it is very important to knowby how much it is blue or red. Something that I have founduseful is to combine Total and Free Slack into a text field andplot it to the right side of the Gantt bars and then plot theirvalues as different colored lines drawn underneath.
To combine the two fields, select a text field and define it for thatpurpose (see Figure 1).
Figure 1
1. Select menu options Tools, Customize, Fields…2. Select Text as the field Type3. Select one of the Text1-30 fields and rename it
To add the formula (see Figure 2):
4. Select the Formula… button, select the Field button, selectDuration and then Total Slack5. To identify what the number is, add the prefix T= and thesuffix d6. Add a comma and space between the two fields7. Add the Free Slack field by selecting the Field button, selectDuration and then Free Slack8. Add the prefix F= and the suffix d
Figure 2
Microsoft Project calculates durations in minutes, which meansthis formula will format that raw number. To plot the values indays, divide each number by the minutes per day (see Figure 3): 1. Add a forward slash “/” after each field name 2. Select the Field button3. Select Project, Number, and Minutes per Day
Figure 3
If you do not want all the decimals that the division operation canproduce, format the number (see Figure 4).1. Place the cursor directly in front of [Total Slack]2. Select the Function button3. Select Text and then Format4. Replace the word “expression” with [Total Slack]/[Minutes Per Day]
14
5. Replace the word format with “0.0”6. Delete the rest of the function up to the closing parenthesis7. Do the same for Free Slack
Figure 4
To decrease interference with dependency lines, add a couple ofspaces at the beginning of the formula in front of the “T”. Yourformula should look like the one below (see Figure 5).
Figure 5
Add Total Slack and Free Slack bars to the chart (see Figure 6).
Figure 6
Add the text field to the non-critical tasks (see Figure 7).
Figure 7
The resulting view is Figure 8 below.
Figure 8Continued on page fifteen
Adding Information to Your Gantt ChartsContinued from page thirteen
15
This is a reasonably simple example; in previous issues of thisnewsletter we have seen how custom fields can calculate databased on conditions of data. In this case, displaying Free Slackfor critical tasks does not add anything, because it is always “0”.However, Total Slack is meaningful for critical tasks, butdisplaying it as a bar on the finishing end of a task is not veryuseful. If we display Total Slack at the starting end and draw abar to the Late Start date, this will show how late a task isstarting (with respect to its constraints), when a particularsituation occurs. To use only one custom field for this purpose,it needs to display only the Total Slack field when a task iscritical. That requires a conditional statement in the formula.The formula as it is now should apply only when the task is not
Continued from page fourteen
Figure 10
Figure 9
Figure 11
critical; this can be identified when the field Critical is not true,displaying as “No” in a table. To ensure that the Total Slack isshown when the task is critical, add the if function (see Figure 9).
In addition, we need to add a bar for the negative slack, shownin the bar styles table (see Figure 10).
The new resulting view is shown in Figure 11 below.
You can probably think of a number of ways to apply thistechnique to your needs. It may not take much of a formula todisplay just the data you need to see; it’s really up to you tochange the information to ensure that the views are relevant toyou and your project.
ä Thought Leader – Shaping the future ofprogram management using MS Project technologyand our 6D methodology
ä Focused – Dedicated exclusively to programand project management having delivered over2,200 programs since our founding
ä Assurance – Providing professionalism andassurance to Global 500 firms around the world,with unparalleled experience and endorsements fordelivering the largest and most complex programs
ä Adoption – Exclusive processes, methods,and ways of working, combined with experience inlarge organizations provides the highest levels ofadoption and long-term success of implementations
Call 1-877-PCUBED1 today to find out howPcubed’s global team of professionals can takeyour complex programs to the next level!
www.pcubed.com
inte
chprinting
inte
chprinting
3923 Ranchero Drive • Ann Arbor, MI 48108 • USA
®
MPUG-Global is Affiliated with:
Microsoft® Office Project Solution Provider
MPUG-GlobalMembership:
INDIVIDUAL – For a single named member (U.S. $99 peryear)
TEAM 5 – Allows up to five named members from a singleorganization, at a 10% savings (U.S. $450 per year)
TEAM 10 – Allows up to ten named members from asingle organization, at a 20% savings (U.S. $799 peryear)
PMI MEMBERS – For a single named user of MicrosoftProject who is currently a member of PMI (ProjectManagement Institute). Proof of current membership mustbe provided. (U.S. $79 per year)
STUDENT – For a single named member who is currentlya full-time student at an accredited institution. Proof ofcurrent enrollment must be provided (U.S. $50 per year)
Corporate Volume Rates are available.Please contact MPUG-Global for details,
Member Benefits:• A Subscription to The Project Network – MPUG-
Global’s quarterly newsletter
• Monthly Ezine containing the latest Microsoft OfficeProject tips and news
• “Members Only” website – contains Microsoft OfficeProject Resource Centers containing all versions,Microsoft Technical library, chapter presentations andother files
• Regional Meetings where Chapters have beenEstablished
• PDUs through PMI R.E.P. Program – participating inMPUG-Global activities earns credits towards PMI PMPcertification
• “Members Only” Special Offers such as beta testing,trial software, and invitations to Microsoft events includingWeb casts and the annual Project Technical Briefing onMicrosoft’s Redmond campus.
• Networking/Knowledge Sharing – Leverage opportunitiesto meet with members and experts in the field


![IT331 Network Development Capstone Project [Onsite]thespringergroup.yolasite.com/resources/IT331_Appendix_A.pdf · Network Development Capstone Project Appendix A—Capstone Project](https://static.documents.pub/doc/80x56/5aa073e07f8b9a62178e2123/it331-network-development-capstone-project-onsite-development-capstone-project.jpg)


