energies Review The Prospective Non-Conventional Alternate and Renewable Energy Sources in Pakistan—A Focus on Biomass Energy for Power Generation, Transportation, and Industrial Fuel Wajahat Ullah Khan Tareen 1,2, *, Zuha Anjum 1 , Nabila Yasin 1 , Leenah Siddiqui 1 , Ifzana Farhat 1 , Suheel Abdullah Malik 1 , Saad Mekhilef 2 , Mehdi Seyedmahmoudian 3 , Ben Horan 4 , Mohamed Darwish 5 , Muhammad Aamir 6 and Leong Wen Chek 2 1 Department of Electrical Engineering, International Islamic University, Islamabad 44000, Pakistan; [email protected] (Z.A.); [email protected] (N.Y.); [email protected] (L.S.); [email protected] (I.F.); [email protected] (S.A.M.) 2 Power Electronics and Renewable Energy Research Laboratory (PEARL), Department of Electrical Engineering, University of Malaya, Kuala Lumpur 50603, Malaysia; [email protected] (S.M.); [email protected] (L.W.C.) 3 School of Software and Electrical Engineering, Swinburne University of Technology, Melbourne, VIC 3122, Australia; [email protected]4 School of Engineering, Deakin University, Waurn Ponds, VIC 3216, Australia; [email protected]5 Electronic and Computer Engineering, Brunel University London, Uxbridge UB8 3PH, UK; [email protected]6 Department of Electrical Engineering, Bahria University, Islamabad 44000, Pakistan; [email protected]* Correspondence: [email protected]; Tel.: +92-332-574-4848 Received: 19 August 2018; Accepted: 5 September 2018; Published: 13 September 2018 Abstract: Pakistan is experiencing an undersupply of electricity, causing load shedding several hours per day due to the adherence to conventional energy resources having quantitative and environmental limitations. Fossil fuels generate more than half of the country’s total electricity, but they will ultimately run out due to their limited supply. Their combustion emits greenhouse gases, posing environmental threats. Since the world is tending toward efficient and sustainable alternative methods for harvesting energy from nature, Pakistan has also been investigating an elevated deployment of renewable energy projects. This paper presents a critical analysis of the present energy sector of Pakistan along with global scenarios. Pakistan relies on mainly thermal, hydro, and nuclear energy for power generation. National solar, wind, geothermal, and biomass resources have not been extensively explored and implemented. This paper provides an insight into the potential of these resources in Pakistan to generate electricity for the national grid on a large scale. It focuses on biomass energy, which can be harnessed from bagasse, poultry waste, and municipal waste for power production, and biomass-based fuel for industries and transportation. It concludes that biomass is the most sustainable, available, implementable, and environment-friendly resource that can be utilized to lessen the energy demand and supply gap in Pakistan. Keywords: electricity generation; energy crisis; renewable energy sources; transportation; biomass energy; biofuels Energies 2018, 11, 2431; doi:10.3390/en11092431 www.mdpi.com/journal/energies
Transcript
energies
Review
The Prospective Non-Conventional Alternate andRenewable Energy Sources in Pakistan—A Focus onBiomass Energy for Power Generation,Transportation, and Industrial Fuel
Wajahat Ullah Khan Tareen 1,2,*, Zuha Anjum 1, Nabila Yasin 1, Leenah Siddiqui 1,Ifzana Farhat 1, Suheel Abdullah Malik 1, Saad Mekhilef 2 , Mehdi Seyedmahmoudian 3,Ben Horan 4 , Mohamed Darwish 5, Muhammad Aamir 6 and Leong Wen Chek 2
2 Power Electronics and Renewable Energy Research Laboratory (PEARL), Department of ElectricalEngineering, University of Malaya, Kuala Lumpur 50603, Malaysia; [email protected] (S.M.);[email protected] (L.W.C.)
3 School of Software and Electrical Engineering, Swinburne University of Technology, Melbourne, VIC 3122,Australia; [email protected]
4 School of Engineering, Deakin University, Waurn Ponds, VIC 3216, Australia; [email protected] Electronic and Computer Engineering, Brunel University London, Uxbridge UB8 3PH, UK;
[email protected] Department of Electrical Engineering, Bahria University, Islamabad 44000, Pakistan;
Received: 19 August 2018; Accepted: 5 September 2018; Published: 13 September 2018�����������������
Abstract: Pakistan is experiencing an undersupply of electricity, causing load shedding severalhours per day due to the adherence to conventional energy resources having quantitative andenvironmental limitations. Fossil fuels generate more than half of the country’s total electricity,but they will ultimately run out due to their limited supply. Their combustion emits greenhousegases, posing environmental threats. Since the world is tending toward efficient and sustainablealternative methods for harvesting energy from nature, Pakistan has also been investigating anelevated deployment of renewable energy projects. This paper presents a critical analysis of thepresent energy sector of Pakistan along with global scenarios. Pakistan relies on mainly thermal,hydro, and nuclear energy for power generation. National solar, wind, geothermal, and biomassresources have not been extensively explored and implemented. This paper provides an insight intothe potential of these resources in Pakistan to generate electricity for the national grid on a large scale.It focuses on biomass energy, which can be harnessed from bagasse, poultry waste, and municipalwaste for power production, and biomass-based fuel for industries and transportation. It concludesthat biomass is the most sustainable, available, implementable, and environment-friendly resourcethat can be utilized to lessen the energy demand and supply gap in Pakistan.
Keywords: electricity generation; energy crisis; renewable energy sources; transportation; biomassenergy; biofuels
A country’s human and socioeconomic progress is broadly dependent on its energy potential,which can be expressed simply in terms of its energy contribution per capita [1]. There has been asignificant growth in the global population and a rise in living standards that account for a raiseddemand of power and energy, especially in the developing countries [2]. As the energy demand isrising, the energy prices have also been increasing, which along with the recent geopolitical events,has drawn the world’s attention toward the vital role played by affordable and sustainable energy ineconomic growth and human development [3].
Figure 1 shows an increase in the energy resources demand up to the year 2030. It can be observedthat even though the energy demand using coal, oil, and gas has significantly increased, there will be asubstantial rise in the use of renewable energy sources. In 2007, the world electrical energy productionwas 16,429 Terawatt-hour (TWh), and its projected consumption in 2030 is 28,930 TWh i.e., a 49%increase in the global energy demand and 87% rise in world electricity generation is expected [4,5].
Energies 2018, 11, x FOR PEER REVIEW 2 of 53
1. Introduction
A country’s human and socioeconomic progress is broadly dependent on its energy potential, which can be expressed simply in terms of its energy contribution per capita [1].There has been a significant growth in the global population and a rise in living standards that account for a raised demand of power and energy, especially in the developing countries [2]. As the energy demand is rising, the energy prices have also been increasing, which along with the recent geopolitical events, has drawn the world’s attention toward the vital role played by affordable and sustainable energy in economic growth and human development [3].
Figure 1 shows an increase in the energy resources demand up to the year 2030. It can be observed that even though the energy demand using coal, oil, and gas has significantly increased, there will be a substantial rise in the use of renewable energy sources. In 2007, the world electrical energy production was 16,429 Terawatt-hour (TWh), and its projected consumption in 2030 is 28,930 TWh i.e., a 49% increase in the global energy demand and 87% rise in world electricity generation is expected [4,5].
Figure 1. Increase in demand of energy resources.
The International Energy Agency (IEA) reports the improvement of the overall provision of energy from primary sources to 12,717 million tons of oil equivalent (mtoe) in 2010, which was up from 6107 MTOE in 1973, and includes oil, coal, natural gas, biofuels, nuclear, hydro, and various other resources with contributions of 32.4%, 27.3%, 21.4%, 10%, 5.7%, 2.3%, and 0.9%, respectively [6]. Group of Eight (G8) leaders met the heads of major developing countries and international organizations in 2005 and 2006, to work together with the IEA regarding clean and prosperous alternate scenarios of obtaining energy in future [3].
Figure 2 shows the projected electricity demand and supply from 2016 to 2020. It is expected that by 2020, the world will be able to bridge the energy and supply gap, and will also have a surplus power of 3491 megawatts (MW). Rapid decline in the worldwide fossil fuel resources and their impulsively instable costs have posed damage to the world’s economy. The climate of the planet is affected by their abuse, causing an amplified degree of pollution, damage to the ozone layer, and extraordinary variations in the earth’s climate. The inimitability of fossil fuels in the current energy scenario and their value to future generations is also certain [7]. Table 1 shows the energy situation using renewable resources by 2040. The European Renewable Energy Council (EREC) projected in 2006 that by 2040, 50% of the world’s energy will come from renewables [8].
0
200
400
600
800
1000
1200
1400
1600
1800
1980-2004 2004-2030
Coal Oil Gas Nuclear Hydro Biomass Other Renewables
Figure 1. Increase in demand of energy resources.
The International Energy Agency (IEA) reports the improvement of the overall provision ofenergy from primary sources to 12,717 million tons of oil equivalent (mtoe) in 2010, which was upfrom 6107 MTOE in 1973, and includes oil, coal, natural gas, biofuels, nuclear, hydro, and various otherresources with contributions of 32.4%, 27.3%, 21.4%, 10%, 5.7%, 2.3%, and 0.9%, respectively [6]. Groupof Eight (G8) leaders met the heads of major developing countries and international organizations in2005 and 2006, to work together with the IEA regarding clean and prosperous alternate scenarios ofobtaining energy in future [3].
Figure 2 shows the projected electricity demand and supply from 2016 to 2020. It is expected thatby 2020, the world will be able to bridge the energy and supply gap, and will also have a surplus powerof 3491 megawatts (MW). Rapid decline in the worldwide fossil fuel resources and their impulsivelyinstable costs have posed damage to the world’s economy. The climate of the planet is affected bytheir abuse, causing an amplified degree of pollution, damage to the ozone layer, and extraordinaryvariations in the earth’s climate. The inimitability of fossil fuels in the current energy scenario andtheir value to future generations is also certain [7]. Table 1 shows the energy situation using renewableresources by 2040. The European Renewable Energy Council (EREC) projected in 2006 that by 2040,50% of the world’s energy will come from renewables [8].
Energies 2018, 11, 2431 3 of 49Energies 2018, 11, x FOR PEER REVIEW 3 of 53
Figure 2. Projected electricity demand and supply for 2016–2020.
Pakistan ranks sixth in the world’s most populous countries with 173.51 million people, and by 2050, it is predicted to be number four. At present, Pakistan has daunting problems regarding inadequate installed capacity, revenue shortage, and circular debt for energy production [9]. The energy sector majorly relies on conventional resources such as coal, oil, and natural gas. Due to increase in their demand, the country is facing a shortfall of these natural resources. Their use releases greenhouse gases, rendering them unfit for the environment. The deviations caused by man’s actions in nature and the nature’s response to these actions have greatly affected the environment of our planet in the last decades [10,11]. People around the globe are becoming aware of the finiteness of the natural resources and the threat to future generations due to their non-conservation [12]. The oil reserves of the world are located in regions of political and ethnic conflicts that are challenging to solve in a short time span [13]. Also, the fluctuation in furnace oil prices and the per-unit cost of electricity, along with the inflation rate, have adversely pressurized the national economy [14].
Table 1. Global renewable energy scenario for 2040.
Sources Category 2001 2010 2020 2030 2040
Total consumption (mtoe) 10,038 10,549 11,425 12,352 13,310
Biomass 1080 1313 1791 2483 3271
Large hydro 22.7 266 309 341 358
Geothermal 43.2 86 186 333 493
Small hydro 9.5 19 49 106 189
Wind 4.7 44 266 542 688
Solar thermal 4.1 15 66 244 480
Photovoltaic 0.2 2 24 221 784
Solar thermal electricity 0.1 0.4 3 16 68
Marine (tidal/wave/ocean) 0.05 0.1 0.4 3 20
Total renewable energy sources 1365.5 1745.5 2694.4 4289 6351
Renewable energy sources contribution (%) 13.6 16.6 23.6 34.7 47.7
The rift of 5201 MW (range 3000–6000 MW) in the demand and supply of power and energy, as of 2015, caused a daily power cut of 14–18 h. Even after some progress in the energy sector, the
-10000
-5000
0
5000
10000
15000
20000
25000
30000
35000
2016 2017 2018 2019 2020
MW
Year
Supply Demand Deficit/Surplus
Figure 2. Projected electricity demand and supply for 2016–2020.
Pakistan ranks sixth in the world’s most populous countries with 173.51 million people, andby 2050, it is predicted to be number four. At present, Pakistan has daunting problems regardinginadequate installed capacity, revenue shortage, and circular debt for energy production [9]. The energysector majorly relies on conventional resources such as coal, oil, and natural gas. Due to increase intheir demand, the country is facing a shortfall of these natural resources. Their use releases greenhousegases, rendering them unfit for the environment. The deviations caused by man’s actions in nature andthe nature’s response to these actions have greatly affected the environment of our planet in the lastdecades [10,11]. People around the globe are becoming aware of the finiteness of the natural resourcesand the threat to future generations due to their non-conservation [12]. The oil reserves of the worldare located in regions of political and ethnic conflicts that are challenging to solve in a short timespan [13]. Also, the fluctuation in furnace oil prices and the per-unit cost of electricity, along with theinflation rate, have adversely pressurized the national economy [14].
Table 1. Global renewable energy scenario for 2040.
Total renewable energy sources 1365.5 1745.5 2694.4 4289 6351Renewable energy sources contribution (%) 13.6 16.6 23.6 34.7 47.7
The rift of 5201 MW (range 3000–6000 MW) in the demand and supply of power and energy,as of 2015, caused a daily power cut of 14–18 h. Even after some progress in the energy sector, thecountry still faces some deficit. The use of renewable energy resources will not only put an end tothe deficit, but surplus energy will be available in coming years, as predicted in Figure 2 [15]. So,it is necessary to adopt renewable resources, considering their superabundance, sustainability, nativeavailability, and environment safety [16]. Earth has a plentiful amount of the resources that are neededfor the successful development of solar, hydraulic, wind, geothermal, and biomass-based projects,
Energies 2018, 11, 2431 4 of 49
enabling a diversity in the country’s energy mix [17]. Pakistan’s current energy fuel mix based oninstalled capacity is shown in Figure 3. As of 2017, depending upon the sources, the fuel mix isdivided into two categories, i.e., carbon-based and carbon-free, in which 65% of the current fuel mix iscarbon-based, while 35% is carbon-free. Renewable energy has a share of only 3%. Natural gas has ashare of 41% in the fuel mix and 10,332 MW capacity and oil has a share of 24% with 6137 MW capacity;these are the carbon-based fuels. Hydro energy has a share of 28% in the fuel mix and 7116 MWcapacity, nuclear has a share of 3% with 787 MW capacity, and renewables have a share of 3% with852 MW capacity; these are the carbon-free fuels. The vision by 2025 is to decrease the percentageof carbon-based fuels to 62%, so that the usage of clean energy sources may rise to 38% such thathydro, nuclear and renewable energy sources will have 27%, 7%, and 5% shares in the fuel mix and13,142 MW, 3667 MW, and 2339 MW capacities, respectively [8,18].
Energies 2018, 11, x FOR PEER REVIEW 4 of 53
country still faces some deficit. The use of renewable energy resources will not only put an end to the deficit, but surplus energy will be available in coming years, as predicted in Figure 2 [15]. So, it is necessary to adopt renewable resources, considering their superabundance, sustainability, native availability, and environment safety [16]. Earth has a plentiful amount of the resources that are needed for the successful development of solar, hydraulic, wind, geothermal, and biomass-based projects, enabling a diversity in the country’s energy mix [17]. Pakistan’s current energy fuel mix based on installed capacity is shown in Figure 3. As of 2017, depending upon the sources, the fuel mix is divided into two categories, i.e., carbon-based and carbon-free, in which 65% of the current fuel mix is carbon-based, while 35% is carbon-free. Renewable energy has a share of only 3%. Natural gas has a share of 41% in the fuel mix and 10,332 MW capacity and oil has a share of 24% with 6137 MW capacity; these are the carbon-based fuels. Hydro energy has a share of 28% in the fuel mix and 7116 MW capacity, nuclear has a share of 3% with 787 MW capacity, and renewables have a share of 3% with 852 MW capacity; these are the carbon-free fuels. The vision by 2025 is to decrease the percentage of carbon-based fuels to 62%, so that the usage of clean energy sources may rise to 38% such that hydro, nuclear and renewable energy sources will have 27%, 7%, and 5% shares in the fuel mix and 13,142 MW, 3667 MW, and 2339 MW capacities, respectively [8,18].
Figure 3. Pakistan’s energy fuel mix (2017–2025).
Wind energy serves as a renewable clean energy source with a vast capacity of 346 gigawatts (GW). Pakistan has 120 GW viable, particularly in the coastal lines of Sindh and Balochistan provinces, the velocity of wind being 4–9 ms−1 and 12.5 ms−1 at 10 m and 50 m height, respectively [15].
Pakistan has 300 sun shining days because of its geolocation, creating a mean temperature per annum of 26–28 °C and 1900–2200 kWh/m3 per annum global radiation, providing a solar potential of 2,900,000 MW. In total, 18 photovoltaic systems with 440 kW installed capacity are running in Pakistan. The solar energy share of the country is rising continuously. Yet, in order to decrease the power cut duration, incredible measures are still required. In northern areas, Pakistan can also use its geothermal resources, but unfortunately, no effort has been done to utilize them, due to a lack of investment and manpower [19].
Biomass can serve as another versatile renewable energy resource to bridge the energy supply and demand gap of the world in various energy applications such as electricity, transport, and buildings [20]. It has a 14% share in the total 18% of the world’s renewable energy share. Raw material for biomass can be obtained from agricultural and forest leavings, industrial and municipal leftovers, and waste materials. Pakistan, as an agricultural country, holds a great capability to harvest energy
Carbon Based,
65%
Clean, 35%
Natural Gas, 41%
Oil, 24%
Hydro, 28%
Renewa… Nucle…
10332MW
5137 MW
7115MW
852MW
787MW
2017 Carbon Based,
62%
Clean,38%
RLNG/NG, 31%
Coal, 18%Oil, 12%
Hydro, 27%
Nuclear, 7%
Renewable
5% 15582MW
9060 MW6137MW
13142MW
3667MW
2339MW
2025
Figure 3. Pakistan’s energy fuel mix (2017–2025).
Wind energy serves as a renewable clean energy source with a vast capacity of 346 gigawatts(GW). Pakistan has 120 GW viable, particularly in the coastal lines of Sindh and Balochistan provinces,the velocity of wind being 4–9 ms−1 and 12.5 ms−1 at 10 m and 50 m height, respectively [15].
Pakistan has 300 sun shining days because of its geolocation, creating a mean temperature perannum of 26–28 ◦C and 1900–2200 kWh/m3 per annum global radiation, providing a solar potential of2,900,000 MW. In total, 18 photovoltaic systems with 440 kW installed capacity are running in Pakistan.The solar energy share of the country is rising continuously. Yet, in order to decrease the power cutduration, incredible measures are still required. In northern areas, Pakistan can also use its geothermalresources, but unfortunately, no effort has been done to utilize them, due to a lack of investment andmanpower [19].
Biomass can serve as another versatile renewable energy resource to bridge the energy supply anddemand gap of the world in various energy applications such as electricity, transport, and buildings [20].It has a 14% share in the total 18% of the world’s renewable energy share. Raw material for biomasscan be obtained from agricultural and forest leavings, industrial and municipal leftovers, and wastematerials. Pakistan, as an agricultural country, holds a great capability to harvest energy from biomasscomprising of waste that comes from crops such as wheat, rice, and sugarcane. Established poultryand livestock industries also leave behind excessive poultry and livestock ordure, which being organicin nature, can be processed to retrieve energy. A fresh study of the World Bank states a potential of4000–6000 MW power generation using biomass. The Punjab government has projected a potential of
Energies 2018, 11, 2431 5 of 49
1500 MW of power generation through biomass that is used as fuel and 1000 MW of power throughsolid waste. It has been observed that the waste heat from the cement and chemical industries canbe used to generate electricity that can be sold to the grid. Between 200–400 MW of electricity can beproduced by waste heat recovery, according to recent estimates by the 2016 state of industry report [21].
The 2010–2035 global policies suggest an urgent imposition for bioenergy, excluding traditionalbiomass, with a required 3.3% annual increase i.e., 526 MTOE (2010) to 1200 MTOE (2035). However,by 2035, bioenergy will hold a greater share in the power sector, as mentioned in Figure 4 [22]. Biomassis an exclusive form of source of green and clean energy; it is also abundantly instituted in nature andcan be produced easily both in urban and rural environs [23,24]. Biomass resources are segmented inthree classes, as shown in Table 2 [25,26].
Energies 2018, 11, x FOR PEER REVIEW 5 of 53
from biomass comprising of waste that comes from crops such as wheat, rice, and sugarcane. Established poultry and livestock industries also leave behind excessive poultry and livestock ordure, which being organic in nature, can be processed to retrieve energy. A fresh study of the World Bank states a potential of 4000–6000 MW power generation using biomass. The Punjab government has projected a potential of 1500 MW of power generation through biomass that is used as fuel and 1000 MW of power through solid waste. It has been observed that the waste heat from the cement and chemical industries can be used to generate electricity that can be sold to the grid. Between 200–400 MW of electricity can be produced by waste heat recovery, according to recent estimates by the 2016 state of industry report [21].
The 2010–2035 global policies suggest an urgent imposition for bioenergy, excluding traditional biomass, with a required 3.3% annual increase i.e., 526 MTOE (2010) to 1200 MTOE (2035). However, by 2035, bioenergy will hold a greater share in the power sector, as mentioned in Figure 4 [22]. Biomass is an exclusive form of source of green and clean energy; it is also abundantly instituted in nature and can be produced easily both in urban and rural environs [23,24]. Biomass resources are segmented in three classes, as shown in Table 2 [25,26].
Figure 4. World bioenergy use by sector and use of traditional biomass in the new policy scenario (2010–2035).
Table 2. Biomass sources.
Biomass Source Types
Wastes Agricultural production wastes, crop residues,
Forest products Wood, trees, shrubs and wood residues, logging residues, sawdust and bark from forest clearing.
Energy crops
Starch crops (corn, wheat, and barley), sugar crops (cane and beet), oilseed crops (soybean, sunflower, and
safflower), short rotation woody crops, herbaceous woody crops and grasses.
The advantage of obtaining energy from biomass resources is that the output is closed to the installed capacity, unlike other renewable resources [27], which can be witnessed in Figure 5. Furthermore, the production of thermal energy using biomass has less effects on the environment.
58%15%
9%
5%7%
6%
2010/1227 MTOE
Industry
Power
Transport
Buildings
Other
TraditionalBiomass
37%
16%
22%
11%
8%6%
2035/1881 MTOE
Figure 4. World bioenergy use by sector and use of traditional biomass in the new policyscenario (2010–2035).
Table 2. Biomass sources.
Biomass Source Types
WastesAgricultural production wastes, crop residues, agricultural
Forest products Wood, trees, shrubs and wood residues, logging residues,sawdust and bark from forest clearing.
Energy cropsStarch crops (corn, wheat, and barley), sugar crops (cane andbeet), oilseed crops (soybean, sunflower, and safflower), shortrotation woody crops, herbaceous woody crops and grasses.
The advantage of obtaining energy from biomass resources is that the output is closed tothe installed capacity, unlike other renewable resources [27], which can be witnessed in Figure 5.Furthermore, the production of thermal energy using biomass has less effects on the environment.Thus, energy harnessed from biomass resources is popular development in Pakistan as comparedto other systems of renewable energies [28]. In early days, different biomass such as leaves, wood,and excrement have been used as energy resource in daily life. Despite the overriding of biomass byfossil fuels in both urban and rural regions since the industrial revolution, biomass is slowly becomingreaccepted as an energy supply at the industrial scale [29].
Energies 2018, 11, 2431 6 of 49
Energies 2018, 11, x FOR PEER REVIEW 6 of 53
Thus, energy harnessed from biomass resources is popular development in Pakistan as compared to other systems of renewable energies [28]. In early days, different biomass such as leaves, wood, and excrement have been used as energy resource in daily life. Despite the overriding of biomass by fossil fuels in both urban and rural regions since the industrial revolution, biomass is slowly becoming reaccepted as an energy supply at the industrial scale [29].
Figure 5. Output vs. installed capacity for various global renewable sources.
Research and development is being carried out for various technologies of producing biomass energy [30,31]. Electricity generation based on gasification technology has been practiced for more than a century. Anaerobic digestion and the combustion of biomass are developed and established technologies compared to gasification. In study [31], Bhattacharya demonstrate a biomass energy to co-firing with coal energy [32,33], and it is well developed in agro-industries. Additionally, biodiesel and bioethanol-based energy production are a few of the most striking biomass energy technologies in the current era [34].
This paper briefs the necessity of upgrading Pakistan’s power sector by using the renewable resources. Some of the previous research studies in this domain only targeted one specific resource or two, while other research studies have targeted all of the resources. However, their analyses do not provide an insight as to which resource can quickly lessen the gap between energy demand and supply in the current situation in Pakistan. The first step toward the successful implementation of a renewable energy resource at a large scale is to study the various perspectives of all the available resources, and then opt for the most optimal and feasible one by properly analyzing all of the aspects of each resource. A comprehensive analysis has been done in this paper on the state, demand predictions, and existing sources of power generation in Pakistan using conventional, alternate, and renewable energy resources, along with global scenarios to comprehend where Pakistan stands in the world in terms of power and energy. This approach can help the government make decisions about the prioritization and utilization of resources, which will enable investors to wisely invest in high-priority resources based on facts and the potential advantages and disadvantages of individual resources. This study shows that the geolocation of Pakistan makes the place ideal for the implementation of any kind of alternate or renewable energy systems based on hydropower, thermal power, nuclear power, wind, solar, geothermal, and biomass power plants. It also discusses the biomass resources such as bagasse, municipal waste, and poultry waste to harvest biomass energy for power generation, transportation, and industrial fuel. Keeping in view the availability, sustainability, and lowest environmental impact of biomass energy, this paper concludes that the energy policies of Pakistan are in dire need of revision in order to bridge the demand and supply gap
0
10
20
30
40
50
60
Wind Biomass/Biogas Rooftop PV Utility Solar Geothermal
2004 to 2014: Added Output = 42.5 GW
Capacity
Output
Figure 5. Output vs. installed capacity for various global renewable sources.
Research and development is being carried out for various technologies of producing biomassenergy [30,31]. Electricity generation based on gasification technology has been practiced for morethan a century. Anaerobic digestion and the combustion of biomass are developed and establishedtechnologies compared to gasification. In study [31], Bhattacharya demonstrate a biomass energy toco-firing with coal energy [32,33], and it is well developed in agro-industries. Additionally, biodieseland bioethanol-based energy production are a few of the most striking biomass energy technologies inthe current era [34].
This paper briefs the necessity of upgrading Pakistan’s power sector by using the renewableresources. Some of the previous research studies in this domain only targeted one specific resource ortwo, while other research studies have targeted all of the resources. However, their analyses do notprovide an insight as to which resource can quickly lessen the gap between energy demand and supplyin the current situation in Pakistan. The first step toward the successful implementation of a renewableenergy resource at a large scale is to study the various perspectives of all the available resources,and then opt for the most optimal and feasible one by properly analyzing all of the aspects of eachresource. A comprehensive analysis has been done in this paper on the state, demand predictions, andexisting sources of power generation in Pakistan using conventional, alternate, and renewable energyresources, along with global scenarios to comprehend where Pakistan stands in the world in terms ofpower and energy. This approach can help the government make decisions about the prioritizationand utilization of resources, which will enable investors to wisely invest in high-priority resourcesbased on facts and the potential advantages and disadvantages of individual resources. This studyshows that the geolocation of Pakistan makes the place ideal for the implementation of any kind ofalternate or renewable energy systems based on hydropower, thermal power, nuclear power, wind,solar, geothermal, and biomass power plants. It also discusses the biomass resources such as bagasse,municipal waste, and poultry waste to harvest biomass energy for power generation, transportation,and industrial fuel. Keeping in view the availability, sustainability, and lowest environmental impactof biomass energy, this paper concludes that the energy policies of Pakistan are in dire need of revisionin order to bridge the demand and supply gap by bringing up projects based on renewable energies,especially biomass-based energy projects that hold enormous energy and fuel potential.
This paper has been structured in four main sections. Sections 2 and 3 critically review theexisting demand and future sources of power generation predictions based on different power plantsin Pakistan. The existing and future scenarios of biomass applications in electricity generation,
Energies 2018, 11, 2431 7 of 49
transportation, and its use as an industrial fuel are the focus of Section 4. The discussion andrecommendations have been presented in Section 5, in comparison to the existing energy situation ofPakistan. Finally, a conclusion is presented in Section 6. A graphical representation of the researchmethodology is also presented in Figure 6.
Energies 2018, 11, x FOR PEER REVIEW 7 of 53
by bringing up projects based on renewable energies, especially biomass-based energy projects that hold enormous energy and fuel potential.
This paper has been structured in four main sections. Sections 2 and 3 critically review the existing demand and future sources of power generation predictions based on different power plants in Pakistan. The existing and future scenarios of biomass applications in electricity generation, transportation, and its use as an industrial fuel are the focus of Section 4. The discussion and recommendations have been presented in Section 5, in comparison to the existing energy situation of Pakistan. Finally, a conclusion is presented in Section 6. A graphical representation of the research methodology is also presented in Figure 6.
Figure 6. Graphical representation of the research methodology.
2. Energy Sector of Pakistan
A worldwide evaluation of energy policies has been carried out to meet the gap between supply and demand [35–38]. So, Pakistan’s national power policy has the key objective of providing an efficient electricity supply system by transition of the country’s electricity industry from the public sector toward potential efficiency improvements from private enterprise, because the public sector has been facing various constraints over the last two decades. Since 1994, the Government of Pakistan (GoP) has been following a policy of commissioning new generation capacity in the private sector via independent power producers (IPPs) [39,40]. Public and private sector (IPPs) contribute 53.64% and 46.36%, respectively, to the installed capacity of Pakistan. There has been an elevation in the overall installed capacity for power generation of Pakistan i.e., 24,961 MW in 2015 to 24,961 in 2016, representing an increase of 1.65%. The National Transmission and Dispatch Company (NTDC) and K-Electric’s (K-EL) power plants generated 112,033 GWh as of 2016, relative to 108,916 GWh as of 2015 [21]. An overview of the power sector and discussion about its current generation capacity is given in the following sections.
Figure 6. Graphical representation of the research methodology.
2. Energy Sector of Pakistan
A worldwide evaluation of energy policies has been carried out to meet the gap between supplyand demand [35–38]. So, Pakistan’s national power policy has the key objective of providing anefficient electricity supply system by transition of the country’s electricity industry from the publicsector toward potential efficiency improvements from private enterprise, because the public sectorhas been facing various constraints over the last two decades. Since 1994, the Government of Pakistan(GoP) has been following a policy of commissioning new generation capacity in the private sectorvia independent power producers (IPPs) [39,40]. Public and private sector (IPPs) contribute 53.64%and 46.36%, respectively, to the installed capacity of Pakistan. There has been an elevation in theoverall installed capacity for power generation of Pakistan i.e., 24,961 MW in 2015 to 24,961 in 2016,representing an increase of 1.65%. The National Transmission and Dispatch Company (NTDC) andK-Electric’s (K-EL) power plants generated 112,033 GWh as of 2016, relative to 108,916 GWh as of2015 [21]. An overview of the power sector and discussion about its current generation capacity isgiven in the following sections.
2.1. Hydropower
Hydel power is a clean, cost-effective, and renewable energy source. Also, it shows a quickresponse with a fast varying load [41,42]. Keeping in view its advantages, more than 150 nations
Energies 2018, 11, 2431 8 of 49
have established hydel power generation plants, which constitute about 16% of the world’s powergeneration [43,44]. Results deduced by a comparison of electricity generation from hydropower andother renewable sources between 2010–2016, as shown in Figure 7, illustrate that hydropower electricitygeneration has three times greater efficiency than other sources [45]. The total renewable capacities ofthe top six countries are presented in Figure 8. As seen, China has the largest hydropower resourcepotential, with a capacity of 542 GW and 2470 TWh annual generation as of 2016 [45,46].
Energies 2018, 11, x FOR PEER REVIEW 8 of 53
2.1. Hydropower
Hydel power is a clean, cost-effective, and renewable energy source. Also, it shows a quick response with a fast varying load [41,42]. Keeping in view its advantages, more than 150 nations have established hydel power generation plants, which constitute about 16% of the world’s power generation [43,44]. Results deduced by a comparison of electricity generation from hydropower and other renewable sources between 2010–2016, as shown in Figure 7, illustrate that hydropower electricity generation has three times greater efficiency than other sources [45]. The total renewable capacities of the top six countries are presented in Figure 8. As seen, China has the largest hydropower resource potential, with a capacity of 542 GW and 2470 TWh annual generation as of 2016 [45,46].
Figure 7. Worldwide electricity production for the period 2010–2016.
Hydro has remained a chief pillar of economical energy production in Pakistan. During 1960, this method generated 70% of the total electricity of the country, whereas by 2014, it had declined to only 30% (7000 MW). This constitutes 9% of the overall power produced from primary sources [47].
Figure 8. China has the world’s largest total hydropower capacity.
Pakistan can tap its lakes, rivers, and waterfalls to generate hydro energy, which accounts for enormous potential of energy generation. For hydel-based electricity generation installations, several new locations have been chosen [48]. Pakistan’s inability to sustain a hydropower share in the total electricity produced is one of the leading reasons for its energy crisis. In 2015, the overall share
0
10
20
30
40
50
60
70
80
90
Fossil Fuels and Nuclear Hydropower Renewables (non-hydro)
Elec
trici
ty P
rodu
ctio
n (%
)
2010
2011
2012
2013
2014
2015
2016
0
100
200
300
400
500
600
China United States Germany India Japan Italy
Inst
alle
d Ca
pacit
y (GW
)
Geothermal
Bio-power
Solar PV
Wind power
Hydropower
Figure 7. Worldwide electricity production for the period 2010–2016.
Hydro has remained a chief pillar of economical energy production in Pakistan. During 1960,this method generated 70% of the total electricity of the country, whereas by 2014, it had declined toonly 30% (7000 MW). This constitutes 9% of the overall power produced from primary sources [47].
Energies 2018, 11, x FOR PEER REVIEW 8 of 53
2.1. Hydropower
Hydel power is a clean, cost-effective, and renewable energy source. Also, it shows a quick response with a fast varying load [41,42]. Keeping in view its advantages, more than 150 nations have established hydel power generation plants, which constitute about 16% of the world’s power generation [43,44]. Results deduced by a comparison of electricity generation from hydropower and other renewable sources between 2010–2016, as shown in Figure 7, illustrate that hydropower electricity generation has three times greater efficiency than other sources [45]. The total renewable capacities of the top six countries are presented in Figure 8. As seen, China has the largest hydropower resource potential, with a capacity of 542 GW and 2470 TWh annual generation as of 2016 [45,46].
Figure 7. Worldwide electricity production for the period 2010–2016.
Hydro has remained a chief pillar of economical energy production in Pakistan. During 1960, this method generated 70% of the total electricity of the country, whereas by 2014, it had declined to only 30% (7000 MW). This constitutes 9% of the overall power produced from primary sources [47].
Figure 8. China has the world’s largest total hydropower capacity.
Pakistan can tap its lakes, rivers, and waterfalls to generate hydro energy, which accounts for enormous potential of energy generation. For hydel-based electricity generation installations, several new locations have been chosen [48]. Pakistan’s inability to sustain a hydropower share in the total electricity produced is one of the leading reasons for its energy crisis. In 2015, the overall share
0
10
20
30
40
50
60
70
80
90
Fossil Fuels and Nuclear Hydropower Renewables (non-hydro)
Elec
trici
ty P
rodu
ctio
n (%
)
2010
2011
2012
2013
2014
2015
2016
0
100
200
300
400
500
600
China United States Germany India Japan Italy
Inst
alle
d Ca
pacit
y (GW
)
Geothermal
Bio-power
Solar PV
Wind power
Hydropower
Figure 8. China has the world’s largest total hydropower capacity.
Pakistan can tap its lakes, rivers, and waterfalls to generate hydro energy, which accounts forenormous potential of energy generation. For hydel-based electricity generation installations, severalnew locations have been chosen [48]. Pakistan’s inability to sustain a hydropower share in the totalelectricity produced is one of the leading reasons for its energy crisis. In 2015, the overall shareincreased by an insignificant amount of 1%, making its share 31%. The loss of its share is due to theGoP’s inability to establish new power production plants and trail the power requirement, as shownin Figure 9. Whereas, during this period, electricity production using thermal sources rose to 65% from
Energies 2018, 11, 2431 9 of 49
42% [49]. Owing to a decrease in the generation capacity, hydel power generation is prone to encounterlimitations based on a deficit of water, mostly in winters. Limited reservoirs and dams further add tothis problem [50].
Energies 2018, 11, x FOR PEER REVIEW 9 of 53
increased by an insignificant amount of 1%, making its share 31%. The loss of its share is due to the GoP’s inability to establish new power production plants and trail the power requirement, as shown in Figure 9. Whereas, during this period, electricity production using thermal sources rose to 65% from 42% [49]. Owing to a decrease in the generation capacity, hydel power generation is prone to encounter limitations based on a deficit of water, mostly in winters. Limited reservoirs and dams further add to this problem [50].
Figure 9. Decreased share of hydel in electricity generation from 1960–2015 in percentage.
For Pakistan, as a developing country, the ultimate preference could be hydropower, since it is inexpensive, plentiful, and a native source for renewable energy production. The expense for hydro energy production is approximately PKR 2–3/kWh, while using natural gas costs PKR 4–6/kWh. Likewise, the utilization of high-speed diesel (HSD) and residual furnace oil (RFO) for electricity production is five times more expensive than hydel i.e., PKR 15–18/kWh [43,51].
In the late 1970s, even with the worthwhile advantages offered by hydel, no remarkable accommodations were made after the establishment of the Tarbela and Mangla dams. Ghazi Brotha was the last significant venture; it was made in 2002, bringing 1450 MW capacity to the grid. Since then, no noteworthy investment has been made. From 2004 to 2012, the demand has increased by 27.5%, and overall capacity has increased by only 16%. Talks about the Kalabagh Dam and Diamer Bhasa Dam with 3600 MW and 4500 MW capacity, respectively, have been ongoing, but due to a lack of finance [52] and political problems [53], they have not been realized [54].
Table 3 shows an empirical analysis of the hydel portfolio in Pakistan. It is observable that while the 0.15–50 MW range covers the three classes, all of the projects having greater than 50 MW are taken as large hydrosystems. It has been suggested that adding more categories to the 450 MW section would render easier planning and estimation. The proposed categories are medium hydro, large hydro, and mega hydro, with capacities of 50–499 MW, 500–1000 MW, and 41,000 MW, respectively. Large and mega projects can expectedly have disparate scales of ecological and socioeconomic influence across notably different geographical locations and time scales [55].
Figure 9. Decreased share of hydel in electricity generation from 1960–2015 in percentage.
For Pakistan, as a developing country, the ultimate preference could be hydropower, since it isinexpensive, plentiful, and a native source for renewable energy production. The expense for hydroenergy production is approximately PKR 2–3/kWh, while using natural gas costs PKR 4–6/kWh.Likewise, the utilization of high-speed diesel (HSD) and residual furnace oil (RFO) for electricityproduction is five times more expensive than hydel i.e., PKR 15–18/kWh [43,51].
In the late 1970s, even with the worthwhile advantages offered by hydel, no remarkableaccommodations were made after the establishment of the Tarbela and Mangla dams. Ghazi Brothawas the last significant venture; it was made in 2002, bringing 1450 MW capacity to the grid. Since then,no noteworthy investment has been made. From 2004 to 2012, the demand has increased by 27.5%,and overall capacity has increased by only 16%. Talks about the Kalabagh Dam and Diamer BhasaDam with 3600 MW and 4500 MW capacity, respectively, have been ongoing, but due to a lack offinance [52] and political problems [53], they have not been realized [54].
Table 3 shows an empirical analysis of the hydel portfolio in Pakistan. It is observable that whilethe 0.15–50 MW range covers the three classes, all of the projects having greater than 50 MW are takenas large hydrosystems. It has been suggested that adding more categories to the 450 MW section wouldrender easier planning and estimation. The proposed categories are medium hydro, large hydro, andmega hydro, with capacities of 50–499 MW, 500–1000 MW, and 41,000 MW, respectively. Large andmega projects can expectedly have disparate scales of ecological and socioeconomic influence acrossnotably different geographical locations and time scales [55].
The thought of micro hydel is not new for Pakistan; the still functional power station established in1925 at the Bambawali Ravi Bedian (BRB) Canal in Renala generates 1.1 MW of power. The cumulativemicro hydel potential at a total of 815 natural waterfalls and run-of-river sites is 3100 MW in thecountry. Major hydel projects under development under the Water and Power Development Authority(WAPDA) are shown in Table 4 [15].
Table 4. Hydropower projects under development in Pakistan. COD: commercial operation dates.
Sr. No. Dam Capacity (MW) Expected COD
1 Neelum Jehlum 969 December 20172 Dasu 2 × 2160 20253 Diamir Bhasha 4500 2019–20204 Keyal Khwar 128 January 2020
There was an addition of 1908 GWh to the total hydropower energy generation in 2015–2016as compared to 2014–2015, making up a total of 33,433 GWh energy production, while WAPDA’shydropower installed capacity persisted on 6902 MW from 2014–2016. Likewise, in 2015–2016,the hydel-based IPPs made a contribution of 52 GWh, and the installed capacity remained the sameas that of 2014–2015. Throughout the year, the electricity production trend from hydropower hasbeen consistent with the historical trends. For 2015–2016, operation and readiness was observed tobe acceptable [21]. To inspire the installment of hydel-based projects, the GoP has permitted a 17%internal rate of return for such projects [54].
2.2. Thermal Power Source
The use of thermal energy has been greatly expanded in every sector of life, such as the residentialindustrial and commercial sectors e.g., for cooling and heating purposes. The IEA predicted that theneed for thermal energy will persist in the near future. For thermal energy generation, primary sourcesare fossil fuels such as coal, oil, and natural gas. Nuclear reactors are also used in this regard [56].
Pakistan has a mixture of thermal, hydro, nuclear, and renewable energy power plants forelectricity generation. In 1985, the ratio of installed capacity of hydel to thermal was 67% to 33%, butlater, more power started to be generated thermally, lessening the electricity generation from hydel.As of 2016, the hydel-to-thermal ratio became 30:65, thus indicating a dilemma that Pakistan’s powersector mainly relies upon thermal power plants that feed on oil and gas [57–59].
As of 30 June 2016, Pakistan had a total of 25,374 MW power generation capacity, out of which16,619 MW i.e., 65.5% was harnessed from thermal power plants. Table 5 shows the various fuelsutilized and percentage share of overall fuel consumed for electricity generation using thermalresources from 2010 to 2015 [21]. Pakistan is working on the three Regasified Liquefied NaturalGas (RLNG)-based power plants, which are expected to be functional as per the dates mentioned inTable 6. It has been observed that the public thermal power plants of Pakistan have been lacking inall of the key performance indicators (KPIs) for many years, and are functioning at below the ratedcapacities and efficiencies, contributing toward an overall higher cost of generation, since demand isincreasing and the production has been lowered [60].
Energies 2018, 11, 2431 11 of 49
Table 5. Fuel consumption for thermal power production in tons of oil equivalent (TOE).
Fiscal Year Unit Gas Furnace Oil Diesel Oil Coal Total Annual GrowthRate (%)
Table 6. New Regasified Liquefied Natural Gas (RLNG)-based projects under development in Pakistan.
Name of Project Capacity (Gross) Progress Expected COD
Quaid-e-Azam Thermal Power Project, Bhikki 1180 52.30 20 December 2017Haveli Bahadur Shah Power Project 1230.5 35.78 9 January 2018
Balloki Power Project 1223 38.1 30 January 2018
The projects under the supervision of the public sector mostly face delays of various natures,extending from the need for enormous funds to ecological problems as well as technical limitationssuch as geological reservations [48]. Such delays are not tolerable for thermal projects, but still dueto procedural formalities, projects such as 747 MW gas-based Guddu Power Plant, Nandipur PowerPlant, and coal-based Jamshoro units 5 and 6 have been delayed [58,61]. Table 7 provides additionaldetails, for the years 2015 and 2016, of power plants integrated with NTDCs and K-EL systems alongwith their installed capacity and electricity generation. Table 8 shows a list of thermal power plantsalong with their capacities [21].
Table 7. Thermal installed capacity and electricity generation for 2015 and 2016. CPP: captive powerproducers, IPP: independent power producers, GWh: gigawatt hours, K-EL: K-Electric.
As of 30 June 2016 Installed Capacity (MW) Electricity Generation (GWh)
2015 2016 2014–2015 2015–2016 Variation %
GENCOs with PEPCO 5762 5762 13,300 14,490 1190 8.95
K-EL Own 1874 1874 9319 10,323 1004 10.77
IPPsConnected with PEPCO 8696 8696 44,369 44,591 222 0.5
Connected with K-EL 252 252 1525 1421 104 6.82
CPPs/SPPs connected with K-EL 35 35 191 139 52 27.23
GENCO stands for power generation company, PEPCO stands for Pakistan Electric Power Company, CPP standsfor captive power producers, SPP stands for small power producers, and K-E stands for K Electric.
Table 8. List of thermal power plants along with their capacities.
Sr. No. Plant Capacity (MW) Net Capacity (MW)
1 Jamshoro Power Company Limited (GENCO-I): 2344 1974.562 Central Power Generation Company Limited (GENCO-II) 2431.7 2140.613 Northern Power Generation Company Limited (GENCO-III) 2291.65 2001.194 Lakhra Power Generation Company Limited (GENCO-IV) 150 93
2.3. Nuclear Power Source
Energy sustainability and environmental challenges have gained global attention in the transitionto alternate energy sources from fossil fuel utilization. Nuclear energy, as part of the alternateresources for energy production, is deemed capable for the prevention of ecological deterioration and
Energies 2018, 11, 2431 12 of 49
maintenance of energy security, so there have been worldwide investments in many nations in thisdomain. A total of 447 nuclear power plants are operational around the globe, while another 287 aregoing to be functional by 2035. Figure 10 shows the global expansion of the usage of nuclear energycontinuously [62]. Nuclear power plants do not emit greenhouse gases, ensuring a carbon-free baseload electrical energy. Also, they require a relatively smaller footprint on land, which can be observedfrom Table 9 [63].
Energies 2018, 11, x FOR PEER REVIEW 12 of 53
CPPs/SPPs connected with
K-EL 35 35 191 139 52 27.23
GENCO stands for power generation company, PEPCO stands for Pakistan Electric Power Company, CPP stands for captive power producers, SPP stands for small power producers, and K-E stands for K Electric.
Table 8. List of thermal power plants along with their capacities.
Sr. No. Plant Capacity (MW)
Net Capacity (MW)
1 Jamshoro Power Company Limited (GENCO-I): 2344 1974.56 2 Central Power Generation Company Limited (GENCO-II) 2431.7 2140.61 3 Northern Power Generation Company Limited (GENCO-III) 2291.65 2001.19 4 Lakhra Power Generation Company Limited (GENCO-IV) 150 93
2.3. Nuclear Power Source
Energy sustainability and environmental challenges have gained global attention in the transition to alternate energy sources from fossil fuel utilization. Nuclear energy, as part of the alternate resources for energy production, is deemed capable for the prevention of ecological deterioration and maintenance of energy security, so there have been worldwide investments in many nations in this domain. A total of 447 nuclear power plants are operational around the globe, while another 287 are going to be functional by 2035. Figure 10 shows the global expansion of the usage of nuclear energy continuously [62]. Nuclear power plants do not emit greenhouse gases, ensuring a carbon-free base load electrical energy. Also, they require a relatively smaller footprint on land, which can be observed from Table 9 [63].
Figure 10. Global variation of functional nuclear plants with their total capacity (MW) between 1955–2015.
050100150200250300350400450500
0
50000
100000
150000
200000
250000
300000
350000
400000
450000
1955
1958
1961
1964
1967
1970
1973
1976
1979
1982
1985
1988
1991
1994
1997
2000
2003
2006
2009
2012
2015
Num
ber o
f Nuc
lear
Rea
ctor
s
Nucle
ar C
apac
ity (M
W)
Electrical Capacity Number of Reactors
Figure 10. Global variation of functional nuclear plants with their total capacity (MW)between 1955–2015.
Energies 2018, 11, 2431 13 of 49
Table 9. Data and ranks of power generation sources based on sustenance, economy, and environmental effects. GHG: greenhouse gas, PV: photovoltaic.
Indicator (per TWh)Coal Natural Gas Nuclear Biomass Hydro Wind (Onshore) Solar PV
Value Rank Value Rank Value Rank Value Rank Value Rank value Rank Value Rank
The capacity of nuclear power of the world is expected to rise to 416 GW (2030) from 368 GW(2005) [64]. Globally, 6% of energy and 16% of electricity is harnessed from nuclear energy.The Organization for Economic Co-operation and Development OECD nations account for 55%of global uranium production. There was a rapid increase in global nuclear power consumption from0.1% in 1970 to 7.4% in 1998, of which the major increase was observed in the 1980s [65].
Pakistan’s electricity supply from nuclear resource is only 4.94% of the total supply; its provisiontakes place from Chashma Nuclear Power Plants I and II (CHASHNUPP I and II) and the KarachiNuclear Power Plant (KANUPP) [66]. Two new units named Chashma-III and Chashma-IV haverecently been constructed at the Chashma power plant site, each having a capacity of 350 MW.Two more units are also being constructed at the KANUPP site, which are expected to add 1100 MWto the national grid by 2020. The Pakistan Atomic Energy Commission (PAEC), in collaborationwith the GoP, intends the establishment of power plants based on nuclear reactors by 2030, with acapacity of 8800 MW. Figure 11 shows the nuclear scenario of installed capacities by PAEC from 2012to 2030 [66,67].
Energies 2018, 11, x FOR PEER REVIEW 14 of 53
The capacity of nuclear power of the world is expected to rise to 416 GW (2030) from 368 GW (2005) [64]. Globally, 6% of energy and 16% of electricity is harnessed from nuclear energy. The Organization for Economic Co-operation and Development OECD nations account for 55% of global uranium production. There was a rapid increase in global nuclear power consumption from 0.1% in 1970 to 7.4% in 1998, of which the major increase was observed in the 1980s [65].
Pakistan’s electricity supply from nuclear resource is only 4.94% of the total supply; its provision takes place from Chashma Nuclear Power Plants I and II (CHASHNUPP I and II) and the Karachi Nuclear Power Plant (KANUPP) [66]. Two new units named Chashma-III and Chashma-IV have recently been constructed at the Chashma power plant site, each having a capacity of 350 MW. Two more units are also being constructed at the KANUPP site, which are expected to add 1100 MW to the national grid by 2020. The Pakistan Atomic Energy Commission (PAEC), in collaboration with the GoP, intends the establishment of power plants based on nuclear reactors by 2030, with a capacity of 8800 MW. Figure 11 shows the nuclear scenario of installed capacities by PAEC from 2012 to 2030 [66,67].
Figure 11. Nuclear scenario of installed capacities.
For 2015–2016, the NTDC-based nuclear plants had a steady installed capacity of 650 MW, which was the same as for the years 2014–2015, but the energy generation declined by 1142 GWh relative to 2014–2015 and stood at 3854 GWh for 2015–2016. No major power outage in the NTDC-based nuclear plants occurred, so they showed satisfactory performance during 2015–2016, except for one major issue i.e., the instability of the national electricity grid [21]. KANUPP has repeatedly faced shutdowns caused by fluctuations in the grid. Considering this menace, PAEC has worked on technical infrastructure improvement to support current and future nuclear power plants. Additionally, the facilities of in-house instructional and training centers covering all of the aspects of nuclear science and technology have been provided [16].
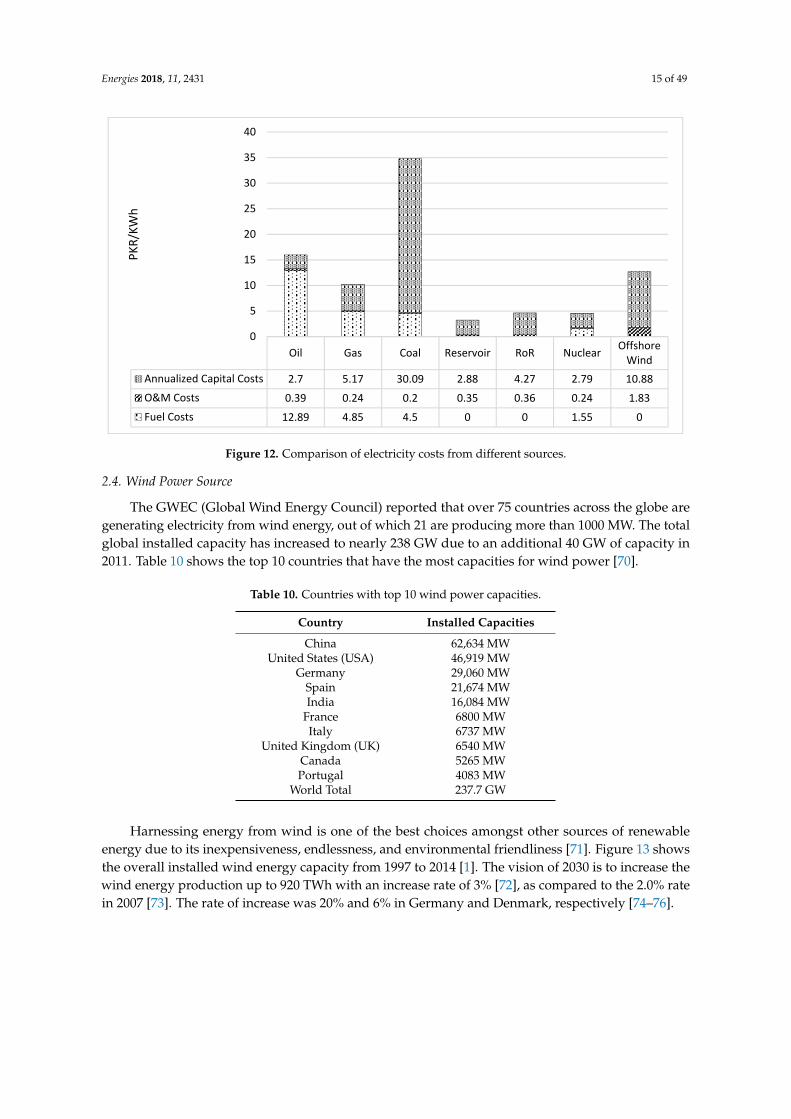
The cost of electricity from nuclear resources is greater than other sources, since the reactor fuel is expensive, and most of it is imported. Figure 12 shows the comparison of electricity costs from various sources. Among alternate energy sources, nuclear is the costliest, with a price of PKR 4.58/kWh [68]. With the intent to raise the share of nuclear power to 8.8 GW by 2030, Pakistan would require 1600 tons of uranium. For that, the exploration, mining, and reprocessing of uranium in the country has been promised by the concerned authorities [69]. Also, by taking care of safety and health-related dangers, the encouraging impacts on the environment and national economic sustainability will increase nuclear-based electricity production.
0
2000
4000
6000
8000
10000
12000
2012 2014 2016 2018 2020 2022 2024 2026 2028 2030
Meg
awat
ts
Capacity Installed in Nuclear Scenerio
Hydel Generation
New Gas Generation
New REP Generation
New Thar Coal Gas
PAEC
PAEC New Generation
Thermal Coal Generation
Thermal Gas Generation
Thermal HSD Generation
Thermal RFO Generation
Figure 11. Nuclear scenario of installed capacities.
For 2015–2016, the NTDC-based nuclear plants had a steady installed capacity of 650 MW, whichwas the same as for the years 2014–2015, but the energy generation declined by 1142 GWh relative to2014–2015 and stood at 3854 GWh for 2015–2016. No major power outage in the NTDC-based nuclearplants occurred, so they showed satisfactory performance during 2015–2016, except for one major issuei.e., the instability of the national electricity grid [21]. KANUPP has repeatedly faced shutdowns causedby fluctuations in the grid. Considering this menace, PAEC has worked on technical infrastructureimprovement to support current and future nuclear power plants. Additionally, the facilities ofin-house instructional and training centers covering all of the aspects of nuclear science and technologyhave been provided [16].
The cost of electricity from nuclear resources is greater than other sources, since the reactorfuel is expensive, and most of it is imported. Figure 12 shows the comparison of electricity costsfrom various sources. Among alternate energy sources, nuclear is the costliest, with a price of PKR4.58/kWh [68]. With the intent to raise the share of nuclear power to 8.8 GW by 2030, Pakistanwould require 1600 tons of uranium. For that, the exploration, mining, and reprocessing of uraniumin the country has been promised by the concerned authorities [69]. Also, by taking care of safetyand health-related dangers, the encouraging impacts on the environment and national economicsustainability will increase nuclear-based electricity production.
Energies 2018, 11, 2431 15 of 49Energies 2018, 11, x FOR PEER REVIEW 15 of 53
Figure 12. Comparison of electricity costs from different sources.
2.4. Wind Power Source
The GWEC (Global Wind Energy Council) reported that over 75 countries across the globe are generating electricity from wind energy, out of which 21 are producing more than 1000 MW. The total global installed capacity has increased to nearly 238 GW due to an additional 40 GW of capacity in 2011. Table 10 shows the top 10 countries that have the most capacities for wind power [70].
Table 10. Countries with top 10 wind power capacities.
Country Installed Capacities
China 62,634 MW
United States (USA) 46,919 MW
Germany 29,060 MW
Spain 21,674 MW
India 16,084 MW
France 6800 MW
Italy 6737 MW
United Kingdom (UK) 6540 MW
Canada 5265 MW
Portugal 4083 MW
World Total 237.7 GW
Harnessing energy from wind is one of the best choices amongst other sources of renewable energy due to its inexpensiveness, endlessness, and environmental friendliness [71]. Figure 13 shows the overall installed wind energy capacity from 1997 to 2014 [1]. The vision of 2030 is to increase the wind energy production up to 920 TWh with an increase rate of 3% [72], as compared to the 2.0% rate in 2007 [73]. The rate of increase was 20% and 6% in Germany and Denmark, respectively [74–76].
Figure 12. Comparison of electricity costs from different sources.
2.4. Wind Power Source
The GWEC (Global Wind Energy Council) reported that over 75 countries across the globe aregenerating electricity from wind energy, out of which 21 are producing more than 1000 MW. The totalglobal installed capacity has increased to nearly 238 GW due to an additional 40 GW of capacity in2011. Table 10 shows the top 10 countries that have the most capacities for wind power [70].
Table 10. Countries with top 10 wind power capacities.
Country Installed Capacities
China 62,634 MWUnited States (USA) 46,919 MW
Germany 29,060 MWSpain 21,674 MWIndia 16,084 MW
France 6800 MWItaly 6737 MW
United Kingdom (UK) 6540 MWCanada 5265 MWPortugal 4083 MW
World Total 237.7 GW
Harnessing energy from wind is one of the best choices amongst other sources of renewableenergy due to its inexpensiveness, endlessness, and environmental friendliness [71]. Figure 13 showsthe overall installed wind energy capacity from 1997 to 2014 [1]. The vision of 2030 is to increase thewind energy production up to 920 TWh with an increase rate of 3% [72], as compared to the 2.0% ratein 2007 [73]. The rate of increase was 20% and 6% in Germany and Denmark, respectively [74–76].
Energies 2018, 11, 2431 16 of 49
Energies 2018, 11, x FOR PEER REVIEW 16 of 53
Figure 13. Overall installed wind energy capacity from 1997 to 2014.
Pakistan has enormous wind power resource potential. With the cooperation of the United States Agency for International Development (USAID), the Pakistan Meteorological Department, and the National Renewable Energy Laboratory (NREL); Pakistan’s Alternative Energy Development Board (AEDB) established the very first wind map of the country, which provides a promising wind power potential of 346 GW in different regions of Pakistan [59]. Figure 14 shows that according to the survey report of the NREL, Pakistan is capable of overall 346 GW of power production from wind especially on the coastal areas of Sindh, where the velocity of wind is about 5–12 m/s, suggesting a potential of 20 GW from such wind sites [77]. A study was carried out for the wind potential of Pakistan for non-offshore areas, considering the assumption that 5 MW/km2 is the installed capacity where the total land area of Pakistan is 877,525 km2, and it was found out to be 132,000 MW. It has been summarized in Table 11 [78].
A number of sites for the installation of wind energy production, with the aid of private sector producers, are under consideration by the AEDB. Ghoro-Keti Bandar has a 25% capacity factor, and a mean wind velocity of 7 ms−1 at a height of 50 m; it is one of such sites with a power density of 400 W/m2. Such sites can be utilized for commercially feasible wind farm projects. The evaluated capability for the power capacity of this site is more than 60 GW [79]. Nevertheless, the contribution of this site is insignificant, regardless of its considerable potential. From wind energy, the highest input of 106 MW was observed in 2014, producing only 0.2% of the total national electricity consumption [80]. Licenses have been granted to various companies by the AEDB. Several local and international companies have set up new projects. By 2030, the government is expecting a minimum of 30 GW capacity from wind resources [81].
Figure 13. Overall installed wind energy capacity from 1997 to 2014.
Pakistan has enormous wind power resource potential. With the cooperation of the United StatesAgency for International Development (USAID), the Pakistan Meteorological Department, and theNational Renewable Energy Laboratory (NREL); Pakistan’s Alternative Energy Development Board(AEDB) established the very first wind map of the country, which provides a promising wind powerpotential of 346 GW in different regions of Pakistan [59]. Figure 14 shows that according to the surveyreport of the NREL, Pakistan is capable of overall 346 GW of power production from wind especiallyon the coastal areas of Sindh, where the velocity of wind is about 5–12 m/s, suggesting a potentialof 20 GW from such wind sites [77]. A study was carried out for the wind potential of Pakistanfor non-offshore areas, considering the assumption that 5 MW/km2 is the installed capacity wherethe total land area of Pakistan is 877,525 km2, and it was found out to be 132,000 MW. It has beensummarized in Table 11 [78].
A number of sites for the installation of wind energy production, with the aid of private sectorproducers, are under consideration by the AEDB. Ghoro-Keti Bandar has a 25% capacity factor, anda mean wind velocity of 7 ms−1 at a height of 50 m; it is one of such sites with a power density of400 W/m2. Such sites can be utilized for commercially feasible wind farm projects. The evaluatedcapability for the power capacity of this site is more than 60 GW [79]. Nevertheless, the contribution ofthis site is insignificant, regardless of its considerable potential. From wind energy, the highest input of106 MW was observed in 2014, producing only 0.2% of the total national electricity consumption [80].Licenses have been granted to various companies by the AEDB. Several local and internationalcompanies have set up new projects. By 2030, the government is expecting a minimum of 30 GWcapacity from wind resources [81].
Energies 2018, 11, 2431 17 of 49Energies 2018, 11, x FOR PEER REVIEW 17 of 53
Figure 14. Wind power classification of Pakistan. (1.96”, 1.96).
During the financial year 2015–2016, an addition of 50 MW of wind power has been done in the system of the NTDC, for a total wind-based power of about 306 MW in the system. The energy generated by wind-based power plants during the period 2015–2016 has been noted as 732 GWh [21].
Table 11. Wind resource in Pakistan at 50 m from good to excellent.
Wind Resource Quality Scale Wind Class
Power (kW/m2)
Speed (m/s)
Area (km2) Capacity (GW)
Good 4 0.4–0.5 6.9–7.4 18,106 90.53
Very Good 5 0.5–0.6 7.4–7.8 5218 26.09 Excellent 6 0.6–0.8 7.8–8.6 2495 12.48 Excellent 7 >0.8 >8.6 543 2.72
Total 26,362 131.8
2.5. Solar Power Source
At the conclusion of 2015, the global installed capacity of solar-powered electricity approached 227 GW, producing 1% of global electricity. The regions with relatively less solar resources i.e., Europe and China, have major solar installations, whereas those with more solar potential i.e., Middle East and Africa, are unexploited.
In the last 10 years, Germany has been leading solar photovoltaic (PV) installed capacity, and it is trailed by China, Italy, Japan, and the United States. Current electricity infrastructure can hinder the development of solar capacity, especially in novel solar markets. The renewable technologies of solar PV greatly depend on rare earth elements that may also have a supply interruption risk along with unsustainable mining procedures. Figure 15 shows the top solar PV capacity countries in 2014 and additions in 2015, where China has the highest capacity of 44 GW. After the addition of capacity in 2015, the total capacity became 59.2 GW [20].
Figure 14. Wind power classification of Pakistan. (1.96”, 1.96).
During the financial year 2015–2016, an addition of 50 MW of wind power has been done inthe system of the NTDC, for a total wind-based power of about 306 MW in the system. The energygenerated by wind-based power plants during the period 2015–2016 has been noted as 732 GWh [21].
Table 11. Wind resource in Pakistan at 50 m from good to excellent.
At the conclusion of 2015, the global installed capacity of solar-powered electricity approached227 GW, producing 1% of global electricity. The regions with relatively less solar resources i.e., Europeand China, have major solar installations, whereas those with more solar potential i.e., Middle Eastand Africa, are unexploited.
In the last 10 years, Germany has been leading solar photovoltaic (PV) installed capacity, and it istrailed by China, Italy, Japan, and the United States. Current electricity infrastructure can hinder thedevelopment of solar capacity, especially in novel solar markets. The renewable technologies of solarPV greatly depend on rare earth elements that may also have a supply interruption risk along withunsustainable mining procedures. Figure 15 shows the top solar PV capacity countries in 2014 andadditions in 2015, where China has the highest capacity of 44 GW. After the addition of capacity in2015, the total capacity became 59.2 GW [20].
Energies 2018, 11, 2431 18 of 49
Energies 2018, 11, x FOR PEER REVIEW 18 of 53
Figure 15. Top solar photovoltaic (PV) capacity in 2014 and additions in 2015.
On average, 5–7 kWh/m2 irradiance per day is received on 95% of the land of Pakistan. The expansive deserts in Sindh, Punjab, and Balochistan can provide sites for solar PV-based power plants installation where the sunlight strikes 2300–2700 h/year [14,48]. In a recent 2018 study regarding Pakistan’s energy transition toward 100% renewable energy by 2050, the domination of solar PV in the installed capacities of a completely renewable system by 2050 has been predicted, considering its lower costs and the tremendous state of solar resources. Figure 16 shows the collective installed capacity from all of the renewable resources by 2050, where the above-mentioned prediction can be observed [82]. The cost of off-grid solar PV has been calculated in a study for electrifying a household, which was calculated to be PKR 14.8/kWh less than the traditional supply [83].
In 2012, with funds from Japan under a project in Islamabad that aimed to introduce solar-based clean energy, the first solar-based electricity generation plant was established. Due to this project, two 178-kW capacity solar PV power plants were established in the vicinity of the Planning Commission of Pakistan and Pakistan Engineering Council. Pakistan’s first solar park, which was called Quaid-e-Azam Solar park, has been constructed in Bahawalpur, which has a capacity of 1000 MW. Similarly, with the cooperation of private energy sector companies and China’s aid, solar-based power generation plants are being installed in Kashmir, Punjab, Sindh, and Balochistan provinces [84]. Table 12 shows the solar PV projects that are under development along with their capacity and estimated Commercial Operation Dates (COD) [15].
Of the total primary energy supply, approximately 10% is utilized for water heating; thus, 100–500 W/unit solar PV capacity systems have been planted [19]. Considering this, the number of imported solar water heaters rose to 16,715 from 260 between 2007–2013 phases. Renewable energy development organizations such as the AEDB, Pakistan Council Renewable Energy Technologies (PCRET), and private energy sectors have solar PV-based generation capacities of 200 kW, 80 kW, and 500 kW, respectively [85].
Solar PV systems are becoming more and more resourceful due to the research and development of PV technology, which is helping PV materials and PV inverters become exquisitely efficient, rendering the PV systems economical. However, time and huge investments are necessary for such commercial end products [86]. To make the public acquainted with solar technology, the provision of several energy-extraction technologies to 100 homes per province has been made for applications such as water portability, lighting, heating, and cooking. Keeping these advancements in view, the yearly power generation using solar technology is expected to be 1600 GW, and it has an ability to be a main power generation source in the impending future [87,88].
44 39.7 34.425.6 18.91
9.66 6.5 4.66 5 5.1
15.2
1.5 11
7.3
0.33.7 0.9 0.1 2 0.9
010203040506070
PV Capacity in 2014 GW 2015 Additions GW
Figure 15. Top solar photovoltaic (PV) capacity in 2014 and additions in 2015.
On average, 5–7 kWh/m2 irradiance per day is received on 95% of the land of Pakistan.The expansive deserts in Sindh, Punjab, and Balochistan can provide sites for solar PV-based powerplants installation where the sunlight strikes 2300–2700 h/year [14,48]. In a recent 2018 study regardingPakistan’s energy transition toward 100% renewable energy by 2050, the domination of solar PV inthe installed capacities of a completely renewable system by 2050 has been predicted, consideringits lower costs and the tremendous state of solar resources. Figure 16 shows the collective installedcapacity from all of the renewable resources by 2050, where the above-mentioned prediction can beobserved [82]. The cost of off-grid solar PV has been calculated in a study for electrifying a household,which was calculated to be PKR 14.8/kWh less than the traditional supply [83].
In 2012, with funds from Japan under a project in Islamabad that aimed to introduce solar-basedclean energy, the first solar-based electricity generation plant was established. Due to this project,two 178-kW capacity solar PV power plants were established in the vicinity of the PlanningCommission of Pakistan and Pakistan Engineering Council. Pakistan’s first solar park, which wascalled Quaid-e-Azam Solar park, has been constructed in Bahawalpur, which has a capacity of 1000 MW.Similarly, with the cooperation of private energy sector companies and China’s aid, solar-based powergeneration plants are being installed in Kashmir, Punjab, Sindh, and Balochistan provinces [84].Table 12 shows the solar PV projects that are under development along with their capacity andestimated Commercial Operation Dates (COD) [15].
Of the total primary energy supply, approximately 10% is utilized for water heating; thus,100–500 W/unit solar PV capacity systems have been planted [19]. Considering this, the number ofimported solar water heaters rose to 16,715 from 260 between 2007–2013 phases. Renewable energydevelopment organizations such as the AEDB, Pakistan Council Renewable Energy Technologies(PCRET), and private energy sectors have solar PV-based generation capacities of 200 kW, 80 kW, and500 kW, respectively [85].
Solar PV systems are becoming more and more resourceful due to the research and development ofPV technology, which is helping PV materials and PV inverters become exquisitely efficient, renderingthe PV systems economical. However, time and huge investments are necessary for such commercialend products [86]. To make the public acquainted with solar technology, the provision of severalenergy-extraction technologies to 100 homes per province has been made for applications such aswater portability, lighting, heating, and cooking. Keeping these advancements in view, the yearly
Energies 2018, 11, 2431 19 of 49
power generation using solar technology is expected to be 1600 GW, and it has an ability to be a mainpower generation source in the impending future [87,88].Energies 2018, 11, x FOR PEER REVIEW 19 of 53
(a)
(b)
Figure 16. Collective installed capacity from all of the renewable resources by 2050 for (a) the power and (b) integrated scenarios.
During 2015–2016, 300 MW of solar energy projects has been added to the NTDC’s network. For a rise of 204 GWh for the energy generated through solar through this period, the total energy through solar has been recorded to be 230 GWh [21].
Table 12. Solar PV projects under development with their capacities and estimated COD.
Sr. No.
Company Project Capacity
Location Expected COD
1 Access Solar Pvt. Ltd. 11.52 Pind Dadan Khan, Punjab March-2018
2 Bukhsh Solar (Pvt.) Ltd. 10 Pind Dadan Khan, Punjab December-
2017 3 Integrated Power Solution 50 Nooriabad, Sindh June-2018 4 Jafri & Associates 50 Nooriabad, Sindh June-2018 5 Solar Blue Pvt. Ltd. 50 Nooriabad, Sindh June-2018
0
50
100
150
200
250
300
350
400
2015 2020 2025 2030 2035 2040 2045 2050
Inst
alle
d Ca
pacit
y (GW
)
Year
Nuclear PP
Coal PP Hard Coal
Methanation
Hydro Dam
Hydro Run-of-River
Wind Offshore
Wind Onshore
PV Prosumers
PV Single-Axis
PV Fixed Tilted
CSP Solar Field
0
200
400
600
800
1000
1200
1400
1600
1800
2015 2020 2025 2030 2035 2040 2045 2050
Inst
alle
d Ca
pacit
y (GW
)
Year
Nuclear PP
Coal PP Hard Coal
Methanation
Hydro Dam
Hydro Run-of-River
Wind Offshore
Wind Onshore
PV Prosumers
PV Single-Axis
PV Fixed Tilted
CSP Solar Field
Figure 16. Collective installed capacity from all of the renewable resources by 2050 for (a) the powerand (b) integrated scenarios.
During 2015–2016, 300 MW of solar energy projects has been added to the NTDC’s network. For arise of 204 GWh for the energy generated through solar through this period, the total energy throughsolar has been recorded to be 230 GWh [21].
Energies 2018, 11, 2431 20 of 49
Table 12. Solar PV projects under development with their capacities and estimated COD.
Sr. No. Company ProjectCapacity Location Expected COD
1 Access Solar Pvt. Ltd. 11.52 Pind Dadan Khan, Punjab March-20182 Bukhsh Solar (Pvt.) Ltd. 10 Pind Dadan Khan, Punjab December-20173 Integrated Power Solution 50 Nooriabad, Sindh June-20184 Jafri & Associates 50 Nooriabad, Sindh June-20185 Solar Blue Pvt. Ltd. 50 Nooriabad, Sindh June-20186 Safe Solar Power Pvt. Ltd. 10 Bahawalnager, Punjab December-20177 Access Electric Pvt. Ltd. 10 Pind Dadan Khan, Punjab March-20188 R.E. Solar I Pvt. Ltd. 20 Dadu, Sindh March-20189 R.E. Solar II Pvt. Ltd. 20 Dadu, Sindh March-2018
10 Jan Solar (Pvt.) Ltd. 10 Sultanabad, RYK, Punjab March-201811 Janpur Energy Limited 10 Mehmood Kot, Muzafargarh, Punjab March-2018
12 Blue Star Hydel Pvt. Ltd. 1 Pind Dadan Khan, District Jehlum,Punjab December-2017
13 Blue Star Electric Pvt. Ltd. 1 Pind Dadan Khan, District Jehlum,Punjab December-2017
14 Siddiqsons Energy Karachi 50 Chakwal, Punjab March-201815 Harappa Solar (Pvt.) Ltd. 18 Harappa, District Sahiwal, Punjab December-201716 AJ Power (Pvt.) Ltd. 12 Adhi Kot, District Khushab, Punjab December-2017
17 Adamjee Power GenerationPvt. Ltd. 10 Norsar, Bahawalnager, Punjab December-2018
19 ET Solar (Pvt.) Ltd. 50 Fateh Jhang Road, District Attock,Punjab December-2018
20 ET Solar (Pvt.) Ltd. 25 Gharo, Thatta, Sindh December-201821 Act Solar (Pvt.) Ltd. 50 Sindh Province December-201822 Crystal Energy (Pvt.) Ltd. 2 Sambrayal, District Sialkot, Punjab May-201923 Asia Petroleum Ltd. 30 Punjab Province December-2018
24 First Solar (Pvt.) Ltd. 2 Makhayal, Kalarkahar, DistrictChakwal, Punjab December-2018
2.6. Geothermal Power Source
In the world’s primary energy consumption, only a small portion is contributed by geothermalenergy i.e., less than 1%. In 2015, the total geothermal capacity of the world rose to 13.2 GW due toan additional 315 MW of capacity installed in 2018. The geographical locations of geothermal-basedpower plants, which produce 72% of the total global geothermal capacity, are along Pacific Rim hotspot features or the tectonic plate borders. An unbalanced percentage of 43% for installed capacity islocated on regions or island nations, and is suitable for applications such as heating, power production,and the storage of heat in ambient situations [20]. Figure 17 shows the geothermal installed capacityaround the world [89].
Geological studies suggest that since Pakistan is located at a junction of tectonic plates, it hasplentiful resources of geothermal energy with a tendency to be utilized to keep the energy supplyon par with the demand of the country. This opinion is based on the proper buildout of alterationzones and fumaroles across the country, the presence of hot springs, and the signs of quaternaryvolcanism [90]. Unfortunately, there is no installed geothermal power plant in the country, making thissector the least exploited among all of the other energy resources.
Energies 2018, 11, 2431 21 of 49Energies 2018, 11, x FOR PEER REVIEW 21 of 53
Figure 17. Geothermal installed capacity around the world. (1.96”, 1.96).
In Pakistan, geothermal areas are classified into three main zones: the Chaghi volcanic arc, Himalayan collision zone, and Indus basin margin zone, as seen in Figure 18 [91]. The surface hot water of the Himalayan collision zone has a temperature of 90 °C. In the southernmost area of foredeep, the gas and Giandari oil reservoir have a peculiarly elevated thermal gradient i.e., 4.1 °C/100 m. Similarly, high gradients of about 3.0–3.49 /100 m have been recorded at the gas and oil wells of Mart and Sui. Thermal springs are present in Uch and GarmAb, which are located at the base of Bakkur, Taunsa, Mari Hills, and ZindaPir, and can serve as geothermal energy. Talking about the Indus basin zone, the gas and oil fields of Lakhra in the south Kirthar zone also shows a high thermal gradient of 3.3 °C/100 m, while those of Sari and Karachi have a geothermal gradient of 3 °C/100 m. A cluster of hot springs is present in ManghoPir and the Karsaaz area of Karachi, presenting a potential of geothermal energy. The volcanic arc in the Chaghi zone has less thermal springs than the other two zones, which are linked with the Sinjrani volcanics of Koh-i-Sultan [91,92]. Depending upon the temperature ranges, geothermal resources can be divided into categories for application, which are shown in Table 13 [93].
As mentioned earlier, Pakistan has not exploited much of its geothermal potential. Less than 10% of hot springs waters are utilized for residential and commercial purposes on a very small scale. All of the remaining spring water becomes a part of rivers and the sewer system without being used [94]. The apparent reason for not capitalizing on the geothermal resources in Pakistan is lack of data [92], which can be countered with detailed geological analysis by the use of new technologies. Currently, research is being done in the domain of Hard Dry Rock (HDR) geothermal energy, which has shown promising results, but still more detailed geoscientific information is required in order to implement it [95].
Figure 17. Geothermal installed capacity around the world. (1.96”, 1.96).
In Pakistan, geothermal areas are classified into three main zones: the Chaghi volcanic arc,Himalayan collision zone, and Indus basin margin zone, as seen in Figure 18 [91]. The surface hotwater of the Himalayan collision zone has a temperature of 90 ◦C. In the southernmost area of foredeep,the gas and Giandari oil reservoir have a peculiarly elevated thermal gradient i.e., 4.1 ◦C/100 m.Similarly, high gradients of about 3.0–3.49/100 m have been recorded at the gas and oil wells of Martand Sui. Thermal springs are present in Uch and GarmAb, which are located at the base of Bakkur,Taunsa, Mari Hills, and ZindaPir, and can serve as geothermal energy. Talking about the Indus basinzone, the gas and oil fields of Lakhra in the south Kirthar zone also shows a high thermal gradient of3.3 ◦C/100 m, while those of Sari and Karachi have a geothermal gradient of 3 ◦C/100 m. A clusterof hot springs is present in ManghoPir and the Karsaaz area of Karachi, presenting a potential ofgeothermal energy. The volcanic arc in the Chaghi zone has less thermal springs than the other twozones, which are linked with the Sinjrani volcanics of Koh-i-Sultan [91,92]. Depending upon thetemperature ranges, geothermal resources can be divided into categories for application, which areshown in Table 13 [93].
As mentioned earlier, Pakistan has not exploited much of its geothermal potential. Less than 10%of hot springs waters are utilized for residential and commercial purposes on a very small scale. All ofthe remaining spring water becomes a part of rivers and the sewer system without being used [94].The apparent reason for not capitalizing on the geothermal resources in Pakistan is lack of data [92],which can be countered with detailed geological analysis by the use of new technologies. Currently,research is being done in the domain of Hard Dry Rock (HDR) geothermal energy, which has shownpromising results, but still more detailed geoscientific information is required in order to implementit [95].
Energies 2018, 11, 2431 22 of 49Energies 2018, 11, x FOR PEER REVIEW 22 of 53
Figure 18. Map showing areas of geothermal activity and some important geological and tectonic features of Pakistan. (1.96”, 1.96).
Table 13. Applications for the geothermal resources of Pakistan.
Location Resource Type Temperature Applications
Chaghi Hydro
Geothermal 200–300 °C
• Flash and dry steam power plant • Hydrogen production
Mutazabad Hydro
Geothermal 185–230 °C
• Binary power plant • Ethanol, biofuels production
Tatta Pani, Tato, Kotli Hydro
Geothermal 100–200 °C
• Binary power plant • Fabric drying • Refrigeration and ice making • Lumber drying • Cement and aggregate drying • Heating, ventilation and air
conditioning HVAC • Pulp drying
Karachi Hydro
Geothermal 70–145 °C
• Pulp and paper processing • Fruit and vegetable drying • Soft drink carbonation • Green housing • Food processing • Concrete block curing
Chakwal Hydro
Geothermal 60–90 °C
• Aqua culture • Mushroom culture • Biogas production • Heat pump HVAC
2.7. Biomass Power Source
Biomass, being the fourth biggest global energy resource, offers 10% of the world’s primary energy, and can be gaseous, liquid, or solid phase. It comprises various crop remains from agriculture, forest residues, ordure, and industrial and municipal waste. In 2011, the total installed capacity of biomass-based energy rose to 72 GW due to a 9% increase in electricity generation [96].
Pakistan can take advantage of being a large producer of many crops such as sugarcane, wheat, rice, cotton, oilseeds, grains, and pulses, by extracting biomass and biofuels from their leftovers, while
Figure 18. Map showing areas of geothermal activity and some important geological and tectonicfeatures of Pakistan. (1.96”, 1.96).
Table 13. Applications for the geothermal resources of Pakistan.
Location Resource Type Temperature Applications
Chaghi Hydro Geothermal 200–300 ◦C• Flash and dry steam power plant• Hydrogen production
Mutazabad Hydro Geothermal 185–230 ◦C• Binary power plant• Ethanol, biofuels production
• Binary power plant• Fabric drying• Refrigeration and ice making• Lumber drying• Cement and aggregate drying• Heating, ventilation and air
conditioning HVAC• Pulp drying
Karachi Hydro Geothermal 70–145 ◦C
• Pulp and paper processing• Fruit and vegetable drying• Soft drink carbonation• Green housing• Food processing• Concrete block curing
Chakwal Hydro Geothermal 60–90 ◦C
• Aqua culture• Mushroom culture• Biogas production• Heat pump HVAC
2.7. Biomass Power Source
Biomass, being the fourth biggest global energy resource, offers 10% of the world’s primaryenergy, and can be gaseous, liquid, or solid phase. It comprises various crop remains from agriculture,forest residues, ordure, and industrial and municipal waste. In 2011, the total installed capacity ofbiomass-based energy rose to 72 GW due to a 9% increase in electricity generation [96].
Energies 2018, 11, 2431 23 of 49
Pakistan can take advantage of being a large producer of many crops such as sugarcane, wheat,rice, cotton, oilseeds, grains, and pulses, by extracting biomass and biofuels from their leftovers, whilein parallel providing for the food demand without any extra cost. Also, Pakistan has an immensecapability of bagasse utilization for power production, since the country is the fifth largest sugarcaneproducer [97]. Unfortunately, this beneficial and existing renewable resource has not yet been optimallyused in Pakistan. According to statistics performed by the United Nations in 2015, bagasse productionper annum was 19,886 metric tons in Pakistan [84].
During 2015–2016, there was an increase of about 63 MW in the generation of power frombagasse-based power plants, for a total of about 146 MW in the NTDC’s system. The energy generatedby bagasse-based power plants during the FY 2015–2016 has been noted as 547 GWh [21].
3. Biomass Resources Potential in Pakistan
Biomass potential has been endorsed worldwide such that many countries have implementedand used biomass for energy production. Table 14 shows biomass resources, their possible utilization,and technologies for conversions. A comparison between the biomass potential of various countriesand production has been made in Table 15.
Table 14. Biomass resources, their possible utilization, and technologies for conversions.
Biomass Resource Present UtilizationPotential
ConversionTechnology
Potential End-Use asan Energy Product Reference
Wheat straw Paper products, domesticheating Gasification
Off-grid electricitygeneration, Synthetic
Natural Gas SNG[98]
Rice husk Pet food fiber, making ofactivated carbon, fuel
Gasification andcombustion
substitute householdenergy, off-grid energy
generation[99]
Bagasse fuel and bioethanolproduction
Fermentation andhydrolysis Renewable motor fuel [100]
Poultry/cowmanure
Biogas and fertilizerproduction
Composting,fermentation
Biogas, household fuel,methane [97]
Forestry residuesand wood
Fuel, biomass production,fertilizer
Grinding andsaw-milling Fuel wood [101]
Municipal solidwaste
Strengthening concrete,Bottom ash production
Pyrolysis, sieving,combustion
Methanol, methaneand syn gasproduction
[15]
Table 15. Biomass production and energy potential in various countries.
Sr. No Countries Biomass Production Mt Yr–1 Biomass EnergyPotential References
1 Nigeria 145.62 1958.94 *PJ [102]2 Turkey 526 (2010) 16,920 ktoe [22,103]3 Malaysia 160 16,920 [22]4 China 57.4 *TWh 14,888 [104,105]5 Bangladesh 80.4 3447 estimated value [106]6 Pakistan 95.3 KWh billion 91,772 *ktoe [101,107]7 Jordan 5.83 313.14 *MCM [108]8 World 493 *TWh 573 *EJ [29,107,109]
*PJ: Petajoule, *TWh: terawatt-hour, *Ktoe: kilotonne of oil equivalent, *MCM: Million cubic meters, *EJ: Exajoule.
Pakistan has an abundant amount of waste produced in the form of bagasse, poultry waste, andmunicipal waste. This paper will highlight the importance of the potential usage of these wastes asbiomass energy sources [110–112].
Energies 2018, 11, 2431 24 of 49
3.1. Bagasse
The industrial refinement process of sugarcane produces by-products along with sugar thatinclude molasses, press cake, and bagasse, which make up 40% of the weight out of the total crushedsugarcane. It has been observed that each ton of processed sugarcane produces 200–300 kg ofbagasse [113,114]. Therefore, to cope with the energy requirements and produce surplus electricity,a continuous refinement process is desirable, thereby contributing as a renewable resource [110,111,115].Generally, 0.173 tons of oil (about $80/ton) and 0.263 tons of coal (about $55/ton) are comparable to oneton (about $15/ton) of bagasse [116]. The cogeneration plant is often located near the sugar industryto save the environment from dust pollution that could otherwise be caused during transportation.Relative to the combustion of fossil fuels, cogeneration effectively lowers the production of greenhousegases. It is advisable that bagasse is used for the cogeneration because if it is not used, it starts decayingby itself and producing methane gas, which is 27 degrees more hazardous for the ozone layer thanCO2 [117].
Pakistan is a large sugarcane producer, with several mills of sugar located in Punjab and Sindh.Pakistan has a potential of about 3000 MW or even more power production from sugar mills, as shownin Figure 19 [83]. Unfortunately, the available bagasse resource has not been optimally employed dueto technological constraints such as the low-pressure boilers and low-efficiency steam turbines thatbound the sufficient amount of electricity production, so it can only meet the mill’s own demand [118].
8 World 493 *TWh 573 *EJ [29,107,109] *PJ: Petajoule, *TWh: terawatt-hour, * Ktoe: kilotonne of oil equivalent, *MCM: Million cubic meters, *EJ: Exajoule.
Pakistan has an abundant amount of waste produced in the form of bagasse, poultry waste, and municipal waste. This paper will highlight the importance of the potential usage of these wastes as biomass energy sources [110–112].
3.1. Bagasse
The industrial refinement process of sugarcane produces by-products along with sugar that include molasses, press cake, and bagasse, which make up 40% of the weight out of the total crushed sugarcane. It has been observed that each ton of processed sugarcane produces 200–300 kg of bagasse [113,114]. Therefore, to cope with the energy requirements and produce surplus electricity, a continuous refinement process is desirable, thereby contributing as a renewable resource [110,111,115]. Generally, 0.173 tons of oil (about $80/ton) and 0.263 tons of coal (about $55/ton) are comparable to one ton (about $15/ton) of bagasse [116]. The cogeneration plant is often located near the sugar industry to save the environment from dust pollution that could otherwise be caused during transportation. Relative to the combustion of fossil fuels, cogeneration effectively lowers the production of greenhouse gases. It is advisable that bagasse is used for the cogeneration because if it is not used, it starts decaying by itself and producing methane gas, which is 27 degrees more hazardous for the ozone layer than CO2 [117].
Pakistan is a large sugarcane producer, with several mills of sugar located in Punjab and Sindh. Pakistan has a potential of about 3000 MW or even more power production from sugar mills, as shown in Figure 19 [83]. Unfortunately, the available bagasse resource has not been optimally employed due to technological constraints such as the low-pressure boilers and low-efficiency steam turbines that bound the sufficient amount of electricity production, so it can only meet the mill’s own demand [118].
Figure 19. Bagasse yield per annum in Pakistan from 1990–2015.
Ventures for biomass visions in Pakistan have been promised by PCRET [14]. The significance and necessity of bagasse-based fuels in the country have also been emphasized by the AEDB [119]. Some crucial steps have been taken by the National Electric Power Regulatory Authority (NEPRA) to determine the tariff for future power projects based on bagasse-based cogeneration to intrigue customers and investors [120].
0
5000
10000
15000
20000
1990
/1/1
1991
/1/1
1992
/1/1
1993
/1/1
1994
/1/1
1995
/1/1
1996
/1/1
1997
/1/1
1998
/1/1
1999
/1/1
2000
/1/1
2001
/1/1
2002
/1/1
2003
/1/1
2004
/1/1
2005
/1/1
2006
/1/1
2007
/1/1
2008
/1/1
2009
/1/1
2010
/1/1
2011
/1/1
2012
/1/1
2013
/1/1
2014
/1/1
2015
/1/1
Annual Yield of Bagasse in Pakistan (metric tons, thousand)
Figure 19. Bagasse yield per annum in Pakistan from 1990–2015.
Ventures for biomass visions in Pakistan have been promised by PCRET [14]. The significanceand necessity of bagasse-based fuels in the country have also been emphasized by the AEDB [119].Some crucial steps have been taken by the National Electric Power Regulatory Authority (NEPRA)to determine the tariff for future power projects based on bagasse-based cogeneration to intriguecustomers and investors [120].
3.2. Poultry Waste
Pakistan has a well-established industry of poultry [112]. The GoP renounced sales and incometax import amenities, making the poultry business successfully operational in the market. As of now,the poultry industry shares 1.26% and 5.76% of the complete gross domestic product (GDP) and totalproduction from agriculture, respectively [121].
To date, Pakistan has more than 25,000 poultry farms striving to fulfil the country’s proteindemand in the forms of eggs, meat, and for the further reproduction of poultry animals, andthis number is continuously rising. Consequently, a tremendous volume of poultry waste is leftover [121,122]. Organic matter from poultry waste is not consumed in any productive way, and isusually pronounced as waste [123], but in reality, it is an advantageous source of energy with vast
Energies 2018, 11, 2431 25 of 49
applications [124–127]. Biogas generation can be carried out with organic matter such as feathers, blood,manure, and spilled feed, which can be utilized for electricity generation [128,129]. The anaerobicdigestion process of poultry waste produces biogas [123,130]. Anaerobic digestion also produces anutrient rich by-product called biodigestate, which can be consumed as a fertilizer [131].
Pakistan can make use of the factory’s process flow diagram to generate power using poultrywaste, as shown in Figure 20. From 2011 to 2015, the amount of poultry waste produced has beenreported in Figure 21. A huge amount of manure, feathers, feet, blood, spilled feed, and otherinedible organs are disposed of. Proper poultry waste management using biomass energy conversiontechnologies could guarantee approximately 10,335 m3 of biogas, which in turn would be capable ofgenerating about 300 MWh per day. The conversion process from poultry waste to biogas also leavesbiodigestate as a by-product, which could serve as a biofertilizer [132].
Energies 2018, 11, x FOR PEER REVIEW 25 of 53
3.2. Poultry Waste
Pakistan has a well-established industry of poultry [112]. The GoP renounced sales and income tax import amenities, making the poultry business successfully operational in the market. As of now, the poultry industry shares 1.26% and 5.76% of the complete gross domestic product (GDP) and total production from agriculture, respectively [121].
To date, Pakistan has more than 25,000 poultry farms striving to fulfil the country’s protein demand in the forms of eggs, meat, and for the further reproduction of poultry animals, and this number is continuously rising. Consequently, a tremendous volume of poultry waste is left over [121,122]. Organic matter from poultry waste is not consumed in any productive way, and is usually pronounced as waste [123], but in reality, it is an advantageous source of energy with vast applications [124–127]. Biogas generation can be carried out with organic matter such as feathers, blood, manure, and spilled feed, which can be utilized for electricity generation [128,129]. The anaerobic digestion process of poultry waste produces biogas [123,130]. Anaerobic digestion also produces a nutrient rich by-product called biodigestate, which can be consumed as a fertilizer [131].
Pakistan can make use of the factory’s process flow diagram to generate power using poultry waste, as shown in Figure 20. From 2011 to 2015, the amount of poultry waste produced has been reported in Figure 21. A huge amount of manure, feathers, feet, blood, spilled feed, and other inedible organs are disposed of. Proper poultry waste management using biomass energy conversion technologies could guarantee approximately 10,335 m3 of biogas, which in turn would be capable of generating about 300 MWh per day. The conversion process from poultry waste to biogas also leaves biodigestate as a by-product, which could serve as a biofertilizer [132].
Figure 20. Factory’s process flow diagram to generate power using poultry waste.
PoultryWater
Delivery
WastewaterManure
Odor
ElectricityWater
Stunning
Wastewater
Bleeding
Blood
WaterElectricity/
SteamCompressed Air
Scalding & De-feathering
FeathersWastewater
Heads & Feet
ElectricityWater
Evisceration
(Visible GibletsInedible Offal)Wash Water
Odor
RefrigerantsWater
IceElectricity
Cooling & Chilling
Wastewater
Packaging Materials
Packaging
Packaging WasteBones
TrimmingsFinished Product
INPU
TS
PRO
CESS
O
UTP
UTS
Figure 20. Factory’s process flow diagram to generate power using poultry waste.Energies 2018, 11, x FOR PEER REVIEW 26 of 53
Figure 21. Waste produced in the poultry farms from 2011 to 2015.
3.3. Municipal Waste
Anything that is regarded as useless, worthless, or in excess is called waste. All of the waste gathered from domestic, commercial, and industrial sources by private and public authorities is called municipal solid waste (MSW) [133]. A waste-management process and the relevant systems are organized programs that are established for the disposal of waste, recycling, reuse, composting, and incineration. They are also an important way to conserve resources and protect the environment [134]. In underdeveloped and developing countries, MSW is an extremely ignored factor [135]. Environmental pollution and health hazards are a result of the poor management of waste [136]. The burden of emissions and resources depletion that is placed on the environment can be highly reduced by appropriate waste management strategies [137,138]. Biogenic MSW is considered a source for renewable energy by the United States (US) Environmental Protection Agency because it would otherwise be dumped into landfills [139].
In Pakistan, millions of tons of diverse kinds of wastes are produced annually that pose health and other environmental hazards. Even though the private and public sectors have been long conscious of the waste disposal crisis, they are unacquainted with the possible use of MSW for electricity production to reduce the country’s power crisis. In Pakistan, a significant barrier to the promotion of such renewable energy projects is the deprivation of the suitable recognition of the management of diverse waste types and associated power production technologies [140]. For 2014 and 2016, the amount of waste produced in Pakistan’s foremost cities are shown in Table 16, demonstrating that a gross total of 32.3 megatons (MT) per year is generated [141].
Table 16. Quantity of municipal solid waste (MSW) generated in the major cities of Pakistan in 2014 and 2016.
City Corporation
2014 2016
Population
(Million)
Generation
Rate
(kg/Capita/
Day)
Total
Quantity
(MT/Year)
Population
(Million)
Generation
Rate
(kg/Capita/
Day)
Total
Quantity
(MT/Year)
Karachi 14 0.572 2.92 22.825 0.572 4.765
Figure 21. Waste produced in the poultry farms from 2011 to 2015.
3.3. Municipal Waste
Anything that is regarded as useless, worthless, or in excess is called waste. All of the wastegathered from domestic, commercial, and industrial sources by private and public authoritiesis called municipal solid waste (MSW) [133]. A waste-management process and the relevant
Energies 2018, 11, 2431 26 of 49
systems are organized programs that are established for the disposal of waste, recycling, reuse,composting, and incineration. They are also an important way to conserve resources and protectthe environment [134]. In underdeveloped and developing countries, MSW is an extremely ignoredfactor [135]. Environmental pollution and health hazards are a result of the poor management ofwaste [136]. The burden of emissions and resources depletion that is placed on the environment can behighly reduced by appropriate waste management strategies [137,138]. Biogenic MSW is considered asource for renewable energy by the United States (US) Environmental Protection Agency because itwould otherwise be dumped into landfills [139].
In Pakistan, millions of tons of diverse kinds of wastes are produced annually that pose health andother environmental hazards. Even though the private and public sectors have been long consciousof the waste disposal crisis, they are unacquainted with the possible use of MSW for electricityproduction to reduce the country’s power crisis. In Pakistan, a significant barrier to the promotionof such renewable energy projects is the deprivation of the suitable recognition of the managementof diverse waste types and associated power production technologies [140]. For 2014 and 2016,the amount of waste produced in Pakistan’s foremost cities are shown in Table 16, demonstrating thata gross total of 32.3 megatons (MT) per year is generated [141].
Table 16. Quantity of municipal solid waste (MSW) generated in the major cities of Pakistan in 2014and 2016.
Hazardous waste 0 0 0 0 1.538Gross total 5.316 32.3
Figure 22 shows that the use of biochemical processes of MSW will cause a reduction from 0.1%to 0.03% in the share of imported electricity [50]. The energy attained by the biochemical processingof MSW may contribute up to 0.07%. The thermal chemical processing of MSW contributes 0.34%,whereas the contribution of gas, oil, nuclear and hydro, and coal are 46.74%, 34.34%, 13.14%, and5.34%, respectively, as shown in Figure 22. The share of supply from gas, nuclear and hydro, oil, andcoal can be reduced to 0.13%, 0.17%, 0.45%, and 1.11%, respectively, with the treatment of MSW withthermal chemical processing. The dependency on imported energy will be reduced by using energyfrom treated MSW [141,142]. Hence, an improved environment and development of the economy alsorely on waste to energy conversion, along with other factors.
Energies 2018, 11, 2431 27 of 49
Energies 2018, 11, x FOR PEER REVIEW 28 of 53
Figure 22. Biomass/MSW contribution in total energy supply.
4. Current and Future Scenarios of Biomass Applications in Pakistan
This section discusses the current and future elements involved in the biomass applications in Pakistan. Different energy consumption sectors have been discussed in terms of biomass power source applications.
4.1. Power Production
Biomass is considered to have great capabilities as an important and available renewable energy source for developed, developing, and underdeveloped cTuntries. Pakistan is still in the experimental stage for using biomass for power production. In the NTDC’s system, an increase in power generation of about 63 MW for a total of about 146 MW from bagasse-based power plants has been observed during 2015–2016, having 547 GWh of energy. Three companies with an aggregate capacity of 99.0 MW applied during this span for the complete approval of an upfront tariff for bagasse-based power production schemes, as mentioned in Table 17 [21].
Pakistan lacked any biomass/bagasse-based power plants until 2014. Power stations, namely Jamal Din Wali-II, Jamal Wali-III, and Rahim Yar Khan Mills, which are located in Rahim Yar Khan (Punjab), started their operation from 2015, and Chiniot Power, which is located in Chiniot (Punjab), started its operation from 2016. The installed capacity in MW and electricity generation in gigawatt hours GWh, as recorded on 30 June 2016, have been listed in Table 18 [21].
According to the NEPRA 2016 state of industry report, the estimated costs and commercial operation dates (COD) of in-operation and under construction biomass energy projects are shown in Table 19, whereas those for future biomass/bagasse projects are shown in Table 20, in which most of the projects are in the Letter of Intent stage, and will probably be completed by the end of 2018 [21]. According to the Renewable Energy Policy of 2006, various electricity generation projects involving biomass/bagasse were given licenses for generation, keeping in view their fuel type and technology. Table 21 shows a list of generation licensees for bagasse/biomass. These projects are majorly based on bagasse fuel, and their technologies make use of steam turbines. In Pakistan, the companies that are captive power producers (CPPs) using biomass/bagasse are 35 in number. Shakarganj Energy (Pvt.) Limited is the only Isolated Generation Company (IGC) for energy production using biomass [21].
Figure 22. Biomass/MSW contribution in total energy supply.
4. Current and Future Scenarios of Biomass Applications in Pakistan
This section discusses the current and future elements involved in the biomass applicationsin Pakistan. Different energy consumption sectors have been discussed in terms of biomass powersource applications.
4.1. Power Production
Biomass is considered to have great capabilities as an important and available renewable energysource for developed, developing, and underdeveloped cTuntries. Pakistan is still in the experimentalstage for using biomass for power production. In the NTDC’s system, an increase in power generationof about 63 MW for a total of about 146 MW from bagasse-based power plants has been observedduring 2015–2016, having 547 GWh of energy. Three companies with an aggregate capacity of 99.0 MWapplied during this span for the complete approval of an upfront tariff for bagasse-based powerproduction schemes, as mentioned in Table 17 [21].
Pakistan lacked any biomass/bagasse-based power plants until 2014. Power stations, namelyJamal Din Wali-II, Jamal Wali-III, and Rahim Yar Khan Mills, which are located in Rahim Yar Khan(Punjab), started their operation from 2015, and Chiniot Power, which is located in Chiniot (Punjab),started its operation from 2016. The installed capacity in MW and electricity generation in gigawatthours GWh, as recorded on 30 June 2016, have been listed in Table 18 [21].
According to the NEPRA 2016 state of industry report, the estimated costs and commercialoperation dates (COD) of in-operation and under construction biomass energy projects are shown inTable 19, whereas those for future biomass/bagasse projects are shown in Table 20, in which most ofthe projects are in the Letter of Intent stage, and will probably be completed by the end of 2018 [21].According to the Renewable Energy Policy of 2006, various electricity generation projects involvingbiomass/bagasse were given licenses for generation, keeping in view their fuel type and technology.Table 21 shows a list of generation licensees for bagasse/biomass. These projects are majorly based onbagasse fuel, and their technologies make use of steam turbines. In Pakistan, the companies that arecaptive power producers (CPPs) using biomass/bagasse are 35 in number. Shakarganj Energy (Pvt.)Limited is the only Isolated Generation Company (IGC) for energy production using biomass [21].
Energies 2018, 11, 2431 28 of 49
Table 17. Upfront tariff for new bagasse-based cogeneration projects in Pakistan.
Table 19. Status of existing projects (in operation and under construction).
Sr. No. Name of Project Capacity(MW)
COD/ExpectedCOD
Estimated Cost(US $ Million) Status
1. JDW Sugar Mills Limited(Unit-II) 26.35 June 2014 26.26 Operational
2. JDW Sugar Mills Limited(Unit-III) 26.35 October 2014 26.26 Operational
3. Chiniot Power Limited 62.40 November 2014 62.19 Operational4. RYK Mills Limited 30 March 2015 29.90 Operational5. Hamza Sugar Mills Limited 15 — 14.95 Under Construction
Table 20. Future biomass/bagasse-based projects.
Sr. No. Name of Project Capacity(MW)
COD/ExpectedCOD
Estimated Cost(US $ Million) Status
1. Layyah Sugar Mills Limited 41 2017 40.86 EPA/IA Signed2. Alliance Sugar Mills Limited 30 2017 29.90 LOI Stage3. Safina Sugar Mills Limited 20 2017 19.93 LOI Stage4. Almoiz Industries Limited 36 2017 35.88 LOI Stage5. Etihad Power Generation Limited 76.40 2017 76.13 LOI Stage6. Shahtai Sugar Mills Limited 32 2017 31.89 LOI Stage7. Chinar Energy Limited 22 2017 21.93 LOI Stage8. RYK Energy Limited 25 2018 24.92 LOI Stage9. Sheikhoo Power Limited 30 2018 29.90 LOI Stage10. Indus Energy Limited 31 2018 30.89 LOI Stage11. Hamza Sugar Mills Limited (Unit-II) 30 2018 29.90 LOI Stage12. Hunza Power (Pvt.) Limited 49.80 2018 49.63 LOI Stage13. Bahawalpur Energy Limited 31.20 2018 31.09 LOI Stage14. Mirpur Khas Energy Limited 26 2018 25.91 LOI Stage15. Faran Power (Pvt.) Limited 26.50 2018 26.45 LOI Stage16. Ittefaq Power (Pvt.) Limited 31.20 2018 31.09 LOI Stage17. Mehran Energy Limited 26.50 2018 26.41 LOI Stage18. Lumen Energia 12 2018 22.62 LOI Stage
Energies 2018, 11, 2431 29 of 49
Table 21. List of generation licensees bagasse/biomass power projects under the renewable energypolicy of 2006.
Sr. No. Company and Location Installed Capacity(MW) Fuel Type Technology
Industries running on fossil fuels are one of the main sources of environmental pollution. Biofuelshave been recommended as substitutes that can guarantee the security of fuel and reduce levels ofgreenhouse gas production. All of the regions in the world can obtain these benefits, which wouldresult in a reduction of air pollution, as well as improvements in the quality and freshness of air,rendering the good health of the citizens. A country cannot prosper without a long-lasting powersupply to its industries, since the economy depends upon the prosperity of its industries.
Pakistan, even though it is an energy-thirsty nation, still has a lot of potential to run its industriesby producing its own biomass-based fuel, because its economy is mostly dependent on agriculture [143].This fuel would provide an alternative to the huge expenditure of importing fossil fuels from foreigncountries [40].
Ethanol and bagasse production from sugar are used as fuels to suffice the heat productionrequirements in industries. During the last 10 years, the viability of bagasse based-biofuel hasbeen observed and adopted by many countries of the world. For example, in Australia andBrazil, cogeneration is done for heating furnaces and boilers, and it is also sufficient for electricityproduction [110]. In sugar mills, bagasse serves as energy fuel for firing boilers to heat the juice.In some industries, it is employed to yield medium-density fiberboard, which serves as an alternatefor natural wood [144].
4.3. Biomass in Transportation as Fuel Source
Reliance of the world on fossil fuels for transportation is currently inevitable. Biofuels andbioethanol are undisputed issues in the World Trade Organization (WTO). A very small number ofenergy-producing countries that have membership in the WTO have never rightly investigated and
Energies 2018, 11, 2431 30 of 49
considered energy concerns, because biofuels constitute a small percentage of the world’s energysupply. Biodiesel is still considered an industrial product, but there is an ambiguity regardingbioethanol for its uses, and it is classified as an agricultural product by the WTO. There are twotypes of biofuels according to different classification methods, i.e., bioethanol and biodiesel, becausethey are manufactured from an extensive range of materials [145].
Sweden is the world’s leader in the use of biomass resources for transportation by modifyingbiogas to biomethane. Several biogas-based light and heavy vehicles from cars to trains can be foundrunning throughout the country [146]. Dramatic developments have been observed worldwide, e.g.,in Europe, 30% of cars are now diesel-based, which consumes 2/3 times less fuel than petrol-basedcars. The US and Brazil have massively increased the production of ethanol and biodiesel [117].
Transportation by road, being the spine of the transport system of Pakistan, has 90% and96% of the passenger traffic and cargo movement of the country, respectively. In the period from2010–2015, transport fuel consumption increased at 16.5% of the aggregate growth rate, whereas theincrease in the cumulative growth rate for the rest of energy consumption of the country was 4.7%.The energy consumption for the transport sector in 2015 was 32.4% (13.6 MTOE) of the total country’sconsumption [147]. Pakistan produces just 18% of the total fuel using its own resources, while the restof the 82% demand is fulfilled through imports [148].
Transportation utilizes about 50% of the country’s oil ingestion, and in 2011–2012, a rise of 5.3% inthis consumption was observed [120]. The transportation system of Pakistan has vehicles with enginesthat feed on liquefied petroleum gas, natural gas, jet fuel, high-speed diesel, and gasoline. The massiveexploitation of natural gas reserves that were discovered in 1952, in the form of Compressed NaturalGas CNG, has outstretched concerns over its sustainable future [142].
Pakistan’s situation cannot directly relate to the international biofuel developments, becausePakistan’s biofuels have their own particular features that have only recently started to becomeunderstood. Vehicle efficiency and performance has been greatly increased by the use of bioethanolin recent years. It also reduces greenhouse gaseous emissions from vehicles [149]. Lower particulateemissions are also less harmful for health. Ongoing backing in research, development, and productionis vital to identify the transition trails by which future biofuel systems will start their evolution withan excellent structure of technology and policy changes.
A crucial concern for the biofuel industry is sustainability. If biomass is used as a transport fuel,then it would create a big demand on biomass, which must be produced in a sustainable manner. In thefuture, biofuel could be a potential market advantage if Pakistan improves its capacity to produce fuelthat can be qualified as ‘sustainably produced’.
5. Discussion and Recommendations
The current scenario regarding the power deficit in Pakistan calls for some immediate steps toovercome this shortfall. The major and foremost problems that have been continuously hinderingPakistan’s power sector growth have been listed in Table 22. Their probable and prime reasons,along with their direct consequences, have also been summarized as follows. The problem of theunderutilization of the power plants’ capacities is caused by their poor maintenance and the deliberate,reluctant behavior of the authorities in full capacity operation. Strict regulatory policies should bedevised so that the power plants are compelled to be properly maintained and produce electricityto their full capacity. Pakistan does not have an adequate number of power plants, and the existingones are less efficient than they should be. Consequently, the undersupply of electricity occurs, andto overcome this problem, investments in efficient-energy projects should be made. The financialproblem persists in the energy sector. Hence, wise decisions should be incorporated in those resourcesthat will benefit the energy sector. The new projects face large procedural delays, increasing the overallbudget of the project and again causing financial instability. Thus, such delays should be eliminatedcompletely by strict policies that are not affected by any political situation. Technical difficulty handlingin power plants should be strengthened to avoid huge blackouts and equipment failure through the
Energies 2018, 11, 2431 31 of 49
establishment of institutions that train the work force. High auxiliary power is used, which causeshigh heat rates and loss of energy. Hence, cogeneration based on renewable energies should also beimplemented by exploring new resources. Pakistan suffers from an exploration problem due to a lackof awareness in the society about the potential of renewable energy resources. Also, research anddevelopment should be encouraged and done at larger scales to facilitate exploration by governmentfunding. The quality of the power produced by power plants is not up to the mark due to inefficienttransmission and distribution networks that have incorporated poor circuit designs and inefficientcircuit components. Theft and leakages also play a role in the degradation of the quality of power inthe grid, which ultimately leads to low-voltage issues. The low-frequency noise from such a setupalso causes health issues. Smart grid systems should be deployed to track down the energy utilization,which will help eliminate power theft. The International Electrotechnical Commission rules—andother rules—must be followed in order to ensure power quality [150,151]. At the end of this study,suggestions have been given that can help overcome those issues.
Although the major energy contribution to date comes from conventional sources (i.e., 65% fromthermal [49]) in Pakistan, the risk involved with these sources is compelling us to shift the energyparadigm toward renewable sources. The first and foremost step on this road is to develop plans andpolicies so that the utilization of renewable energy can be enhanced. Integrated energy policies shouldbe formulated to find new ventures in the renewable regime and improve the capacity of existingplants, whose chief features should be as follows:
1. National Security of Energy
This feature has been elaborated in Table 23, which covers the potential expansion of the use ofcoal found in the Thar Desert, the exploitation of shale gas and oil, the exploitation of solar, wind,and biomass potential, and the encouragement of hydropower projects based on storage. It showsits importance for Pakistan in becoming self-sufficient regarding energy and minimizing problemsregarding payment balancing.
2. Deep Rooted Sustainability of Environment
The share of the power sector in global emissions is 25%, while a 75% overall share comesfrom the agriculture, transportation, residential, commercial and industrial sectors. For deep-rootedenvironmental sustainability, the following measures should be taken:
• All of the sectors of Pakistan should strive to be on par with the internationalenvironmental standards.
• To guarantee the complete surveillance of all of the emission sources, the structure of regulationsfor environmental compliance needs to be revised.
• International Finance Corporation IFC standards for emissions and National Environment QualityStandards NEQS need to be employed in upcoming coal-based projects to control the impact onthe environment by using standard technological interferences. Fortunately, it has been predictedthat Pakistan will have a far lower level of emissions as compared to many other countries.
3. Conservation and Efficiency of Energy
Constant education and awareness are required to transform the outlook of the local populaceregarding energy conservation. Energy-efficiency programs should be started, and grants need to beprovided to establish a system that has efficient vehicles and efficient lighting. The buildings shouldimplement mandatory disclosure codes/regulations and commercialized benchmark laws. Table 24lists the areas where efficient energy and conservation measures can be taken. The energy-efficiencypractices include efficient vehicles i.e., hybrid/electric vehicles, efficient lighting, and efficient buildingcodes [152]. The efficient vehicles convert 25–40% of gasoline into energy, while conventional vehiclesjust convert 17–21% of the fuel into energy, which increases fuel efficiency. Hybrid vehicles do not emitharmful gases, so these should be paid attention to for implementation at a large scale economically.
Energies 2018, 11, 2431 32 of 49
Efficient lighting using Light Emitting Diode LED bulbs give 50–80% more efficiency than alternatebulbs. Efficient building codes can reduce energy footprints while at the same time benefiting theowners and residents economically.
4. Competitive Tariff Establishment
It has been predicted that the upcoming mix of fuel will help lower the fuel cost part of the powertariff. The focus should be to minimize transmission and distribution losses by replacing and/orupgrading the technology that is required for this purpose.
The GoP has planned to develop 5% of its total energy from the renewable sources by2030 [9]. For that, the GoP introduced organizations and institutions that pursue the research anddevelopment of alternate and renewable energy resources. The Pakistan Council of Renewable EnergyTechnologies (PCRET), Center for Energy Research and Development (CERAD), and AlternativeEnergy Development Board (AEDB) are the three main organizations aiming to achieve country’senergy mix with a greater share of renewable energy sources. In addition, the major universities ofPakistan are also participating and playing their part in research regarding the renewable energypotential in Pakistan. Table 25 summarizes the research being carried out in the different universitiesof Pakistan. Regardless of the efforts, there are certain barriers to the implementation of renewableenergy systems in abundance that still need to be overcome. They are as follows:
1. Financial barriers2. Information and technology barriers3. Institutional barriers4. Policy barriers5. Regulatory barriers
While hydropower is contributing almost 31% of the country’s total power production [49],other renewable sources currently have negligible involvement. It has been found that hydropowerbears a great capability to help lift the energy supply up to the demand. Pakistan has the capacityfor large, small, and mini/micro hydropower projects. Each category has its own advantages anddisadvantages, which have been summarized in Table 26. A summary of Table 26 is as follows.Large-scale hydropower projects remain an unfeasible solution in a larger number for Pakistan’scurrent situation, since it is costly in and of itself, even though it supplies many purposes such asirrigation, energy generation, recreation, control of flood, navigation, fishing and supply of water to thepopulation. However, in most cases, its construction costs much more than that because of populationdisplacements and other compensations. Small-scale hydropower projects that are often carried out inhilly areas are harder to scale, and are consequently higher in costs. Above all, their expansion to thenational grid is greatly difficult, being susceptible to losses. Hence, the mountain specifications andfeasibility analysis should be performed with great care. Mini/micro hydropower projects have anadvantage in that they don’t require expansion to the grid, and they come under the decentralizedpower system category. In this case, the costs can be reduced by using efficient components that areoften locally available. They are also best suited for poor and rural areas, which leads to the conclusionthat small hydropower projects, being the most feasible, should be started at various locations allover Pakistan with suitable terrain. The GoP has permitted a 17% internal rate of return to inspire theinstallment of hydel-based projects.
Pakistan is blessed with various landforms such as plains, plateaus, mountains, and coastal areas.Coastal areas act as a hub for wind energy. According to international standards, wind sources inJamshoro are befitting for power generation due to their high speed [1]. Thus, more wind turbinesshould be installed there in order to achieve higher wind generation potential, because Pakistanhas 132 GW of wind power potential, but is only utilizing only 1% of it. Due to firming up theinfrastructure of institutions, three wind farms have been established that are interconnected withthe national grid. They add over 150 MW to the national grid, and further wind projects are near the
Energies 2018, 11, 2431 33 of 49
completion stages. For a quick implementation of wind-based projects, the following recommendationsshould be considered:
1. Maintenance and improvement in the strength of the infrastructure of institutions, as per theincrease in the demand of energy, should be ensured.
2. There should be a fast processing of project proposals, eliminating procedural delays thatultimately cause cost overruns.
3. The usage of latest technologies, and by reducing tariffs, wind power generation can be morerewarding. However, the key challenges of frequency mismatch and lack of grid connectivitymust be addressed on a higher priority.
4. International and private investors should be made aware of and educated regarding the strikingrenewable energy policy put forward in 2011, which holds great incentives for wind powerproject investors.
5. The wind power plants need to operate on a commercial level that can result in a wind powercontribution of 2.6 GW, and thus, the goal of the GoP of attaining a 5% share of renewable energycan be met by 2030.
At present, power generation from solar energy is continuously growing in Pakistan. AlthoughPakistan has an estimated potential of 2.9 Million MW, only 1% is currently being utilized. Governmentof Pakistan can help encourage solar-based projects. Recommendations are as follows [9].
1. Provision of subsidies on PV cells should be ensured.2. Solar cells can be made more feasible by locally producing them, which will eventually reduce
the cost of electricity.3. Awareness should be spread among local communities, and proper technical information should
be available to guide them.4. Peak demand of load can be managed by shifting toward PV-based solar cells. Street lights and
parks can be illuminated by them to shed the load off the grid.5. Since a large area is needed to install PV cells for solar farms, these can be aptly installed in
remote areas of Baluchistan, Sindh, and Punjab to fulfil the energy requirements of the localcommunities. The mountainous regions of the country can be exploited as well, since they get alot of solar radiation for long hours on a daily basis.
Geothermal resources are in abundance in Pakistan, but due to a lack of proper policies and therequired database, they have never been capitalized on a large scale. Consistent and thorough researchand development (R&D) is required to clear pathways for utilizing geothermal potential. It has beenobserved that since Pakistan is situated on tectonic plate junctions, they can offer high, medium, andlow temperature reservoirs for electricity generation. Pakistan has no geothermal power plant yet,so this domain is a blue ocean for Pakistan that thoroughly needs to be brought to the fore.
Biomass-based energy is resourceful, sustainable, cost-effective, socially acceptable, andenvironment friendly alternative for power production [22]. Being a new field, it is in the earlystages of development, and more research is required to get the most out of it. Three major sourcesfor biomass in Pakistan are bagasse, poultry waste, and municipal waste. It has been proven thatbiogas-based plants have less of an environmental impact than PV and wind technologies. Table 27summarizes the analysis of biomass potential in this study. The summary of Table 27 is given asfollows. Bagasse can produce over 3000 MW of power by cogeneration techniques. The use of biomasssources for cogeneration is encouraged because of biomass degradation to environmentally harmfulmethane gas. Poultry waste, if processed and utilized for producing biogas, can generate 300 MWhof energy per day. Similarly, municipal solid waste is also left over in large quantities of 32.3 MT peryear. The associated processing technologies and awareness needs to be raised in all three resources.This potential can be utilized for power production and as a fuel source in industries and transportvehicles, as summarized in Table 28. The summary of Table 28 is given as follows. Up until 2014,
Energies 2018, 11, 2431 34 of 49
Pakistan did not have any biomass-based power generation capability. Afterwards, the potential forbiomass-based power plants was explored, and during 2015–2016, 547 GWh of energy was harvestedfrom such schemes. The capabilities that biomass holds in this regard have started to be acknowledgedin Pakistan. Consequently, more such projects are being launched for power generation. Biomass-basedfuel for transportation and industrial fuel has been known to be more efficient and beneficial for thevehicle performance and the environment as well. Pakistan needs to follow other countries such asSweden that consume biomass-based fuel in their vehicles, so that Pakistan’s expense on importingfuel gets lowered. Although some small biomass-based projects are running in the country, they arestill not capable of producing any big impact. One basic hurdle in adopting biomass-based energysources is a lack of financial and technological support [132], which can be easily overcome with thehelp of public–private partnership.
This study would have been further enhanced if the data related to bagasse, poultry waste, andmunicipal solid waste could be obtained from the major cities of Pakistan by direct survey from relatedorganizations by arranging a field trip. Still, the data has been obtained from recent reliable sources,which suffice to fulfil the objectives of this study.
This study enables examining the state of power and energy harnessed from all of the availableand potential resources in Pakistan. Keeping in view all of the aspects mentioned in this section,it can be deduced because of this study that biomass is the most economical and readily availableresource that can be used to harness energy to generate power and as transportation and industrialfuel. Other renewable resources such as solar, wind, and geothermal resources are too expensiveto set up at a large scale for Pakistan’s current economic situation, even though they have a lot ofpotential. They also require more complex technologies and large manpower for their setup, which inthe case of biomass, is relatively less of a problem. Hence, this comprehensive study may enable thegovernment and investors to make wise decisions about the most suitable resource that, if implementedin upcoming and future projects, will help reduce the supply and demand gap in a minimal timespan. Hence, they may set priorities on the utilization of these resources based on this study for theirfuture investments. In this study, biomass has been found to be that resource which is environmentally,sustainably, and economically the most feasible in solving the power and energy issues, and should beset up as the highest priority for its utilization in all possible aspects.
Energies 2018, 11, 2431 35 of 49
Table 22. Major problems of the power sector of Pakistan: reasons, consequences, and solutions.
Sr. No. Major Problems ofPower Sector of Pakistan Reasons Consequences Suggestions for Solutions References
1Capacities of powerplants are not fully
utilized
1. Poor maintenance ofpower plants
2. Deliberate reluctance in fullyfledged operation ofpower plants
1. Utilization factor per annum is lowered2. Load shedding3. Deficient performance of power plants4. Availability of units is constantly declining5. Higher heat rates are observed than
National Electric Power RegulatoryAuthority (NEPRA)’s approved heat rate
1. Constant and strict performance monitoringby higher authorities.
2. Call for periodic reports from power plantauthorities frequently.
3. Strict policies should be developed to forcethe power plant authorities to ensure fullutilization of capacity.
[1,21,51]
2 Inadequate power supplyrelative to demand
1. Small number ofpower plants
2. Inefficiency of power plants
1. Many factories and industries have beenshut down
2. Pakistan’s economic growth has beennegatively affected
1. Measures should be taken to implyinternational standards to improve theperformance of the grid to minimizeenergy losses.
2. New plants with greater energy capacityand efficiency should be installed.
[9,18]
3 Financing issues
1. Control of the power sectoris centralized
2. Wrong funding priorities3. Circular debt
1. Lack of investments in new andnovel projects
2. Aging and degradation of existing plants3. Unworthy investments leading to
expensive failure4. Higher electricity costs
1. Proper rules and regulations should beincorporated for project financing schemes.
2. Feasibility surveys should be carried outbefore project execution.
3. Risk management should be employedaccording to risk register.
4. Encouragement of private power sectoris necessary.
[4,21,39,51,54]
4 Procedural delays
1. Political situations2. Poor project
management skills3. Deliberate suppression of
approvals by authorities fororganizational benefits
1. Delay in the start of operation ofpower plant
2. Lowering of annual factor of utilization
1. Policies should be such that no politicalsituation can affect the welfare projects.
2. Project should be properly managed byexperienced project managers who strictlyfollow the work breakdown structure ofthe project.
[12,21,54]
5Lack of expertise incatering of technical
difficulties
1. Lack of technical staffwith expertise
2. Lack of availability of jobs insuch areas
1. Switchyard equipment failure2. Large system blackouts
1. Institutions should be developed for specialtraining to cater for the technical faults inpower systems.
2. Job vacancies for capable and intelligentpeople should be increased in thepower sector.
[18,21,48]
Energies 2018, 11, 2431 36 of 49
Table 22. Cont.
Sr. No. Major Problems ofPower Sector of Pakistan Reasons Consequences Suggestions for Solutions References
6 High consumption ofAuxiliary power
1. Poor efficiencies of powergeneration equipment
2. Actual power productioncapacity of the plant is lowerthan the requirement ofauxiliary power.
1. Higher heat rates2. Loss of energy e.g., in 2016, national
exchequer faced financial deterioration dueto overutilization of auxiliary power by TPSGuddu, leading to 121.089 GWh lossof energy.
1. Cogeneration schemes, such asbagasse-based cogeneration, should beemployed to power the auxiliarygeneration equipment.
2. Energy storage-based projects shouldbe installed.
3. Load-balancing schemes shouldbe deployed.
[18,21,30]
7Primitive methods
utilized for electricitygeneration
1. Lack of funds for newpower projects
2. Lack of research andknowledge of new methodsof power generation
3. Lack of equipment andtechnologies for theestablishment of newgeneration methods
4. Lack of policies for alternateenergy power plants
5. Exploration problem
1. Primary energy resources such as oil, coal,and gas are being depleted
2. Greenhouse emission levels are increasing3. Low energy efficiency being obtained from
existing plants e.g., power plant in Uchproduces only a few MW, even though it iscapable of generating 800 MW.
1. Research and development of alternate andrenewable energy resources should bepursued along with their implementation innew power plants.
2. Policies should be updated according to therequirements of alternate and renewableenergy resources such as solar, wind,and biomass.
3. Awareness about the potentials of alternateand renewable resources should bespread nationwide.
[1,9,13,21]
8 Lower power Quality andlow frequency noise
1. Instability of transmissionand distribution grid
2. Power theft3. Leakages4. Technical faults in
manufacturing conductorsand their weakening
5. Poor design of circuitry
1. Low-voltage issue arises2. Transmission circuit’s efficiency is lowered3. Affects human health and causes distress
1. Measures should be taken to improve thetransmission and distribution circuits andequipment such as transformers,transmission lines, spacers, insulators,and dampers.
2. Employment of Smart Grid system that willalso help monitor the overall power systemto avoid theft issues as well along withother benefits.
3. International Electrotechnical Commissionrules along with other standards should befollowed to enhance the quality of power.
[1,4,18,21,39]
Energies 2018, 11, 2431 37 of 49
Table 23. Integrated energy policy regarding the national security of energy.
Sr. No. Potential Discussion/Recommendations
1 Expansion of use of coal found in TharDesert
• Seventh largest reserves of coal aresituated here
• The grade of coal is lignite, and its quantityis 175 billion tons
• This quantity has the potential to serve formore than 100 years with a power generationcapacity of 100,000–200,000 MW
i. To intrigue the private sector to invest,incentives in tariffs and mining shouldbe given
ii. Water should be made available to convertto steam for power generation
2 Exploitation of shale gas and oil
• Shale gas: 105 trillion cubic feet• Shale Oil reserves: 9.1 billion barrels• Efficiency of combined cycle RLNG plants is
60–62% at 6–7 cents/kWh• Assurance of native gas obtainability to
further reduce tariff via search of tight andshale gas should be done.
i. Policy should give incentives for quickpotential growth of tight and shale gas/oil
ii. New areas should be explored
3 Exploitation of solar, wind, and biomasspotential
• Electric vehicles, being more efficient,convert 25–40% of gasoline into energy,while conventional vehicles just convert17–21% fuel into energy
• Hybrid vehicles are fuel-efficient• Electric vehicles cause zero emissions
Pakistan should add electric and hybrid vehiclesin its auto policy along with the deployment of
stations for battery charging
2 Efficient lighting 50–80% more efficiency can be achieved by usingLED bulbs instead of alternate bulbs
There should be no sales and import tax andduties on LED bulbs
3 Efficient building codes
• Reduction of energy footprints• Building owners and residents get
economic benefits
Commercial centers should strictly follow thetimings of business
Table 25. Ongoing research on renewable energy resources and technologies in universities of Pakistan.
Sr. No. University Research Directions
1 Ghulam Ishaq Khan Institute GIK, Toppi, Khyber Pakhtunkhwa KPK Solar cells
2 Government College University, Lahore Biofuel production from biomass
3 Mehran University of Engineering and Technology, Jamshoro Bioenergy
4 National University of Science and Technology (NUST), Islamabad
• Biomass• Electric vehicles• Wind turbines• Solar thermal energy
5 Nadirshaw Eduljee Dinshaw NED University of Engineering &Technology Karachi.
• Solar collectors• Wind turbines
6 Quaid e Awam University of Science and Technology, Nawabshah• Utilization of solar energy• Solar tracker
7 Quaid e Azam university Islamabad Biofuel technology
Energies 2018, 11, 2431 39 of 49
Table 26. Analysis of hydropower potential in Pakistan’s context.
Sr. No. Hydropower ProjectCategory
Factors Deciding theCategory Advantages Disadvantages Discussion and Recommendations
1 Large Requirement of large damsize
Serves numerous purposes.For example
i. Irrigationii. Energy generationiii. Supply of water
to populationiv. Control of floodv. Navigationvi. Fishingvii. Recreation
i. The size of the dam causesthe forced relocations oflocal settlements. Suchobjections have been raisedon the Kalabaghdam project
ii. Costlyiii. Greater construction timeiv. Buildup of sedimentsv. Barrier to fish migrationvi. Decomposition of biomass
releases CH4 and CO2.vii. Technical, social, and
political issues are relatedto them
Considering sustainable development, this scheme is notreliable because of the following reasons:
i. To compensate for population displacement and thedegradation of the environment, there has been ademand that their costs have to be adjusted withupfront costs. Financing is already a problem inPakistan, which renders this scheme as anunreliable option.
ii. If, somehow, arrangements of funds are made by thegovernment, the expenses of resettlements are huge,e.g., $33.2 billion will be spent on the resettlementassociated with the Kalabagh dam through theconstruction of 20 model and 27 extended villages.
2 Small Requirement in hilly areaswith an abundance of
controllable and naturalwaterfalls
i. Cost of equipment, civilwork, and overallestablishment dependsupon the location only
ii. Power profile permitsimmediate response todemand fluctuations;addressing both base andpeak demands of load
iii. Lower impact on ecosystemiv. No reservoir required
i. More expensive thanlarge-scalehydropower projects.
ii. Harder in terms of scalingthan large-scalehydropower projects.
iii. It is difficult to expand thegrid in hilly areas, whichare prone to losses
i. Mountain specifications and feasibility analysis shouldbe done.
ii. Since this category is less risky, and has profoundadvantages, it can be helpful in keeping pace with theincreasing energy demand.
3 Mini/Micro They are site-specificespecially with no grid
extensioni. No storage requiredii. Can be made less expensiveiii. Decentralized
power system
i. Lower load factorii. Slow demand buildup
i. Lower costs can be achieved by selecting componentsthat boost efficiency.
ii. Since this scheme is employed in mostly poor and ruralcommunities, these projects act as a source of incomefor them, since it can be locally made. This type is alsobeneficial for Pakistan, after the smallhydropower scheme.
Energies 2018, 11, 2431 40 of 49
Table 27. Analysis of major biomass resources.
Major Focus of ThisStudy Potential Advantages Disadvantages Discussion/Recommendations
Bagassei. Each ton of processed
sugarcane produces 200–300kg of bagasse
ii. Over 3000 MW can beproduced by bagasse-basedcogeneration facilities
i. Oil of 0.173 tons (about$80/ton) and coal of0.263 tons (about $55/ton) iscomparable to one ton (about$15/ton) of bagasse
ii. Cogeneration plant is locatednear the sugar mill
i. Continuous refinementof raw materialsis required
ii. Low-pressure boilersand low-efficiencysteam turbines boundsufficientelectricity production
i. The cogeneration method effectivelylowers greenhouse emission levels.
ii. It is recommended that bagasse is used forthe cogeneration, otherwise it startsdecaying by itself and producing methanegas, which is 27 degrees more hazardousfor the ozone layer than CO2.
Poultry Waste Poultry waste can guaranteeapproximately 10,335 m3 of biogas,which in turn would be capable ofgenerating about 300 MWh per day.
i. Pakistan’s poultry industry isestablished i.e., 25,000 poultryfarms across the countryleave a tremendous volumeof poultry waste
ii. Anaerobic digestion processon poultry wasteproduces biogas.
i. Lack of establishedwaste to energyconversion technologies
ii. Lack of awareness aboutpotential of poultrywaste as a biomassenergy resource
i. Waste-to-energy conversion technologiesshould be implied to convert waste intotreasure of energy.
ii. Anaerobic digestion produces aby-product called biodigestate, whichshould be used as fertilizer.
Municipal SolidWaste (MSW) i. Gross total of 32.3 MT per
year of MSW is producedii. Use of MSW as a biomass
resource for powerproduction will cause areduction from 0.1% to 0.03%in the share ofimported electricity
Variety of MSW processing andtreatment techniques are available
Lack of expertise andmanpower in this domain inPakistan
i. Waste is the most abundant and easilyavailable entity. This regime shoulddefinitely be explored and acted upon,since it is beneficial in terms ofthe environment.
ii. It can greatly help reduce the share ofconventional resources of powergeneration in Pakistan’s energy fuel mix.
Energies 2018, 11, 2431 41 of 49
Table 28. Biomass utilization in Pakistan for power production, transportation, and industrial fuel.
1 Power Production In the National Transmissionand Dispatch Company
(NTDC)’s system, an increase inpower generation of about63 MW for a total of about
146 MW from bagasse-basedpower plants has been observed
during 2015–2016 having anenergy of 547 GWh.
i. Pakistan lacked anybiomass/bagasse-based power plantsuntil 2014
ii. The projects started in 2015 are majorlybased on bagasse fuel
iii. Their technologies make use ofsteam turbines
iv. 35 captive power producers (CPPs) are usingbiomass/bagasse for power production
v. Shakarganj Energy (Pvt.) Limited is theonly Isolated Generation Company (IGC) forenergy production using biomass
The year 2015 has been beneficial in terms of thestart of biomass-based power production. Many
projects have been put forward forimplementation, since companies have found it to
be a convenient way to generate electricity.
2 Transportationi. Vehicle efficiency and
performance can begreatly increased usingbiomass-based fuelssuch as bioethanoland biodiesel
ii.Environmentally-friendly fuel
i. The transportation system of Pakistan hasvehicles with engines that feed onliquefied petroleum gas, natural gas, jetfuel, high-speed diesel, and gasoline.
ii. Countries such as Sweden use biomassresources for transportation by modifyingbiogas to biomethane
Pakistan imports a huge amount of fossil fuels tofulfill its transportation needs. Pakistan also needsto follow the concept of using biomass-based fuels
to feed the vehicular engines.
3 Industrial Fuel Biofuels have beenrecommended as substitutes
guaranteeing the security of fueland reduced levels of
greenhouse gas production.
Pakistan’s industries are still using fossil fuels thatproduce harmful gases that are bad for the
environmenti. Pakistan has a lot of potential to run the
industries by producing its ownbiomass-based fuel, instead of importingfossil fuels from foreign countries.
ii. Pakistan can start from using cogenerationfor heating furnaces and boilers for juiceheating and yield medium-densityfiberboard, which is an alternate fornatural wood.
iii. This will help clean the environment, too.
Energies 2018, 11, 2431 42 of 49
6. Conclusions
Pakistan is in dire need of the diversification of its energy mix to lessen its reliance upon fossilfuels and its consequences on the environment. This review concludes that the government of Pakistanshould prioritize biomass energy based-projects among other renewable energy resources, since itwould prove to be the most economical and environment-friendly resource. This would lead to a quickbridging of the gap between the demand and supply of energy. In the future, this study can be furtherenhanced by obtaining data from organizations and institutions that will help the government modelbiomass-based projects.
Author Contributions: All the authors contributed in completing the Paper. The main idea of the paper waspresented by W.U.K.T. while Z.A., N.Y., L.S., and I.F. helped in accumulating the research data in this reviewpaper. M.A., M.S., B.H., and L.W.C. prepared the format of the paper. S.M., S.A.M., and M.D. are the head ofresearch team.
Funding: The authors would like to acknowledge the financial support received from the University ofMalaya, Malaysia, through Frontier Research Grant No. FG007-17AFR and Innovative Technology GrantNo. RP043B-17AET.
Conflicts of Interest: The authors declare no conflict of interest.
Abbreviations
AEDB Alternative Energy Development BoardBRB Bambawali Ravi BedianCOD Commercial operation datesCPP Captive power producersCNG Compressed natural gasCERAD Center for Energy Research and DevelopmentEJ Exa jouleFY Financial yearGENCOs Generation CompaniesGHG Greenhouse gasGWEC Global Wind Energy CouncilGW GigawattsGWh Gigawatt-hourGDP Gross domestic productGoP Government of PakistanHSD High-speed dieselHDR Hard Dry RockHVAC Heating, ventilation and air conditioningIPPs Independent power producersIGC Isolated Generation CompanyIFC International Finance CorporationIEA International Energy AgencyK-EL K-Electric’sKPIs Key performance indicatorsKANUPP Karachi Nuclear Power PlantKTOE Kilotonne of oil equivalentMW MegawattsMT MegatonsMCM Million cubic metersMSW Municipal solid wasteNREL National Renewable Energy LaboratoryNEPRA National Electric Power Regulatory AuthorityNEQS National Environment Quality Standards
Energies 2018, 11, 2431 43 of 49
NTDC National Transmission and Dispatch CompanyOECD Organization of Economic Cooperation and DevelopmentPEPCO Power CompanyPCRET Pakistan Council Renewable Energy TechnologiesPV PhotovoltaicPAEC Pakistan Atomic Energy CommissionPJ PetajouleRFO Residual furnace oilRLNG Regasified Liquefied Natural GasSPPs Small Power ProducersSNG Substitute natural gasTWh Tera watt hourTOE Tons of oil equivalentWAPDA Water and Power Development AuthorityWTO World Trade Organization
References
1. Baloch, M.H.; Kaloi, G.S.; Memon, Z.A. Current scenario of the wind energy in Pakistan challenges andfuture perspectives: A case study. Energy Rep. 2012, 2, 201–210. [CrossRef]
2. Bianco, V.; Manca, O.; Nardini, S. Electricity consumption forecasting in Italy using linear regression models.Energy 2009, 34, 1413–1421. [CrossRef]
3. Birol, F. World Energy Prospects and Challenges. Asia-Pac. Rev. 2007, 14, 1–12. [CrossRef]4. International Energy Outlook 2010. Available online: http://large.stanford.edu/courses/2010/ph240/
riley2/docs/EIA-0484-2010.pdf (accessed on 18 August 2018).5. Kaygusuz, K. Wind energy status in renewable electrical energy production in Turkey. Renew. Sustain.
Energy Rev. 2010, 14, 2104–2112. [CrossRef]6. Key World Energy Statistics. Available online: http://alofatuvalu.tv/FR/12_liens/12_articles_rapports/
IEA_rpt_2012_us.pdf (accessed on 18 August 2018).7. Data Collection Survey on Renewable Energy Development in Pakistan Final Report. Available online:
open_jicareport.jica.go.jp/pdf/12086740_01.pdf (accessed on 18 August 2018).8. Krewitt, W.; Simon, S.; Graus, W.; Teske, S.; Zervos, A.; Schäfer, O. The 2 C scenario—A sustainable world
energy perspective. Energy Policy 2007, 35, 4969–4980. [CrossRef]9. Rafique, M.M.; Rehman, S. National energy scenario of Pakistan–Current status, future alternatives, and
institutional infrastructure: An overview. Renew. Sustain. Energy Rev. 2017, 69, 156–167. [CrossRef]10. Stanek, W.; Czarnowska, L.; Gazda, W.; Simla, T. Thermo-ecological cost of electricity from renewable energy
sources. Renew. Energy 2018, 115, 87–96. [CrossRef]11. Breeze, P. Chapter 6—Renewable Energy and the Environment. In Electricity Generation and the Environment.
Available online: http://www.sciencedirect.com/science/article/pii/B9780081010440000068 (accessed on18 August 2018).
12. Burke, M.J.; Stephens, J.C. Political power and renewable energy futures: A critical review. Energy Res.Soc. Sci. 2018, 35, 78–93. [CrossRef]
13. Mitchell, J.V.; Mitchell, B. Structural crisis in the oil and gas industry. Energy Policy 2014, 64, 36–42. [CrossRef]14. Sher, H.A.; Murtaza, A.F.; Addoweesh, K.E.; Chiaberge, M. Pakistan’s progress in solar PV based energy
generation. Renew. Sustain. Energy Rev. 2015, 47, 213–217. [CrossRef]15. Kamran, M. Current status and future success of renewable energy in Pakistan. Renew. Sustain. Energy Rev.
2018, 82, 609–617. [CrossRef]16. Rauf, O.; Wang, S.; Yuan, P.; Tan, J. An overview of energy status and development in Pakistan. Renew. Sustain.
Energy Rev. 2015, 48, 892–931. [CrossRef]17. Rodríguez-Monroy, C.; Mármol-Acitores, G.; Nilsson-Cifuentes, G. Electricity generation in Chile using
non-conventional renewable energy sources—A focus on biomass. Renew. Sustain. Energy Rev. 2018, 81,937–945. [CrossRef]
18. Towards Pakistan’s Energy Security and Competitiveness . . . . Available online: https://www.pbc.org.pk/wp-content/uploads/Towards-Pakistanu2019s-Energy-Security-and-Competitiveness.pdf (accessedon 18 August 2018).
19. Wakeel, M.; Chen, B.; Jahangir, S. Overview of Energy Portfolio in Pakistan. Energy Procedia 2016, 88, 71–75.[CrossRef]
20. World Energy Resources Bioenergy. Available online: https://www.worldenergy.org/wp-content/uploads/2017/03/WEResources_Bioenergy_2016.pdf (accessed on 18 August 2018).
21. State of Industry Report 2016. National Electric Power Regulatory Authority: Pakistan, 2016. Availableonline: https://www.nepra.org.pk/industryreports.htm (accessed on 18 August 2018).
22. Ozturk, M.; Saba, N.; Altay, V.; Iqbal, R.; Hakeem, K.R.; Jawaid, M. Biomass and bioenergy: An overviewof the development potential in Turkey and Malaysia. Renew. Sustain. Energy Rev. 2017, 79, 1285–1302.[CrossRef]
23. Main-Knorn, M.; Cohen, W.B.; Kennedy, R.E.; Grodzki, W.; Pflugmacher, D.; Griffiths, P. Monitoringconiferous forest biomass change using a Landsat trajectory-based approach. Remote. Sens. Environ.2013, 139, 277–290. [CrossRef]
24. Nansaior, A.; Patanothai, A.; Rambo, A.T.; Simaraks, S. The sustainability of biomass energy acquisitionby households in urbanizing communities in Northeast Thailand. Biomass Bioenergy 2013, 52, 113–121.[CrossRef]
25. Demirbas, A. Biomass resource facilities and biomass conversion processing for fuels and chemicals.Energy Convers. Manag. 2001, 42, 1357–1378. [CrossRef]
26. McKendry, P. Energy production from biomass (part 2): Conversion technologies. Bioresour. Technol. 2002, 83,47–54. [CrossRef]
27. Do We Need More Nuclear Power? Available online: https://www.renewableenergyworld.com/ugc/articles/2015/04/renewables-vs-nuclear-do-we-need-more-nuclear-power.html (accessed on 18 August 2018).
28. Thiffault, E.; Endres, J.; McCubbins, J.S.; Junginger, M.; Lorente, M.; Fritsche, U. Sustainabilityof forest bioenergy feedstock supply chains: Local, national and international policy perspectives.Biofuels Bioprod. Biorefin. 2015, 9, 283–292. [CrossRef]
29. Li, Y.; Zhou, L.W.; Wang, R.Z. Urban biomass and methods of estimating municipal biomass resources.Renew. Sustain. Energy Rev. 2017, 80, 1017–1030. [CrossRef]
30. Goldemberg, J. World Energy Assessment: Energy and the Challenge of Sustainability. Available online:https://books.google.com.pk/books?id=7V3xAAAAMAAJ (accessed on 18 August 2018).
31. Bhattacharya, S. Biomass Energy and Densification: A Global Review with Emphasis on DevelopingCountries. Available online: http://citeseerx.ist.psu.edu/viewdoc/download?doi=10.1.1.630.4397&rep=rep1&type=pdf (accessed on 18 August 2018).
32. Hughes, E.E.; Tillman, D. A Biomass Cofiring: Status and prospects 1996. Fuel Proc. Technol. 1998, 54, 127–142.[CrossRef]
33. Sami, M.; Annamalai, K.; Wooldridge, M. Co-firing of coal and biomass fuel blends. Prog. Energy Combust. Sci.2001, 27, 171–214. [CrossRef]
34. Jingura, R.M.; Musademba, D.; Kamusoko, R. A review of the state of biomass energy technologies inZimbabwe. Renew. Sustain. Energy Rev. 2013, 26, 652–659. [CrossRef]
35. Bloyd, C.N.; Streets, D.G.; Fisher, R.E. Energy models and national energy policy. In Proceedings of the 25thIntersociety, Reno, NV, USA, 12–17 August 1990; pp. 244–249.
36. Shukla, S.K.; Gupta, R.K. A model checking approach to evaluating system level dynamic powermanagement policies for embedded systems. In Proceedings of the Sixth IEEE International High-LevelDesign Validation and Test Workshop, Monterey, CA, USA, 9 November 2001; pp. 53–57.
37. Munasinghe, M. Power policy and environmental issues in developing countries. Power Eng. J. 1992, 6,171–178. [CrossRef]
38. Tao, Y.; Xue, H.F.; Huang, L. The Sustainable Energy Tax Policy Decision-Making Model Based on InvestWillingness Constraint. In Proceedings of the 2009 WRI World Congress on Computer Science andInformation Engineering, Los Angeles, CA, USA, 31 March–2 April 2009; pp. 307–311.
39. Framework, P. Package of Incentives for Private Sector Power Generation Projects in Pakistan. Availableonline: http://www.ppib.gov.pk/Power%20Policy%201994.pdf (accessed on 18 August 2018).
40. Policy for Development of Renewable Energy for Power Generation Employing Small Hydro, Wind, andSolar Technologies. Available online: https://www.aedb.org/Documents/Policy/REpolicy.pdf (accessed on18 August 2018).
41. Li, Y.; Li, Y.; Ji, P.; Yang, J. The status quo analysis and policy suggestions on promoting China’s hydropowerdevelopment. Renew. Sustain. Energy Rev. 2015, 51, 1071–1079. [CrossRef]
42. Liu, B.; Liao, S.; Cheng, C.; Chen, F.; Li, W. Hydropower curtailment in Yunnan Province, southwesternChina: Constraint analysis and suggestions. Renew. Energy 2018, 121, 700–711. [CrossRef]
43. Koç, C. A study on the development of hydropower potential in Turkey. Renew. Sustain. Energy Rev. 2014, 39,498–508. [CrossRef]
44. Chang, J.; Li, Y.; Yuan, M.; Wang, Y. Efficiency evaluation of hydropower station operation: A case study ofLongyangxia station in the Yellow River, China. Energy 2017, 135, 23–31. [CrossRef]
45. Bilgili, M.; Bilirgen, H.; Ozbek, A.; Ekinci, F.; Demirdelen, T. The role of hydropower installations forsustainable energy development in Turkey and the world. Renew. Energy 2018, 126, 755–764. [CrossRef]
46. Cheng, C.-T.; Shen, J.-J.; Wu, X.-Y.; Chau, K.-W. Operation challenges for fast-growing China’s hydropowersystems and respondence to energy saving and emission reduction. Renew. Sustain. Energy Rev. 2012, 16,2386–2393. [CrossRef]
47. Power System Statistics 2013–2014. Available online: http://climateinfo.pk/frontend/web/attachments/data-type/NTDC%20(2014)%20Power%20System%20Statistics.pdf (accessed on 18 August 2018).
48. Shakeel, S.R.; Takala, J.; Shakeel, W. Renewable energy sources in power generation in Pakistan.Renew. Sustain. Energy Rev. 2016, 64, 421–434. [CrossRef]
49. Power System Statistics 2015–2016. Available online: www.kseb.in/index.php?option=com_jdownloads&task=download...id (accessed on 18 August 2018).
50. Imran, M.; Amir, N. A short-run solution to the power crisis of Pakistan. Energy Policy 2015, 87, 382–391.[CrossRef]
51. Saleemullah, M. Comparison of electricity generation cost of NPP with alternatives in Pakistan. In Proceedingsof the International Atomic Energy Agency IAEA, International Project on Innovative Nuclear Reactors andFuel Cycles INPRO, Vienna, Austria, 26–29 August 2014.
52. Sabir, M.; Torre, A.; Magsi, H. Land-use conflict and socio-economic impacts of infrastructure projects:The case of Diamer Bhasha Dam in Pakistan. Area Dev. Policy 2017, 2, 40–54. [CrossRef]
53. Construction of Kalabagh Dam-Background Paper. Available online: http://admin.umt.edu.pk/Media/Site/UMT/SubSites/SGS/FileManager/Research/ConstructionOfKalabaghDamBackgroundPaper.pdf (accessedon 18 August 2018).
54. Bhutto, A.W.; Bazmi, A.A.; Zahedi, G. Greener energy: Issues and challenges for Pakistan-hydel powerprospective. Renew. Sustain. Energy Rev 2012, 16, 2732–2746. [CrossRef]
55. Siddiqi, A.; Wescoat, J.L.; Humair, S.; Afridi, K. An empirical analysis of the hydropower portfolio in Pakistan.Energy Policy 2012, 50, 228–241. [CrossRef]
56. Asif, M. Sustainable energy options for Pakistan. Renew. Sustain. Energy Rev. 2009, 13, 903–909. [CrossRef]57. Qazi, U.; Jahanzaib, M.; Ahmad, W.; Hussain, S. An institutional framework for the development of
sustainable and competitive power market in Pakistan. Renew. Sustain. Energy Rev. 2017, 70, 83–95.[CrossRef]
58. Mirjat, N.H.; Uqaili, M.A.; Harijan, K.; Valasai, G.D.; Shaikh, F.; Waris, M. A review of energy and powerplanning and policies of Pakistan. Renew. Sustain. Energy Rev. 2017, 79, 110–127. [CrossRef]
59. Bhutto, A.W.; Bazmi, A.A.; Zahedi, G. Greener energy: Issues and challenges for Pakistan—Wind powerprospective. Renew. Sustain. Energy Rev 2013, 20, 519–538. [CrossRef]
60. Zameer, H.; Wang, Y. Energy production system optimization: Evidence from Pakistan. Renew. Sustain.Energy Rev. 2018, 82, 886–893. [CrossRef]
61. Batool, A.; Abbas, F. Reasons for delay in selected hydro-power projects in Khyber Pakhtunkhwa (KPK),Pakistan. Renew. Sustain. Energy Rev. 2017, 73, 196–204. [CrossRef]
62. Prăvălie, R.; Bandoc, G. Nuclear energy: Between global electricity demand, worldwide decarbonisationimperativeness, and planetary environmental implications. J. Environ. Manag. 2018, 209, 81–92. [CrossRef][PubMed]
63. Suman, S. Hybrid nuclear-renewable energy systems: A review. J. Clean. Prod. 2018, 181, 166–177. [CrossRef]
64. Birol, F. Energy Security: Investment or Insecurity. Available online: https://www.ipinst.org/wp-content/uploads/2015/06/cwc_working_paper_energy_security.pdf (accessed on 18 August 2018).
65. Demirbas, A. Global Renewable Energy Projections. Energy Sources Part. B 2009, 4, 212–224. [CrossRef]66. Aized, T.; Shahid, M.; Bhatti, A.A.; Saleem, M.; Anandarajah, G. Energy security and renewable energy
policy analysis of Pakistan. Renew. Sustain. Energy Rev 2018, 84, 155–169. [CrossRef]67. Akhtar, J.; Yaqub, M.I.; Iqbal, J.; Sheikh, N.; Saba, T. Way forward in meeting energy challenges in Pakistan.
Int. J. Ambient. Energy 2017, 1–5. [CrossRef]68. Akber, M.Z.; Thaheem, M.J.; Arshad, H. Life cycle sustainability assessment of electricity generation in
Pakistan: Policy regime for a sustainable energy mix. Energy Policy 2017, 111, 111–126. [CrossRef]69. Shaikh, F.; Ji, Q.; Fan, Y. The diagnosis of an electricity crisis and alternative energy development in Pakistan.
Renew. Sustain. Energy Rev. 2015, 52, 1172–1185. [CrossRef]70. Global Wind Report: Annual Market Update 2011. Available online: http://gwec.net/wp-content/uploads/
2012/06/Annual_report_2011_lowres.pdf (accessed on 18 August 2018).71. Tareen, W.; Aamir, M.; Mekhilef, S.; Nakaoka, M.; Seyedmahmoudian, M.; Horan, B.; Memon, M.A.;
Baig, N.A. Mitigation of Power Quality Issues Due to High Penetration of Renewable Energy Sources inElectric Grid Systems Using Three-Phase APF/STATCOM Technologies: A Review. Energies 2018, 11, 1491.[CrossRef]
72. World Energy Outlook 2008. Available online: https://www.iea.org/media/weowebsite/2008-1994/WEO2008.pdf (accessed on 18 August 2018).
73. World Energy Outlook 2009. Available online: https://www.iea.org/publications/freepublications/publication/weo2009.pdf (accessed on 18 August 2018).
74. Pure Power-Wind Energy Targets for 2020 and 2030: EWEA. Available online: https://books.google.com.hk/books?hl=zhTW&lr=&id=cXuSk8jvHykC&oi=fnd&pg=PA8&dq=Pure+powerwind+energy+targets+for+2020+and+2030:+EWEA.+&ots=HHw8bB4_TU&sig=uw_w7jFUbA1tPSUjTmU9mJ2uOFE&redir_esc=y#v=onepage&q=Pure%20powerwind%20energy%20targets%20for%202020%20and%202030%3A%20EWEA.&f=false (accessed on 18 August 2018).
75. Global Wind 2008 Report. Available online: http://gwec.net/wp-content/uploads/2012/06/Global-Wind-2008-Report.pdf (accessed on 18 August 2018).
76. Global Wind Energy Outlook 2008. Available online: http://gwec.net/wp-content/uploads/2012/08/GWEO_2008_final.pdf (accessed on 18 August 2018).
77. Baloch, M.H.; Abro, S.A.; Sarwar Kaloi, G.; Mirjat, N.H.; Tahir, S.; Haroon Nadeem, M.; Gul, M.; Memon, Z.A.;Kumar, M. A research on electricity generation from wind corridors of Pakistan (two provinces): A technicalproposal for remote zones. Sustainability 2017, 9, 1611. [CrossRef]
78. Siddique, S.; Wazir, R. A review of the wind power developments in Pakistan. Renew. Sustain. Energy Rev.2016, 57, 351–361. [CrossRef]
79. Mouraviev, N.; Kakabadse, N. Public-Private Partnerships in Transitional Nations: Policy, Governance and Praxis;Cambridge Scholars Publishing: Newcastle, UK, 2017.
80. Annual Report 2014. National Electric Power Regulatory Authority: Pakistan, 2014. Available online: https://www.nepra.org.pk/Publications/Annual%20Reports/Annual%20report%202016-2017.pdf (accessed on18 August 2018).
81. Global Wind Energy Outlook 2014. Available online: https://www.gwec.net/wp-content/uploads/2014/10/GWEO2014_WEB.pdf (accessed on 18 August 2018).
82. Sadiqa, A.; Gulagi, A.; Breyer, C. Energy transition roadmap towards 100% renewable energy and role ofstorage technologies for Pakistan by 2050. Energy 2018, 147, 518–533. [CrossRef]
83. Ghafoor, A.; Munir, A. Design and economics analysis of an off-grid PV system for household electrification.Renew. Sustain. Energy Rev. 2015, 42, 496–502. [CrossRef]
84. Tahir, Z.R.; Asim, M. Surface measured solar radiation data and solar energy resource assessment of Pakistan:A review. Renew. Sustain. Energy Rev. 2018, 81, 2839–2861. [CrossRef]
85. Sheikh, M.A. Energy and renewable energy scenario of Pakistan. Renew. Sustain. Energy Rev. 2010, 14,354–363. [CrossRef]
86. Irfan, M.; Iqbal, J.; Iqbal, A.; Iqbal, Z.; Riaz, R.A.; Mehmood, A. Opportunities and challenges in control ofsmart grids—Pakistani perspective. Renew. Sustain. Energy Rev. 2017, 71, 652–674. [CrossRef]
87. Zafar, U.; Ur Rashid, T.; Khosa, A.A.; Khalil, M.S.; Rashid, M. An overview of implemented renewableenergy policy of Pakistan. Renew. Sustain. Energy Rev. 2018, 82, 654–665. [CrossRef]
88. Sandeman, J. Feed-In Tariffs: Accelerating the Deployment of Renewable Energy. Int. J. Environ. Stud. 2010,67, 463. [CrossRef]
89. Younas, U.; Khan, B.; Ali, S.M.; Arshad, C.M.; Farid, U.; Zeb, K.; Rehman, F.; Mehmood, Y.; Vaccaro, A.Pakistan geothermal renewable energy potential for electric power generation: A survey. Renew. Sustain.Energy Rev. 2016, 63, 398–413. [CrossRef]
90. Alam Zaigham, N.; Alam Nayyar, Z.; Hisamuddin, N. Review of geothermal energy resources in Pakistan.Renew. Sustain. Energy Rev. 2009, 13, 223–232. [CrossRef]
91. Geotherm. Resources of Pakistan and Methods for Early Stage Exploration. Available online: https://orkustofnun.is/gogn/unu-gtp-report/UNU-GTP-1998-09.pdf (accessed on 18 August 2018).
92. Abbas, T.; Ahmed Bazmi, A.; Waheed Bhutto, A.; Zahedi, G. Greener energy: Issues and challenges forPakistan-geothermal energy prospective. Renew. Sustain. Energy Rev. 2014, 31, 258–269. [CrossRef]
93. Gondal, I.A.; Masood, S.A.; Amjad, M. Review of geothermal energy development efforts in Pakistan andway forward. Renew. Sustain. Energy Rev. 2017, 71, 687–696. [CrossRef]
94. Lund, J.W.; Boyd, T.L. Direct utilization of geothermal energy 2015 worldwide review. Geothermics 2016, 60,66–93. [CrossRef]
95. Zaigham, N.A.; Nayyar, Z.A. Renewable hot dry rock geothermal energy source and its potential in Pakistan.Renew. Sustain. Energy Rev. 2010, 14, 1124–1129. [CrossRef]
96. Mahmood, A.; Javaid, N.; Zafar, A.; Ali Riaz, R.; Ahmed, S.; Razzaq, S. Pakistan’s overall energy potentialassessment, comparison of LNG, TAPI and IPI gas projects. Renew. Sustain. Energy Rev. 2014, 31, 182–193.[CrossRef]
97. Mirza, U.K.; Ahmad, N.; Majeed, T. An overview of biomass energy utilization in Pakistan. Renew. Sustain.Energy Rev. 2008, 12, 1988–1996. [CrossRef]
99. Kan, T.; Strezov, V.; Evans, T.J. Lignocellulosic biomass pyrolysis: A review of product properties and effectsof pyrolysis parameters. Renew. Sustain. Energy Rev. 2016, 57, 1126–1140. [CrossRef]
100. Gondal, I.A.; Masood, S.A.; Khan, R. Green hydrogen production potential for developing a hydrogeneconomy in Pakistan. Int. J. Hydrogen Energy 2018, 43, 6011–6039. [CrossRef]
101. Naqvi, S.R.; Jamshaid, S.; Naqvi, M.; Farooq, W.; Niazi, M.B.K.; Aman, Z.; Zubair, M.; Ali, M.; Shahbaz, M.;Inayat, A.; et al. Potential of biomass for bioenergy in Pakistan based on present case and future perspectives.Renew. Sustain. Energy Rev. 2018, 81, 1247–1258. [CrossRef]
102. Ben-Iwo, J.; Manovic, V.; Longhurst, P. Biomass resources and biofuels potential for the production oftransportation fuels in Nigeria. Renew. Sustain. Energy Rev. 2016, 63, 172–192. [CrossRef]
103. Toklu, E. Biomass energy potential and utilization in Turkey. Renew. Energy 2017, 107, 235–244. [CrossRef]104. Zhao, X.; Cai, Q.; Li, S.; Ma, C. Public preferences for biomass electricity in China. Renew. Sustain. Energy Rev.
2018, 95, 242–253. [CrossRef]105. He, J.; Liu, Y.; Lin, B. Should China support the development of biomass power generation? Energy 2018,
163, 416–425. [CrossRef]106. Mosaddek Hossen, M.; Sazedur Rahman, A.H.M.; Kabir, A.S.; Faruque Hasan, M.M.; Ahmed, S. Systematic
assessment of the availability and utilization potential of biomass in Bangladesh. Renew. Sustain. Energy Rev.2017, 67, 94–105. [CrossRef]
107. World Energy Council. World Energy Council Report. World Energy Resources Bioenergy, 2017. Availableonline: https://www.worldenergy.org/wp-content/uploads/2017/03/WEResources_Bioenergy_2017.pdf(accessed on 18 August 2018).
108. Al-Hamamre, Z.; Saidan, M.; Hararah, M.; Rawajfeh, K.; Alkhasawneh, H.E.; Al-Shannag, M. Wastes andbiomass materials as sustainable-renewable energy resources for Jordan. Renew. Sustain. Energy Rev. 2017,67, 295–314. [CrossRef]
109. Uzoejinwa, B.B.; He, X.; Wang, S.; El-Fatah Abomohra, A.; Hu, Y.; Wang, Q. Co-pyrolysis of biomassand waste plastics as a thermochemical conversion technology for high-grade biofuel production: Recentprogress and future directions elsewhere worldwide. Energy Convers. Manag. 2018, 163, 468–492. [CrossRef]
110. Hofsetz, K.; Silva, M.A. Brazilian sugarcane bagasse: Energy and non-energy consumption. Biomass Bioenergy2012, 46, 564–573. [CrossRef]
111. Wi, S.G.; Cho, E.J.; Lee, D.-S.; Lee, S.J.; Lee, Y.J.; Bae, H.-J. Lignocellulose conversion for biofuel: A newpretreatment greatly improves downstream biocatalytic hydrolysis of various lignocellulosic materials.Biotechnol. Biofuels 2015, 8, 228. [CrossRef] [PubMed]
112. Abedullah, A.; Bukhsh, K. Issues and economics of poultry production: A case study of Faisalabad, Pakistan.Pak. Vet. J. 2007, 27, 25–28.
113. Lisboa, C.C.; Butterbach-Bahl, K.; Mauder, M.; Kiese, R. Bioethanol production from sugarcane and emissionsof greenhouse gases–Known and unknowns. GCB Bioenergy 2011, 3, 277–292. [CrossRef]
114. Bhattacharyya, S.C.; Thang, D.N.Q. The cogeneration potential of the sugar industry in Vietnam.OPEC Energy Rev. 2004, 28, 63–80. [CrossRef]
115. Anwar, Z.; Gulfraz, M.; Irshad, M. Agro-industrial lignocellulosic biomass a key to unlock the futurebio-energy: A brief review. J. Radiat. Res. Appl. Sci. 2014, 7, 163–173. [CrossRef]
116. Paturau, J.M. Alternative Uses of Sugarcane and Its Byproducts in Agroindustries. Available online:http://www.fao.org/livestock/agaP/Frg/AHPP72/72-24.pdf (accessed on 18 August 2018).
117. SRDC Technical Report 2/2006: Analysis of Bagase and Trash Utilization Options. Available online:https://elibrary.sugarresearch.com.au/bitstream/handle/11079/13234/SRD005%20SRDC%20BagTrash%20RptF.pdf?sequence=1&isAllowed=y (accessed on 18 August 2018).
118. Saeed, A. Prospects of Bagasse as a feasible bio-fuel for electricity generation in Pakistan—A realisticapproach. In Proceedings of the 2015 Power Generation System and Renewable Energy Technologies(PGSRET), Islamabad, Pakistan, 10–11 June 2015; pp. 1–4.
119. Frame Work for Power Co-Generation 2013 (Bagasse/Biomass). Available online: http://www.aedb.org/ae-policies/policy-bioenergy (accessed on 18 August 2018).
120. HIGHLIGHTS OF THE PAKISTAN ECONOMIC SURVEY 2012-13. Available online: http://finance.gov.pk/survey/chapters_13/hghlights%202013.pdf (accessed on 18 August 2018).
121. Hussain, J.; Rabbani, I.; Aslam, S.; Ahmad, H.A. An overview of poultry industry in Pakistan. World’s Poult.Sci. J. 2015, 71, 689–700. [CrossRef] [PubMed]
122. Reducing Capital Cost and Providing Electricity to Grid by Power Generation from Poultry Farms. Availableonline: https://pdfs.semanticscholar.org/681c/1325f56ce45d736aa1f01c6e5ac6060df5cd.pdf (accessed on18 August 2018).
123. Salminen, E.; Rintala, J. Anaerobic digestion of organic solid poultry slaughterhouse waste—A review.Bioresour. Technol. 2002, 83, 13–26. [CrossRef]
124. Mandeno, G.; Craggs, R.; Tanner, C.; Sukias, J.; Webster-Brown, J. Potential biogas scrubbing using a highrate pond. Water Sci. Technol. 2005, 51, 253–256. [CrossRef] [PubMed]
125. Biomethane from Dairy Waste. Available online: http://www.americanbiogascouncil.org/pdf/biomethanefromdairywaste.pdf (accessed on 18 August 2018).
126. Eldean, M.A.S.; Soliman, A. A novel study of using oil refinery plants waste gases for thermal desalinationand electric power generation: Energy, exergy & cost evaluations. Appl. Energy 2017, 195, 453–477.
127. Wang, K.; Dubey, S.; Choo, F.H.; Duan, F. Thermoacoustic Stirling power generation from LNG cold energyand low-temperature waste heat. Energy 2017, 127, 280–290. [CrossRef]
128. León, E.; Martín, M. Optimal production of power in a combined cycle from manure based biogas.Energy Convers. Manag. 2016, 114, 89–99. [CrossRef]
129. Uddin, W.; Khan, B.; Shaukat, N.; Majid, M.; Mujtaba, G.; Mehmood, A.; Ali, S.M.; Younas, U.; Anwar, M.;Almeshal, A.M. Biogas potential for electric power generation in Pakistan: A survey. Renew. Sustain.Energy Rev. 2016, 54, 25–33. [CrossRef]
130. Ferrarez, A.H.; Oliveira, D.; Lacerda, A.F.; Costa, J.M.; Aparisi, F.S. Supplying the energy demand in thechicken meat processing poultry with biogas. Ingeniería e Investigación 2016, 36, 118–121. [CrossRef]
131. Anaerobic Digestion of Animal Wastes: Factors to Consider. Available online: https://attra.ncat.org/attra-pub/download.php?id=307 (accessed on 18 August 2018).
132. Arshad, M.; Bano, I.; Khan, N.; Shahzad, M.I.; Younus, M.; Abbas, M.; Iqbal, M. Electricity generation frombiogas of poultry waste: An assessment of potential and feasibility in Pakistan. Renew. Sustain. Energy Rev.2018, 81, 1241–1246. [CrossRef]
133. Jouhara, H.; Czajczynska, D.; Ghazal, H.; Krzyzynska, R.; Anguilano, L.; Reynolds, A.J.; Spencer, N.Municipal waste management systems for domestic use. Energy 2017, 139, 485–506. [CrossRef]
134. Sandulescu, E. The contribution of waste management to the reduction of greenhouse gas emissions withapplications in the city of Bucharest. Waste Manag. Res. 2004, 22, 413–426. [CrossRef] [PubMed]
135. Solid Waste Management: Issues and Challenges in Asia. Available online: http://www.apo-tokyo.org/00e-books/IS-22_SolidWasteMgt/IS-22_SolidWasteMgt.pdf (accessed on 18 August 2018).
136. Misra, V.; Pandey, S.D. Hazardous waste, impact on health and environment for development of better wastemanagement strategies in future in India. Environ. Int. 2005, 31, 417–431. [CrossRef] [PubMed]
137. Grodzinska-Jurczak, M. The relation between education, knowledge and action for better waste managementin Poland. Waste Manag. Res. 2003, 21, 2–18. [CrossRef] [PubMed]
138. Woodard, R.; Bench, M.; Harder, M.K.; Stantzos, N. The optimisation of household waste recycling centresfor increased recycling—A case study in Sussex, UK. Resour. Conserv. Recycl. 2004, 43, 75–93. [CrossRef]
139. Lariviere, M. Methodology for Allocating Municipal Solid Waste to Biogenic and Non-Biogenic Energy. 2007.Available online: http://www.eia.doe.gov/cneaf/solar.renewables/page/mswaste/msw.pdf (accessed on18 August 2018).
140. ADB’s Clean Energy and Environment Program, Asian Development Bank. November 2007.Available online: https://unfccc.int/files/adaptation/sbsta_agenda_item_adaptation/application/pdf/adb_ccadaptation.pdf (accessed on 18 August 2018).
141. Korai, M.S.; Mahar, R.B.; Uqaili, M.A. The feasibility of municipal solid waste for energy generation and itsexisting management practices in Pakistan. Renew. Sustain. Energy Rev. 2017, 72, 338–353. [CrossRef]
142. Zuberi, M.J.S.; Torkmahalleh, M.A.; Ali, S.M.H. A comparative study of biomass resources utilization forpower generation and transportation in Pakistan. Int. J. Hydrogen Energy 2015, 40, 11154–11160. [CrossRef]
143. Ashraf Chaudhry, M.; Raza, R.; Hayat, S.A. Renewable energy technologies in Pakistan: Prospects andchallenges. Renew. Sustain. Energy Rev. 2009, 13, 1657–1662. [CrossRef]
144. SUGAR INDUSTRY IN PAKISTAN Problems, Potentials. Available online: https://www.icmap.com.pk/downloads/Past-Publications/sipp_%20potentials.pdf (accessed on 18 August 2018).
145. A Review of North American Biofuel Production, Policies and Research. Available online:https://www.researchgate.net/profile/Michael_Martin10/publication/293794254_A_review_of_North_American_Biofuel_Production_Policies_and_Research/links/56bb30a708aebb3054a85f69/A-review-of-North-American-Biofuel-Production-Policies-and-Research.pdf (accessed on 18 August 2018).
146. Scarlat, N.; Dallemand, J.-F.; Fahl, F. Biogas: Developments and perspectives in Europe. Renew. Energy 2018,129, 457–472. [CrossRef]
147. Khan, M.I. Comparative Well-to-Tank energy use and greenhouse gas assessment of natural gas as atransportation fuel in Pakistan. Energy Sustain. Dev. 2018, 43, 38–59. [CrossRef]
148. How Pakistan Is Coping with the Challenge of High Oil Prices. Available online: https://mpra.ub.uni-muenchen.de/8256/1/MPRA_paper_8256.pdf (accessed on 18 August 2018).
149. Wileman, A.; Ozkan, A.; Berberoglu, H. Rheological properties of algae slurries for minimizing harvestingenergy requirements in biofuel production. Bioresour. Technol. 2012, 104, 432–439. [CrossRef] [PubMed]
150. Tareen, W.U.K.; Mekhielf, S. Three-Phase Transformerless Shunt Active Power Filter with Reduced SwitchCount for Harmonic Compensation in Grid-Connected Applications. IEEE Trans. Power Electron. 2018, 33,4868–4881. [CrossRef]
151. Tareen, W.U.; Mekhilef, S.; Seyedmahmoudian, M.; Horan, B. Active power filter (APF) for mitigation ofpower quality issues in grid integration of wind and photovoltaic energy conversion system. Renew. Sustain.Energy Rev. 2017, 70, 635–655. [CrossRef]
152. Tareen, W.U.K.; Mekhilef, S.; Nakaoka, M. A transformerless reduced switch counts three-phase APF-assistedsmart EV charger. In Proceedings of the 2017 IEEE Applied Power Electronics Conference and Exposition(APEC), Tampa, FL, USA, 26–30 March 2017. Available online: https://umexpert.um.edu.my/file/publication/00005361_151743_71512.pdf (accessed on 18 August 2018).