• How many bottles of L’Oréal Elvive Triple Resist Reinforcing Shampoo would you get for the global brand value of L’Oréal?
1 billion
3 billion
5 billion
• How many Amazon delivery trucks would you need to get them to your home?
40,000
100,000
300,000
• How long would the supply last an average family?
10 years
99 years
250m years
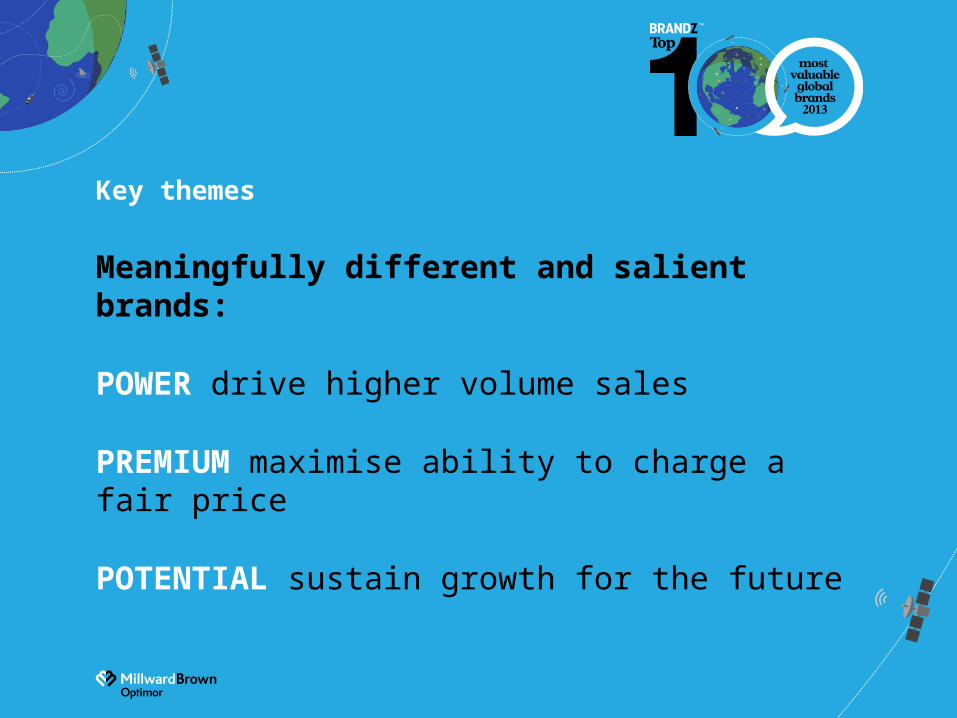
Key themes
Meaningfully different and salient brands:
POWER drive higher volume sales
PREMIUM maximise ability to charge a fair price
POTENTIAL sustain growth for the future
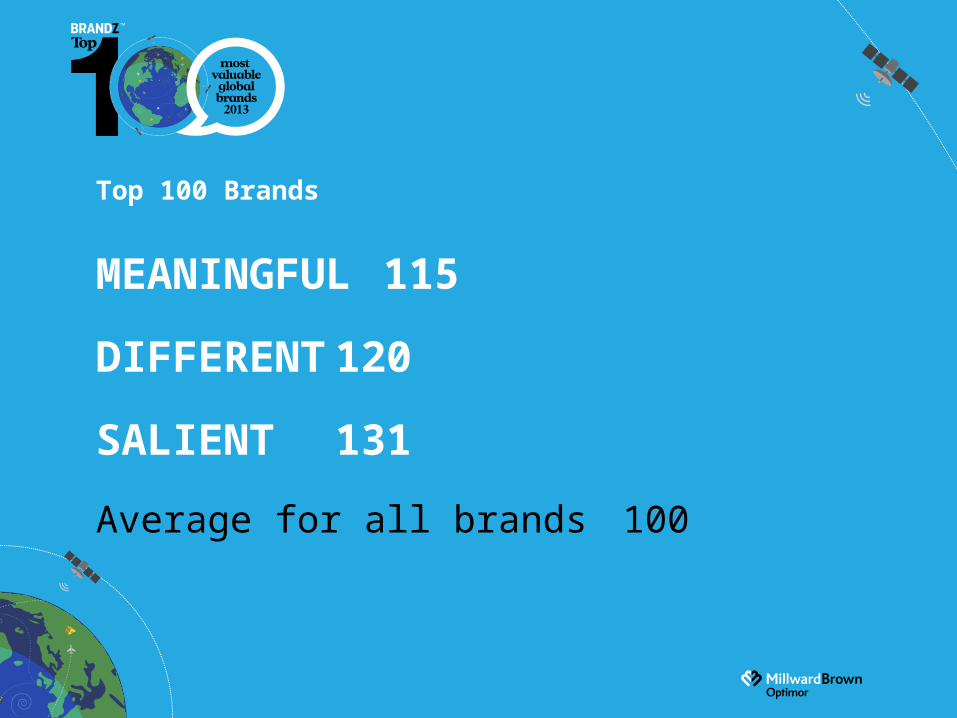
Top 100 Brands
MEANINGFUL 115
DIFFERENT 120
SALIENT 131
Average for all brands 100
Eight Years, Eight Top Risers
BRAND BRAND VALUE($M)
BRAND VALUE CHANGE
Subway 16,700 +5,798%
Apple 185,071 +1,058%
Amazon 45,700 +664%
Hermès 19,129 +296%
Zara 20,167 +295%
SAP 34,365 +259%
Verizon 53,004 +256%
IBM 112,536 +212%
Up
+425%Top 100 up
+77%
Eight Success Trends
Great Value Proposition
Relevant for today
Harnessing technology
Getting abroad and about
Reputation
Meaningfully Different
Personality
A great branded experience
Asia leads growth
Top 10 vs 2012
Asia +13%
Continental Europe +5%
UK +4%
US +2%
LatAm -13%
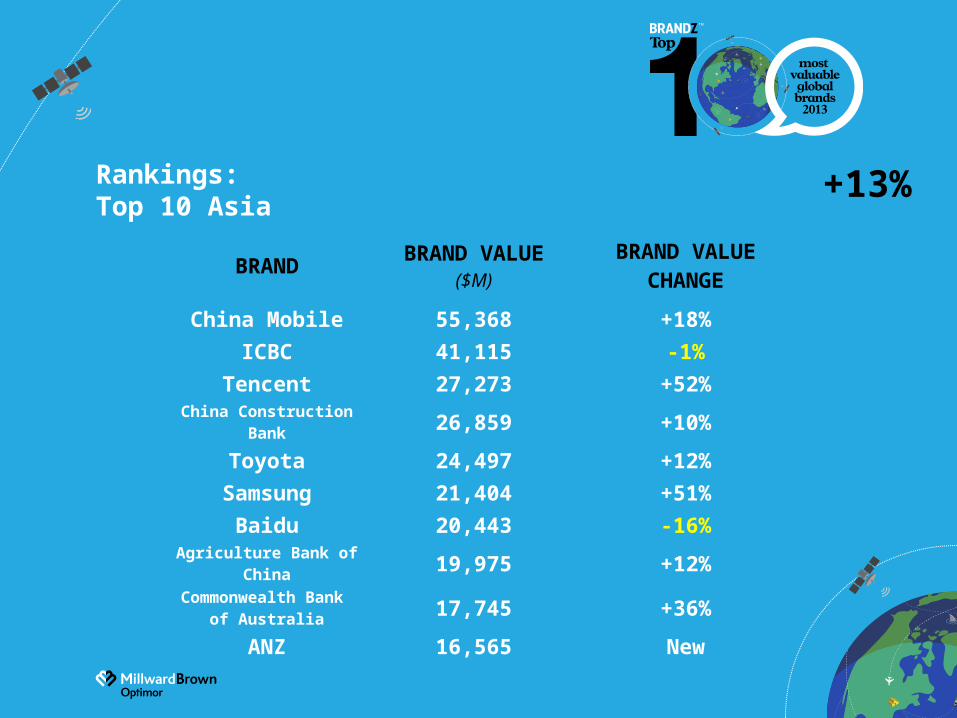
Rankings: Top 10 Asia
BRAND BRAND VALUE($M)
BRAND VALUE CHANGE
China Mobile 55,368 +18%
ICBC 41,115 -1%
Tencent 27,273 +52%China Construction Bank 26,859 +10%
Toyota 24,497 +12%
Samsung 21,404 +51%
Baidu 20,443 -16%Agriculture Bank of China 19,975 +12%
Commonwealth Bank of Australia 17,745 +36%
ANZ 16,565 New
+13%
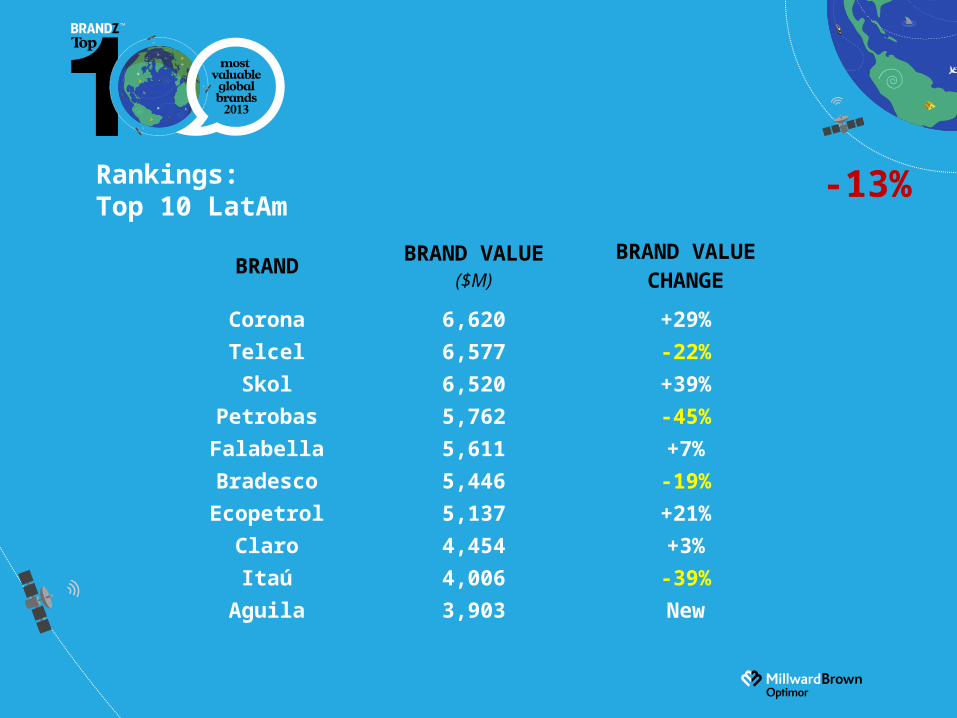
Rankings: Top 10 LatAm
BRAND BRAND VALUE($M)
BRAND VALUE CHANGE
Corona 6,620 +29%
Telcel 6,577 -22%
Skol 6,520 +39%
Petrobas 5,762 -45%
Falabella 5,611 +7%
Bradesco 5,446 -19%
Ecopetrol 5,137 +21%
Claro 4,454 +3%
Itaú 4,006 -39%
Aguila 3,903 New
-13%
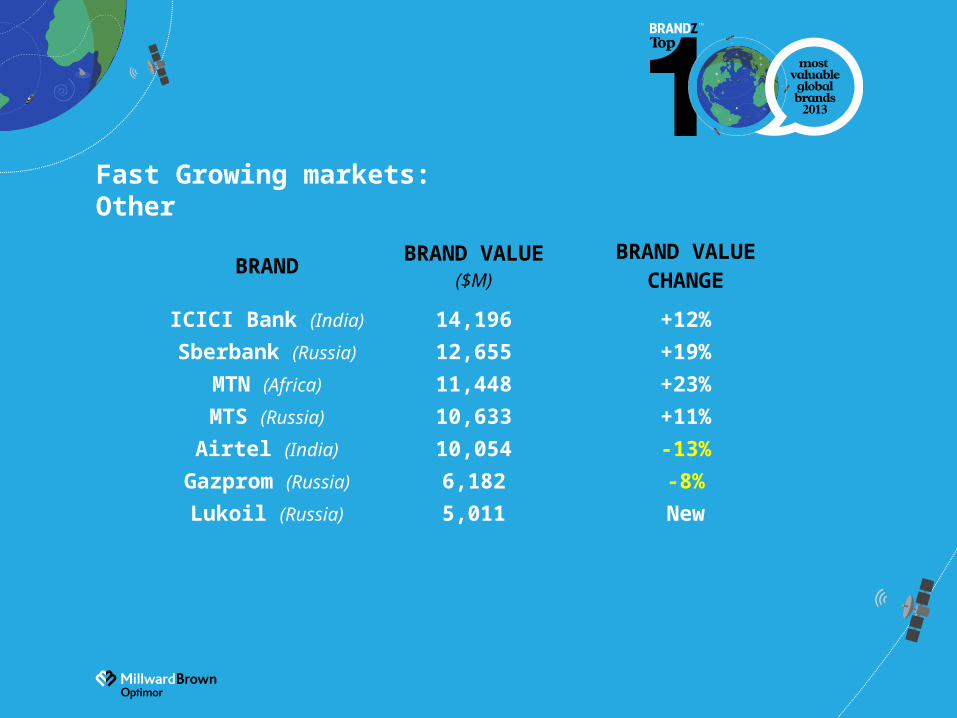
Fast Growing markets: Other
BRAND BRAND VALUE($M)
BRAND VALUE CHANGE
ICICI Bank (India) 14,196 +12%
Sberbank (Russia) 12,655 +19%
MTN (Africa) 11,448 +23%
MTS (Russia) 10,633 +11%
Airtel (India) 10,054 -13%
Gazprom (Russia) 6,182 -8%
Lukoil (Russia) 5,011 New
Rankings: Top 10 North America
BRAND BRAND VALUE($M)
BRAND VALUE CHANGE
Apple 185,071 +1%
Google 113,669 +5%
IBM 112,536 -3%
McDonald’s 90,256 -5%
Coca-Cola 78,415 +6%
AT&T 75,507 +10%
Microsoft 69,814 -9%
Marlboro 69,383 -6%
Visa 56,060 +46%
GE 55,357 +21%
(Canada: RBC 38th, TD 46th, Scotiabank 85th)
+2%
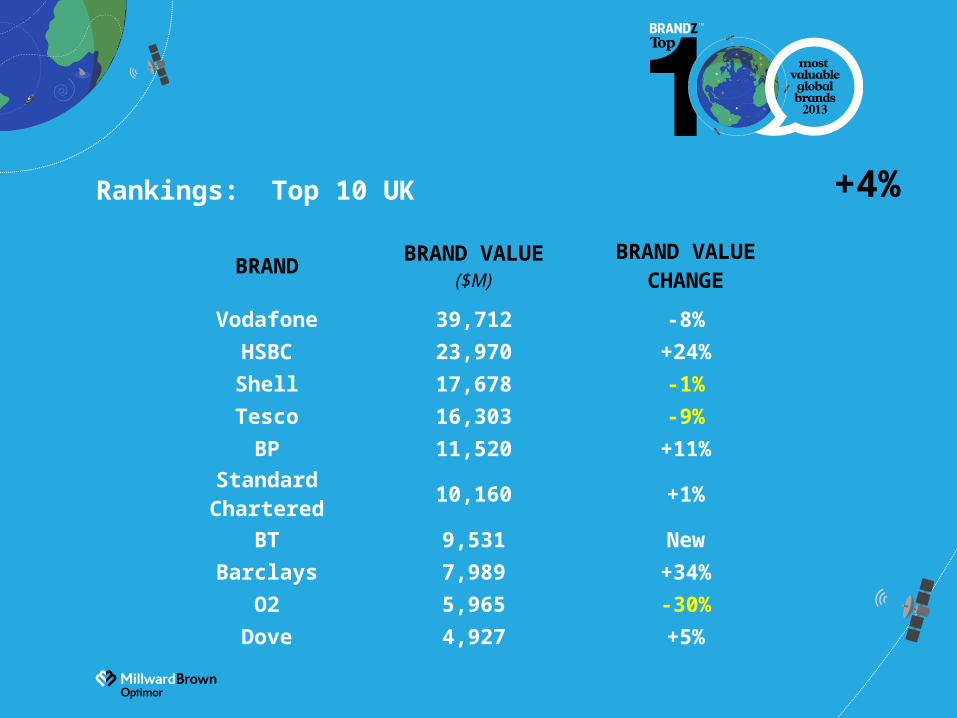
Rankings: Top 10 UK
BRAND BRAND VALUE($M)
BRAND VALUE CHANGE
Vodafone 39,712 -8%
HSBC 23,970 +24%
Shell 17,678 -1%
Tesco 16,303 -9%
BP 11,520 +11%
Standard Chartered 10,160 +1%
BT 9,531 New
Barclays 7,989 +34%
O2 5,965 -30%
Dove 4,927 +5%
+4%
Rankings: Top 10 Continental Europe
BRAND BRAND VALUE($M)
BRAND VALUE CHANGE
SAP 34,365 +34%
BMW 24,015 -2%
Deutsche Telekom 23,893 -11%
Louis Vuitton 22,719 -12%
Zara 20,167 +60%
Hermès 19,129 0%
L'Oréal 17,971 +30%
Mercedes-Benz 17,952 +11%
Orange 13,829 -10%
Movistar 13,336 -22%
+5%
BRAND BRAND VALUE($M)
BRAND VALUE
CHANGE
Amazon 45,727 +34%
Walmart 36,220 +5%
The Home Depot 18,488 +43%
eBay 17,749 +40%
Tesco 16,303 -9%
IKEA 12,040 +31%
Target 11,879 +13%
Woolworths 11,039 -
ALDI 8,885 -5%
Lowe’s 7,559 +26%
Consumer: Top 20 Retail 2013
BRAND BRAND VALUE($M)
BRAND VALUE
CHANGE
Carrefour 7,372 -6%
Costco 6,789 +33%
Whole Foods 6,728 -
Walgreens 5,925 -
CVS 5,620 -
Falabella 5,611 +7%
M&S 4,649 +7%
Asda 4,617 +19%
Lidl 4,524 -2%
Coles 4,416 -
Key Take Aways
PURPOSE
CONSUMERS
COMMUNICATION
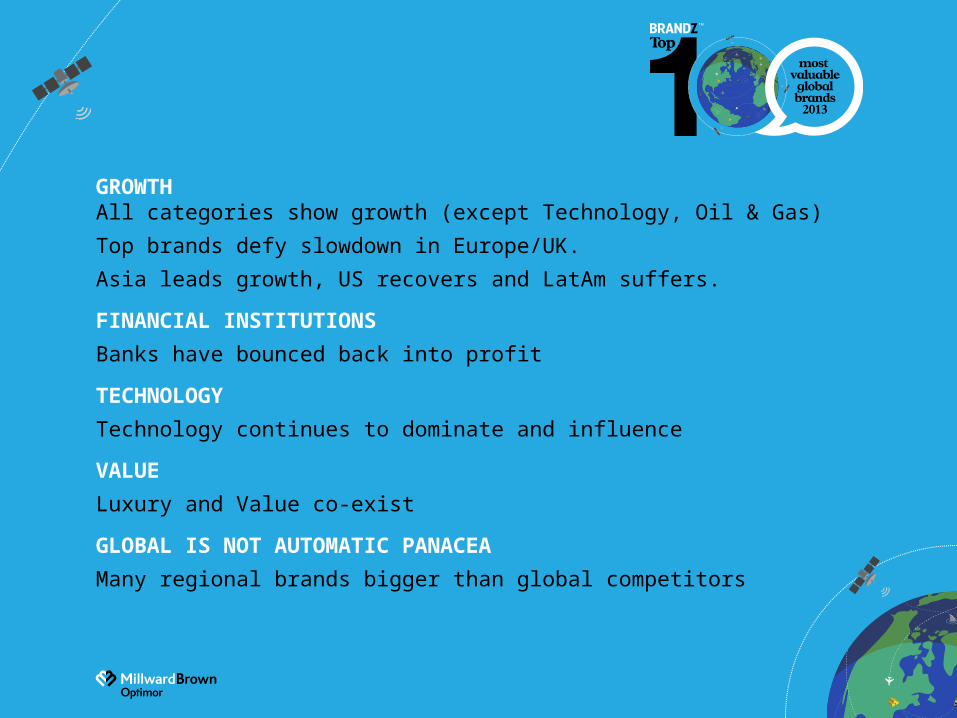
GROWTH
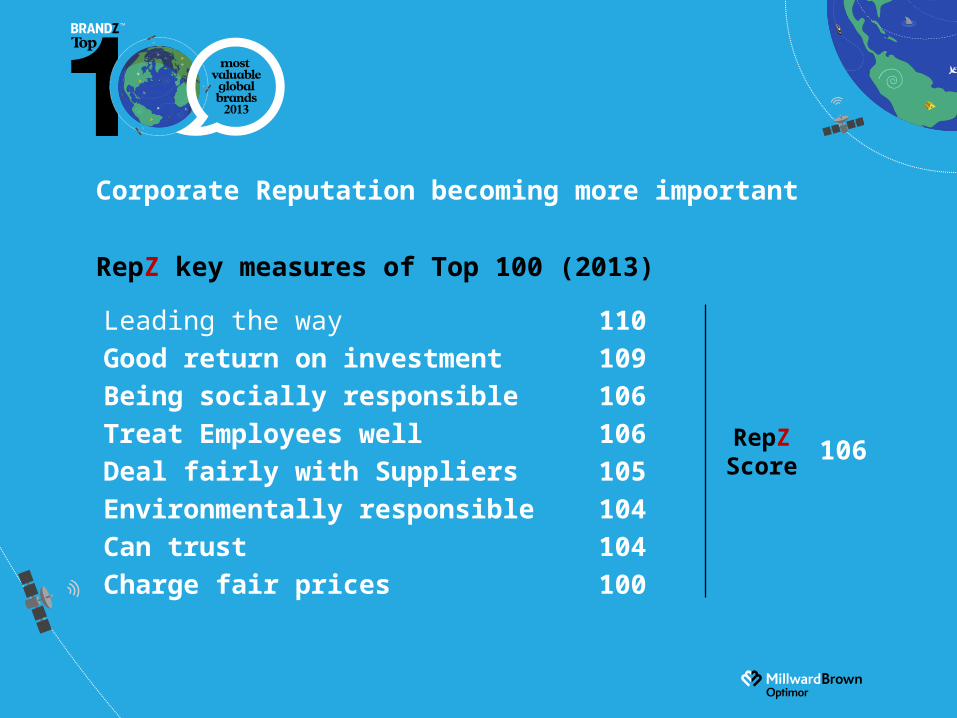
Corporate Reputation becoming more important
RepZ key measures of Top 100 (2013)
Leading the way 110Good return on investment 109Being socially responsible 106Treat Employees well 106Deal fairly with Suppliers 105Environmentally responsible 104Can trust 104Charge fair prices 100