Page 1
The role of BK channel in cellular proliferation
and differentiation in human osteoblast and
osteoblast-like cells
By
Bo Li
A thesis presented to the Cardiff School of
Pharmacy and Pharmaceutical Science of
Cardiff University
For the degree of Doctor of Philosophy
July 2012
Page 2
I
Summary
Both excitable and non-excitable cells possess plasma membrane ion channels
and evidence has accumulated over the last 30 or so years that these channels
perhaps play key roles in the cell life and death. This Thesis investigated the
characteristics and putative functions of one class of potassium channel, the
BK channel in osteoblast-like cells and primary osteoblasts from human, rat
and mouse. The properties and functions were defined in vitro using a
combination of patch-clamp, reverse transcription-polymerase chain reaction
(RT-PCR) and functional assays for cell growth and mineralisation. RT-PCR
showed the presence of KCNMA1, KCNMB1, KCNMB2, KCNMB3 and
KCNMB4, the gene for BK channel α, β1, β2, β3 and β4 subunits respectively.
The channel was voltage-dependent with a mean unitary conductance of 315
pS in cell-attached patches, a conductance of 124 pS in excised outside-out and
151 pS in inside-out patches. The channel was blocked by TEA (0.3 mM),
TBuA (1 mM), TPeA (1-10 µM), THeA (1-3 µM), tetrandrine (5-30 µM) and
paxilline (10 µM) and was activated by isopimaric acid (20 µM). Notably
iberiotoxin (IbTX) (90 nM) only blocked a proportion of the channels tested
(2/5). Osteoblast-like MG63 cell number changed in response to BK channel
modulators. It increased significantly with TEA and tetrandrine at low
concentrations (1 mM, 3 μM respectively), and reduced at high concentrations
(>10 mM, >10 µM respectively). It was not affected by IbTX (20-300 nM) or
slotoxin (300 nM). The increase in cell number by TEA was blocked by
isopimaric acid. In addition, TPeA and THeA caused a decrease of osteoblast-
like SaOS2 cell mineralisation at the concentrations (3 and 0.3 µM,
respectively) increased MG63 cell numbers. The BK channel has a distinctive
pharmacology and represents a new target for therapeutic strategies in
modulating osteoblast proliferation.
Page 3
DECLARATION This work has not been submitted in substance for any other degree or award at this or any other university or place of learning, nor is being submitted concurrently in candidature for any degree or other award.
Signed …………LiB………… (candidate) Date …24/07/2012…………
STATEMENT 1 This thesis is being submitted in partial fulfillment of the requirements for the degree of …………PhD………………(insert MCh, MD, MPhil, PhD etc, as appropriate)
Signed …………LiB…… (candidate) Date ……24/07/2012………………
STATEMENT 2 This thesis is the result of my own independent work/investigation, except where otherwise stated. Other sources are acknowledged by explicit references. The views expressed are my own.
Signed …………LiB………… (candidate) Date …24/07/2012……………
STATEMENT 3 I hereby give consent for my thesis, if accepted, to be available for photocopying and for inter-library loan, and for the title and summary to be made available to outside organisations.
Signed ………LiB……………… (candidate) Date …24/07/2012…………
Page 4
II
Acknowledgements
First of all, I would like to show my deepest gratitude to my supervisor, Prof. K.
T. Wann, without his supervision and encouragement I could never compelte
the thesis. His kindness and vigorous academic observation enlightens me not
only in this thesis but also in my future life.
I really appreciate Dr. Bronwen Evans for all her previous advices and support.
I would also like to thank Ms. Carole Elford, Dr. Neil Henny, Dr. Pablo
Reviriego and all the other members in Welsh school of Parmacy for their
support and help during all these years.
Finally, I would show my love and gratitude to my parents and family for their
supports and encouragement.
Page 5
III
Abbreviations
[Ca
2+]i Intracellular calcium concentration
[K+]i Intracellular potassium concentration
[K+]o Extracellular potassium concentration
ALP Alkaline phosphatase
α-MEM α minimal essential medium
BK channel Large conductance Ca-activated potassium channel
BMPs Bone morphogenetic proteins
ChTX charybdotoxin
DMEM Dulbecco’s modified eagle medium
DPBS Dulbecco’s phosphate buffered Saline
ED50 Median effective dose
FBS Fetal bovine serum
FGF Fibroblast growth factor
Giga-seal A seal between the pipette tip and the cell membrane in
the patch-clamp technique that creates an electrical
resistance between the pipette solution and the bathing
solution of more than 1 giga-Ohm
HOB Human primary osteoblast
IbTX iberiotoxin
IK channel Intermediate conductance Ca-activated potassium
channel
KATP channel ATP dependent potassium channel
KCa channel Ca-activated potassium channel
Kir channel Inwardly rectifying potassium channel
Kv channel Voltage-gated potassium channel
MTS 3-(4, 5-dimethylthiazol-2-yl)-5-(3-
carboxymethoxyphenyl)-2-(4-sulfophenyl)-2H-
tetrazolium
OD Optical Density, absorbance
PCR Polymerase chain reaction
PDGF Platelet-derived growth factor
PKA Protein kinase A
PKC Protein kinase C
PKG cGMP-dependent protein kinase
Po Ion channel opening probability
PTH Parathyroid hormone
QAs Quaternary ammonium acids
SK channel Small conductance Ca-activated potassium channel
Slo BK channel α subunit
STOC Spontaneous transient outward current
TBuA tetrabutylammonium acid
TEA tertraethylammonium acid
THeA tetrahetylammonium scid
TPeA tetrapentylammonium acid
VDCC Voltage-dependent Ca channel
Vm Membrane voltage
Page 6
IV
TABLE OF CONTENTS
Summary I
Acknowledgements II
Abbreviations III
Table of Contents IV
List of figures VIII
1. INTRODUCTION……………………………………………………………...1
1.1 Overview ....................................................................................................... 1
1.2 Ion channels ................................................................................................. 2
1.2.1 Potassium channel ............................................................................. 3
1.2.2 Potassium channel structure ............................................................ 4
1.2.3 Potassium channel: localization and function ................................. 7
1.2.4 Cacium-activated potassium channel ............................................ 12
1.2.4.1 SK and IK channel ............................................................. 14
1.2.4.2 BK channel .......................................................................... 16
1.2.4.3 Pharmacology aspects ........................................................ 23
1.2.4.4 BK channel- therepeutic indications ................................. 28
1.3 Bone ............................................................................................................ 29
1.3.1 Bone formation and composition .................................................. 30
1.3.2 Osteoblast ........................................................................................ 33
1.3.3 Regulatory factors in osteoblast function ..................................... 35
1.4 Potassium channel in bone cells ............................................................... 37
2. METHODS AND MATERIALS……………………......................................41
2.1 Cell culture ................................................................................................. 41
2.1.1 Human osteoblast-like cell lines ..................................................... 42
2.1.2 Mouse osteoblast-like cell line ........................................................ 43
2.1.3 Human primary osteoblasts ........................................................... 44
2.1.4 Mouse/rat primary bone marrow cells and osteoblasts ............. 44
2.1.5 Mouse osteocyte cell line (MLO-Y4) ............................................. 45
2.2 Electrophysiology....................................................................................... 47
2.2.1 Basic theory of patch-clamping and the equipment set up........... 47
2.2.2 Different configuration of patch clamping .................................... 49
2.2.3 Software and data analysis .............................................................. 53
2.3 Cell number assays .................................................................................... 56
2.3.1 Viability assay ................................................................................... 56
2.3.2 MTS assay ......................................................................................... 57
2.4 Mineralisation assay .................................................................................. 59
2.5 Drugs and solutions ................................................................................... 60
2.6 RT-PCR ...................................................................................................... 61
Page 7
V
2.7 Statistics ...................................................................................................... 63
3. ION CHANNEL SURVEY IN OSTEOBLAST AND OSTEOBLAST-LIKE
CELLS……………………………………………………………………………64
3.1 Introduction ............................................................................................... 64
3.1.1 Potassium channels, a widley distributed class of ion
channel .............................................................................................. 65
3.1.2 Potassium channels in inexcitable cells .......................................... 67
3.2 Materials and methods .............................................................................. 68
3.3 Results ......................................................................................................... 70
3.3.1 Channels in human osteoblast-like cells ........................................ 72
3.3.2 Channels in human primary osteoblast (HOB) ............................ 74
3.3.3 Channels in mouse primary osteoblast and bone marrow
cells .................................................................................................... 75
3.3.4 Channels in mouse osteoblast0like cells (7F2) .............................. 76
3.3.5 Channels in mouse osteocytes (MLO-Y4) ..................................... 77
3.3.6 Channels in rat primary osteoblasts and bone marrow cells ...... 77
3.3.7 potassium channels in HEK293-α cells .......................................... 78
3.4 Discussion ................................................................................................... 78
3.4.1 Potassium channels in osteoblast-like cells .................................... 81
3.4.2 Channels in primary bone cells ...................................................... 83
3.4.3 Channels in other cells surveyed .................................................... 84
3.5 Conclusion ................................................................................................... 85
4. EXPRESSION AND ACTIVITY OF BK CHANNELS IN MG63 AND HOB
CELLS……………………………………………………………………………86
4.1 Introduction ............................................................................................... 86
4.1.1 BK channel structure ...................................................................... 87
4.1.2 BK channel characteristics ............................................................. 89
4.1.3 BK channel expression and function ............................................. 90
4.2 Methods and material ............................................................................... 91
4.2.1 Cell culture ....................................................................................... 91
4.2.2 RT-PCR ............................................................................................ 91
4.2.3 Patch-clamp ..................................................................................... 94
4.3 Results ......................................................................................................... 94
4.3.1 RT-PCR in MG63 and HOB cells .................................................. 94
4.3.2 BK channels are functional in both MG63 and HOB cells .......... 95
4.3.2.1 BK channels in MG63 cells ................................................... 95
4.3.2.2 BK channels in primary human osteoblasts ........................ 97
4.3.3 Conclusion .......................................................................................... 98
4.4 Discussion ..................................................................................................... 98
4.4.1 RT-PCR showing the espression β1 and β4 subunits ................. 98
4.4.2 Eletrophysiological features of BK channels in MG63 and
HOB cells ........................................................................................ 100
4.5 Conclusions ................................................................................................. 101
5. BK CHANNELS IN OSTEOBLASTS SHOW NEURONAL-TYPE
FEATURES……………………………………………………………………………………………………………103
5.1 Introduction ............................................................................................. 103
Page 8
VI
5.1.1 BK channel regulators .................................................................. 103
5.1.1.1 Estrogen variable effects on BK
channel.............................................................................................103
5.1.1.2 Voltage-gated channel blockers, the quaternary
ammonium acid family .................................................................. 104
5.1.1.3 Iberiotoxin belongs to the toxin peptide family ................ 106
5.1.1.4 Alkaloid BK channel blockers: tetrandrine and
paxilline ........................................................................................... 107
5.1.2 BK channel structure and sensitivity to the regulators ............. 109
5.2 Methods and materials ............................................................................ 111
5.2.1 Cell culture ..................................................................................... 111
5.2.2 Test compunds and the perfusion system .................................... 111
5.2.3 Configuration of patch clamping ................................................. 113
5.3 Results ....................................................................................................... 114
5.3.1 TEA and the quaternary ammonium acids blocked BK
channels in MG63 and HOB cells ................................................. 114
5.3.2 BK channels in MG63 and HOB cells were more sensitive to
alkaloids than peptide toxin ......................................................... 116
5.3.3 BK channel sensitivity to other regulators ................................... 117
5.3.4 Summary ......................................................................................... 117
5.4 Discussion ................................................................................................. 118
5.4.1 The β1 subunit and the BK channel sensitivity to estrogen ......... 118
5.4.2 BK channel sensitivity to peptie toxins and alkaloids .................. 119
5.4.3 BK channel react to the quaternary ammonium acids ................ 120
5.4.4 BK channel are activated by the opener isopimaric acid ............. 122
5.5 Conclusion ................................................................................................ 122
6. BK CHANNELS HAVE ROLES IN OSTEOBLAST CELL
FUNCTION…………………………………………………………………….123
6.1 Introduction ............................................................................................. 123
6.1.1 Osteoblasts in bone .......................................................................... 124
6.1.2 Potassium channels and cell proliferation ..................................... 124
6.2 Methods and materials ............................................................................ 125
6.2.1 Cell culture in growth assays .......................................................... 125
6.2.2 Haemocytometer counting .............................................................. 126
6.2.3 MTS assays ....................................................................................... 127
6.2.4 Mineralization ………….….………………………...……………127
6.2.5 Data analysis .................................................................................... 128
6.3 Results ....................................................................................................... 129
6.3.1 MTS assay ........................................................................................ 129
6.3.2 Haemocytometer counting .............................................................. 131
6.3.3 Mineralisation .................................................................................. 131
6.4 Discussion ................................................................................................. 132
6.4.1 Peptide toxins showed no effects on MG63 cells growth .............. 132
6.4.2 TEA and other quaternary ammonium acids ............................... 133
6.4.3 Alkaloids increased MG63 cell numbers ....................................... 134
6.4.4 Experimental design ........................................................................ 135
7. DISCUSSION………………………………………………...………………137
Page 9
VII
7.1 Summary .................................................................................................. 137
7.2 BK channels in osteoblast have novel charateristics ............................ 138
7.3 BK channel modulators and MG63 cell growth ................................... 141
7.4 Techniques and experimental design ..................................................... 145
7.4.1 Cell culture ..................................................................................... 145
7.4.2 Patch successful rate and seal formation ..................................... 146
7.4.3 Cell growth assays ......................................................................... 147
7.5 Future work ............................................................................................. 148
7.5.1 The composition of BK channel subunits in osteoblast ................ 148
7.5.2 Apoptosis and proliferation ............................................................ 150
7.6 Conluding statement…………………………………….……….....……150
8. REFERENCES…………………………………………………………...…..152
Page 10
VIII
LIST OF FIGURES
1. Introduction
Figure 1.1 Three typical structures of potassium channel……………...…….….5
Figure 1.2 The unique family of potassium channel…………………………......6
Figure 1.3 The numbers of publications within 20 years on two subjects.............9
Figure 1.4 BK channel structure consist of the pore forming α subunit and
associated β subunit………………………………………………………..……...20
Figure 1.5 Four different β subunits were identified in different tissues………..20
Figure 1.6 Cortical and trabecular bone…………………………………………32
Figure 1.7 Diagram of the ion channels revealed in mammalian osteoclasts…...38
2. Methods and materials
Figure 2.1 mouse/rat osteoblast and bone marrow cell seperation…… …….....46
Figure 2.2 bone cells grwothing out from cortical bone fragments…………….46
Figure 2.3 Patch clamp equipment…………………… ……………..………...52
Figure 2.4 Four different configurations of patch-clamping................................53
Figure 2.5 Viable cells counts……………………..……………………………57
3. Ion channel survey in osteoblast and osteoblast-like cells
Figure 3.1 Channel openings recorded at various membrane potentials in single
cell- attached patch from an MG63 cell ……………….………………….…..(3-1)
Figure 3.2 I-V plots from the openings of 2 different channels……………... (3-2)
Figure 3.3 In MG63 cells small conductance channels were found alongside a
large conductance channel in both inside-out and outside-out patches…….…. (3-3)
Figure 3.4 Channel openings recorded at various membrane potentials in a single
cell-attached patch from an SaOS-2 cell………………………….…………… (3-4)
Figure 3.5 Sample traces of single channel current recorded in different cell-
attached patches from HOB cells ………………………………………………(3-5)
Figure 3.6 I-V plots from the 3 different channel openings………………… (3-6)
Figure 3.7 The corresponding voltage-activation curves for these channels in
HOB cells…………………………………..………………………………….. (3-6)
Figure 3.8 The large conductance channel is present in mouse primary bone cells
in both cell-attached and inside-out patches………………..……………….… (3-7)
Figure 3.9 The relationship between the Po of the large conductance channel and
membrane potenial in a cell-attached patch from a mouse primary bone cell... (3-7)
Figure 3.10 Two types of channels in inside-out patches from two 7F2 cell. .(3-8)
Page 11
IX
Figure 3.11 A small conductance channel is present and active in cell-attached
patches from a MLO-Y4 cell………………………………………………… (3-9)
Figure 3.12 Cell -attached patches from HEK293-α cells possessed large
conductance channels……………………………………………………..….(3-10)
4. Expression and activity of BK channels in MG63 and HOB cells
Figure 4.1 Gel eletrophoresis shows bands equivalent to the predicted size of the
BK channel subunits………………………………. …………………..…….. (4-1)
Figure 4.2 Channel openings in a cell-attached pattch at a number of depolarised
potential from 60 mV to 140 mV………………………..…………………… (4-2)
Figure 4.3 Raw multi-channel data in an inside-out patch in reverse asymmetric
K gradient ……………………………………………………………………..(4-2)
Figure 4.4 I-V data for the BK channel in outside-out, cell-attached and inside-
out patches……………………………………………………………………. (4-3)
Figure 4.5 Po versus voltage data from cell-attached and inside-out patch…(4-3)
Figure 4.6 Segment and dwell time expotential histogram ……...…………(4-4)
Figure 4.7 The Po from outside-out patches………………………………...(4-5)
Figure 4.8 Representative single-channel currents recorded at different potentials
from 20 to 100 mV…………………………………………………………….. (4-6)
Figure 4.9 The pooled I-V relationship for cell-attached patch from HOB cells
…………………………………………………………………………(4-7)
Figure 4.10 Po-V plots from cell-attached patches of MG63, HOB and HEK293-
α cells…………………………………………..……………………………… (4-8)
5. BK channels in osteoblasts show neuronal-type features
Figure 5.1 The graph demontrates continuous irrigation………………….…..112
Figure 5.2 TEA, TBuA, TPeA and THeA blocked BK channels with different
potencies……………………………………………………………………… (5-1)
Figure 5.3 Raw data sowing outside-out patches at 20 mV patch potential in
asymmeric K………………………………….………………………………. (5-2)
Figure 5.4 The BK channel unitary current appears to decrease as the
concentration of external TEA or TBuA was increased…………….…………(5-3)
Figure 5.5 Typical data with external QA compounds in outside-out patches at
20mV…………………………………………………………….……………..(5-4)
Figure 5.6 BK channel Po is reduced by TEA, TBuA, TPeA and THeA ……(5-5)
Figure 5.7 Tetrandrine inhibit BK channel in MG63 cell …………….……...(5-6)
Figure 5.8 IbTX inhibit BK channels in MG63 cells…………………………(5-7)
Page 12
X
Figure 5.9 Paxilline blocked BK channel in MG63 cells…………..……….. (5-8)
Figure 5.10 TEA blocked BK channel in HOB cells……..…………………. (5-9)
Figure 5.11 Tetrandrine inhibit BK channel in HOB cell …………………..(5-10)
Figure 5.12 IbTX inhibit BK channels in HOB cells………………...…….. (5-11)
Figure 5.13 Isopimaric acid actiavted BK channel in MG63 cells………… (5-12)
Figure 5.14 A model to account for the inactivation of IK of QAs…………….121
6. BK channels have roles in osteoblast cell function
Figure 6.1 The OD at 490 nm versus MG63 cell numbers after different
incubation time with CellTiter96……………………………………………… (6-1)
Figure 6.2 The relationship between MG63 cells numbers and TEA
concetrations………………………………………………………………..…. (6-2)
Figure 6.3 The relationship between MG63 cells numbers and tetrandrine and
paxilline concetrations……………………………………………………..… (6--3)
Figure 6.4 The relationship between MG63 cells numbers and TBuA ……..(6-4)
Figure 6.5 The relationship between MG63 cells numbers and TPeA……… (6-4)
Figure 6.6 The relationship between MG63 cells numbers and IbTX and
Slotoxin………………..………………………………………………………. (6-5)
Figure 6.7 The relationship between MG63 cells numbers and TEA and
isopimaric acid ………………………………………………………………...(6-6)
Figure 6.8 Haemocytometer counting showing the the relationship between
MG63 cells numbers and TEA and tetrandrine…………………………..…... (6-7)
Page 13
SECTION 1: INTRODUCTION
1
SECTION 1: INTRODUCTION
1.1 Overview
Non excitable cells express ion channels which play key roles in the growth
and differentiation of these cells. For example in osteoblasts, bone forming
cells, both single cell patch-clamp and RT-PCR show that a number of ion
channels are present. These include large conductance Ca2+
-activated K+
channels (BK) which are amongst the most prevalent channels observed in cell
lines (e.g. MG63 cell). The precise subunit composition of the native BK
channel and its role remain however unknown. BK channels normally exist as
a tetramer of 4 subunits associated with β subunits. The subunit composition,
specifically the type of β subunit co-assembled with the subunits, modifies
both the voltage- and Ca2+
-sensitivity and the pharmacological characteristics
(e.g. sensitivity to iberiotoxin) of BK channels (Orio et al., 2002). This channel
is the focus of this Thesis and the work presented here attempts to delineate a
preliminary pharmacology of the channel, to investigate its role in proliferation
and differentiation and try to specify the subunit composition of BK channels
in both a human cell line (MG63) and primary human osteoblasts HOB cells.
Page 14
SECTION 1: INTRODUCTION
2
1.2 Ion channels
There is a voltage gradient across the plasma membrane of all living cells. It is
also called the cell membrane potential which is caused by the different
permeabilities to charged ions on either side of the membrane. Ion channels,
ion pumps and ion transporters in the membrane are the functional proteins that
exist to generate the relevant permeabilities or to maintain these different ionic
concentrations inside and outside of the cell (Shieh et al., 2000). Ion channels
are different from ion pumps and ion transporters. Ion pumps and ion
transporters move ions against their concentration gradient. Ion channels allow
ions to flow following their electrochemical gradient (Hille, 2001). To enable
them to carry out their functions, ion channels are built of an assembly of
several proteins including the pore forming subunits and regulatory subunits
(Hille, 2001). The pore forming subunits have a selectivity filter to select and
conduct the specific type of ion. The gating mechanism are able to open and
close the channel in response to given cues, such as voltage, ATP and
intracellular calcium (Doyle et al., 1998; Zhou et al., 2001; Jiang et al., 2003).
Ion channels can be classified by the selected ions, the gating system and the
pore number. The ion channels in question are potassium channels, sodium
channels, calcium channels, chloride channels, proton channels and general
(non-specific) ion channels. According to the gating system, ion channels are
classified as voltage-gated, ligand-gated and “other” gated channels. There are
also other classifications and naming based on other characteristics such as
potassium channels and two-pore channels. Large numbers of ion channels
Page 15
SECTION 1: INTRODUCTION
3
have various functions and the disruption of the normal function of ion
channels could lead in principle to a range of diseases (Ashcroft, 1999). Ion
channels have been appealing as an already frequent target for new drugs, and
new ion channels continue to generate extra tremendous excitement as
therapeutic targets. The study of ion channels involves a range of powerful
scientific techniques such as electrophysiology (particularly patch clamp),
molecular biology (e.g. RT-PCR) and immunolocalisation (e.g. Western-blot).
1.2.1 Potassium channels
There is a large super family of ion channels that are potassium channels,
widely expressed in many tissues and organisms. Potassium channels are
classified into subfamilies in different ways as shown on table 1.1. (Chandy et
al.,1991; Gutman and Chandy, 1993; Goldstein et al., 1996 and 2001; Lesage
et al.,1996; Orias et al., 1997; Lesage et al., 2000; Dworetzky et al., 1994;
Kohler et al., 1996 and Papazian et al., 1987).
Table1.1 subfamilies of K channel
Families
Structure
Six transmembrane, one pore channel (6 TM, 1P),
Two transmembrane, one pore channel (2 TM, 1P),
Four transmembrane, two pore channel (4 TM, 1P)
Gating system
Calcium-activated K channel,
Voltage-gated K channel
The large numbers of different types of potassium channels map out their wide
expression and various functions. Briefly, potassium channels (e.g. voltage-
Page 16
SECTION 1: INTRODUCTION
4
gated potassium channel) have a role in setting the resting membrane potential
and regulate action potential of excitable cells (e.g. neurons) and processes
such as cellular proliferation in non-excitable cells (e.g. glioma) (Wonderlin et
al., 1996; Huang and Rane, 1994). Therefore the location, structure and
regulatory mechanisms of these channels remain worthy of investigation.
1.2.2 Potassium channel structure
Potassium channels have been investigated for decades and their structures are
well known and have been used to name the channel subfamilies. As described
above there are 3 different structural subfamilies according to the structure of
the channel subunit (Fig. 1.1). The principal subunits co-assemble in the
following ways. The 6 TM groups which include the KV channel have both the
N- and C-termini located intracellularly and the region (the P-loop) between
the fifth and sixth transmembrane domains (S5 and S6) forms the ion
conduction pathway. The functional channel of the first class is formed by the
tetrameric association of these 6 TM and 1 pore subunits (Chandy et al., 1991;
Gutman and Chandy, 1993). BK channel structure is described below (Fig.
1.4). The second class includes inward rectifiers, KATP channels and G protein-
coupled channels (Doupnik et al., 1995). These channels also have two TM
domains with intracellular N- and C-termini. The P loop between the 2 TM
domains forms the pore, and the functional channel is a tetramer of subunits
with 2 TM and the pore.
Page 17
SECTION 1: INTRODUCTION
5
Fig 1.1 Three typical structures of potassium channel subunit. (A) 6
transmembrane and 1 pore subfamily. P-loop between S5 and S6 forms
the ion pore and S4 acts as voltage-sensor. (B) 2 transmembrane and 1
pore subfamily. Ion pore is also formed by the loop between the 2
transmembrane domains. It has no voltage sensor so it is not a voltage-
gated channel. (C) Four transmembrane and 2 pore subfamily. 2 loops
(P1&P2) between the transmembrane domains form 2 ion pores in each
monomer (these graphs were taken from Shieh et al., 2000).
Page 18
SECTION 1: INTRODUCTION
6
The third class, the K2P family, contains two subunits each with 2 TM domains
and 1 pore region. These two subunits are linked in tandem, and the functional
channel is a dimer of the subunits with 4 TM and the pore subunits. Another
class of channel has a 6 TM and 1 pore segment linked in tandem to a 2 TM
and 1 pore segment, and in this case the functional channel is formed from the
dimeric association of the subunits with 8 TM and the pore. We can summarize
these channels in a phylogenetic tree (Fig. 1.2) (Gutman et al., 2003). This
gives some idea of the vast number of potassium channels possible.
Fig 1.2 The unique family of potassium channels. The green lines indicate the
2 TM and 1 P subfamily including inwardly rectifying K channels (Kir), the
purple lines indicate the 6 TM and 1 P subfamily including voltage-gated K
channels (Kv), KQT-like channels (KCNQ) and Ca-activated channel (KCa)
and the yellow lines indicate the 4 TM and 2 P subfamily (the graph was taken
from http://www.ipmc.cnrs.fr/~duprat/ipmc/nomenclature.htm, created by
Fabric Duprat, accessed date 15th
June 2012).
Page 19
SECTION 1: INTRODUCTION
7
1.2.3 Potassium channels: localization and functions
Ideas on potassium permeability and potassium channels were first published
with reference to the resting membrane potential and action potential of nerve
axons (Hodgkin and Huxley, 1945; Hodgkin and Huxley, 1952 and Hodgkin
and Katz 1949). Now they are known in virtually all types of cells (both
excitable and non-excitable cells) in all organisms. They play critical roles in
many different biological tasks, but all potassium channels carry out a basic
function that is the transmembrane translocation of K+ ions. The opening of a
potassium channel leads to K+
movement from the intracellular to extracellular
environments. It automatically results then in a negative change in the voltage
across the cell membrane. Membrane repolarisation or hyperpolarisation
occurs in different tissues for different reasons. Obviously, in excitable cells,
such as nerve, muscle, hormone-secreting adrenal chromaffin and pancreatic β
cells potassium channel activation is involved solely in membrane potential
regulation. Equally potassium channel-related hyperpolarization of T and B
cells is a pre-requisite for mitogenesis and proliferation in the immune
response (DeCoursey et al., 1984; Chandy et al., 1984; Matteson et al., 1984
and Fukushima et al., 1984). But potassium channels are also expressed in
other non-excitable cells. We already know that potassium channels play roles
in the cellular recycling of K+
ions required for the electrolyte balance affected
by the renal epithelium (Giebisch, 1998; Palmer et al., 1994; Muto et al., 1999
and Wang et al., 1993). Potassium channels may also be crucial for tumour
development and the growth of cancer cells (Skryma et al., 1994). Is this
Page 20
SECTION 1: INTRODUCTION
8
related to a role in membrane potential control? Even in bacteria, potassium
channels are found and have a presumed role in volume regulation and the
maintenance of cell shape (Booth et al., 2003). For over almost three decades,
potassium channel functions in lymphocytes and in cell proliferation were
highlighted discoveries in the field of potassium channels in non-excitable cells
and there have been a steady expansion of publications (Chandy et al., 2004).
Fig1.3 indicates the rapid and steady expansion of publication in these two
fields from 1970s till November 2003 (Chandy et al., 2004).
Over these years, cell proliferation studies show clearly that inhibition of K+
channel expression or usage of specific potassium channel blockers may reduce
cancer cell proliferation (Rybalchenko et al., 2001; Abdul et al., 2003 and
Asher et al., 2011). Further investigation reveals that there is not only one type
of potassium channel present in different cancer cells from prostate, colon,
lung, breast and other tissues. A variety of K+ channels are found in these
tissues including Ca2+
-activated K+ channels (including the intermediate-
conductance and large-conductance Ca2+
-activated K+ channels), Shaker-type
voltage-gated K+ channels, voltage-gated K
+ channels and 2P-domain K
+
channels.
Page 21
SECTION 1: INTRODUCTION
9
Fig 1.3 The numbers of publications within 20 years (1984-2004) on two
subjects: (a) potassium channels and Lymphocytes, (b) potassium channel and
proliferation (these graphs were taken from the article K+ channels as targets
for specific immunomodulation Chandy et al., 2004).
Page 22
SECTION 1: INTRODUCTION
10
Voltage-gated potassium (Kv) channel functions in excitable tissues such as
nerve and muscle cells of heart are clear. In the excitable cells, the membrane
potential can depolarize to a level to activate Kv channels. In contrast, the
mechanism underlying potassium channel regulation of cell proliferation is an
unknown question. The cell membrane potential of non-excitable cells is
presumably stable under most conditions. When cells divide the membrane is
depolarised. Studies have revealed significantly that the cancer cell membrane
potential is typically more depolarized compared to the membrane potential of
terminally differentiated normal cells (O’Grady and Lee, 2005). For example,
when carcinoma cells are bathed in serum-containing media, a depolarized
membrane voltage is detected. The depolarized membrane voltage of
carcinoma cells may result in activation of Kv channels. In contrast, no
depolarized membrane voltage is detected when carcinoma cells are bathed in
serum-free Ringer’s solution (Kunzelmann, 2005). Since electrophysiological
studies are continuously carried out on cells that are bathed in a serum-free
solution, little is known about the membrane voltage of normal cells and cancer
cells in vivo. Kv channels may not be active in serum-free culture solution.
They are active in vivo due to the particular composition of phospholipid
metabolites and other intracellular factors such as oxygen deprivation and the
local acidosis. In general, roles of KV channels in cancer cell growth could be
related to a number of possible factors, but consideration of the membrane
potential as the driving influence would appear to be a sound place to start.
Page 23
SECTION 1: INTRODUCTION
11
Not only KV channels but also Ca2+
-activated K+ channels have been
discovered in many cancer cells such as those of the prostate (Abdul and
Hoosein 2002 and Parihar et al., 2003), the uterus (Suzuki et al., 2004), glioma
(Basrai et al., 2002), the stomach (Elso et al., 2004), the pancreas (Jager et al.,
2004), the pituitary gland (Czarnecki et al., 2003), the breast (Ouadid-
Ahidouch et al., 2004) and the colorectum (Lastraioli et al., 2004). The
investigations intriguingly demonstrate the expression of a K channel that
modulates cell cycle. The enhanced density of intermediate-conductance Ca2+
-
activated K+ channel (IK) is detected in breast cancer (MCF-7) cells
synchronized at the end of the G1 and S phase when compared with early G1
phase. High IK1 activity induces a more negative membrane potential of the
cells at the end of G1 phase (Ouadid-Ahidouch et al., 2004). This negative
membrane potential may paradoxically induce Ca2+
inflexion hence support the
high basal intracellular Ca2+
concentration in late G1 (Ouadid-Ahidouch et al.,
2004). In addition, the large-conductance (BK) K+ channels were detected
expressing predominantly in the S phase of breast cancer cells. This leads to
the evaluation of the impact of BK channel activation on proliferation currently
(Bloch et al., 2007). In a recent study the expression of BK channels was found
enhanced in prostate cancer cells. It was ascribed to be the genomic
amplification of the KCNMA1 locus which encodes the principal α-subunit of
the BK channel (Bloch et al., 2007). BK channel showed “a high activity in
fast growing malignant prostate cancer cells, but little contribution to the
conductance in cultured epithelial cells from benign prostate hyperplasia” in
Bloch’s experiments (Bloch et al., 2007). In conclusion, convincing evidence
Page 24
SECTION 1: INTRODUCTION
12
showed that Ca2+
-activated K+ channels are involved in the proliferation of
cancer cells, probably during late G1 and S phase. But it is unclear whether this
applies only to cancer cells or to all other proliferating cells. Thus, studies on
normal cells and tumour cells are necessary.
The Ca2+
-activated K+ channels control proliferation of endothelial cell as well.
The proliferative properties of Ca2+
-activated K+ channels have been closely
linked to their influence on both spatial and temporal aspects of intracellular
Ca2+
levels in vascular smooth muscle and endothelial cells (Neylon, 2002).
BK channels have been found playing key roles in endothelial cell proliferation
and formation of atherosclerotic plaques (Kuhlmann et al., 2003). And
endothelin-1 also induced human endothelial cell proliferation by activating
BK channels (Kuhlmann et al., 2005).
1.2.4 Calcium-activated potassium channels
As indicated above, calcium-activated potassium channels (KCa) have key roles
in cell proliferation which is an unusual but an important function of these ion
channels. The following discussion deals with the principal properties of these
channels reviewing their distinguishing features.
The KCa channel family can be divided into three groups based on their
respective physiology, pharmacology and biophysical characteristics: The large
conductance (100-300 pS) KCa group includes the KCa1.1 channel (Marty,
Page 25
SECTION 1: INTRODUCTION
13
1981), the intermediate conductance (25-100 pS) consists of the KCa3.1
channel (Gardos, 1958; Ishii et al., 1997; Logsdon et al., 1997), and the small
conductance (2-25 pS) group (Blatz and Magleby, 1986; Park, 1994) comprises
the KCa2.1, KCa2.2 and KCa2.3 channels.
All KCa channels are activated in response to an increase in intracellular Ca2+
and KCa1.1 channel is the only one that can also be activated by membrane
depolarization. The KCa1.1 channel also has a unique topology structure. Being
different to the other KCa channels, it has 7 transmembrane domains with an
extracellular N-terminus (Wallner et al., 1996), while all the other KCa channels
are similar to the voltage-gated K+ channels (six transmembrane domains with
intracellular N- and C-termini). The functional channel of all the KCa family
members is composed of four pore-forming subunits with an occasional
auxiliary (β) subunit.
KCa channels are expressed in almost all cells where they integrate cellular
metabolism with cellular electrical activity, contributing to various
physiological functions. In general the key physiological functions of KCa
channels include: KCa1.1 channel modulates smooth muscle tone and
neurotransmitter release (Hewawasam et al., 2000 and Tanaka et al., 1998) KCa
2.1 channel modulates neuronal excitability (Ikeda et al., 1991) and KCa 3.1
modulates lymphocyte activation and epithelial cell secretion (Khanna et al.,
1999; Amigorena et al., 1990 and Edwards, 1998).
Page 26
SECTION 1: INTRODUCTION
14
1.2.4.1 SK and IK channels
KCa2.1 channel, the small conductance Ca2+
-activated K+ channel (SK)
subfamily contains three highly homologous members: KCa2.1, KCa2.2 and
KCa2.3 (Kohler et al., 1996). As mentioned above, SK channels have a similar
topology structure to the Kv channels but display only two positively charged
amino acids at the S4 segment while Kv channels typically display seven. This
difference may certainly contribute to the voltage insensitivity of the KCa
channels. Therefore, SK channels are activated by increasing cytosolic Ca2+
rather than voltage (Stocker, 2004). In contrast, the SK channels are highly
sensitive to intracellular Ca2+
(300-700 nM). This type of Ca2+
-dependent
activation is achieved by the constitutive binding of the SK channels to
calmodulin, a highly expressed Ca2+
-binding protein, via a calmodulin-binding
domain situated at the cytoplasmic C-termini (Xia et al., 1998).
Several studies have detected that the SK channels are the only known targets
of the bee venom toxin, Apamin. KCa2.1 is the least sensitive (IC50=3.3~13
nM), KCa2.2 is the most sensitive (IC50= 63 pM) and KCa2.3 shows
intermediate sensitivity (IC50= 2 nM) (Kohler et al., 1996). SK channels are
highly distributed in the central nervous system (Stocker and Pedarzani, 2000).
They are involved in the membrane potential regulation. Following an action
potential, the membrane is hyperpolarized which is termed an
afterhyperpolarization (AHP). Three types of AHP are distinguished, the fast
(fAHP), the medium (mAHP) and the slow (sAHP). Investigations found SK
Page 27
SECTION 1: INTRODUCTION
15
channels trigger the mAHP which means the SK channels are involved in the
control of firing rate (the number of APs generated over a unit of time) and of
the firing pattern (the way the APs are distributed over an interval of time)
(Pedarzani et al., 2000 and Wolfart et al., 2001). In different neuronal
populations, KCa channel operation may have different physiological
consequences. For example, in midbrain dopaminergic neurons SK channel
function impacts on dopamine secretion (Wolfart et al., 2001). SK channels are
heavily expressed in the basal ganglia (in particular in the substantia nigra, pars
compacta) and in the limbic system, suggesting that they may modulate
motricity and emotional behaviour. SK channels may be a key target in the
therapy of several pathological disorders which depend on function of these
neurons, such as Parkinson’s disease and schizophrenia (Liegeois et al., 2003).
The KCa3.1 (IK) channel is the member of the Ca2+
-dependent K+ family with
an intermediate conductance. It was the first Ca2+-
dependent K+ channel to be
detected in human erythrocytes and was known as the Gardos channel but it is
still the least studied one (Gardos, 1958). The channel has the same basic
topology of the KCa subfamily and also binds to calmodulin. This channel has a
high sensitivity to intracellular Ca2+
(200-300 nM) (Hoffman et al., 2003). The
IK channels are expressed mainly in the periphery, in cells of hematopoietic
origin, colon and salivary glands. IK channels show different pharmacological
properties to SK channels. Thus they are insensitive to apamin, but sensitive to
the peptide toxins Charybdotoxin (that also blocks BK channels) and
Maurotoxin (that also blocks Kv1.2). Since IK channels were first identified in
Page 28
SECTION 1: INTRODUCTION
16
human erythrocytes channel function was investigated in the haematology
arena first. In normal resting T-lymphocytes IK channels are expressed at a
relatively low level. The voltage-dependent K+ channel Kv1.3 is the main
channel responsible for maintaining the cell membrane potential. However in
activated T-lymphocytes the numbers of IK channels are markedly increased
(Ghanshani et al., 2000). The IK channel activities are involved in T cell
proliferation and differentiation into effector T cells. During cell growth there
is a sustained Ca2+
entry that lasts for a few hours. The resulting high Ca2+
level would inhibit additional Ca2+
entry, but the opening of the IK channels
causing efflux of K+ would provide a hyperpolarization effect that helps the
Ca2+
entry through steepening of the electrochemical gradient (Cahalan et al.,
1997). Specific blockers of the IK channel prevent T-lymphocyte proliferation
which is consistent with this presumed role for the IK channel (Chandy et al.,
2001). Furthermore, recent studies revealed that in vivo blockage of the IK
channel can be useful in pathological situations that involve excessive T-
lymphocyte-mediated activation. This could be of clinical utility in T-
lymphocyte-mediated autoimmune diseases such as multiple sclerosis and T-
lymphocyte-mediated inflammation amongst others.
1.2.4.2 BK channel
KCa1.1 (BK) channel is the most intensively studied channel of the KCa
subfamily. This type of channel can be easily detected for channel opening
generates large unitary K+ currents. The BK channel has a conductance of
Page 29
SECTION 1: INTRODUCTION
17
100~300 pS (Toro et al., 2005), while other vertebrate K+ channels have
conductances ranging from 2 to 100 pS (Hille, 1992). Investigations reveal that
there are two possible reasons for the large conductance: 1. The BK channel
crystal structure shows two rings of negative charged glutamate on the inner
pore-helix at the inner mouth of the channel (Nimigean et al., 2003 and
Brelidze et al., 2003). 2. The BK channel has a larger internal vestibule and an
internal mouth than other K channels. These are the conclusions reached from
the following studies. Li and Aldrich (2004) showed that large quaternary
ammonium compounds bind to the BK channel from the inside much quicker
than to the Shaker channel (Li and Aldrich, 2004). Once these compounds were
bound, the BK channel can close behind them trapping them, whilst the Shaker
channel cannot (Li and Aldrich, 2004). In addition, Brelidze and Magleby
(2005) found that the increased concentration of sucrose on the internal side of
the BK channel reduced the channel conductance. BK channel’s inner mouth is
estimated based on the amount of sucrose needed to make the diffusion of K+
from the bulk solution to the inner mouth of the channel rate limiting. The
results showed that BK channel’s internal mouth is twice as large (20 Å in
diameter) as that of the Shaker channel (Webster et al., 2004; Brelidze and
Magleby, 2005) and similar in size to the large-conductance (∼200 pS)
prokaryotic MthK channel (Jiang et al., 2002). Their large conductance leads to
the fact that BK channels were among the first channels to be studied in detail
at the single channel level with the patch-clamp technique.
Page 30
SECTION 1: INTRODUCTION
18
BK channel is expressed in almost all cell types and it has extraordinary
physiological functions. The BK channel was first described in Drosophila as
the slowpoke channel and later identified in mouse and humans (Pallanck and
Ganetzky, 1994). Surprisingly, although BK channels in different tissues have
very different properties there is only one gene that has been identified
corresponding to this type of channel. In addition, the KCa1.1 channel gene is
extremely conserved among different species in mammals (Toro et al., 1998).
Further studies revealed that there are regulatory subunits and alternative
splicing in BK channel structure contributing to its diversity. The BK channel
topology includes 4 α subunits and 4 auxiliary β subunits as shown in Fig 1.4.
Four β subunits have been identified that consist of two transmembrane
domains, an extracellular loop and cytoplasmic N- and C-termini, and have
different expression patterns. As Fig 1.5 indicates, the β1 subunit (KCNMB1)
was identified in smooth muscle and has high affinity for Charybdotoxin
(CTX), a peptide blocker of BK and IK channels (Knaus, et al., 1995 and Orio,
et al., 2002). The β2 subunit (KCNMB2) was detected in chromaffin cells and
brain, the β3 subunit was identified in testis, pancreas and spleen. The β3
subunit associated BK channel shows rapid inactivation. The β4 subunit is
expressed in the brain. In contrast to the β1 subunit this subunit decreases the
BK channel sensitivity to peptide toxins but the channel is sensitive to the
alkaloid, tetrandrine (Meera et al., 2000; Reinhart et al., 1991 and Wang and
Lemos 1992). In general, the four regulatory subunits increase the sensitivity of
the pore-forming α subunit to intracellular Ca2+
and voltage and can also
change its pharmacological properties. In addition, they may act as binding
Page 31
SECTION 1: INTRODUCTION
19
target for drugs. As mentioned above, alternative splicing of the α subunit,
accounting for physiological differences, has also been identified in various
tissues such as adrenal chromaffin cells, brain and human gliomas (Saito, et al.,
1997; Tseng-Crank, et al., 1994 and Liu, et al., 2002). At least six sites for
alternative splicing have been identified in the mouse BK transcript. Properties
of the different splice variants are reflected in the Ca2+
sensitivity or slowed
channel gating. In addition, BK channels are targets of cellular signaling
pathways including protein phosphorylation, dephosphorylation, and are
regulated by G-proteins and nitric oxide (Schubert and Nelson, 2001 and
Scornik, et al., 1993). Protein phosphorylation has thus far received most
attention and has been widely studied. Channel phosphorylation by protein
kinase A (PKA) and protein kinase C (PKC) seems to stimulate channel
activity in smooth muscle by altering the responsiveness of the channel to Ca2+
(Schubert and Nelson, 2001). Moreover, several proteins have been identified
that can associate with the BK channel such as Syntaxin 1A, β2 adrenergic
receptors and β-catenin (Ling et al., 2003; Liu et al., 2004 and Lesage, et al.,
2004). Interestingly, the effects of these proteins on the BK channels include
regulation of channel distribution in cells and / or current modulation.
Page 32
SECTION 1: INTRODUCTION
20
Fig 1.4 BK channel structure consists of the pore-forming α subunit and
associated β subunit. The α subunit has 7 transmembrane domains (S0-S6) and
thus is different from the other two types of Ca2+
-activated K channels. S1-4
are the voltage sensors and there are charged amino-acid in S4. As in the case
of other Ca2+
-activated K channels, the loop between S5 and S6 forms the ion
pore. The extracellular N-terminus binds the β subunit. β subunit has 2
transmembrane domains connected by a long loop. The N-terminus varies on
different β subunits. 4 α subunits and 4 β subunits form the channel as shown
on the right.
Fig 1.5 Four different β subunits were identified in different tissues. The
properties of the BK channels associated with different β subunit vary as a
consequence.
+ + + +
subunit subunit
K + pore
Ca 2+ bowl
+ + + +
+
+ + +
β subunit α subunit
Voltage sensing
K + pore
Ca 2+ bowl
Page 33
SECTION 1: INTRODUCTION
21
Given the complex modulation of BK channels, the output of the channel could
influence several physiological functions in various tissues. Briefly, BK
channels may be involved in all cellular properties relating to voltage or Ca2+
such as modulation of smooth muscular tone and Ca2+
-dependent
neurotransmitter release (Hewawasam et al., 2000 and Tanaka et al., 1998). BK
channels have been identified in a variety of smooth muscles including
vascular, urinary bladder, uterine and others. In all smooth muscles, the
channel appears to be β1 subunit coupled. Smooth muscle cells contract as a
result of an increase in the intracellular Ca2+
concentration which activates the
Ca2+
-calmodulin-dependent protein kinase. This kinase triggers a biochemical
cascade resulting in muscular contraction. From the beginning, the intracellular
Ca2+
increase is caused by the opening of voltage-dependent Ca2+
channels
(VDCCs) in the plasma membrane or the opening of ryanodine-receptors in the
sarcoplasmic reticulum. Membrane depolarization drives both of these events.
Both a rise in intracellular Ca2+
and the membrane depolarization will activate
the BK channel that respond with an efflux of K+ and an attendant
hyperpolarization of the cell membrane potential. In return, this will close the
membrane VDCCs. In this way, the activities of BK channels work as a
negative feedback on contraction and induce muscle relaxation. Experiments
have shown that the specific BK channel blocker, iberiotoxin induced
membrane depolarization and vasoconstriction (Jaggar, et al., 1998). On the
other hand, BK channel openers would relax vascular smooth muscle by
inducing membrane hyperpolarization and closure of Ca2+
channels. According
to other investigations (Wellman and Nelson, 2003 and Robertson, et al.,
Page 34
SECTION 1: INTRODUCTION
22
1993), several endogenous vasodilators such as nitric oxide, atrial natriuretic
factor, β adrenergic agonists relax vascular muscle directly or indirectly (via
activation of PKA and/or PKG), by activating the BK channel. Studies with β
subunit knockout mice demonstrated that the loss of β subunit produce
hypertension and cardiac hypertrophy (Brenner, et al., 2000 and Pluger, et al.,
2000). This may be because the Ca2+
sensitivity of the BK channel decreases
when it loses the β subunit and can no longer respond normally to an
intracellular Ca2+
increase. Moreover, Fernández-Fernández, J.M. and his team
found a gain-of-function β variant which has a protective effect against human
diastolic hypertension (Fernández-Fernández, et al., 2004). Interestingly this β
variant can further increase the Ca2+
and voltage-sensitivity of the pore forming
α subunit.
Another tissue where BK channels are widely expressed is the central nervous
system. They are expressed non-uniformly in different parts of brain in various
nerve cell types. In similar fashion to their function in smooth muscle, BK
channels act as a feedback inhibitory mechanism in the brain. They initiate
membrane repolarization and prevent further Ca2+
entry through VDCC in
neurons so regulating neurotransmitter release. As a result, importantly BK
channels inhibit excessive depolarization and Ca2+
entry in pathological
situations such as ischaemia or epilepsy (Calderone, 2002).
Consequences of loss of function of BK channels in the body can be explored
by investigating the characteristics of BK channel knockout (BK-/-
) mice. BK-α
Page 35
SECTION 1: INTRODUCTION
23
subunit knockout mice apparently had a normal inner hair cell in the cochlea
phenotype they progressively developed outer hair cell in the cochlea
dysfunction and degeneration starting from 8 weeks (Ruttiger et al., 2004).
These mice also showed cerebella ataxia with deficient motor co-ordination.
They exhibited a range of motor dysfunctions including intention tremor,
abnormal gait, shorter strides, irregular stepping, and decrease speed of
swimming with more frequent floating. Furthermore, there was significantly
reduction of the spontaneous firing of the Purkinje neurons in these animals
(Sausbier et al., 2004). On the other hand, BK-β1 knockout mice have normal
body and kidney weights and normal hearing function and cochlear structure.
In these mice the bowel structure and colon function were observed different.
They had loose fecal matter and a weaker structural integrity of colon than the
normal animal. These changes may relate to the stronger colonic smooth
muscle contractions, reduced reservoir, and water recovery functions of the
colon. And all these could be due to the reduced Ca2+
sensitivity of BK
channels lacking the β1-subunit, which could also resulted in K+ excretion
decreasing and increase in arterial tone and blood pressure in the knockout
mice (Pluznick et al., 2003, 2005, Hagen et al., 2003, Brenner et al., 2000a,
2000b).
1.2.4.3 Pharmacological aspects
BK channel modulators are an efficient way to dissect this channel’s function
and a number were used in this Thesis. BK openers or BK activators are the
Page 36
SECTION 1: INTRODUCTION
24
agents that cause BK channel activation. BK openers increase efflux of K+ ions
leading to hyperpolarization. Thus they decrease cell excitability in excitable
cells or cause smooth muscle relaxation. Furthermore, these agents are
potential therapeutic tools in diseases such as hypertension, coronary artery
spasm, urinary incontinence, and neurological disorders. The BK openers
include a large series of synthetic benzimidazolone derivatives, such as NS004
and NS1619, the biaryl amines, such as mefenamic and flufenamic acids, the
biarylureas, such as NS1609, the pyridyl amines and the pimaric acids, such as
isopimaric acid. It should be noted that some ligands also activate BK channels
nonselectively, for example: fenamates, including niflumic, flufenamic, and
mefenamic acids (Ottolia &Toro, 1994). They decrease the duration of
channel long closed states leading to the enhanced channel activation in a
variety of cells through a pathway which may be independent of their
cyclooxygenase–prostaglandin mechanisms (Stumpff, et al., 2001).
Another series of compounds that regulate the BK channel are oestrogen
receptor modulators. BK channel activation by 17-β estradiol contributes to its
non-genomic effect (acute vasorelaxation) on the vasculature (Valverde et al.,
1999). Similarly, BK channel can be activated by tamoxifen at therapeutic
concentration which blocks volume-sensitive chloride, voltage-activated
calcium, non-selective cation channels, and voltage-gated potassium channels
(Dick et al., 2001). This is the possible mechanisms of the side effects of
tamoxifen, such as QT prolongation and arrhythmias, where its deleterious
actions on the above mentioned ion channels are unquestionably important
Page 37
SECTION 1: INTRODUCTION
25
adverse side-effects of this ligand (Dick et al., 2001; He et al., 2003). Other
studies in other tissues have reported an alteration in BK channel activity in
response to various endogenous and exogenous compounds. For example, “2 -
methoxyestradiol, an endogenous metabolite of 17ß-estradiol, inhibits the
channel activity by decreasing the number of open and activated channels”
(Chiang & Wu, 2001). The decrease of the amplitude of the outward
potassium current in vascular endothelial cells was due to the inhibition of BK
channel activity (Wu, 2003).
Many neurotransmitters, metabolites of arachidonic acid, and downstream
effectors (e.g. cAMP and cGMP) regulate BK channel activity through
signalling pathways that involve G-proteins and/or a balance between
phosphorylation–dephosphorylation. For example, nitric oxide (NO) and NO
donors relax various blood vessels by a direct increase in activation of BK
channels (Bolotina et al., 1994; Mistry and Garland, 1998) or via cGMP-
dependent protein kinase (PKG) (Carrier et al. 1997 and Robertson et al.,
1993). PKG acts on BK channel activation directly by phosphorylating a serine
residue (Ser1072) in the α-subunit of the channel (Fukao et al., 1999).
BK channel blockers have long been used as experimental tools to examine
both structural characteristics (subunit composition) of the BK channels and
their varied roles in various physiological conditions. These reagents include
peptide toxins such as iberiotoxin (IbTX) and slotoxin, quaternary ammonium
compounds such as tetraethyl ammonium (TEA) and tetrabutyl ammonium
Page 38
SECTION 1: INTRODUCTION
26
(TBuA) and alkaloids such as tertrandrine and paxilline (Li & Aldrich, 2004).
IbTX is one of the peptide toxins which selectively blocks BK channels. It
binds to a site in the extracellular vestibule of the pore, thus occluding the
external pore (Giangiacomo et al., 1992; Brayden & Nelson 1992).
Investigations revealed that four residues of the extracellular loop of β1-
subunit (L90, Y91, T93, and E94) located close to the external vestibule were
important in generating the high affinity peptide toxin binding site in BK
channels (Hanner et al., 1998). In this way, crucially the sensitivity of the
channels to these peptide toxins depends on the type of the associated β
subunits associated. Although quaternary ammonium compounds are not
selective for BK channels, they decrease the channel activity by two ways:
lodging in their inner pore and hastening the deactivation process of the
channels during repolarization (Li & Aldrich, 2004). Paxilline, an indole
alkaloid, is another selective blocker for BK channel. It decreases BK channel
activity in rat aortic smooth muscle cells, in a manner similar to that of IbTX
(Knaus et al., 1994; Tammaro et al., 2004). Tetrandrine, a quinoline alkaloid,
also decreases the activity of BK channels in cultured endothelial cells. And
the intracellular Ca2+
levels have no impact on tertrandrine’s activity (Wu et
al., 2000). In summary the regulators of BK channels are listed in Table1.2
below. And the following graphs indicate the structures of BK openers and
blockers including a large series of synthetic benzimidazolone derivatives, such
as NS004 and NS1619, the biarylureas, such as NS1608, the biaryl amines,
such as mefenamic and flufenamic acids and the pyridyl amines, natural
modulators like dihydrosoyasaponin-1 (dehydrosoyasaponin-1; DHS-1)
Page 39
SECTION 1: INTRODUCTION
27
peptide toxins, such as Iberiotoxin and Slotoxin, tertrandrine and paxilline
(Ghatta et al., 2006).
Blockers Peptide toxins: iberiotoxin, charybdotoxin and slotoxin
Non-peptide blockers: paxilline, penitrem and tetrandrine
Non-specific: tetraethylammonium, tetrabutylammonium,
clotrimazole and ruthenium red
Openers NS004, NS1619, NS8 and NS1608
Flufenamic acid, mefenamic acid, niflumic acid
Estradiol, dihydrosoyasaponin-I (DHS-I), maxikdiol and
pimaric acid
Secondary
messengers
cAMP, cGMP and calcium
Endogenous
metabolites
Nitric oxide, arachidonic acid metabolites and 2-methoxy
estradiol
others pH, voltage, osidation reduction, glycosylation and
phosphorylation
Table1.2 BK channel modulators include naturally-occurring blockers,
synthetic inhibitors and blockers, marketed and/or investigational drugs,
naturally-occurring openers and synthetic openers.
Structure of BK channel openers
(From S. Ghatta et al. / Pharmacology & Therapeutics 110 (2006) 103–116)
Page 40
SECTION 1: INTRODUCTION
28
Structure of BK channel blockers
(from www.sigmaaldrich.com ) (from Wikipedia)
(from Wikipedia) (from Wikipedia)
1.2.4.4 BK channel – therapeutic indications
BK channels are known to be expressed in almost all tissues in the body and
over many years investigations have revealed that BK channels are involved in
various (patho) physiological conditions. Such a ubiquitous distribution might
raise questions about the possible selectivity of any drug design strategy based
on a BK channel target. As indicated previously, in the cardiovascular system,
BK channels are key players in controlling the vascular contraction. In vascular
smooth muscle BK channels open in response to [Ca2+
]i increase resulting
IBERIOTOXIN SLOTOXIN
TETRANDRINE PAXILLINE
Page 41
SECTION 1: INTRODUCTION
29
from either increased flux of Ca2+
into the cell through Ca2+
channels or by
release of Ca2+
from internal stores (Jaggar et al., 2000) and elicit potassium
efflux. The potassium efflux is also called spontaneous transient outward
current (STOC) which leads to vascular smooth muscle relaxation by driving
the membrane potential more negative. Hence the voltage-gated Ca2+
channels
are closed so that no Ca2+
is supplied to initiate cell membrane depolarization
and muscle contraction. In summary, BK channel activators may provide
useful treatment of vascular dysfunction accompanied with various disorders.
In the urinary system, under physiological conditions BK channels opening
leads to hyperpolarization, which in turn regulates membrane potential and
relaxes urinary bladder smooth muscle. Thus β-adrenergic activation of BK
channels in urinary bladder smooth muscle may be useful for the treatment of
the unstable bladder. In the nervous system, BK channel dysfunction is
considered to be related to the neurological disorders. BK channels have been
identified in the dendrites, axons, and synaptic terminals and are important
players in controlling the excitability of neurones and influence neuronal
signaling and neurotransmitter release. BMS-204352 is a specific brain
penetrant BK channel opener which has shown beneficial effect in neuronal
ischemia (Cheney et al., 2001; Gribkoff et al., 2001).
1.3 Bone
Bone is a dynamic tissue. In additional to providing structural support and
protecting internal organs, it is a major storage depot for calcium, phosphorus
Page 42
SECTION 1: INTRODUCTION
30
and other minerals. Bone growth begins as early as in embryogenesis. It keeps
growing in length and width until skeletal maturity. It is then formed and
renewed continuously throughout life, a process known as bone remodelling.
Rates of remodelling in trabecular bone may be 5 to 10 times higher than in
cortical bone throughout life. The entire skeleton is replaced in a healthy adult
in a cycle of about 10 years. Bone remodelling occurs on the bone surface and
a bone remodelling unit consists of a group of all linked cells of activation,
resorption and formation (Parfitt et al., 2001). The cells eroding the bone to
create small cavities are osteoclasts. The cells fill in the cavities with new bone
are called bone-forming osteoblasts (Crockett et al., 2011). Bone remodelling
is a natural way of restoring bones and keeping them healthy and deficiencies
in this process result in conditions such as osteoporosis. Osteoporosis can
affect people of any age and three million people in the UK have or are at risk
of this disease. It places a growth burden on the NHS and hip fracture alone
cost health and social services over 1.7 billion pounds a year. Fractures of wrist
and spine are also common and can lead to pain, dependence and death in some
case. So that it is important to make any improvement in the prevention,
diagnosing and treatment of osteoporosis.
1.3.1 Bone formation and composition
The knowledge of bone morphology and structures at different levels provides
the basis to understand the function of bone and the possible mechanism(s) of
underlying diseases. First of all, at a microscopic level bone has two forms
Page 43
SECTION 1: INTRODUCTION
31
according to the pattern of collagen forming the osteoid that are known as
woven bone and lamellar bone. The features of these are listed in Table 1.3.
Woven bone is an immature bone type and is found in the embryo and the
newborn, in a fracture callus, and in the metaphyseal region of growing bone.
Lamellar bone is therefore considered as mature bone. It appears 1 month after
birth and by 1 year of age, it is actively replacing woven bone, as the latter is
resorbed. There is still woven bone in adult animals as the vascular channels
are located mainly in the woven bone in cortical bone. Woven bone and
lamellar bone are observed in either trabecular or cortical bone, which are
named according to their porosity and apparent density. As shown in Fig 1.6,
trabecular bone looks spongy and cancellous so it has an extraordinarily high
surface area for cellular activity. It is found principally at the metaphysis and
epiphysis of long bones and in cuboid bones such as the vertebrae. Compact
bone is found as the “envelope” bone which is dense and compact.
Table 1.3 comparison of woven and lamellar bone
Woven bone Lamellar bone
coarse-fibered, no uniform of collagen
fibre
many collagen fibers parallel to
other fibres
high proportion of osteocytes and
cells are randomly arranged
low proportion of osteocytes in
concentric sheets
found in embryo, fracture callus,
tumors, osteogenesis imperfect and
pagetic bone
most normal bone is lamellar bone
in mature animal
Page 44
SECTION 1: INTRODUCTION
32
Fig 1.6 Compact bone is dense and on the surface of bone, while trabecular
bone is spongy and fills the inner cavities of bone (the picture was taken from
Mrs. Andersen’s Science Pages, The Human Body.
http://woostermiddle.stratfordk12.org/Content/The_Human_Body.asp
accessed date 15th
June 2012).
In childhood and adolescence, bone modelling is associated with growth and
reshaping. In bone modelling, growth in length depends on proliferation and
differentiation while growth in width and thickness is accomplished by
formation of bone at the periosteal surface. In adults, bone remodelling
constitutes the lifelong renewal process. It implies the continuous removal of
bone and synthesis of new bone matrix and subsequent mineralization. These
two processes involve three major types of bone cells: osteoclasts, osteoblasts
and osteocytes (Parfitt et al., 2001). Osteoclasts are multinucleated cells of
large size that degrade and reabsorb bone. This type of cell arises from the
haemopoietic cells of the monocyte/macrophage lineage. Osteoclasts lie in
regions of bone for reabsorption. Osteoblast is a type of bone forming cells. It
is defined as a cell that produces osteoid, or bone matrix. Osteoblasts line the
Page 45
SECTION 1: INTRODUCTION
33
surface of bone and follow osteoclasts in cutting cones. Osteocytes are
osteoblasts encased in a mineralized matrix. They are the largest proportion of
bone cells but seem, paradoxically perhaps, to have been paid the least
attention. They are characterized by a high nucleus-to-cytoplasm ratio and
contain fewer organelles.
As stated above bone forming and remodelling implies bone absorption and
refilling. Osteoclasts reabsorb bone by isolating an area of bone from cell
attachment, then reducing the pH of the local environment by producing
hydrogen ions. Carbonic anhydrase provides the proton source for extracellular
acidification by H+-ATPase and the HCO3
− source for the HCO3
−/Cl
−
exchanger (Roussellea and Heymann, 2001). The solubility of the apatite
crystals is accelerated at low pH. After the movement of mineral, the organic
components are hydrolyzed through acidic proteolytic digestion. Once the
cavities are formed on the bone surface, the osteoblasts that follow lie on the
new surface and are activated to lay down osteoid to refill the cavity and
become incorporated into new bone. Once an osteoblast becomes surrounded
by the bone matrix, it then becomes mineralized osteocyte (Crockett et al.,
2011).
1.3.2 Osteoblasts
Since osteoblasts play key roles in bone forming and remodelling they have
received much attention. Osteoblasts and osteocytes are of the same lineage i.e.
Page 46
SECTION 1: INTRODUCTION
34
derived from mesenchymal cells. Mesenchymal cells in turn may lead to
osteoblasts, chondrocytes, myoblasts and bone marrow stromal cells including
adipocytes (Owen, 1988). The specific phenotype of the cell achieved depends
on their maturation during differentiation. Mature osteoblasts for example are
characterised as possessing high alkaline phosphatase (ALP) activity and the
capacity to synthesize collagenous and noncollagenous bone matrix proteins
including osteocalcin (Aubin and Liu, 1996).
Osteoblasts arise through the activity of osteoprogenitor cells which are
mesenchymal cells located near all bony surfaces and within bone marrow.
Mature osteoblasts secrete osteoid forming matrices and enzymes facilitateing
mineral deposition within the matrices. Thus osteoblast cells constitute a
lineage of highly differentiated cells: active osteoblasts (e.g. MG63 cell line),
bone lining cells and osteocytes and they are represented by a distinctive
morphology. Mature functional osteoblasts are metabolically active and
dedicated to the process of bone matrix (osteoid) synthesis. In keeping with
high proliferative capacity and marked differentiation, the active osteoblast
exhibits a voluminous nucleus relative to other cell types and there is a large
Golgi apparatus, rough endoplasmic reticulum and high mitochondria content.
The abundant rough endoplasmic reticulum and Golgi apparatus is
characteristic of cells that manufacture protein for either export or secretion.
The matrix elements produced by osteoblasts include structural proteins, such
as type I collagen; a variety of noncollagenous proteins, including osteocalcin
and osteopontin, osteonectin, proteoglycans and regulatory factors, including
Page 47
SECTION 1: INTRODUCTION
35
cytokines, growth factors, and prostaglandins (Aubin et al., 1993 and Aubin
and Liu et al., 1996). In addition to the above synthetic products, osteoblasts
produce neutral proteases, alkaline phosphatase, and other enzymes that
degrade the extracellular matrix and prepare it for calcification. On other bone
surfaces, where bone is not being actively formed, the osteoblasts appear
elongated and flat and are relatively quiescent metabolically. Bone lining cells
also have functions. In these cells histochemical studies have demonstrated that
alkaline phosphatase is distributed over the outer surface of the cell membrane.
Evidence suggests that these osteoblasts produce enzymes and enzyme-
regulating proteins such as collagenase, collagenase inhibitor, and plasminogen
activator, which are involved in the process of bone matrix degradation (Aubin
et al., 1993).
In vitro, osteoblast function is affected by interleukins, insulin derived growth
factor, platelet-derived growth factors and estrogen. This leads now to a
discussion of investigations on the regulation of osteoblast function.
1.3.3 Regulatory factors in osteoblast function
First of all, it is well known that the hormones secreted by bone marrow cells
and bone cells control the remodelling of bone. These hormones include
estrogen and testosterone, and many other proteins. Recently, it has been
discovered that in addition to parathyroid hormone (PTH), certain cytokines or
proteins affect osteoblast behaviour. Hence the growth factors, the interleukins
Page 48
SECTION 1: INTRODUCTION
36
(IL-1, IL-6, and IL-11), transforming growth factor-β (TGF-β) and tumor
necrosis factor-α play key roles in controlling the activities of the osteoblasts
(Pfeilschifter et al., 2002). Osteoblasts arise when the osteoprogenitor cells
differentiate under the presence of growth factors such as fibroblast growth
factor (FGF), platelet-derived growth factor (PDGF), TGF-β and bone
morphogenetic proteins (BMPs). In addition, a novel growth factor secreted by
the macrophage cells of the immune system was isolated and found to induce
growth of bone cells.
The different kinds of specific receptor-effector interactions in osteoblasts are
best illustrated by responses to PTH, prostaglandins, 1,25-dihydroxyvitamin D,
and glucocorticoids. PTH and prostaglandins bind to cell surface-associated
receptors and then activate intracellular second messenger pathways to achieve
a cellular response. These mechanisms include both the adenylate
cyclase/cyclic adenosine monophosphate pathway and the phosphoinositol-
calcium pathway. In contrast, 1,25-dihydroxyvitamin D and glucocorticoids
diffuse through the membrane, bind to cytosolic receptors, which then
translocate to the nucleus of the cell and interact with nuclear DNA to
modulate and regulate the transcription of DNA to messenger RNA. Recently,
estrogen receptors were identified in osteoblasts and their functions are similar
to other steroid hormone receptors.
In summary, osteoblasts which are one of the most important bone cells have
important functions and complex regulatory mechanisms. In addition to
Page 49
SECTION 1: INTRODUCTION
37
primary cells, many labs use cell lines to investigate how regulatory factors
influence their function, and how these cells communicate and interact with
each other. One aspect, as of yet poorly investigated, is the possible role of ion
channels in the cellular process of osteoblast such as proliferation and
differentiation (Russell, 2003 and Russell et al., 2006).
1.4 Potassium channels in bone cells
Ion channels in bone cells have been identified and considered as potential
target for therapeutic agents for the treatment of osteoporosis and other bone
disorders (Komarova et al., 2001). Recently, in osteoclasts numerous ion
channels have been characterised such as K+, Na
+ and Cl
- channels. The K
+
channels that have been identified in osteoclasts include an inward rectifier K+
channel, a transient outward rectifier channel and two classes of Ca2+
-activated
K+ channels. These two types of Ca
2+-activated K
+ channels are the large and
intermediate conductance channels. Functions of ion channels in osteoclasts
were determined as setting the membrane potential, signal transduction and cell
volume regulation (Komarova et al., 2001). A summary of the possible
function and mechanisms of these ion channels is shown in Fig 1.7. BK
channels are activated by elevation in internal Ca2+
. The resultant
hyperpolarization of the osteoclast, it is argued, would augment Ca2+
influx,
providing positive feedback (Wiltink et al., 1995). These channels represent
potential molecular targets for the development of antiresorptive drugs.
Page 50
SECTION 1: INTRODUCTION
38
Bone modelling and remodelling involves both osteoclast and osteoblast
behaving normally as described above and ion channels in osteoblasts may also
be important therapeutic targets of bone diseases. Indeed, the investigations of
ion channels in osteoblasts started from the early 1980s with such
considerations in mind. In 1982, Ferrier et al. revealed their discovery of low-
frequency voltage noise in a mammalian bone cell clone (Ferrier et al., 1982).
Fig 1.7 Diagram of ion channels revealed in mammalian osteoclasts. They are
K channels: Kir2.1, KV1.3, IK and BK channels, chloride channel (ICl),
extracellular ligand-gated channels: P2X- nucleotide receptor nonselective
cation channel; INMDA- glutamate receptor nonselective cation channel and P2Y
G protein-coupled nucleotide receptor linked to mobilization of Ca2+ from
intracellular stores. (This graph was taken from Komarova et al., 2001).
Page 51
SECTION 1: INTRODUCTION
39
Then in 1984 a Ca2+
-activated K+
conductance was confirmed in a clonal
osteoblast-like cell line (Dixon et al., 1984). Within 10 years, investigations on
the clonal osteoblast-like cell line osteoblast revealed that serum, 2-
macroglobulin and parathyroid hormone regulate the cell membrane potential
through the existing K channels. The big conductance Ca-activated K channel
was identified in embryonic chick osteoblast by using molecular and
electrophysiological approaches (Ravesloot et al., 1990). In the following
years, different groups described various potassium channels in osteoblast-like
MG63 cells (Moreau et al., 1997; Yellowley et al., 1998 and Rezzonic et al.,
2002). Importantly, BK channels in MG63 cells are activated by the
Prostaglandin E2 which is an important mediator of bone response to growth
factors, hormones, inflammation or mechanical strain. Furthermore, BK
channels regulate the osteocalcin secretion of MG63 cells (Moreau et al.,
1997). Established osteoblast-like cell lines like those described are useful
models for the molecular and cellular study of osteoblasts. Primary osteoblasts
differ substantially in their properties at different stages of development,
whereas cloned cell lines from bone or bone tumors represent a particular stage
of differentiation. At the time of commencing the work described in this Thesis
no equivalent data exist for human primary osteoblasts.
Previous reports studying BK channels in osteoblast-like MG63 cells raised a
number of unanswered questions and anomalies such as the channel subtypes
and their specific functions. In this project, BK channels were investigated
systematically in osteoblast-like cell lines and primary osteoblasts from human,
Page 52
SECTION 1: INTRODUCTION
40
rat and mouse in an attempt to answer the questions: 1. What are the subtypes
of BK channel and their subunits composition? (as see in Section 4) 2. What
are the specific activation features of BK channel in these cells compared to
what we knew in other cells such as nerve and muscle? And what are the
specific responses to the well-known BK channel modulators? (as see in
Section 5) 4. What are its contributions to the cell functions? (as see in Section
6)
Page 53
SECTION2: MATERIALS AND METHODS
41
SECTION 2: MATERIALS AND METHODS
2.1 Cell culture
In this project, three different osteoblast-like cell lines were investigated:
human osteosarcoma MG63 and SaOS-2 cells, and mouse bone marrow-
derived 7F2 cells. Four kinds of primary cells were also used. These were
primary human osteoblasts (HOBs), primary mouse and rat osteoblasts and
bone marrow cells (mesenchymal cells). In addition to these bone forming
cells, a mouse osteocyte cell line (MLO-Y4) was also investigated. All these
cells were cultured in an incubator (Nuaire DH autoflow) with 5% CO2 and
95% air at 37˚C. All culture operations were done under sterile conditions in a
laminar flow unit (Faster Ultrsafe 48). Since they are all adherent cells, trypsin
was used to detach them, when there were confluent monolayers. Cells were
washed with 37°C Dulbecco’s Phosphate Buffer Solution (DPBS) (Invitrogen,
UK) to rinse off calcium and magnesium salts present in the cell culture. 0.5
ml, 37°C (for 25 ml flask) trypsin (solution (0.025% trypsin IV, 0.2% EDTA)
(Sigma-Aldrich, UK) was then added for 5 minutes. Cells were checked under
a microscope to ensure they had properly detached from the culture surface
before adding culture medium to inactivate the trypsin. All cells were
Page 54
SECTION2: MATERIALS AND METHODS
42
centrifuged at 500 g for 3 minutes and then the cell pellet was collected. Cells
were either then seeded on to glass coverslips for patch-clamp studies, and into
suitable cell culture plates for the cell number assays.
2.1.1 Human osteoblast-like cell lines
Two osteosarcoma-derived cell lines have been extensively used which are
MG63 and SaOS-2 cells. The most pronounced difference between the two cell
lines was that ALP activity in the SaOS-2 cells was 10-fold higher than in the
MG63 cells. The proliferation rate of the MG63 cells was much higher than
that of the SaOS-2 cells. SaOS-2 cells exhibit a more mature osteoblast
phenotype, compared with that of MG63 cells (Shapira and Halabi, 2009).
MG63 cells are derived from the osteosarcoma of a 14 year old boy (Heremans
et al., 1977). These cells were kindly supplied by Dr. B. A. J. Evans (School of
Medicine, Cardiff University, Heath Park, Cardiff, CF14 4XN). Cells were
cultured in complete Dulbecco’s modified eagle medium (DMEM, from
Invitrogen, UK) containing 1% penicillin-streptomycin solution (100 U/ml
penicillin G sodium and 100 μg/ml streptomycin sulphate) (Invitrogen, UK)
with 5% foetal bovine serum (FBS, from Invitrogen, UK) in 25 cm2 flasks. Cell
medium was changed twice a week, and cells were passaged (1:10) once a
week. In this project, the passage number of MG63 cells was always below 34.
SaOS-2 cells were originally from the osteosarcoma of an 11 years old girl
(Fogh et al., 1977). These cells were also kindly supplied by Dr. B. A. J. Evans.
Page 55
SECTION2: MATERIALS AND METHODS
43
The culture medium was the complete DMEM medium as described above.
The medium was changed twice a week and cells were passaged (1:5) once a
week. The passage number of SaOS-2 cells was always below 30.
2.1.2 Mouse osteoblast-like cell line
7F2 cells are osteoblasts originally derived from mouse bone marrow
(Thompson et al., 1998). The cells were isolated from the p53-/- mouse
femoral bone marrow and subsequently cloned. These cells were kindly
supplied by Dr. B. A. J. Evans. The cells are mature osteoblasts as they express
alkaline phosphatase, secrete type I collagen and osteocalcin, show a
significant cyclic adenosine monophosphate response to parathyroid hormone
and mineralize extensively. On the other hand, these osteoblast-like cells can
be induced to undertake massive adipocyte transdifferentiation. This
transdifferentiation is accompanied by the complete loss of expression of all
osteoblastic markers except alkaline phosphatase. These observations indicate
that some cells that have acquired all of the characteristics of mature
osteoblasts can be diverted to the adipocyte pathway (Thompson, et al., 1998).
These cells were cultured in alpha minimal essential medium (α-MEM)
containing 10% FBS, 100 U/ml penicillin and 100 μg/ml streptomycin. The
culture medium was changed twice a week and cells passaged (1:8) once a
week, with the passage number always being less than 28.
Page 56
SECTION2: MATERIALS AND METHODS
44
2.1.3 Human primary osteoblasts
Primary human osteoblasts derived from the normal hipbone of a 64 year old
Caucasian female (passage number 3 and 4) were obtained from PromoCell
GmbH, and maintained as proliferating cultures using the recommended
growth medium (PromoCell GmbH). PromoCell confirm that the cells are
positive for osteocalcin by immunofluorescence.
2.1.4 Mouse/rat primary bone marrow cells and osteoblasts
Mouse/rat primary osteoblasts and bone marrow cells were from the mouse/rat
femur or tibia. The culture medium was α-MEM with 10% FBS, 100 U/ml
penicillin and 100 μg/ml streptomycin. As shown in Fig 2.1, the dissected
bones were first rinsed with sterile DPBS several times at room temperature
(RT). Then the bone was placed in a Petri dish and with the use of a scalpel and
forceps the periosteum was removed. After this, one end (epiphyses) was cut
off and discarded, and the remaining bone was placed in a 200 μl Eppendorf
tube with 50 μl medium. This Eppendorf tube was centrifuged at 1000 rpm for
3 min at RT, and this resulted in a cell pellet (bone marrow cells) being
deposited at the bottom of the tube. These bone marrow cells were resuspended
in medium and seeded into 25 cm2 flasks at a cellular density of 5 x 10
5 cells /
ml. When the cells in flasks were confluent, they were trypsinised and seeded
onto coverslips for patch-clamping.
Page 57
SECTION2: MATERIALS AND METHODS
45
The cortical bone from the remaining bone was washed with PBS in a Petri
dish and cut into fragments of 1-3 mm. These fragments were washed in a new
dish until they were white in colour. To initiate explant cultures, flasks were
conditioned by preincubating with 2 ml medium for 30 minutes. Then
(following Protocol 22.14 from “Culture of Animal Cells”, Freshney, 2000) the
preincubation medium was discarded from the flasks and 2.5 ml of fresh
medium was added. 10 to 20 fragments of the bone were transferred into the
flask with the aid of an inoculating loop and the explant pieces were distributed
evenly. The flasks were left in the horizontal position in the incubator. After a
week the outgrowth was checked under a microscope (Fig 2.2) and the medium
was changed. To maintain these bone cell cultures, the medium was changed
twice a week. Once again when the cells were fully confluent, they were
trypsinised and seeded on to coverslips for patch-clamping.
2.1.5 Mouse osteocyte cell line (MLO-Y4)
MLO-Y4 cells had been originally obtained from Professor Lynda Bonewald,
(University of Missouri-Kansas City, USA). These cells were kindly supplied
by Dr. B. A. J. Evans. Cells were cultured in αMEM with 10% FBS, 100 U/ml
penicillin, and 100 µg/ml streptomycin. Flasks were coated with collagen type
I in order that cells maintained their osteocytic phenotype. Medium was
changed every 2 days. Confluent cultures were harvested using trypsin and
seeded on to cover slips coated with collagen type I to carry out
electrophysiological experiments. Osteocytic phenotype was assessed by the
Page 58
SECTION2: MATERIALS AND METHODS
46
maintenance of dendritic morphology. Only cells showing dendritic phenotype
were selected for recording.
Fig. 2.1 Mouse/rat osteoblast and bone marrow cell preparation. After
centrifugation bone marrow cells were at the bottom of the tube. These cells
were resuspended in αMEM with 10% FBS and seeded into cell culture flasks.
The cortical bone from the long bone was cut into small explants and seeded
evenly in another flask.
Fig 2.2 These images show bone cells growing out from cortical bone
fragments. The fragments were cultured with αMEM with 10% FBS in 25cm2
flasks. After a week, cells could be clearly seen growing out from explants.
After another 20 days these cells were confluent.
Cells growing
out from bone
fragment
30μm
After
10 days 30 μm
30 μm
Another
10 days
Bone marrow cells
Cortical bone explants, osteoblast
Page 59
SECTION2: MATERIALS AND METHODS
47
2.2 Electrophysiology
Electrophysiological methods study the electrical properties of cells and
tissues. Patch-clamping techniques are classical electrophysiological
techniques and are extremely powerful in investigating the minute electrical
signals, or currents, through ion channels in biological membranes. All the
patch-clamping experiments were performed at room temperature.
2.2.1 Basic theory of patch-clamping and the equipment set up
In the 1970s Erwin Neher and Bert Sakmann (Neher and Sakmann, 1976)
developed the patch-clamp method to record the current through single
channels in the cell membrane. It was quickly adopted by numerous labs to
study the electrophysiological properties of many cell types. It caused a
revolutionary advance in many research areas in both cellular and molecular
biology. Some key improvements such as the “giga seal” (a seal is formed
between the cell membrane and the glass pipette with a resistance of >1
gigaohm (GΩ)) and the use of the various recording configurations permitted
patch recording from both the cell surface membrane or cell-free membrane
patches as well as “intracellular” whole-cell recordings (Hamill et al., 1981).
The electronic equipment or current to voltage amplifier records the
transmembrane currents as a function of membrane voltage changes. To record
effectively the pA currents that ion channels carry, both mechanical stability of
all the components of the setup is crucial and electrical interference must be
Page 60
SECTION2: MATERIALS AND METHODS
48
kept minimal. Thus all the equipment (microscope, manipulators etc.) are set
up on a vibration isolation table in a Faraday cage and all items were earthed
appropriately (Fig 2.3).
Patch-clamp electrodes were pulled from 1.5 mm outside diameter, 0.86 mm
inside diameter borosilicate glass capillaries (GC150-F10, Harvard Apparatus
Ltd.) and fire-polished by a DMZ-Universal Puller. The fire-polished electrode
had a tip diameter of approximately 1-2µm. The electrode was back filled with
a fine silica microfill syringe needle (Harvard Apparatus). The resistances were
typically 2-10 MΩ when filled with the High K (140) solution. The filling
solutions for the electrodes are described in Section 2.5.
Cells to be patched were sub-cultured on coverslips (Ø 16 mm) in 6–well
plates. When patched, these cells were usually subconfluent and not more than
6 days post-seeding in culture. The coverslip was transferred from the 6-well
plate to a Perspex recording chamber with a glass bottom under sterile
conditions in a laminar flow unit. A tiny bit of petroleum jelly were used to
hold the coverslip in position. After washing the cells with the recording
solution another 500 μl of this solution was added directly to the cells on the
coverslip and this formed the bath solution. Then the recording chamber was
positioned on the stage of a microscope (Microtech 200) in the Faraday cage.
Recordings were made at room temperature, using an Axopatch 1D clamp
amplifier (Axon Instruments). The electrode resistance was determined by
Ohm’s Law from the current amplitude in response to a 20 mV short duration
pulse.
Page 61
SECTION2: MATERIALS AND METHODS
49
2.2.2 Different configurations of patch clamping
In Fig 2.4, the four different configurations of the patch-clamp method, all of
which are used in this study, are shown. Cell-attached patches can be achieved
by tightly sealing a glass microelectrode on to the plasma membrane of a cell.
A giga-Ohm seal can be formed by slight negative pressure supplied by gentle
suction through a syringe or by mouth (a). At this stage pulling back the
electrode will result in an excised inside-out patch(c). Alternatively more
suction or applying a negative potential will result in a whole-cell recording
(b). Pulling back the electrode at this stage will result in an outside-out patch
(d).
Single channel patch-clamping is a technique with a very high resolution.
Conformational changes in one single native protein can be detected which
trigger the opening or closing of one ion channel in real time. With the
establishment of a tight seal between the glass electrode and the cell
membrane, the current caused by the opening of the desired ion channel in a
quasi-physiological environment can be recorded. If we compare the channel
properties in cell- attached patches with the one in excised patches, any
differences can be assumed to be related to cytosolic gating factors of the
channel (e.g. ATP, polyamines, Ca2+
etc). In this way, we can investigate
whether the channel can be regulated by any cytosolic messengers or not. On
the other hand, since the ion channel is isolated from the bath solution, any
modulators cannot access the channel directly. Only those modulators which
are cell membrane permeable that regulate the channel activity directly or
Page 62
SECTION2: MATERIALS AND METHODS
50
through cytosolic second messengers can be tested in the cell-attached patch
configuration.
In inside-out patch the cytosolic side of the cell membrane is exposed to the
bathing solution. Regulators can therefore be applied directly to the
intracellular binding sites. This configuration is preferred when studying how
cytoplasmic events affect an ion channel. In this project, this configuration was
used to identify the types of potassium channels and to investigate the
modulators (both drugs and ions) binding to the channels from the intracellular
site.
Outside-out patch is useful for recording the activity of the channel that
requires application of a compound to the outside of the channel surface
(Friday and Howard, 1991). This configuration was gives the opportunity to
examine the properties of an ion channel when it is exposed to different
solutions on the extracellular of the membrane. Specifically, it was used to
investigate extracellular binding modulators.
With these techniques the external and internal ionic environment of the cells
and channels can be controlled, thus providing comprehensive capabilities for
testing the influence of various manipulations such as drug or toxin effects and
composition changes. For example, the ionic composition on either side of the
membrane or the channel can now be adjusted; toxins, transmitters and other
agents can be applied easily, in defined concentrations, to either side of the
membrane.
Page 63
SECTION2: MATERIALS AND METHODS
51
These isolated membranes and systems are suitable for the use of molecular
and genetic techniques (Barondes et al., 1998). As a result, many physiological
questions at the molecular level can now be answered. For example,
determining exactly where in the channel molecule or subunit an antagonist or
drug acts is now possible. Thus, using the powerful combination of
electrophysiology and molecular biology, a definitive link between structure
and function at the molecular level can be achieved.
The disadvantages of these models are principally derived from the isolation
process itself. The membrane is isolated so that it lacks normal connections
with other membrane domains; it may therefore be functioning differently than
that normally seen in the living organism, and thus may provide answers not
relevant to the native "real world." In addition, there is the danger that the
"extracellular" and "intracellular" media used represent a totally artificial
environment that would not be relevant to living cells in vivo. The lack of
normally circulating agents such as steroids, hormones, plasma proteins could
lead to drastic changes in the function of the channels under study.
The complementary whole-cell patching technique is necessary to examine the
physiological roles of the required ion channel in the entire cell. It allows
modifying the internal environment by using a patch-clamp pipette. The
recording from a whole-cell patch gives an average response from all the
channels in the cell membrane.
Page 64
SECTION2: MATERIALS AND METHODS
52
To investigate single ion channel electrophysiology the patch-clamp method
remains the most powerful and versatile tool. It allows the unitary currents
through single channels to be observed which is diagnostic of function. It still
remains after over 30 years the method of choice allowing the recording of
macroscopic whole-cell or microscopic single-channel currents flowing across
biological membranes through ion channels. In this thesis all configurations
were used and put to the test in a number of new cells.
Fig 2.3 Patch clamp equipment. Coverslips with cells were positioned in a
Perspex chamber with a glass bottom. The chamber was positioned on the
microscope (A) in the Faraday cage (B). The amplifier carrying the electrode
holder (C) was held by the Narishige hydraulic manipulator (D). All equipment
was positioned on the anti-vibration table (E) and all items were earthed. The
Axopatch amplifier (H) was connected to an oscilloscope (F) via a Neurolog
amplifier (to deal with offsets and to provide additional gain) and to a Digidata
A-D converter (the National Instruments (NDAQ-MX)) which in turn was
interfaced with the computer.
C
A
D
E
B
F
H
Page 65
SECTION2: MATERIALS AND METHODS
53
Fig 2.4 Four different configurations of patch-clamping: (a) cell-attached, (b)
whole cell, (c) inside-out and (d) outside-out. From the various configurations
we can obviously control and manipulate the solutions that the inside and
outside of the cell membrane is facing.
2.2.3 Software and data analysis
The Strathclyde Electrophysiology Software (developed by John Dempster)
was used throughout to record and analyse all single channel and whole cell
data. Electrophysiology data recorder WinEDR (ver. 2.5) was used for the
collection of single channel patch data and Electrophysiology data recorder
WinWCP (ver.3.8.1) was used for the collection of whole cell patch data. To
identify the smallest single channel currents, high resolution was necessary.
Signals were often therefore filtered at 5 kHz (-3dB, four pole Bessel Filter)
and digitized at 20 kHz by a 12-bit A-D converter (National Instruments
(NDAQ-MX)). The variance of the noise of the current record was minimal
(RMS noise between 0.6-0.8) and the signals were viewed using an
oscilloscope during recording in addition to being displayed on the computer
Page 66
SECTION2: MATERIALS AND METHODS
54
screen. The duration of each single channel recording used for analysis was 30
seconds if not otherwise specified.
Initial analysis generated the histograms of all current distributions. These
histograms, fitted with Gaussian functions to the closed and open peaks,
indicated the unitary current through an ion channel at a given membrane
potential. Plots of the unitary current taken from the Gaussian-Fit to the open
peak vs potential (I-V) were used to determine the conductance of this channel.
I-V plots were constructed using Origin 7 Statistic Software (OriginLab, USA).
In addition, Popen (Po) values were generated either as a measure of the area
under the curve of the amplitude histogram of the open peaks or from transition
detection methods (using the 50% threshold). To quantify the results the Po
versus voltage data were fitted to a single Boltzmann equation using Origin 7
Statistic Software.
Kinetic studies analyse the behaviour of a single channel in a patch, and are
used to study the number and duration of events i.e. openings and closures of
any single channel event, thus providing an insight into the gating behaviour of
a single ion channel protein. Single opening and closures may be very brief (in
the range of tens of µs), and often the random noise in the record will result in
current fluctuations that can resemble these short duration single channel
openings and closures. Heavy filtering of the data can prevent such
occurrences, but this would decrease the quality of the data, resulting in short
duration true channel openings and real closures being effectively “erased”
from the recording. The level of filtering in the patch system will determine
Page 67
SECTION2: MATERIALS AND METHODS
55
whether or not the opening or closure can be clearly defined. These factors
mean it is important when undertaking kinetic analysis of the record to
determine the resolution of the method used (i.e.- the shortest measured time
interval, known as the minimum resolvable event), which can be calculated
when the level of electronic filtering during the process of recording, the
digitisation rate of data for storage, plus any subsequent filtering prior to
analysis are known. The effective cut-off frequency of the filters used
throughout the recording and analysis must be determined using the following
equation (Colquhoun, 1994):
1 / f c 2 = 1 / f 1
2 + 1 / f 2
2 … 1 / f n
2
Where f c is the sum of all the combined filters during recording, including that
imposed by the recording system (f 1), the rate of digitisation (f 2) and (f n)
refers to any subsequent filters applied throughout analysis. For example if
single-channel data were sampled or digitised at a frequency of 20 kHz on the
patch-clamp amplifier and then filtered at 5 kHz, the final cut-off frequency
would be 4.85 kHz, which would probably be acceptable for most applications
(Walz et al., 2002).
By statistical analysis with Origin, each single channel recording was analysed
to get information on: what is the current corresponding to the peak time
points? What is the state of the channel at a specified time point? And what is
the channel open probability? With this information plots of the unitary current
against voltage (I-V curve) can be produced to get the unitary conductance of
the channel. Plots of the Po against voltage provide data on the activation or
Page 68
SECTION2: MATERIALS AND METHODS
56
gating properties of the channel, specifically its voltage dependence i.e.
position on the voltage axis and slope.
2.3 Cell number assays
Cell number assays (MTS) were carried out with MG63 cells in the presence
and absence of various compounds. Cell viability assays were also undertaken.
2.3.1 Viability assay
The cells were seeded in 12-well plates with a density of 30,000 cells/well and
incubated in the test medium at 37˚C in an atmosphere of 5% CO2, 95% air.
After the required incubation (followed photographing in some cases), cells
were trypsinised and centrifuged at 1000 rpm for 5 min. After centrifugation
the cells were resuspended in medium and 0.4% trypan blue dye in PBS. The
dead cells were stained so that the live, unstained cells could be counted using
a haemocytometer as shown in Fig 2.5.
Determination of the cell viability:
(%)%100 viabilitycellcellstotal
cellsliving
Page 69
SECTION2: MATERIALS AND METHODS
57
Fig 2.5 Viable cells counts. Cell suspension was mixed 1:1 in trypan blue and
only non-viable cells stain. 10 μl cell suspensions were transferred to each
chamber of a clean, dry haemocytometer. Cells were counted in each 1 mm2
area. If cells were on the border outlining each square, only the cells on the top
and left border of each square were counted.
2.3.2 MTS assay
The working principle of MTS assay is that MTS (3-(4, 5-dimethylthiazol-2-
yl)-5-(3-carboxymethoxyphenyl)-2-(4-sulfophenyl)-2H-tetrazolium) is reduced
by the mitochondrial dehydrogenase enzyme released by metabolically active
cells. MTS is bioreduced into a colored formazan product which can be
measured directly by a plate reader using absorption at 490 nm. The solution
contains 300 µM electron coupling reagent (phenazine ethosulfate; PES) which
has an enhanced chemical stability combining with MTS (1.90 mg/ml) to form
a stable solution. In this project the CellTiter 96®AQueous One Solution
A surface of slide
The part of grid
Tiny square
Main grid
Page 70
SECTION2: MATERIALS AND METHODS
58
Reagent (Promega, UK) was used, which contains 1.90 mg/ml MTS and 300
µM PES in PBS.
Confluent cells in 25 cm2 flasks were trypsinised as previously described and
counted. 100 µl cell suspensions containing 3,000 cells were added to each
well of a 96-well plate evenly by using a multi-channel pipette (Eppedorf, UK).
Cells were left at 37ºC, 5% CO2, 95% air to settle over night and this point was
considered as day 0. On day 1, 200 µl of complete DMEM with or without test
compound was added to each well. If the compound was dissolved in DMSO
or any other vehicle then the same concentration of DMSO or vehicle was used
in the control wells. Otherwise complete DMEM medium was used as control.
Cells were then cultured at 37ºC, 5% CO2, 95% air for 96 hours before
assessing cell numbers using the MTS assay. Each control and test condition
used 10 replicates (i.e. 10 wells) in each assay, and each assay was repeated 3
times.
The MTS assays were performed by adding 20 µl of CellTiter 96®AQueous One
Solution Reagent directly to each subcultured cell well, incubating for 1 hour /
2 hours then recording the absorbance at 490nm with a Tecan® ELISA 96-well
plate reader. The data were expressed as relative cell number, this being the
optical density for each experimental group / optical density for the control
group. The relative cell number was defined as:
absorbancebackgroundabsorbancegroupControl
absorbancebackgroundabsorbancegroupalExperimentnumbercellrelative
Page 71
SECTION2: MATERIALS AND METHODS
59
2.4 Mineralisation assay
Since MG63 cells do not mineralise in culture, these experiments were
performed with osteoblast-like SaOS2 cells and primary human osteoblasts
maintained as described above. Cells were cultured in 6- and 12-well plates
until almost confluent. They were then treated with culture medium containing
L-ascorbic acid 2-phosphate (50µg / ml), β-glycerophosphate (2 mM) and
dexamethasone (10-7
M), in the presence or absence of BK channel modulators.
The media were changed twice weekly, and the cells were stained for calcium
deposits within the mineralised matrix 3 – 4 weeks after the start of the assay.
Briefly, experiments were terminated by fixing cell layers in formal saline
(4.1% formaldehyde in PBS) for 15 minutes. Mineralised bone nodules were
visualised by staining with alizarin red (1% solution in water) for 5 minutes,
rinsed with 50% ethanol to remove excess stain, then dried in open air. The
mineralisation density was analysed using Image Pro Plus version 6.1 (Media
Cybernetics).
In addition to cell layers staining, protein concentration from mineralised cells
was estimated by a Bio-Rad protein assay. An acid dye (coomassie® brilliant
blue G-250) binding to the solubilised proteins extracted from cell lysate
samples caused the absorbance of the dye shifting from 465 nm to 595 nm. The
relative protein concentration can be calculated from the standard curve created
from Bovine serum albumin (BSA, Sigma) stock solution.
Page 72
SECTION2: MATERIALS AND METHODS
60
2.5 Drugs and solutions
Non-selective potassium channel blockers, quaternary ammonium compounds
(tetraethylammonium chloride, TEA; tetrabutylammonium chloride, TBuA;
tetrapentylammonium chloride, TPeA and tetrahexylammonium chloride,
THeA), the selective BK channel opener NS1619, raloxifene and tetrandrine
were purchased from Sigma Chemical Co. Ltd (UK). The selective BK channel
blockers iberiotoxin (IbTX), slotoxin and paxilline and the selective BK
channel opener isopimaric acid were obtained from Alomone Laboratories
(Caltag-medsystems Ltd., UK).
The compounds
Compounds Doses Stock Storage
Temperature
IbTX 10~100 nM 1mM (distilled H2O)
(electrophysiology)
1 mM (DMSO)
(cell number assays)
-20°C
Slotoxin 10~100 nM 1mM (distilled H2O)
(electrophysiology)
1mM (DMSO)
(cell number assays)
-20°C
TEA 300 µM~30 mM 1 M (distilled H2O) fresh made
Tetrandrine 5~90 µM 20 mM in DMSO -20°C
Paxilline 10~60 µM 1M (distilled H2O)
(electrophysiology)
1M (DMSO)
(cell number assays)
-20°C
Isopimaric acid 10~100 µM 1 M (distilled H2O )
(electrophysiology)
1 M (DMSO)
(cell number assays)
-20°C
Page 73
SECTION2: MATERIALS AND METHODS
61
Solutions used in electrophysiology:
High K saline 1 contains (mM): 5 NaCl, 140 KCl, 1 MgCl2, 1 CaCl2, 10
HEPES, 11 EGTA, pH adjusted to 7.2 with KOH (free Ca2+
is 0.031 mM)
High K saline 2 contains (mM): 5 NaCl, 140 KCl, 1 MgCl2, 1 CaCl2, 10
HEPES, pH adjusted to 7.2 with KOH.
NaCl Locke contains (mM): 150 NaCl, 3 KCl, 2MgCl2, 2CaCl2, 10 HEPES,
10 Glucose and the pH adjusted to 7.4 with NaOH
2.6 RT-PCR
RT-PCR (Reverse transcription-polymerase chain reaction) is a technique in
which an RNA strand is "reverse" transcribed into its DNA complement
(cDNA), followed by amplification of the resulting DNA using a polymerase
chain reaction (PCR). The exponential amplification via RT-PCR provides a
highly sensitive technique, where any specific piece of DNA or RNA can be
characterized, analyzed, and synthesized. PCR involves preparation of the
sample, the master mix and the primers, followed by detection and analysis of
the reaction products.
RNA was extracted from a chosen cell line by following the TRIZOL
(Invitrogen, UK) isolation protocol. Any DNA present in the RNA preparation
was removed using DNA-Free (Ambion, UK). The amount of RNA isolated
was quantified by measuring the light absorbency at two distinct wavelengths
of 260 nM (for RNA) and 280 nM (for DNA). The A260/A280 nm absorption
ratio was expected to be greater than 1.7.
Page 74
SECTION2: MATERIALS AND METHODS
62
In the RT reactions the Ambion RT System Kit® was used. AMV reverse
transcriptase (AMV RT), an enzyme that catalyzes the polymerization of DNA
using template RNA, was added in one reaction in which cDNA was produced.
In a second reaction there was no AMV RT thus any DNA present would be
due to contamination of the RNA preparation with genomic DNA. The cDNA
samples were stored at -20˚C until used for PCR.
Five sets of primers were used. These primers were all located in the exons.
One set was for the BK channel α-subunit (KCNMA) (Allard et al, 2000). The
other pairs of primers were for the BK channel β1-subunit (KCNMB1)
(Hartness et al, 2003), β2-subunit (KCNMB2), β3-subunit (KCNMB3) and β4-
subunit (KCNMB4). All the primers were purchased from Invitrogen UK.
Specificity was confirmed by BLAST analysis.
A few preliminary tests were run to determine the suitable conditions for the
reactions. And then all the PCR reactions were run for forty cycles as follows:
95°C, 2 min 94°C, 30sec 55°C, 45sec 72°C, 1min 72°C, 1min
All reactions products were visualized on 2% agarose gels by staining with
ethidium bromide. A gel was made up of 2% agarose (Sigma, UK) in 1 X TAE
buffer (40 mM Tris base, 1.14 mg/ml and 1 mM EDTA) with 1μl ethidium
bromide (10mg/ml). Hyperladder IV (Bioline, UK) and cDNA samples were
loaded into the gel wells. Under 100 V the samples ran on the gel for 25-
45mins (depending on the size of the gel) before bands were visualized using a
UV Gel Doc System and photographed.
40 cycles
Page 75
SECTION2: MATERIALS AND METHODS
63
2.7 Statistics
In this project all numerical data are expressed as means ± SD. Data from the
MTS assays were tested for statistical significance with one-way ANOVA
combined with Bonferroni using the Origin 7 statistics package. The statistical
results of cell viability assays were produced by Student’s t test using Origin 7.
Data from electrophysiology experiments such as channel current (I), channel
open probability (Po) were compared by Student’s t test. A value of p <0 .05
was considered significant.
Page 76
SECTION 3: ION CHANNEL SURVEY IN OSTEOBLAST AND
OSTEOBLAST-LIKE CELLS
64
SECTION 3: ION CHANNEL SURVEY IN
OSTEOBLAST AND OSTEOBLAST-LIKE CELLS
3.1 Introduction
Ion channels are cell membrane proteins that are widely expressed in all cells
of all living organisms. It has previously been stated that “The electrical
properties of ion channels distinguish us from stones” (Armstrong, 2003).
Since Hodgkin and Huxley did their important pioneering work on analysing
the passage of the electrical nerve impulse down the squid axon membrane
(Hodgkin and Huxley, 1952), ion channels have been intensely studied. They
have been cloned (Noda et al., 1984; Kamb et al., 1987; Tempel et al., 1987;
Pongs et al., 1988), subtypes identified, the pore regions established (Hartmann
et al., 1991; Yellen et al., 1991) and even the crystal structure at high resolution
(~ 3 Å) of some channels has been determined (Doyle et al., 1998 and Jiang et
al., 2003). These excellent and detailed studies have h elped build a picture of
ion channel structure and function, have added to our knowledge of ion
channel-related diseases and finally offered the prospect of new therapies.
Page 77
SECTION 3: ION CHANNEL SURVEY IN OSTEOBLAST AND
OSTEOBLAST-LIKE CELLS
65
3.1.1 Potassium channels, a widely distributed class of ion channel
Ion channels come in many different forms and can be classified by the species
of ions which are permeant or can pass through. Hence there are K channels,
Na channels, Ca channels, Cl channels and some non specific cation channels.
Ion channels are also classified by the nature of their gating. Thus there are
voltage-gated channels, ligand-gated channels and second messenger-
regulated channels. Thus classification of ion channels requires knowledge of
both the permeant species and the gating mechanism.
K channels, one subclass of ion channel, are in fact a large superfamily of
membrane protein channels. They may be divided into four different types on
the basis of their transmembrane topology and gating. Within each of these
types the channels can be again subdivided into subtypes according to their
conductance and / or regulatory factors. These are shown in Table 3.1 with
their putative function.
Various types of K channels play fundamental roles in the regulation of
membrane excitability. They are critical to diverse physiological process
including neuronal signalling, smooth muscle contractility, hormone secretion
and cell proliferation and are increasingly being identified as molecular targets
in a number of pathophysiologic states. Consequently they continue to trigger
considerable enthusiasm as drug targets (e.g. Shieh et al., 2000).
Page 78
SECTION 3: ION CHANNEL SURVEY IN OSTEOBLAST AND
OSTEOBLAST-LIKE CELLS
66
Table 3.1
Class Subclass Putative Function
Ca-activated,
6 / 7 transmembrane, 1
pore
BK channel
IK channel
SK channel
Inhibit cell function
following stimuli which
increase intracellular Ca
Inwardly rectifying
2 transmembrane, 1 pore
ROMK
GPCR regulated
ATP-sensitive
Recycling and secretion of
potassium
Mediate the inhibitory
effect of many GPCRs
Close when ATP is high
Related to cell secretion
Tandem pore domain
4 transmembrane, 2 pore
TWIK
TRAAK
TREK
TASK
Contribute to the resting
membrane potential
Voltage-gated
6 transmembrane, 1 pore
hERG
KvLQT
Action potential
repolarization
Limit frequency of firing of
action potentials
Page 79
SECTION 3: ION CHANNEL SURVEY IN OSTEOBLAST AND
OSTEOBLAST-LIKE CELLS
67
3.1.2 Potassium channels in inexcitable cells
K channels were first identified in excitable cells such as neurons, skeletal and
cardiac muscle. In these cells K channels are key players in controlling the
resting membrane potential and shaping the action potential (see Table 3.1).
However many more recent studies show that K channels are not only a feature
of these excitable cells but are also expressed in many inexcitable cells
including fibroblasts (Gray et al., 1986), macrophages (Ahluwalia et al., 2004),
blood cells (Decoursey et al., 1984; Amigorena et al., 1990), glial cells
(Ramsdell et al., 1991), bone cells (Ferri et al., 1982 and Bertran, D’Alessio
and Kotsias, 1995), epithelial cells (Iliev and Marino,1993) and even cancer
cells (Pancrazio et al., 1991). The physiological properties and functions of
potassium channels in these cells could be wide ranging as their existence in
different tissues with varied functions suggests. For example, potassium
channels play key roles in proliferation of cells of the immune system and
tumour cells (Leonard et al., 1992; Wonderland et al., 1996). In addition, a
putative role for these channels in apoptosis and proliferation in many cell
types has been highlighted recently (Kunzelmann 2005; Burg et al., 2006 and
Deng et al., 2007). Potassium channels in osteoclasts contribute to several
important processes including proton transport and volume regulation
(Weidema et al., 2000) and potassium channels in osteoblasts may be involved
in secretion of important mediators of bone function (Moreau et al., 1996).
Page 80
SECTION 3: ION CHANNEL SURVEY IN OSTEOBLAST AND
OSTEOBLAST-LIKE CELLS
68
Both osteoclasts and osteoblasts are important cell types in bone and so one
key question is: Do potassium channels have key roles to play in ensuring the
integrity of bone? The hypothesis proposed here is that such channels may
have a role in osteoblast function.
The aim of this work was to investigate systematically in a number of different
osteoblast or osteoblast-like cells which potassium channels were present. To
this end, patch-clamp studies in cell-attached patches or excised patches were
carried out on the osteoblast-like cell lines MG63 and SaOS-2. Thus far no
such equivalent data exist in human primary osteoblasts. A comparison was
therefore made with primary osteoblasts from human, rat and mouse and some
experiments were also done with osteocytes (MLO-Y4), adipocytes and
HEK293 cells (transfected with the BK channel α subunit) as a further
comparison.
3.2 Materials and methods
All experiments in this Chapter used only single channel patch-clamp methods
to define which channels were present and active. The full methods are
described in Section 2. The duration of the current records analysed were at
least 30 seconds at any one potential.
Patch electrodes were filled with High K solutions 2 (as described in Section 2)
and the cells were bathed in NaCl Locke. All solutions were filtered through
Page 81
SECTION 3: ION CHANNEL SURVEY IN OSTEOBLAST AND
OSTEOBLAST-LIKE CELLS
69
0.2 μm PVDF membrane 4 mm syringe filters (Whatman). The composition of
these solutions and all compounds suppliers were given in Section 2.
In all cases, three thousands cells were seeded on to 16 mm diameter coverslips
in 6 well plates. Cells were cultured at 37C in a humidified atmosphere of 5%
CO2 and 95% air. To obtain comparable data, patch-clamp experiments were
performed within 3 days after seeding and before cells were confluent.
Single channel recordings made at various membrane potentials were saved as
digitised recordings using the electrophysiology software package, WinEDR (J.
Dempster) and analysed in the conventional way. Hence, amplitude histograms
were first created to reveal closed and open peaks and Gaussian fits made to
compute unitary current and any other current peaks. The mean unitary
currents from the Gaussian fits at various patch potentials were used to create
the plots of unitary current versus voltage change (I-V). The distribution of
current amplitudes gives a good approximation of the open probability (Po) of
any channel. Additionally, this was occasionally obtained by carrying out
transition state detection (50% threshold) and this provided estimates of mean
channel open and closed times also. Such computations enabled plots of Po vs
voltage (channel activity) to be generated. The above plots gave information on
single channel conductance, ionic selectivity and channel activity.
Page 82
SECTION 3: ION CHANNEL SURVEY IN OSTEOBLAST AND
OSTEOBLAST-LIKE CELLS
70
The following Goldman-Hodgkin-Katz (G-H-K) equation (Goldman, 1943;
Hodgkin and Katz, 1949; Frankenhauser, 1962; Binstock and Goldman, 1971
and Clay, 1991) was used to calculate the permeability ratio (PK/PNa)
where E is the reversal potential, R is the universal gas constant, T is
temperature, F is Faraday’s constant, and Px is the permeability to the xth
species of ion.
Quantification of results required curve fitting e.g. linear or polynomial fits, or
in the case of the Po data, results were fitted by a single Boltzmann function:
The statistical methods were described previously in Section 2. All data are
expressed as mean ± SD
3.3 Results
Only phase bright cells in isolation were patched and the success rate at
attaining giga seals (> 1GΩ) was usually above 50% unless it is specified.
Given the solutions used for patching (see above) the concentration gradients
for Na+
and K+ were: in cell-attached patches [K
+]o = 140 mM, [Na
+]o = 5 mM;
Page 83
SECTION 3: ION CHANNEL SURVEY IN OSTEOBLAST AND
OSTEOBLAST-LIKE CELLS
71
[K+]i = 150 mM (assumed), [Na
+]i = 5 mM (assumed) (Lodish et al., 2000); in
inside-out patches [K+]o = 140 mM, [Na
+]o = 5 mM; [K
+]i = 3 mM, [Na
+]i = 150
mM; in outside-out patches [K+]o = 3 mM, [Na
+]o = 150 mM; [K
+]i = 140 mM,
[Na+]i = 5 mM. The movement of ions is determined by two opposing factors:
the membrane electric potential difference and the ion concentration gradient.
Once these two factors balance each other out the system (ion movement)
reaches an equilibrium. If the membrane is permeable only to K+
ions, then the
measured electric potential difference across the membrane equals the
potassium equilibrium potential in millivolts which is ErevK. The magnitude of
ErevK can be calculated by the generalised Nernst equation:
R (the gas constant) = 1.987 cal/(degree · mol), or 8.314 joules/(degree · mol);
T (the absolute temperature) = 293 K at 20 °C, Z (the valency) = +1, F (the
Faraday constant) = 23,062 cal/(mol · V), or 96,479 coulombs/(mol · V). At
room temperature (20°C) this Nernst equation reduces to
In cell-attached patches, since [Ko]/[Ki] ≈ 1, then ErevK = 0 mV. Under these
conditions we can distinguish cation from anion currents easily but from
reversal potentials we cannot always distinguish potassium from non-selective
cation channel openings in the cell-attached configuration. While in inside-out
patches, the reverse potential from mean data of the experiments was 60mV
and thus we can distinguish potassium channels from non-selective cation
channels.
Page 84
SECTION 3: ION CHANNEL SURVEY IN OSTEOBLAST AND
OSTEOBLAST-LIKE CELLS
72
3.3.1 Channels in human osteoblast-like cells
Single channel recordings in cell-attached patches from human osteoblast-like
cells (MG63 and SaOS-2 cells) showed a number of discrete current levels
indicative of a number of channel openings. Channel openings often appeared
at negative potentials (e.g. – 70 mV). The membrane potential was calculated
as: membrane potential = - patch potential change required to minimise the rms
noise i.e. at Ek or at 0 mV. On the basis of the unitary conductance, open
probability, and mean open time; three different types of channels were
identified in these cells. These channels were expressed with high density and
very often they co-existed with smaller conductance channels opening
alongside the largest conductance one.
In this section the two principal channels identified in MG63 cells are
described. Visual inspection of the raw electrophysiological recordings (Fig
3.1) at depolarised potentials in a cell-attached patch indicated that the major
openings were a large conductance channel. This channel opened on
depolarisation with an open probability (Po) which increased with each
depolarising step. The reversal potential was invariably close to 0 mV as
predicted for a cation selective ion channel. This channel was observed in 116
cell-attached patches, and the channel conductance from the pooled current-
voltage (I-V) plots was calculated to be 315 ± 45 pS (n=98) (for a single I-V
example see Fig 3.2). The channel activation (Po-V) curve indicated that this
Page 85
SECTION 3: ION CHANNEL SURVEY IN OSTEOBLAST AND
OSTEOBLAST-LIKE CELLS
73
type of channel was strongly voltage-dependent with a V½ typically of 90 mV,
slope factor = 5.1 (see Fig 3.2). Another type of channel with smaller unitary
conductance (67 ± 19 pS) was also readily identified in cell-attached patches.
This type of channel was not however active in each individual patch. In fact
the prevalence was around 9:1 in favour of the large conductance channel. A
comparison of the two channels is summarised in Table 3.2. There are marked
differences in parameters such as single channel conductance, channel open
times and open probability. The large conductance channel was however more
active and prevalent and therefore was easier to identify than the other type.
In some excised inside-out and outside-out patches these types of channels also
co-existed in the same patch as shown in Fig 3.3. In excised patches in
asymmetrical K+
(3/140) the single channel conductance of the large
conductance channel decreased to 151 ± 12 pS while the smaller one is 38 ± 7
pS in inside-out patches. The large conductance channel showed apparently
shorter duration of the open state than the smaller conductance channel as
shown in Fig 3.3 (A). In outside-out patches the mean large conductance is
124 ± 13 pS (n=24) and the small one is 34 ± 5 pS (n=3). The dependence of
conductance on [K+] is indicative of the higher permeability of the channel for
K+. The reversal potential from the mean data of large conductance channel in
excised inside-out patches was +60 mV, giving a PK:PNa ratio (calculated from
the G-H-K equation) of 15:1.
Page 86
SECTION 3: ION CHANNEL SURVEY IN OSTEOBLAST AND
OSTEOBLAST-LIKE CELLS
74
Table 3.2
Channel conductance Open probability
Type I 315 ± 45 pS (cell-attached patch )
151 ± 12 pS (inside-out patch)
124 ± 13 pS (outside-out patch)
0.1 to ~ 0.9
Type II 67 ± 19 pS (cell-attached patch)
38 ± 7 pS (inside-out patch)
34 ± 5 pS (inside-out patch)
< 0.1
Importantly, the large conductance channel was also readily identified in
SaOS-2 cells. Typical channel openings and the I-V plot constructed from raw
data from a typical recording are shown in Fig 3.4. This plot showed a distinct
“tailing off” of current when the membrane potential is over 100 mV. This is
because the K channel is virtually impermeable to Na+, which caused the I-V
relationship to become asymptotic to the abscissa whenever there is internal
Na+ block of the channel. This is a notable feature of BK channel having been
pointed out in other tissues (Yellen et. al., 1984 and Paul et al., 1998). The
channel conductance was calculated to be 286 ± 17 pS (n=17) from pooled I-V
plots from cell-attached patches.
3.3.2 Channels in human primary osteoblast (HOB)
Single channel recordings from HOB cells were carried out using the same
protocol as in the case of MG63 cells. The success rate at attaining giga seals
on HOB cells was lower than 30%. The channels detected in these HOB cells
again interestingly can be divided into 3 major types according to single
Page 87
SECTION 3: ION CHANNEL SURVEY IN OSTEOBLAST AND
OSTEOBLAST-LIKE CELLS
75
channel conductance. Typical channel openings in a cell-attached patch from a
HOB cell are shown in Fig 3.5. The slope conductances of the three types of
channels, determined from the current–voltage (I-V) relationship (see e.g. Fig
3.6) were 233 pS, 139 pS and 69 pS. Different types of channels opened either
alone or alongside another type in cell-attached recordings. Typically the large
conductance channel opened first at depolarization (e.g. 20 mV, see Fig 3.6)
and the large conductance channel was found in 9 out of 10 patches. The
activity of the large conductance channel was voltage-dependent, activity
increasing when the cell membrane was depolarised, although occasionally, the
channel went into long closed periods. The Po versus voltage data are shown in
Fig 3.7 indicating that the large conductance and intermediate conductance
channels were both voltage-dependent, channel activity increasing steeply with
depolarization (Po varies between 0.01 and 0.9). In the case of the small
conductance channel the Po did not however change with the patch potential,
remaining at < 0.1 up to + 80 mV.
3.3.3 Channels in mouse primary osteoblast and bone marrow cells
The channels identified in cell-attached patches from mouse primary
osteoblasts can be divided into 2 types. The major type was also the large (c.f.
data above) conductance (221 ± 9 pS) one (n=5) (Fig 3.8). It was expressed and
active in about 80% patches in this cell type. Data from an excised inside-out
patch gave an extrapolated reversal potential of 53 mV. Thus this channel is
selective to K+
because PK: PNa ≈15:1(calculated as described above). The
Page 88
SECTION 3: ION CHANNEL SURVEY IN OSTEOBLAST AND
OSTEOBLAST-LIKE CELLS
76
activity and density of this channel was lower than that observed in MG63 cells
and human primary osteoblasts (see e.g. activation plot in Fig 3.9). Mouse bone
marrow cells are much smaller than the mouse primary osteoblasts. So that
these bone marrow cells were almost impossible to be patched. Only 3
successful seals were achieved although there were no data recorded from them,
because the seals were lost almost immediately.
3.3.4 Channels in mouse osteoblast-like cells (7F2)
7F2 cells retain some features of mesenchymal cells and as such can
differentiate into adipocytes. These cells can be distinguished easily under the
microscope, 7F2 cells being fibroblastic, whereas the adipocytes were on
average larger, were flat and possessed bright lipid droplets. In the
differentiation medium (as stated in Section 2) these two types of cells often
co-existed on the same coverslip and could be patched sequentially.
Interestingly, although seals could be readily obtained, no single channel
openings were detected in either cell-attached or excised patch recordings from
the adipocytic cells (n=19).
The cell-attached patches on the differentiated 7F2 cells went to excised inside-
out patches very easily so no cell-attached patch recordings were made from
these cells. Single channel recordings revealed in inside-out patches the
presence of a larger (154 ± 11 pS) and smaller (31 ± 7 pS) conductance
Page 89
SECTION 3: ION CHANNEL SURVEY IN OSTEOBLAST AND
OSTEOBLAST-LIKE CELLS
77
channel in the differentiated 7F2 cells. In I-V plots in Fig 3.10 are shown the
openings of these two different channels in inside-out patches from two 7F2
cells. The straight line regression fits generate slope conductances of 41 pS and
125 pS for type I and type II respectively.
3.3.5 Channels in mouse osteocytes (MLO-Y4)
Mouse osteocyte-like cells (MLO-Y4) were grown on collagen type1 coated
coverslips for all patch-clamp experiments. Only cells showing a dendritric
phenotype were patched. A small conductance channel was recorded in 15 cell-
attached patches and gave a mean single channel conductance of 51 ± 9 pS
(n=12). Po of the channel showed no significant changes (between 0.6 ~ 0.7)
when membrane potential changed from +80 mV to +160 mV (see e.g. Fig
3.11). No large conductance channel was detected from MLO-Y4 cells in
either cell-attached or excised patches.
3.3.6 Channels in rat primary osteoblasts and bone marrow cells
Rat primary osteoblasts and bone marrow cells were obtained from two
different Sprague Dawley rats. Although seals were easy to achieve, no
channels were detected in cell-attached patches from either rat primary bone
marrow cells or osteoblasts at either depolarised or hyperpolarised potentials
(n=13). No channels were found in excised patches from these cell types either
(n=11).
Page 90
SECTION 3: ION CHANNEL SURVEY IN OSTEOBLAST AND
OSTEOBLAST-LIKE CELLS
78
3.3.7 Potassium channels in HEK293-α cells
Transfected HEK293-α cells were seeded on to poly-lysine-coated cover slips
and were patched 24 hours later. These cells were a homogeneous population
or were ‘purified’ by transfection with BK channel hSlo subunit. Hence only
the large conductance voltage-dependent channel was observed under the
conditions of these experiments. In cell-attached patches the conductance was
calculated to be 210 ± 31pS (n=12, see e.g. Fig 3.12A). The activity of the
channel increased when the membrane is depolarised. Fig 3.12B showed that
the potassium channel in HEK293-α cell was voltage-dependent, the channel
activity increasing on depolarisation, the V1/2 being 120 mV.
3.4 Discussion
A number of different cell types were investigated in this section, in some
cases there were no published data available on the complement of channels
present in such cell types and in some instances the cells themselves were also
new to the laboratory. It was therefore first necessary to establish that they
could be patched easily and to survey what channel (if any) they possessed. As
it turned out, all cell types could be patched although some were easier than
others e.g. MG63 cells. In particularly, HOB and MG63 cells were easy to
patch and gave an over 50% successful rate of getting “giga-seal”. On the other
hand, primary osteoblasts from rat and mice were hard to patch because of their
size and even when patched the seal was lost easily. So that it caused
Page 91
SECTION 3: ION CHANNEL SURVEY IN OSTEOBLAST AND
OSTEOBLAST-LIKE CELLS
79
difficulties to gain data from these cells. Whole-cell patch had been tried on
MG63 and HOB cells but it was hardly to approach a successful stable whole-
cell patch. It either lost the seal or went to out-side out patch.
The cells that have been investigated include human osteoblast-like cells
(MG63 and SaOS-2), human primary osteoblasts (HOB), mouse osteoblast-like
cells (7F2), rat and mouse primary osteoblasts and bone marrow cells, mouse
osteocyte-like cells (MLO-Y4) and a BK channel hSlo subunit transfected cell
line (HEK293). Both cell-attached and excised patches were studied and a
summary of the principal conductances identified is given in Table 3.3.
Reversal potentials and the dependence on [K]o indicated that at least some of
these openings could be attributed to currents through K+-selective channels.
Hence in excised patches in asymmetrical K+ it was shown that the reversal
potentials of these detected channels were around 60 mV, giving a calculated
Pk/PNa ≈ 15 from the G-H-K equation. Thus these large conductance channels
are modestly selective for K+ (as shown in figures 3.3., 3.8 and 3.10). Slope
conductances, determined from the current-voltage (I-V) relationship, varied
from 20 pS to 300 pS. In some cases (e.g. the large conductance) the channel
activity increased with the depolarisation showing these channels to be voltage-
dependent. Other channels which were voltage-independent might be KATP
channels, which have a unitary conductance of around 50 pS. Previous work in
this laboratory has shown the message for the principal subunits of KATP exists
in MG63 cells plus the appropriate electrophysiology and pharmacology
(Henney et al., 2006).
Page 92
SECTION 3: ION CHANNEL SURVEY IN OSTEOBLAST AND
OSTEOBLAST-LIKE CELLS
80
Table 3.3 Type I = Large conductance (>150pS) Type II = Intermediate conductance (50 pS~150 pS)
Type III = Small conductance (<50 pS)
√, indicates presence of channel; n.d. indicates not detected
Voltage-dependent
channel Not voltage-
dependent
channel
Type
I Type
II Type
III
MG63 cells √ √ √ √
SaOS-2 cells √ n.d. n.d. n.d.
HOB cells √ √ √ √
Mouse primary osteoblasts √ n.d. n.d. n.d.
Mouse primary bone marrow cells n.d. n.d. n.d. n.d.
7F2 cells √ n.d. n.d. √
7F2 adipose cells n.d. n.d. n.d. n.d.
MLO-Y4 cells n.d. n.d. n.d. √
Rat primary osteoblasts n.d. n.d. n.d. n.d.
Rat primary bone marrow cells n.d. n.d. n.d. n.d.
HEK293-α cells √
Previous work identified K channels in MG63 cells (Wann et al., 2004) and has
revealed a putative role in cell secretion (Moreau et al., 1997). Hence MG63
cells were used as positive control to detect BK channels in this part of work.
Similarly, BK hSlo subunit transfected HEK293 cells acted as a positive
control for the expression BK channel. On the contrary, mouse osteocyte-like
cells (MLO-Y4) were introduced as a negative control for BK channel (Gu et
al., 2001).
The large conductance channels may be distinguished from the other channels
in that it shows wide expression and high activity in almost all of these cell
types. This channel was therefore highlighted for further investigations.
Page 93
SECTION 3: ION CHANNEL SURVEY IN OSTEOBLAST AND
OSTEOBLAST-LIKE CELLS
81
3.4.1 Potassium channels in osteoblast-like cells
As indicated above, potassium channels have been described previously in
human osteoblast-like cells (Moreau et al., 1997), and significantly it has been
suggested that these potassium channels modulate the secretion of osteocalcin.
In this section, a large and intermediate conductance, voltage-dependent
channel and a smaller conductance, voltage-independent channel were also
identified. Additionally, another human osteoblast-like cell which is more
differentiated (SaOS2) was investigated. In this cell only the large conductance
channel was identified in single channel recordings. Although MG63 and
SaOS2 cells are both derived from osteosarcoma they have different
characteristics such as that SaOS2 cells more closely resemble osteoblast cells
by having the ability to mineralise. Hence different channels may be expressed
in the different cells for their specific functions. Osteoblast-like cells from
mouse (7F2) was also studied for the first time. These 7F2 cells can
differentiate into adipocytes so both phenotypes were patched and interestingly
the results revealed that the large conductance (potassium) channels in 7F2 cell
were not active in the adipocytes. Thus, in 7F2 cells both large and small
conductance channels were located in inside-out patches, whilst in the parallel
experiments on adipocytes no channel openings were observed. Why such
channels are lost en route to differentiation into adipocytes is a question for the
future.
Page 94
SECTION 3: ION CHANNEL SURVEY IN OSTEOBLAST AND
OSTEOBLAST-LIKE CELLS
82
HEK-α cells are native HEK293 cell transfected with the BK channel α subunit
(hslo) cDNA. Recordings from cell-attached patches in these cells showed
openings of only the large conductance, voltage-dependent potassium channel.
All the openings match the characteristics of typical BK channel openings such
as large conductance (210 pS) and voltage-dependence. The position of the
activation (Po) curve on the voltage axis in the cell-attached recordings (e.g.
Fig 3.12) makes an interesting comparison to the Po data for native channels in
for example MG63 cells, given that there is no β subunit present in the
HEK293 cells which is known to influence activation parameters. This is
discussed further in the Section 4. The results from patches in these two types
of cells served as useful negative and positive controls and highlight the
position of the osteoblast or osteoblast-like cells in terms of the expression of
the large conductance K channel.
MG63 cells and SaOS-2 cells are osteoblast-like osteosarcoma cell lines. These
cells display such osteoblastic characteristics as the production of cAMP,
responsiveness to PTH and prostaglandin E2, 1,25-(OH)2D3 induced
osteocalcin and alkaline phosphatase synthesis (Lajeunesse et al., 1990) . The
large conductance channel was found in both these cell lines, but the question
is how well do these cells “model” the real osteoblast? For this reason it was
crucial and additionally interesting to survey the complement of channels in
primary osteoblasts.
3.4.2 Channels in primary bone cells
Page 95
SECTION 3: ION CHANNEL SURVEY IN OSTEOBLAST AND
OSTEOBLAST-LIKE CELLS
83
Primary cells from human, rat and mouse were investigated. The recordings
from human primary cells (HOB) showed three types of channels: large
conductance and intermediate conductance, voltage-dependent channels and a
small conductance, voltage-independent channel. The results reveal a large
conductance channel in 90% patches, a higher prevalence than in MG63 cells
(70%). while the intermediate and small conductance channels are present in
less than 20% of the patches. What is clear therefore is that MG63 cells
represent a good working model for HOB at least in respect of the operation of
these channel conductances.
In addition to HOB cells, rat and mouse primary osteoblasts and bone marrow
cells were investigated. Surprisingly, there were no channels detected in
recordings from cell-attached patches of rat osteoblasts or bone marrow cells
(n=13) whereas in contrast the large conductance voltage-dependent channel
was present and active in mouse primary osteoblasts but not mouse bone
marrow cells (see Table 3.2 and section 3.3.3). The studies on juvenile bone in
BK- deficient (BK-/-
) female mice revealed no BK channels expressing in
mouse osteoblasts (Sausbier et al., 2011). In the patch-clamp studies reported
here a BK channel was detected in mouse cells that were presumed to be
osteoblasts. The question is are these electrophysiological data here truly in
disagreement with the data of Sausbier et al. (2011) who carried out no
electrophysiology. Or rather does it reflect the different methods used and their
Page 96
SECTION 3: ION CHANNEL SURVEY IN OSTEOBLAST AND
OSTEOBLAST-LIKE CELLS
84
antibody studies were simply deficient in not being able to identify the BK
channel structure present in mouse osteoblasts.
The large conductance potassium channels are thus prevalent and active in
human and mouse primary cells as well as in human osteoblast-like cell lines.
This suggested a function for this channel in these cell lines which may match
that in primary cells in vivo. Hence, future work focuses (see Sections 4, 5 and
6) on the characterisation of this channel in either these primary cells or cell
lines.
3.4.3 Channels in other cells surveyed
As a comparison, patch-clamp studies were carried out on cells which are
neither primary osteoblast cells nor osteoblast-like cells such as the mouse
osteocyte-like cell line (MLO-Y4) and also transfected HEK-α cells.
In MLO-Y4 cells only the small conductance, voltage-independent channel
was observed. The large conductance, voltage-dependent potassium channel
was not apparently active in any patches from this type of cell. This is
consistent with the initial description of potassium channels found in MLO-Y4
cells by Gu et al. (Gu et al., 2001). They explored the presence of mRNA for
the type 1 and 2 small conductance Ca2+
-activated potassium channels (SK)
and sulphonylurea receptor SUR2, a subunit of glibenclamide-insensitive ATP-
dependent K channels (KATP). The message for the large conductance, Ca2+
-
Page 97
SECTION 3: ION CHANNEL SURVEY IN OSTEOBLAST AND
OSTEOBLAST-LIKE CELLS
85
activated potassium channel was not detected in their experiments (Gu et al.,
2001).
3.5 Conclusion
This section of work aimed to conduct a preliminary patch-clamp single
channel survey on the expression of activities of channels in primary
osteoblasts, primary bone marrow cells, osteoblast-like cells, osteocyte-like
cells and DNA transfected HEK293 cells. Data from this survey gave initial
fundamental and important information on the viability and suitability of cells
along with the channel type, prevalence and activity in these cells. A large
conductance (> 200 pS), voltage-dependent potassium channel (assumed to be
BK) was observed in almost all cell types. BK channel is classically a voltage-
dependent, Ca2+
- activated potassium channel with a large conductance. It is
found in a wide variety of cells including nerve cells, muscle cells and
endocrine cells. One report concludes that the BK channel may regulate MG63
cell secretion (Moreau et al., 1996). This laboratory has presented in
preliminary form findings suggesting that BK channels express with high
density and activity in both MG63 and SaOS-2 cells (Wann et al., 2004a and
Wann et al., 2004b). Given that they are found in almost all the cells being
investigated in this section, the BK channel was considered ideal for further
investigation on its characteristics and more importantly possible function in
osteoblast–like cells and primary osteoblasts.
Page 98
SECTION 3: ION CHANNEL SURVEY IN OSTEOBLAST AND OSTEOBLAST-LIKE CELLS
(3-1)
All Points (pA)
00 5-5 10 15 20
00
0.5
1
1.5
2
%
All Points (pA)
00 5-5 10-10 15 20 25
00
1
2
3
4
5
6
%
All Points (pA)
00 10-10 20
00
0.5
1
1.5
2
2.5
3
%
All Points (pA)
00 10-10 20 30 40
00
1
2
3
4
%
Fig 3.1 Channel openings recorded at various membrane potentials in a single cell-attached patch from an MG63 cell. The raw data in panels A, B, C and
D show openings at assumed membrane potential of 20, 40, 60 and 80 mV from at least two types of channel. One type of opening is of large amplitude
(e.g. >10 pA) and is of a modest duration. The other opening was on average much longer and was of smaller amplitude (unitary current < 5 pA). The
amplitude histograms (a, b, c, and d) constructed from the raw data show very clearly these two channel types which are denoted by * and **. The two sets
of caliberation bars in D refer to all of the panels. The “Bin Width” set up for histogram analysis is 0.2 pA and the “Bin number” is 500.
Im
10 pA
2 s
Im
10 pA
10 ms
Im
10 pA
10 ms
60 mV
Im
10 pA
2 s
Im
10 pA
10 ms
20 mV
*
* *
*
**
**
**
**
Im
10 pA
2 s
Im
10 pA
10 ms
Im
10 pA
10 ms
40 mV
A
B
C
D
a
b
c
d
Im
10 pA
2 s
Im
10 pA
2 s
Im
10 pA
20 ms
Im
10 pA
10 ms
80 mV
Page 99
SECTION 3: ION CHANNEL SURVEY IN OSTEOBLAST AND
OSTEOBLAST-LIKE CELLS
(3-2)
-60 -40 -20 0 20 40 60
-15
-10
-5
0
5
10
15
20
25
Type II channel
Y= 0.08x+0.11
Type I channel
Y= 0.332x-0.239
Membrane potential (mV)
Sin
gle
Ch
an
ne
l C
urr
en
t (p
A)
0 20 40 60 80 100 120 140 160 180 2000.0
0.2
0.4
0.6
0.8
1.0
Type II channel
Type I channel
Patch Potential Change (mV)
Po
Fig 3.2 I-V plots from the openings of the 2 different channels (A) and the
corresponding voltage- activation curves for these channels (B) in a single cell-
attached patch from an MG63 cell. A) The straight line regression fits to the I-
V plots yielded slope conductance of 332 pS for the type I, and 80 pS for the
type II channel respectively. B) The Po versus voltage data for the type I
channel were fitted by a Boltzmann function, giving a V1/2 ≈ 90 mV, slope
factor = 5.1. In the case of the type II channel, the Po was voltage-independent
with a value lower than 0.1.
B
Page 100
SECTION 3: ION CHANNEL SURVEY IN OSTEOBLAST AND OSTEOBLAST-LIKE CELLS
(3-3)
-100 -80 -60 -40 -20 20 40 60
-20
-15
-10
-5
5
type I channel
Y=0.151X-6.1
type II channel
Y=0.037X-2.1
Patch Potential (mV)
Sin
gle
Ch
an
ne
l C
urr
en
t (p
A)
0 20 40 600
2
4
6
8
10
12
14
16
type I channel
Y=0.124X+6.68
type II channel
Y= 0.034X+4.78
Patch Potential (mV)
Sin
gle
Ch
an
ne
l C
urr
en
t (p
A)
Fig 3.3 In MG63 cells small conductance channels were found alongside a large conductance channels in both inside-out and outside-out
patches. Raw data (A) showed that in an inside-out patch two types of channel openings (denoted by asterisks) were recorded at -80 and -60
mV patch potential. As shown in (B), the plot of the single channel current against the patch potential gave values of conductances as 151 pS
and 37 pS. The extrapolations indicate Erev= 56 mV and 40 mV respectively. (C) and (D) show equivalent channel data in an outside-out
patch. The conductances for the two channels here are 124 pS and 34 pS (see D).
-80mV
-60mV Im
10 pA
10 ms
Im
10 pA
10 ms
Im
20 pA
10 ms
Im
20 pA
10 ms
Inside-Out Patch
Im
10 pA
10 ms
Im
10 pA
10 ms
Im
10 pA
10 ms
20 mV
40 mV
Outside-Out Patch A
B
C
D
**
* **
*
**
* **
*
Page 101
SECTION 3: ION CHANNEL SURVEY IN OSTEOBLAST AND
OSTEOBLAST-LIKE CELLS
(3-4)
Im
10 pA
10 ms
Im
10 pA
10 ms
Im
10 pA
10 ms
Im
10 pA
10 ms
Im
10 pA
10 ms
0 20 40 60 80 100 120 1400
2
4
6
8
10
12
14
16
18
20
22
Patch Potential (mV)
Sin
gle
Ch
an
ne
l C
urr
en
t (p
A)
Fig 3.4 Channel openings recorded at various membrane potentials in a single
cell-attached patch from an SaOS-2 cell (A) and I-V plot generated from these
channel openings (B). (A) The raw data show that the large conductance
channel opens at depolarized potentials (assumed membrane potentials 40, 60,
80 and 100 mV). (B) The linearity of the I-V plot between 0 and 80 mV
membrane potential in symmetrical K+
solution yielded the slope conductance
of 219 pS.
40 mV
60 mV
80 mV
100 mV
A
B
Page 102
SECTION 3: ION CHANNEL SURVEY IN OSTEOBLAST AND
OSTEOBLAST-LIKE CELLS
(3-5)
Fig 3.5 Sample traces of single channel current recorded in different cell-
attached patches from HOB cells. A, B and C showed three different types of
potassium channels which opened at depolarised potentials. Traces in (A)
indicate the large conductance channel. (B) Shows recorded openings of an
intermediate conductance channel, compared to the large conductance channel
it shows longer open times on average. (C) A small conductance channel open
alongsides the other two types of channel and its openings were hard to
distinguish from the system noise.
Im
10 pA
10 ms
Im
10 pA
10 ms
Im
10 pA
10 ms
Im
10 pA
10 ms
20 mV
40 mV
60 mV
A
Im
10 pA
10 ms
Im
10 pA
10 ms
Im
10 pA
10 ms
Im
10 pA
10 ms
20 mV
40 mV
60 mV
B
Im
10 pA
10 ms
Im
10 pA
10 ms
Im
10 pA
10 ms
Im
10 pA
10 ms
20 mV
40 mV
60 mV
C
Page 103
SECTION 3: ION CHANNEL SURVEY IN OSTEOBLAST AND
OSTEOBLAST-LIKE CELLS
(3-6)
-40 -20 20 40 60 80 100
-10
-5
0
5
10
15
20
large ch. y = 0.233x
intermediate ch. y = 0.139x
small ch. y = 0.069x
Sin
gle
channel curr
ent
(pA
)
Membrane potential (mV)
Fig 3.6 I-V plots from the 3 different channel openings. The straight line
regression fits to the I-V plots yielded slope conductances of 233 pS for big
conductance channel, 139 pS for intermediate conductance channel and 69 pS
for the small conductance channel.
20 30 40 50 60 70 80
0.0
0.2
0.4
0.6
0.8
1.0
Po
Membrane potential (mV)
large conductance ch.
intermediate conductance ch.
small conductance ch.
Fig 3.7 The corresponding voltage-activation curves for these channels in HOB
cells. The large conductance and intermediate conductance channels are
voltage-dependent, their open probability increasing with depolarised
potentials ( and ). The activity of the small conductance channel as a
function of membrane potential is shown for comparison ().
Page 104
SECTION 3: ION CHANNEL SURVEY IN OSTEOBLAST AND
OSTEOBLAST-LIKE CELLS
(3-7)
-200 -150 -100 -50 50 100 150
-45
-35
-25
-15
-5
5
15
25
Inside-out patch
Y=0.155X-8.71
Cell-attached patch
Y= 0.226X-12.96
Patch Potential Change (mV)
Sin
gle
Ch
an
ne
l C
urr
en
t (p
A)
Fig 3.8 The large conductance channel is present in mouse primary bone cells
in both cell-attached and inside-out patches. The current-voltage plot showed
that in the cell-attached configuration the single channel conductance was 226
pS with a reversal potential around 50 mV depolarised to rest. The conductance
was 155 pS in the inside- out patch reverse physiological gradient (140Ko/3Ki)
with an extrapolated reversal potential of 53 mV
-50 0 50 100 150 2000.0
0.1
0.2
0.3
0.4
0.5
Patch Potential Change (mV)
Po
Fig 3.9 The relationship between the open probability of the large conductance
channel and membrane potential in a cell-attached patch from a mouse primary
bone cell. The V1/2 was estimated at 163 mV, slope factor = 10.9.
Page 105
SECTION 3: ION CHANNEL SURVEY IN OSTEOBLAST AND
OSTEOBLAST-LIKE CELLS
(3-8)
-120 -100 -80 -60 -40 -20 20 40 60 80
-20
-15
-10
-5
5
Type I channel
Y= 0.041-1.82
Type II channel
Y= 0.125x-5.62
Patch Potential Change (mV)
Sin
gle
Ch
an
ne
l C
urr
en
t (p
A)
Fig 3.10 Two types of channels in inside-out patches from 2 7F2 cells. A) and
B) show images of the adipocytes and 7F-2 cells respectively. C) The I/V plots
yield conductances for the type I and type II channels of 41 pS and 125 pS
respectively. The extrapolated reversal potentials were for type I and II of +44
mV in both cases. Insets show sample data at -20 mV for the two channel
types.
7F2 cells adipocytes
Im
10 pA
0.01 s
-20 mV
Type II channel openings
Im
10 pA
0.01 s
-20 mV
Type I channel openings
A B
C
200 µm
Page 106
SECTION 3: ION CHANNEL SURVEY IN OSTEOBLAST AND
OSTEOBLAST-LIKE CELLS
(3-9)
0 40 80 120 160
0.0
0.2
0.4
0.6
0.8
1.0
Po
Membrane potential (mV)
Fig 3.11 A small conductance channel is present and active in cell-attached
patches from a MLO-Y4 cell. A) The I-V plot was linear and gave a slope
conductance of 47 pS. B) The relationship between Po and membrane potential
was constant (0.6- 0.7) between + 80 mV to + 160 mV.
0 40 80 120 1600
1
2
3
4
5
6
7
8
Sin
gle
ch
an
ne
l cu
rre
nt
(pA
)
membrane potential (mV)
y=0.047X+0.029
A
B Patch potential Change (mV)
Patch potential Change (mV)
Page 107
SECTION 3: ION CHANNEL SURVEY IN OSTEOBLAST AND
OSTEOBLAST-LIKE CELLS
(3-10)
Im
10 pA
10 ms Stim1
0 50 100 150 2000.0
0.2
0.4
0.6
0.8
1.0
BK channel in HEK cell
Patch Potential Change (mV)
Po
Fig 3.12 Cell-attached patches from HEK293-α cells possessed large
conductance channels. A) The I-V plot was linear between -40 and +70 mV and
yielded a slope conductance of 241 pS. B) Po – V plot shows that the channel
activity increased markedly with depolarisation. The data were fitted by a
Boltzmann equation, the V1/2 Po being 120 mV, slope factor = 7.2.
-60 -40 -20 0 20 40 60 80
-10
-5
0
5
10
15
20S
ing
le c
ha
nne
l cu
rre
nt
(pA
)
Membrane potential (mV)
y=0.241X+1.38
B
A 40 mV
Page 108
SECTION 4: EXPRESSION AND ACTIVITY OF BK CHANNEL IN MG63
AND HOB CELLS
86
SECTION 4: EXPRESSION AND ACTIVITY OF BK
CHANNELS IN MG63 AND HOB CELLS
4.1 Introduction
The BK channel belongs to a Ca2+
-activated K+ channel subfamily which is
widely expressed in both excitable and inexcitable cells. It is easily identified
because of its very large conductance and hence large unitary current (10 times
of the other K+ channels) when opened (Rothberg, 2004). The opening of BK
channel results in a large efflux of K+ ions which will cause a rapid powerful
hyperpolarisation of the cell (Rothberg, 2004). This powerful current through
the BK channel occurs in response to electrical depolarisation of the cell
membrane and/or increased intracellular calcium (Rothberg, 2004). The dual
regulation of BK channel means that these channels can regulate strongly the
cell membrane potential over a broader range of physiological conditions
comparing to other ion channels (Hille et al., 1992).
Page 109
SECTION 4: EXPRESSION AND ACTIVITY OF BK CHANNEL IN MG63
AND HOB CELLS
87
4.1.1 BK channel structure
Ca2+
-activated K+ channel subunits have 6 or 7 transmembrane domains and a
single pore domain. In contrast, to the other two Ca2+
-activated K+ channels
(IK and SK), the BK channel has additional hydrophobic segments resulting in
an extra transmembrane domain at the N-terminus so that the pore-forming
subunit (α-subunit) possesses 7 transmembrane domains. It has now been
established that in addition to the pore forming α subunit, tissue specific
accessory β subunits are expressed in different cell types. The native channel is
suggested to be formed from 4 α-subunits in combination with associated 4 β-
subunits. The extracellular loop of the β subunit lies near the mouth of the ion
pore. This structure is describes as below.
The human α subunit (hSlo) is encoded by a single gene that is located in
human chromosome 10. Seven transmembrane domains of α subunits are
referred to as S0 to S6. In addition to the extra S0 domain, the BK channel has
a long intracellular cytosolic C-terminus where at least one of the regulatory
Ca2+
-binding domains resides (Schreiber and Salkoff, 1997). This sequence is
also called the Ca2+
bowl which relates to the channel’s sensitivity to
intracellular Ca2+
changes. The hairpin loop between S5 and S6 forms the ion
Page 110
SECTION 4: EXPRESSION AND ACTIVITY OF BK CHANNEL IN MG63
AND HOB CELLS
88
pore. K channels are classified as “long pore channels” and all K channels have
essentially the same pore constitution. Without exception, all K channels
contain the same “signature sequence” TVGYG which provides carbonyl
oxygens that form four K binding sites (Heginbotham et al., 1992 and Doyle et
al., 1998). The S4 domain of the BK channel, like all voltage-gated (S4)
channels acts as the voltage sensor. Recent studies have led to the suggestion
that channel open time, unitary conductance, and voltage- dependence of BK
channels are determined by the N-terminal core, whereas Ca2+
sensitivity of the
channel appears to involve a region of several negatively charged residues at
the C-terminal core (Knaus et al., 1995). Co-expression experiments of
recombinant hSlo and the β-subunits of the BK channel indicate that the β-
subunit shifted the mid-point of activation in the Po versus voltage curve
(McManus et al., 1995). The β-subunit acts as the regulator and the structure is
much simpler than α-subunit. It is formed by 4 exons spanning ~29 kb of
human chromosome 5. The subunit is formed of two transmembrane domains
with a highly glycosylated intracellular loop (ψ). Recently, genes encoding
four types of β-subunit (β1-β4) have been discovered and characterized, and
diversity is further enhanced by alternative splicing of the β3 mRNA (Wallner
et al., 1996). The regulatory β subunit is associated with the extracellular N-
terminus of α subunit. This structure can be summarised in the schematic
below.
Page 111
SECTION 4: EXPRESSION AND ACTIVITY OF BK CHANNEL IN MG63
AND HOB CELLS
89
4.1.2 BK channel characteristics
Electrophysiologically BK channels are distinguished from other K channels
on the basis of their large conductance and novel gating system. When
[Ca2+
]i<100 nM, BK channel is in a Ca-independent state which means that
channel activity is mostly related to voltage. When [Ca2+
]i >100 nM, less
electrical energy is required to open the channel (Toro et al., 1998). In addition,
the BK channel sensitivity to Ca or voltage is regulated by the associated β
subunits. 4 different tissue specific β subunits confer different functions e.g.
the α+β1 combination has a low affinity for iberiotoxin (IbTX, a selective
blocker for hslo). Channels comprised of β2 subunits inactive rapidly. The β3
subunit is found in pancreas and spleen cells. α+β3 constructs produce
channels with activation properties similar to those of α subunit. The β4
+
+
+
+
subunit subunit
Voltage sensing
K + pore
Ca 2+ bowl
+
+
+
+
+
+
+
+
β subunit α subunit
Voltage sensing
K + pore
Ca 2+ bowl
S1
S0
S2 S3 S4
S5 S6
Page 112
SECTION 4: EXPRESSION AND ACTIVITY OF BK CHANNEL IN MG63
AND HOB CELLS
90
subunit endows the channel with mixed characteristics. Brenner et al., (2005)
report either up- or down- regulation of channel activity formed from co-
expression of α and β4 at lower and higher Ca2+
concentrations respectively.
4.1.3 BK channel expression and function
BK channels are involved in various (patho)physiological conditions. In the
cardiovascular system, BK channels are thought to be key players in ensuring
normal vasomotor tone by regulating the excitation-contraction coupling
process. The function of BK channels present in urinary bladder smooth
muscle is to maintain the balance between contraction and relaxation of these
cells. At present, BK channel dysfunction is also being considered as a cause
for certain neurological disorders. BK channels are present in the dendrites,
axons, and synaptic terminals and play an important role in controlling the
excitability of neurons. They also influence neuronal signalling and
neurotransmitter release. In skeletal muscle BK channels are responsible for
the repolarisation of the action potential (Siemer and Grissmer, 1999). BK
channels are also found in osteoclasts (e.g. Sausbier et al, 2011) and can be
activated by the factors that elevate internal Ca2+
. This has been proposed to
cause hyperpolarization of the osteoclast, which would decrease Ca2+
influx,
giving rise to negative feedback (Wiltink et al., 1995). High density BK
channels have also been identified in osteoblast-like MG63 cells (section 3
here and Wann et al., 2004). But precisely what type of BK channel i.e. the
subunit composition is still unknown. In this section an attempt is made to
Page 113
SECTION 4: EXPRESSION AND ACTIVITY OF BK CHANNEL IN MG63
AND HOB CELLS
91
characterise the BK channel in osteoblast-like MG63 cells. The long term goal
is to define its subunit composition and the hypothesis is that physiological
parameters provide a clue to the type of β subunit present. Also the expression
and properties of the BK channel in human primary osteoblasts is described for
the first time.
4.2 Materials and methods
In this section both molecular biology (RT-PCR) and patch-clamp
electrophysiology techniques were used to probe BK channel properties in both
human osteoblast-like MG63 cells and primary human osteoblasts.
4.2.1 Cell culture
The culture conditions for human osteoblast-like MG63 cells and primary
human osteoblasts were as described in Section 2.
4.2.2 RT-PCR
As described in Section 2, following the TRIZOL isolation protocol, RNA was
extracted from MG63 (passage 27) and HOB cells. To quantify the amount of
RNA, 2 µl RNA was mixed with 68 µl sterile water and the solution was
transferred into a Quartz chamber. The light absorbency of the sample was
Page 114
SECTION 4: EXPRESSION AND ACTIVITY OF BK CHANNEL IN MG63
AND HOB CELLS
92
measured at 260 nm (for RNA) and 280 nm (for DNA). The reference number
for RNA absorbency at 260 nm is 10 OD 40 µg/ml and the acceptable range
of A260/A280 is 1.8 2.
The Ambion RT System Kit® was used for reverse transcription reactions.
Each 40 µl reaction mixture contained 2 µg RNA :
Reaction Control
1M MgCl2 8 µl 8 µl
10x buffer 4 µl 4 µl
dNTP mix 4 µl 4 µl
RNAase 1 µl 1 µl
AMV RT 1.4 µl /
Oligo dTprimer 2 µl 2 µl
RNA 2 µg 2 µg
Sterile H2O Top up to 40 µl Top up to 40 µl
Controls were carried out without AMV RT. These reactions were run with the
following programme: 42 ºC for 60 minutes followed by 99ºC for 5 minutes
then soak at 4ºC. The cDNA samples were stored at -20 ºC till used for PCR.
Four sets of primers were used to run the PCR reactions. Primers for BK
channel α- subunit (KCNMA) and β1-subunit (KCNMB1) were designed
according to Allard et al. (2000) and Hartness et al. (2003). The other sets for
BK β2-subunit (KCNMB2), β3-subunit (KCNMB3) and β4-subunit
(KCNMB4) were designed as follows:
1. The National Centre for Biotechnology Information (NCBI) nucleotide
database was searched for the BK channel β2, β3 and β4 subunit
genetic sequences in the human genome.
Page 115
SECTION 4: EXPRESSION AND ACTIVITY OF BK CHANNEL IN MG63
AND HOB CELLS
93
2. The mRNA sequences obtained were copied into “source sequence
box” of the Primer3 primer design software (Rozen and Skaletsky,
2000).
3. The selected paired primers were checked against the complete genetic
sequence by using web-based Ensemble software (Hubbard et al.,
2007). This step ensures the primers chosen are intron-spanning ones.
Thus only mRNA (not genomic DNA) would be amplified during the
PCR reaction cycles to yield products of the right size.
4. Finally, specificity was confirmed by BLAST analysis.
All the primers used in this project were purchased from Invitrogen (UK).
Forward Reverse BK α subunit
(KCNMA1) 5'-acgcaatctgcctcgcagagttg-3',
1640-1662
5'-catcatgacaggccttgcag-3',
2047-2028 BK β1 subunit
(KCNMB1) 5'-ctgtaccacacggaggacact-3',
268-288
5'-gtagaggcgctggaataggac-3',
456-436 BK β2 subunit
(KCNMB2) 5'-catgtccctggtgaatgttg-3',
465-484,
5'-ttgatccgttggatcctctc-3',
701-682 BK β3 subunit
(KCNMB3) 5'-aacccccttttcatgcttct-3',
537-556
5'-tcttcctttgctcctcctca-3',
813-794 BK β4 subunit
(KCNMB4) 5'-gttcgagtgcaccttcacct-3',
195-214
5'-taaatggctgggaaccaatc-3',
439-420
PCR reaction mixtures contained:
cDNA 1 μl
Primers 4 pmol each GoTaq polymerase 0.625 U
MgCl2 1.5mM dNTPs 0.8mM GoTaq reaction Buffer 12.5 µl
dNTPs were from Bioline Ltd. (London, UK) and all other reagents were from
Promega. PCR cycling conditions were determined as following after 4 trials:
95C for 2 min 95 C, 30 s 58 C, 45 s 72 C, 60 s 72 C for 5 min
40 cycles
Page 116
SECTION 4: EXPRESSION AND ACTIVITY OF BK CHANNEL IN MG63
AND HOB CELLS
94
All reactions products were visualized on 2% agarose gels by staining with
ethidium bromide. Negative controls (i.e. water blank and no RT product as a
template) were performed in all PCR experiments.
4.2.3 Patch-clamp
Single-channel recordings were made from cell-attached and cell-free excised
patches and segments of data analysed as described in Section 2 & 3. The
passage number of MG63 cells was below than 34. The passage number of
HOB cells was 3 and 4. The HOB cells were being patched first time in this
laboratory. The successful rate of achieving seals was about 50% and these
were usually acquired within 2 to 3 minutes.
4.3 Results
RT-PCR and the single channel electrophysiological studies in MG63 and
HOB cells showed clearly the expression, the high density and the high activity
of BK channels.
4.3.1 RT-PCR in MG63 and HOB cells
The messages for the BK channel α subunit (KCNMA1) and four β subunits
(KCNMB1, 2, 3 and 4) were detected in MG63 cells by RT-PCR. Of
considerable importance too was that the RT-PCR detected the messages for
Page 117
SECTION 4: EXPRESSION AND ACTIVITY OF BK CHANNEL IN MG63
AND HOB CELLS
95
the BK channel α subunit (KCNMA1), and only the β1 and β4 subunits in
HOB cells. Fig 4.1 shows the bands of appropriate size for the BK channel
subunits in the electrophoresis gels.
4.3.2 BK channels are functional in both MG63 and HOB cells
Since the PCR results demonstrated the existence of the messages for BK
channel subunits in MG63 and HOB cells, it was anticipated that single-
channel recording would reveal the presence of these BK channels in both cell
types. This was indeed the case.
4.3.2.1 BK channels in MG63 cells
MG63 cells were relatively easy to patch and single channel recordings showed
that in cell-attached patches the BK channel was densely expressed and active.
Thus in about 80% of patches there was more than one opening in a single
patch when recording with electrodes of resistances mostly 3-5 MΩ, tip
diameter around 1 μm. Typical openings in a cell-attached patch from an
MG63 are shown in Fig 4.2. As [Ca2+
] actives BK channel, the high density of
the BK channel in MG63 cells was clear when the [Ca2+
] facing the inner
mouth of channel was high as in excised inside-out patches in reverse
physiological K+ gradient (i.e. 1 mM Ca
2+). The amplitude histogram from a
typical inside-out patch recording is shown in Fig. 4.3. Each current peak
indicates one opening; hence there were a total of 3 openings. The maximum
Page 118
SECTION 4: EXPRESSION AND ACTIVITY OF BK CHANNEL IN MG63
AND HOB CELLS
96
number of openings was usually 3-4 although it could be higher in some
patches. The unitary currents were derived from the distribution of all current
amplitude histograms and plotted against the patch potential in I-V plots (Fig.
4.4). As described in section 3, the mean slope conductances for the BK
channel in cell-attached, inside-out and outside-out patches were calculated to
be 315 ± 45 pS (n = 98) in symmetrical K+ (Ki/Ko =3/140) , 151 ± 12 pS (n =
6) and 124 ± 13 pS (n = 16) in asymmetrical K+
(3/140). It should be noted that
the inside-out data were obtained in a reverse physiological gradient. The
success rate in maintaining patches in these configurations (for longer than
several minutes) was 87 and 80 % for inside-out and outside-out configurations
respectively. Channel open probabilities from cell-attached patches, computed
from the areas under the open peaks, were plotted against the patch potential
(Fig. 4.5A) and data fitted by a Boltzmann function. The channels were
strongly voltage-dependent with a V1/2 of 107 mV (n=3). The open probability
of BK channels in excised inside-out patches in reverse physiological K+
gradient was close to 1.0 over a wide range of negative patch potentials.
Typical data are shown in Fig. 4.5B.
The kinetic states of the BK channel were also studied using the 50% transition
detection method followed by plotting log-square distributions of open and
closed times. Meaningful values for the open and closed time distributions
were difficult to achieve because, as stated above, more than one channel was
present in 80% of cases. However, Fig 4.6 was produced from a recording from
an inside-out patch with only one channel at -60 mV. The open time
Page 119
SECTION 4: EXPRESSION AND ACTIVITY OF BK CHANNEL IN MG63
AND HOB CELLS
97
distributions were fitted with two exponentials giving two components of τo1 =
3.804 ± 0.337 ms and τo2 = 0.0924 ± 0.0177 ms. The closed time distribution
was fitted in the same way and also gave τca = 7.683 ± 1.307 ms and τcb =
0.0137 ± 0.00484 ms. This indicated that BK channel gating in MG63 cells
leads to at least 2 distinct open and 2 distinct closed states.
The Ca2+
-dependence of the channel was clear from experiments where
recording were made from outside-out patches where different High K
solutions were used as filling solutions for the patch electrode. As expected
channel activity increased with the [Ca2+
]i. This effect was most obvious at
positive potentials where the BK activity was almost 5 times higher with 1mM
Ca2+
than with 30 nM Ca2+
(see Fig 4.7).
4.3.2.2 BK channels in primary human osteoblasts
Very little electrophysiology has previously been carried out on human primary
osteoblasts. Single channel recordings from HOB cells revealed the prevalence
and high activity of BK channels. BK channels were observed in 13 cell-
attached patches. Fig 4.8 shows a typical example from a cell-attached patch
showing BK channel openings at different patch potentials. The histogram
from the all points distribution of current amplitudes revealed at least 3 active
channels. Current-voltage data for this channel in cell-attached patches were
fitted by a straight line yielding mean slope conductances of 268 pS (Fig 4.9A).
The relationship between the open probability and voltage for the same four
Page 120
SECTION 4: EXPRESSION AND ACTIVITY OF BK CHANNEL IN MG63
AND HOB CELLS
98
patches was fitted by a Boltzmann function with a mean V1/2 of 108 mV (see
Fig 4.9B).
Recordings from inside-out patches revealed that BK channels in human
primary osteoblasts in reverse physiological potassium were active, the Po
being > 0.7 over a range of potentials (data not shown). This compares
favourably with the high Po (~ 1.0) for the BK channel in the case of MG63
cells under the same conditions (Fig.4.10).
4.3.3 Conclusion
In this section the expression and characterisation of the large conductance
channel, BK was studied. In summary, the results showed importantly that the
BK channel was expressed in both MG63 cells and primary human osteoblasts
(HOB). This is the first time the channel has been reported in HOB cells. The
channel had all the hallmarks of large unitary conductance, [Ca2+
]i sensitivity
and voltage-dependence.
4.4 Discussion
4.4.1 RT-PCR showing the expression β1 and β4 subunits
Although the BK channel has been identified in MG63 cells by others in
addition to this laboratory (Moreau et al., 1997; Rezzzonico et al., 2002; Wann
Page 121
SECTION 4: EXPRESSION AND ACTIVITY OF BK CHANNEL IN MG63
AND HOB CELLS
99
et al., 2004), RT-PCR results in this section are the first evidence for the β1, 2,
3, and 4 subunits of BK channel in MG63 cells and the β1, 4 subunits and α
subunit of BK channel in HOB cells. The β subunits are important players
contributing greatly to the functional properties of the BK channel (e.g. Lu et
al., 2006). Importantly, the β1 subunit is suggested to be the necessary
associated β subunit for BK channel sensitivity to the estrogens (Valverde et
al., 1999; De Wet et al., 2006), the estrogens activating the channel through a
direct association with its subunits. Estrogen is of course considered an
important regulator of osteoblast function and is used a therapeutic drug for
some bone diseases such as osteoporosis. Estrogen replacement therapy
contributes to the maintenance of skeletal mass which is related to the positive
impact that it has on osteoblasts (Taranta et al., 2002). In addition to the
classical estrogen receptor (ER), given the presence of the β subunit, BK
channels might be another binding site for estrogen in osteoblasts, by analogy
with other tissues. Hence in vascular smooth muscle there is thought to be a
binding site for estrogen on the β1 subunit of the BK channel itself and it is
argued that women in earlier life are less susceptible to cardiovascular disease
as a consequence (Valverde et al., 1999). In conclusion, RT-PCR results show
that the message for the BK channel β1 subunit exists in MG63 and HOB cells,
so suggesting a possible route for estrogen enhancement of the BK channel in
osteoblasts. Unfortunately here it was only possible to “activate” the BK
channel with chronic exposure to estrogen so its action remains perhaps
ambiguous.
Page 122
SECTION 4: EXPRESSION AND ACTIVITY OF BK CHANNEL IN MG63
AND HOB CELLS
100
The β4 subunit was first discovered in neuronal tissues and the co-expression
of β4 subunit increase the voltage sensitivity of BK channel (Ha et al., 2004)
left shifting the channel activity (Po - V) curve. β4 subunit associated BK
channels possess distinctive pharmacological characteristics such as apparently
low sensitivity to the scorpion toxins. In summary, it can be concluded that the
native BK channels in both MG63 and HOB possess both β1 and β4 subunits at
least and that any properties of these channels should reflect that composition.
Specifically, the pharmacology of the channel should be a function of the β
subunit composition. Future experiments should consider examining the
influence of channel subunit composition on biophysical properties of the
channel, namely conduct a full channel lifetime analysis and examination of
substate behaviour as a function of the β subunit composition.
4.4.2 Electrophysiological features of BK channels in MG63 and HOB cells
BK channel events in MG63 cells or HOB cells were easily detected in single
channel patch-clamp recordings. BK channel opening results in such a large K+
efflux and hence unitary current which increases with depolarisation (at least in
cell-attached and outside-out patches), making it easy to distinguish in both
cell-attached and excised patches. Another very important “hall mark” feature
of the BK channel in these cells is the high activity. In terms of prevalence, it is
also comparable to some excitable cells e.g. Xenopus motor nerve terminals
(Sun et al., 2004). The high prevalence and activity make it compelling to
argue a strong case for function in these cells. This is particularly true given
Page 123
SECTION 4: EXPRESSION AND ACTIVITY OF BK CHANNEL IN MG63
AND HOB CELLS
101
that, when activated, it contributes such a large fraction of the membrane
current.
4.5 Conclusion
In 1996 the BK channel was reported for the first time in inexcitable
osteosarcoma MG63 cells by Moreau et al. (1996). This section shows clearly
that the BK channel is highly expressed in both MG63 cells and primary
human osteoblasts. This raises further obvious questions such as: a) what are
the pharmacological features of BK channels in these cells? b) what might be
the possible function in addition to the modulation of osteocalcin secretion
(Moreau et al., 1997). The pharmacological experiments and the cell based
assays in the next sections (5 and 6) are an attempt to address and answer these
questions.
Page 124
SECTION 4: EXPRESSION AND ACTIVITY OF BK CHANNEL IN MG63
AND HOB CELLS
(4-1)
Fig 4.1 Gel electrophoresis shows bands equivalent to the predicted size of the
BK channel subunits. A, B and C) α, β1, β2, β3 and β4 in MG63 cells and D)
α, β1 and β4 in HOB cells.
A The 407 bp size band
indicates the α subunit of
BK channel (KCNMA1) is
expressed in MG63 cells.
B β1 subunit of BK
channel (KCNMB1) is
expressed in MG63 cells.
The band size is 188 bp.
C Bands of 236 bp, 276
bp and 245 bp show that
the BK channel in MG63
cells could contain in
principle all β2
(KCNMB2), β3
(KCNMB3) and β4
(KCNMB4) subunits.
D Bands in gel
demonstrate α subunit
(KCNMA1, 407 bP), β1
subunit (KCNMB1,
188bp) and β4 subunit
(KCNMB4, 245bp)
message of BK channels
in HOB cells.
100 bp
200 bp
300 bp
400 bp
100 bp
200 bp
300 bp
KC
NM
B2
KC
NM
B3
KC
NM
B4
100 bp
200 bp
300 bp
200 bp
300 bp
400 bp
500 bp
KC
NM
B1
KC
NM
A
Page 125
SECTION 4: EXPRESSION AND ACTIVITY OF BK CHANNEL IN MG63
AND HOB CELLS
(4-2)
Fig.4.2 Channel openings in a cell-attached patch at a number of depolarised
potentials from 60 mV to 140 mV. The dashed lines represent the closed state
of the channel in this and all the subsequent figures.
All Points (pA)
00-17.9-35.8-53.7-71.6
00
0.2
0.4
0.6
0.8
%
Fig.4.3 Raw multi-channel data in an inside-out patch in asymmetric K
+
gradient ([K+]i:[K
+]o = 3:140). The amplitude histogram constructed from
these data is also shown. The patch potential was -80 mV. The four current
peaks indicate that there were at least three channels present in this patch. The
distance between each peak is 22 pA indicating that the unitary current at -80
mV is 22 pA.
60 mV
130 mV
120 mV
110 mV
100 mV
90 mV
80 mV
70 mV
140 mV
10
pA
10 ms
Im
20 pA
0.05 s
A B 1
2
3
Page 126
SECTION 4: EXPRESSION AND ACTIVITY OF BK CHANNEL IN MG63
AND HOB CELLS
(4-3)
-100 -50 50 100 150 200
-20
-10
10
20Inside-out patch
Cell-attached patch
Outside-out patch
Patch Potential Change (mV)
Sin
gle
Ch
an
ne
l C
urr
en
t (p
A)
Fig 4.4 Current-voltage data for the BK channel in outside-out (Δ), cell-
attached () and inside-out patches () from MG63 cells. Pooled data are
shown for the excised patches and a single example for the cell-attached patch.
Lines of best fit yielded conductances of 124 pS, n = 16 (Δ), 151 pS, n = 6 ()
and 315 pS (). The reversal potential was 53 mV for the inside-out patch and
–60 mV for the outside-out patch. The PK / PNa ratio calculated for the inside-
out patch configuration from the G-H-K equation being 15/1. Note the
characteristic tailing off of the unitary current values at positive potentials in
the case of the cell-attached data.
0 20 40 60 80 100 120 140 160 180 2000.0
0.2
0.4
0.6
0.8
1.0
Ptach potential change (mV)
Po
-140 -120 -100 -80 -60 -40 -20 00.0
0.2
0.4
0.6
0.8
1.0
Ptach potential (mV)
Po
Fig 4.5 (A) The Po versus voltage data from cell-attached patches (n=3) were
fitted by a Boltzmann function, giving a V1/2 = 107 mV, slope factor =14.1 (B)
Po versus voltage for a single inside-out patch in asymmetric K+ reverse
gradient. In the case of the inside-out patch the Po was constant at close to 1.0,
from around -100 mV to 0 mV.
A B
Page 127
SECTION 4: EXPRESSION AND ACTIVITY OF BK CHANNEL IN MG63
AND HOB CELLS
(4-4)
Fig. 4.6 A segment of single channel recording from an inside-out patch (-60
mV) from an MG63 cell show the BK channel displaying two types of
openings. B) The dwell time exponential histogram for the open state generated
from this record show both long and short openings. The histogram curves
were fitted with 2 Exponentials to get long opening (1) τo1 = 10.1 ms, short
opening (2) τo2 = 1.2 ms, C) the corresponding dwell time exponential
histograms for the closed state showing long closure (a) τca = 26.7 ms and short
closure (b) τcb = 1.5 ms.
Open times (s) 10 -4 10 -3 10 -2 10 -1 10 0 10 1
200
150
100
50
No. Events
B
Im
15 pA
0.1 s
Im
15 pA
0.1 s
a b
A
Closed times (s) 10 -4 10 -3 10 -2 10 -1 10 0 10 1
400 350 300 250
200
150
100
50
No. Events
C
a
b
Page 128
SECTION 4: EXPRESSION AND ACTIVITY OF BK CHANNEL IN MG63
AND HOB CELLS
(4-5)
0 10 20 30 400.0
0.1
0.2
0.3
0.41mM Ca
30 nM Ca
Patch potential (mV)
Po
Fig 4.7 The Po from outside-out patches (n=2) in asymmetrical K (Ki : Ko =
140 : 3) at 0-30 mV. Po was consistently higher with 1 mM Ca2+
(c.f. 30 nM
Ca2+
) in the electrode.
Page 129
SECTION 4: EXPRESSION AND ACTIVITY OF BK CHANNEL IN MG63
AND HOB CELLS
(4-6)
Im
10 pA
2 s
Im
10 pA
2 s
Im
10 pA
2 s
(continued)
All Points (pA)
00 9.63-9.63 19.3 28.9
00
0.5
1
1.5
2
%
All Points (pA)
00 7.67 15.3 23 30.7
00
0.5
1
1.5
2
%
Im
10 pA
0.1 s
All Points (pA)
00 13-13 25.9-25.9
00
0.5
1
1.5
2
%
Im
10 pA
0.1 s
Im
10 pA
0.1 s
20 mV
40 mV
60 mV
Page 130
SECTION 4: EXPRESSION AND ACTIVITY OF BK CHANNEL IN MG63
AND HOB CELLS
(4-6)
Im
10 pA
2 s
Im
10 pA
2 s
Fig. 4.8 Representative single-channel currents recorded at different potentials
from 20 to 100 mV. The corresponded distribution of amplitude histograms
clearly show the presence of multiple channels and the voltage dependence of
the channel activity. In the histograms the first current peak on the left was
considered to be the closed state and then the first opening, and second
opening. The area under each peak indicates the percentage of events in that
state. Hence, the histograms provide information that the “apparent” Po of this
BK channel increased with the depolarised potential. The “Bin Width” for the
histogram was set to 500.
Im
10 pA
0.1 s
All Points (pA)
00 9.35 18.7 28 37.4
00
0.2
0.4
0.6
0.8
1%
Im
10 pA
0.1 s
All Points (pA)
00 10-10 20 30
00
0.2
0.4
0.6
%
80 mV
100 mV
Page 131
SECTION 4: EXPRESSION AND ACTIVITY OF BK CHANNEL IN MG63
AND HOB CELLS
(4-7)
0 50 100 150 200
-20
-10
0
10
20
30
40
y=0.268x-14.3S
ing
le c
ha
nn
el cu
rre
nt (p
A)
Patch potential change (mV)
0 50 100 150 2000.0
0.2
0.4
0.6
0.8
1.0
Patch Potential Change (mV)
Po
Fig 4.9 (A) The pooled current-voltage relationship for the data from 4 cell-
attached patches from HOB cells are shown. The line of best fit yielded a
unitary conductance of 268 pS. (B) The open probability of these channels
is voltage-dependent, with a mean V0.5 at about +108 mV (n = 4)
depolarised from “rest”, slope factor = 14.1.
A
B
Page 132
SECTION 4: EXPRESSION AND ACTIVITY OF BK CHANNEL IN MG63
AND HOB CELLS
(4-8)
0 50 100 150 2000.0
0.2
0.4
0.6
0.8
1.0
BK channel in HEK cell
BK channel in HOB cell
BK channel in MG63 cell
Patch Potential Change (mV)
Po
Fig 4.10 Po-V plots from cell-attached patches of MG63, HOB and HEK-α
cells show that the BK channels in MG63 and HOB cells are more sensitive to
voltage than in HEK-α cells. V1/2 (MG63 cells, 108 mV, slope factor =14.7) ≈
V1/2 (HOB cells, 108 mV, slope factor = 13.9) < V1/2 (HEK-α cells, 120 mV,
slope factor = 7.2): i.e. that the Po = 0.5 value for BK channels in MG63 and
HOB occurs at less depolarised potential than the BK channels in HEK-α cells.
Page 133
SECTION 5: BK CHANNEL IN OSTEOBLASTS SHOW NEURONAL-
TYPE FEATURES
102
SECTION 5: BK CHANNELS IN OSTEOBLASTS
SHOW NEURONAL-TYPE FEATURES
5.1 Introduction
Although BK channels in excitable cells have been well investigated there is
currently a lack of specific knowledge about this type of channel in non-
excitable cells such as bone cells. In section 4, RT-PCR and electrophysiology
work identified the existence of BK channels in both osteoblast-like cells and
primary osteoblasts. The work in this section focuses on pharmacological
characterization of this type of channel in these cells. First of all, on the basis
of the literature, and the known expression of the subunits of BK channel
described in section 4, a set of compounds was chosen for testing. The results
define the pharmacological profile of BK channels in osteoblast-like cells and
osteoblasts. These agents are now discussed briefly in turn.
Page 134
SECTION 5: BK CHANNEL IN OSTEOBLASTS SHOW NEURONAL-
TYPE FEATURES
103
5.1.1 BK channel regulators
5.1.1.1 Estrogen variable effects on BK channel
Estrogen, a hormone, is produced by the ovaries. Estrogen and its receptor
modulators have been used in the treatment of breast cancer in postmenopausal
women and breast or prostate cancer in men. In addition, estrogen with diet,
calcium supplements, and exercise have been used to slow the progression of
osteoporosis. The cell membrane BK channel is one such potential encouraging
new target for estrogen. Both estrogen and Tamoxifen, a partial agonist of the
estradiol receptor, have been shown to activate BK channels in both
heterologous expression systems and smooth muscle cells, resulting in greater
repolarizing current (Wellman et al., 1996; Darkow et al., 1997; Dimitropoulou
et al., 2005). On the other hand, there are also reports about the negative effect
of estrogen on BK channels. Valverde et al. (Valverde et al., 2001) showed that
activation of BK channels by 17ß-estradiol occurs when the channel is
associated with its accessory ß1 subunit. The mechanism entailed that
estradiol-induced proteasomal degradation of the channel occurred after direct
binding of oestrogen to the BK channel. The down-regulation can be elicited
independently of classical nuclear estradiol receptors or the accessory ß1
subunit, but in the presence of ß1 subunits specific binding of estradiol to BK
channels is increased significantly. The diagram below shows the roles of the β
subunits in the regulation of the BK channel by 17ß-estradiol.
Page 135
SECTION 5: BK CHANNEL IN OSTEOBLASTS SHOW NEURONAL-
TYPE FEATURES
104
5.1.1.2 Voltage-gated channel blockers, the quaternary ammonium acid
family
Tetraethylammonium (TEA) and other quaternary
ammonium acids (QA) are potential blockers of
potassium (K+) channels and have been widely used
as tools for determining the localization of the
activation gate and the properties of the pore of
several K+
ion channels. These quaternary ammonium acids inhibit potassium
channels by binding within the ion pore (Tan et al., 1999). Most K channels are
inhibited by QA acids applied to either the intracellular or extracellular mouth
of the channel. Extracellular QA acids show higher affinity than intracellular
application. Mutation studies have shown that a specific amino acid located in
the external loop determine the sensitivity to external TEA (Doyle et al., 1998;
MacKinnon et al., 1990). BK channel α subunit (Slo) has the K+-channel
signature sequence location in the external mouth of the entryway as other four
K+ channels. Accordingly, in BK channels the quaternary ammonium acids
may bind to the similar positions of the ion pore as in the case of other K+
channels. The mechanism of QA block of BK channels has traditionally been
This diagram indicates that
the specific binding the
binding site for 17β-
estradiol is on β subunit in
BK channel.
Page 136
SECTION 5: BK CHANNEL IN OSTEOBLASTS SHOW NEURONAL-
TYPE FEATURES
105
suggested as a ‘foot-in-door’ system. But Li and Aldrich (2004) modified the
classic open channel-block mechanism and suggested that fast blockers do
speed up the deactivation process, and blocked channels must close directly
without unblocking first. This is shown in the Figure below:
All data thus far indicate that the binding site for quaternary ammonium in BK
channels is located in the ion pore which is formed by the loop between the S5
and S6 transmembrane domains of α subunit. All native BK channels are
composed of 4 α subunits and associated subunits. For example, native BK
channels in human osteoblast-like MG63 cells, may comprise all four types of
subunits which certainly are expressed there. Our investigations are based on
the hypothesis that the quaternary ammonium acids block BK channels in
MG63 cells. The affinity and blockade kinetics will be related to the size of the
molecules but not the associated subunits.
“Modification of the classical open-channel block
mechanism of the block of BK channels by QA. (A)
The classical open-channel block scheme, in which
the blocked channel cannot close until it is unblocked
first. (B) The “trapping” scheme, the channel can
close with a bound blocker trapped inside. In this
case, the blocker cannot enter or leave the channel
when it is closed. (C) “Free access” scheme, in which
the accessibility of the blocker to its binding site is
not dependent on the conformation of the channel
gate. Channels can be blocked or unblocked in either
the open or the closed conformation. This mechanism
can permit differences in binding affinity or kinetics
between the closed and open conformation. The
block may not thus be “independent” of gating”
(these graphs and legend were taken from Li and
Aldrich, 2004).
Page 137
SECTION 5: BK CHANNEL IN OSTEOBLASTS SHOW NEURONAL-
TYPE FEATURES
106
5.1.1.3 Iberiotoxin belongs to the toxin peptide family
Peptides derived from the scorpion venoms are known to act as blockers of
potassium channels. The peptides interact with the specific residues present in
the outer vestibule of K+ channels to physically occlude the pore. Among these
49 members of short-chain peptide toxins Charybdotoxin (ChTX), found in
1985, became the standard K+ channel inhibitory peptide. Later Iberiotoxin
(IbTX) and Slotoxin were identified as specific blockers of the BK channel.
Their amino acid sequences share more than 75% homology in table below.
The 3D, solution NMR structures of these peptides show a classic motif with
three anti-parallel -strands forming a -sheet face on one side of the molecule
and a helix on the other. The electrostatic isopotential at zero ionic strength
shows clearly that the toxins have a surface that is positively charged (blue grid
as shown below).
Predicted electrostatic isopotential of slotoxin, iberiotoxin and charybdotoxin.
Red and blue represent negative and positive charged surfaces respectively.
(the graphs were taken from Garcia-Valdes, et al., 2001)
Slotoxin Iberiotoxin Charybdotoxin
Sequence aligment of three scorpion toxins: charybdotoxin, iberiotoxin,
slotoxin. The homologous amino acids were highlighted in red.
Page 138
SECTION 5: BK CHANNEL IN OSTEOBLASTS SHOW NEURONAL-
TYPE FEATURES
107
The C-terminal domain of the scorpion toxins is positively charged. The
positively charged sequence is considered to provide interaction region with
the negatively charged pore region of BK channels, leading to channel
blockade. Recently investigations provide the evidence that the peptide binding
site is located in the external vestibule, near the channel pore. Peptides binding
to the residues of the external domain cause physical occlusion of channel pore
leading to inhibition of ion channel conductance. In addition, there are four
residues of the extracellular loop of the β1-subunit situating close to the
external vestibule and they are important in increasing the affinity ChTX
binding site (Hanner et al., 1998). So as to the sensitivity of the channels to
these peptide toxins depends on the regulatory β-subunits presenting in the
cells (Ghatta et al., 2006). Specifically, Slotoxin can distinguish between the α,
α+β1 and α+β4 complexes more efficiently than IbTX (Garcia-Valdes et al.,
2001).
5.1.1.4 Alkaloid BK channel blockers: tetrandrine and paxilline
There are also non-peptide natural blockers such as paxilline and tetrandrine.
Paxilline, an indole alkaloid is from penicillium
origin. It selectively blocks BK from the
intracellular side. Its structure is as below. This
compound is membrane permeable so it can be applied from either side,.
Page 139
SECTION 5: BK CHANNEL IN OSTEOBLASTS SHOW NEURONAL-
TYPE FEATURES
108
“ Tetrandrine, a bisbenzyltetrahydroisoquinoline
alkaloid extracted from the Chinese medicinal
herb Radix stephania tetrandrae, is known to
possess a wide spectrum of pharmacological activities” by Wu et al., 2000.
Throughout the past decades tetrandrine was recognized to possess anti-
inflammatory, antiallergic, antioxidant, and antifibrogenetic activities.
Additionally, it is capable of immunomodulation and inhibition of platelet
aggregation. Recently, several studies have demonstrated that tetrandrine
behaves like a calcium entry blocker. However, of interest here is the
observation that tetrandrine inhibits scorpion toxin-insensitive BK channels
present in rat neurohypophysial nerve terminals and expressed in Xenopus
oocytes (Wang and Lemos, 1992). On the other hand, toxin-sensitive BK
channels present in rat arterial smooth myocytes are not sensitive to tetrandrine
(Wang and Lemos, 1995). However, recently, Wu et al. (2000) reported in a
human endothelial cell line (HUV-EC-C) that toxin-sensitive BK channels can
be blocked by tetrandrine also. Although at a given concentration of
tetrandrine, the magnitude of any tetrandrine-induced inhibition of BK
channels was increased as internal Ca2+
was elevated; the relationship between
the inhibitory effect of tetrandrine and internal Ca2+
concentration is still not
fully understood.
Page 140
SECTION 5: BK CHANNEL IN OSTEOBLASTS SHOW NEURONAL-
TYPE FEATURES
109
5.1.2 BK channel structure and sensitivity to the regulators
As described in section 4, the BK channel is composed of 4 α subunits and 4 β
subunits. In contrast to the other voltage-gated potassium channels, the BK
channel α subunit has an internal C-terminus and an external N-terminus which
is the binding site of β subunit. The C-terminus is a long tail which is divided
into 4 sequences (S7-S10) according to function which also distinguishes it
from other voltage-gated potassium channels. The Ca2+
sensitivity of the
channel appears to involve a region of several negatively charged residues at
the C-terminal core (Knaus et al., 1995). The β-subunit acts as the regulator
and the structure is much simpler than the α-subunit. The β1-subunit was first
identified in bovine smooth muscle. Expression of the β1 subunit produces BK
channels that are active at strong depolarization and high Ca2+
concentration. It
also dictates the BK channel’s response to 17β-estradiol and other estrogen
receptor regulators. The α+β1 combination has low affinity for iberiotoxin
(IbTX, a selective blocker for hslo). Channels comprised of β2 subunits
inactive rapidly. The β3 subunit is found in pancreas and spleen cells. α+β3
constructs produce channels with activation properties similar to those of α
subunit. The β4 subunit endows the channel with mixed characteristics.
Brenner et al. reported upregulation and downregulation of channels formed
from co-expression of α and β4 at lower and higher Ca2+
concentrations
respectively (Brenner et al., 2005) . In addition, under normal experimental
conditions these channels are not blocked by IbTX (100nM) or ChTX (1M).
In the brain BK channels have been distinguished on the basis of the effects of
Page 141
SECTION 5: BK CHANNEL IN OSTEOBLASTS SHOW NEURONAL-
TYPE FEATURES
110
PKA, and the sensitivity to these peptide scorpion toxins, ChTX and IbTX.
Hence, channels that are toxin-sensitive, and where PKA usually increases
activity, are referred to as type-I channels and in contrast channels that are
toxin-resistant and where PKA decreases the activity of the channel are known
as type-II channels (Reinhart et al., 1989,1991). Type II are found on nerve
terminals and are sensitive to the alkaloid tetrandrine (Wang et al., 1992) and it
has been proposed that co-assembly of the α subunit with a β4 subunit confers
properties similar to the type II (Meera et al., 2000; Lippiat et al., 2003) and
slows action potential repolarisation (Brenner et al., 2005).
In MG63 cells BK channel has been described variously as voltage-
independent, with differing sensitivities to the peptide scorpion toxin blockers,
ChTX and IbTX. Thus it has been reported to be both ChTX-sensitive (Moreau
et al., 2005), or insensitive to both IbTX and ChTX (Rezzonico et al., 2002). In
MG63 cells the BK channel is also reported as being insensitive to protein
kinase A (PKA) which may be diagnostic in elucidating which subtype is
present (Moreau et al., 1996). The gene for all 4 types of β subunits have been
identified in MG63 cells and human primary osteoblasts (HOB) and the
hypothesis tested here is that BK channels in MG63 or HoB cells would show
the features of an α and β1 subunit combination. These channels would be
sensitive to 17β-estrodiol and other estrogen receptor modulators. These
channels might also be insensitive to toxin peptides.
Page 142
SECTION 5: BK CHANNEL IN OSTEOBLASTS SHOW NEURONAL-
TYPE FEATURES
111
5.2 Materials and methods
5.2.1 Cell culture
Cells were cultured under the same conditions as described in Section 2. To
gain comparable results, cells were seeded on coverslips and were cultured for
no more than 3 days before they were patched.
5.2.2 Test compounds and the perfusion system
11 compounds in total were tested in these experiments. These compounds
were obtained and stored as described in Section 2. In each experiment, they
were defrosted from aliquots and diluted to appropriate concentrations with
NaCl Locke or High K solution according to the perfusion condition. All the
solutions were filtered through a 20 µm filter before use.
Two different perfusion systems were tested.
1. Continuous irrigation
As shown in Fig 5.1 NaCl Locke containing test compounds were applied
through a tube to the bath chamber. At the same time, another syringe
gently sucked away solution from the chamber gently. The added volume
and sucked volume were kept the same (typically 600 µl). In this way, it
was comparatively easy to control the test compound concentration.
However in practice, this method of drug application caused the seal of the
patch to become unstable to the extent that it was often lost relatively
rapidly (5/6, n=6).
Page 143
SECTION 5: BK CHANNEL IN OSTEOBLASTS SHOW NEURONAL-
TYPE FEATURES
112
2. “Drop” method
To avoid the poor recording rate achieved using the above method,
compounds were applied to the patch in one other way. In this case, 200 µl
NaCl Locke was add onto the top of the coverslip in the chamber. Then at
the appropriate time another 50 µl NaCl Locke containing a known
concentration of compound was added. The final concentration was
calculated as: .
The recordings were taken after about 1 minute to allow an equilibrium
concentration to be reached. This method had a minor effect on the stability of
patch seals (2 from 10 attempt obtained). It was thus the method used to apply
compounds to the patches in many of the experiments to be described.
Compounds were washed from the bath in the following way:
1. 220 µl bath solution was taken from the chamber by using a 1 ml syringe.
1
2
Fig 5.1 the supply solution
containing test compounds was
added to the recording chamber
by means of a syringe. The total
volume of exchanged solution is
600 µl which is 3 times the
volume on coverslip. The final
solution on the coverslip is
assumed to contain the same
concentration of compounds as in
syringe 1 (as the labelling
shows).
Page 144
SECTION 5: BK CHANNEL IN OSTEOBLASTS SHOW NEURONAL-
TYPE FEATURES
113
2. Another 220 µl fresh NaCl Locke was added.
Between tests of different concentrations of one compound there was one
wash. The compounds were tested in concentration steps from low to high.
The final wash repeated the above two steps twice. The reduced compound
concentration was 1/70 of test concentration.
5.2.3 Configuration of patch clamping
Different configurations of patch clamping were chosen according to the
binding sites of tested compounds. If the compound regulates BK channel from
the intracellular side, inside-out patches or cell-attached patches were used. If
the compound binds and is active from the external site then outside-out
patches were deployed.
Each patch was recorded from in the control condition (drug-free NaCl Locke)
at a range of patch potentials as control. Test compounds were tested over the
same range of potentials and finally recordings were made over the same
potentials after washout. Drugs were in contact with the cells for no more than
10 minutes and recordings made at each potential were typically 30 seconds.
Recordings were analysed with WinEDR. All data are expressed as the mean ±
SD.
Page 145
SECTION 5: BK CHANNEL IN OSTEOBLASTS SHOW NEURONAL-
TYPE FEATURES
114
5.3 Results
BK channel in either MG63 cells or primary human osteoblasts showed novel
responses to the regulators outlined above. Firstly, BK channel in these cells
was not highly sensitive to 17β-estradiol or other estrogen receptor regulators.
17β-estradiol (up to 30 µM) was applied to either outside-out (n=5) and inside-
out patches (n=3). There was no significant increase in channel activity in
patches in any either of these configurations. On the other hand, the BK
channel was regularly detected and the effects of other regulators on channel
activity is now described below. Ethanol has been shown to affect BK channel
activity (Davies et al., 2003) hence perhaps it, as vehicle, is masking any action
of estradiol. However, the cells were treated with 17β-estradiol for 48 hours
and then patched, BK channel open probability were increased (data not
shown).
5.3.1 TEA and the quaternary ammonium acids blocked BK channels in
MG63 and HOB cells
As mentioned previously, quaternary ammonium acids are a family of classic
potassium channel blockers that have been widely used as tools for
determining the localization of the activation gate and the properties of the pore
of several ion channels. In this study four compounds from the quaternary
ammonium acid family: TEA, TBuA, TPeA and THeA were tested in outside-
out patches at different concentrations and a marked difference in the affinity
Page 146
SECTION 5: BK CHANNEL IN OSTEOBLASTS SHOW NEURONAL-
TYPE FEATURES
115
to the BK channels was observed (Fig 5.2). TEA is the smallest molecule
among these four quaternary ammonium acids. From the results it could be
seen that both TEA and TBuA bind and unbind so rapidly to the channel that
with the standard level of filtering used here (Fc = 5 kHz, -3 dB, four pole
Bessel filter) it was not possible to detect faithfully the open and closed
sojourns of the channel. Consequently a ‘flickery’ blockade was observed (Fig
5.3). The current histograms generated from these data indicate that the unitary
current appeared to be smaller than the control value at the same patch
potential. Unitary currents with TEA or TBuA treatment were plotted against
compound concentration and the apparent reduction in unitary current was
concentration-dependent (see Fig 5.4). THeA blocked BK channel by reducing
channel open probability at the lowest concentrations tested (≤1 µM). Fig 5.5
shows typical raw data showing for THeA and TPeA in outside-out patches.
Both compounds blocked the BK channel in a reversible fashion. From the raw
data, the apparent unitary current and open probability (Po) were calculated
and plotted against the compound concentration (Fig 5.6 A-D). These plots
indicate that TEA and the other three quaternary ammonium acids blocked BK
channels with an affinity related to the number of carbons (C-number) in the
chain or the molecule size. Both TEA and TBuA affect the channel activity at a
millimolar level, causing about a 20% decrease of channel Po at 1 mM. TPeA
and THeA on the other hand affect the channel activity at a micromolar level,
TPeA causing 70% blockade at 10 M and THeA at an even lower
concentration (3 M) reducing the channel Po by 90%. The ED50 versus C-
Page 147
SECTION 5: BK CHANNEL IN OSTEOBLASTS SHOW NEURONAL-
TYPE FEATURES
116
number plot demonstrates a dramatic increase of affinity with the high C-
number (Fig 5.6 E).
5.3.2 BK channels in MG63 and HOB cells were more sensitive to
alkaloids than peptide toxins
The actions of alkaloids and peptide toxins were also tested in excised patches
from MG63 cells. Tetrandrine (5-30 µM, n = 8) always and IbTX (5-60 nM, n
= 5) sometimes (see below) blocked the BK channel (Fig 5.7 and Fig 5.8). The
degree of block by tetrandrine was 42% (n = 2), 80% (n = 2), 85% (n =2) and
100% (n = 2) at 5, 10, 20 and 30 µM respectively and showed little voltage-
dependence. The fractional inhibition by IbTX showed voltage-dependence
(over 0-50 mV) that inhibition was higher at 0 mV than at more positive
voltages. In five patches both blockers were tested sequentially and in this case
all were sensitive to tetrandrine but only 2 were sensitive to IbTX (90 nM) (see
Fig. 5.8). Furthermore, in this study 100 nM slotoxin showed no inhibition
effect on BK channel opening in MG63 cells (n=9, data not shown). BK
channels in MG63 cells were blocked by paxilline from the cytoplasmic side.
As shown in Fig 5.9 the open probability was reduced by 30% with 10 µM
paxilline at -60 mV (n=5). This effect could be washed out showing that the
binding of paxilline to BK channels was reversible (data not shown).
The pharmacology of the BK channel in human primary osteoblasts was also
examined in outside-out patches and was similar to that of the MG63 cells. The
BK channel was blocked by external TEA (300 µM see Fig 5.10) was always
Page 148
SECTION 5: BK CHANNEL IN OSTEOBLASTS SHOW NEURONAL-
TYPE FEATURES
117
sensitive to 10-60 µM tetrandrine (n=7) (Fig5.11) and was blocked by IbTX
(30-120 nM) in only some cases (3 of 6). Although not studied systematically,
the BK channel in the primary cells was less sensitive to IbTX than that of the
MG63 cells as shown in Fig. 5.12.
5.3.3 BK channel sensitivity to other regulators
One BK channel opener isopimaric acid was tested in outside-out patches. As
shown in Fig 5.13 it enhanced the channel significantly by increasing the
channel open probability by 34% at 10 uM (n=3) and a patch potential of 20
mV.
5.3.4 Summary
The principal findings in this section can be summarised as follows: BK
channels in MG63 and HOB cells have a novel pharmacology and they are
more like the phenotype in neurones than the ones in smooth muscles (Wang
and Lemos, 1992). BK channels in MG63 and HOB cells can be blocked by
quaternary ammonium acids, peptide toxins (IbTX) and alkaloids (tetrandrine
and paxilline) but show different affinity for these compounds. BK channels
were activated by the terpenoid opener, isopimaric acid.
Page 149
SECTION 5: BK CHANNEL IN OSTEOBLASTS SHOW NEURONAL-
TYPE FEATURES
118
5.4 Discussion
The novel pharmacological features of BK channels in MG63 and HOB cells
must relate to their complex construction. Unlike the BK channels in smooth
muscle or brain having single type of associate β subunit, BK channels in
MG63 and HOB cells express all 4 types of β subunits. Since every single
channel is composed of 4 β subunits there are 35 possibilities of the
combinations of α and β subunit. Hence, BK channels in MG63 and HOB cells
could potentially show extraordinary and mixed characteristics.
5.4.1 The β1 subunit and the BK channel sensitivity to estrogen
The β1 subunit of BK channels was detected by RT-PCR in both MG63 and
HOB cells. But the BK channels in these cells did nevertheless not show the
typical β1 subunit feature which is sensitivity to 17β-estradiol or other
oestrogen receptor modulators. This can be explained in principle by De Wet’s
discovery on BK channels (De Wet et al., 2006). They report that 17β-estradial
effects on the BK channel need at least three β1 subunits to be expressed out
of the four present in the native channel. When there is more than one type of β
subunit expressed the chances for four β1 subunits to be found in one channel
complex is extremely low (< 1/35). The conclusion here is that there were a
limited number of BK channels of that type present and hence there was little
prospect of finding a BK channel that was sensitive to 17β-estradiol.
Page 150
SECTION 5: BK CHANNEL IN OSTEOBLASTS SHOW NEURONAL-
TYPE FEATURES
119
5.4.2 BK channel sensitivity to peptide toxins and alkaloids
Peptide toxins from scorpion are widely used as specific BK channel blockers
in the research literature. The toxins have high affinity for the α subunit (Slo)
and they interact with this α subunit via a biomolecular reaction. The toxins
have a second biding site on the extracellular loop of the β subunit when BK
channels express as an assembled α+β complex (Garcia-Valdes et al., 2001).
Previous investigations revealed that β4 associated BK channels lose the
sensitivity to the toxins (Lippiat et al., 2002). In the experiments in this section
the BK channels in MG63 cells showed apparently low sensitivity to the
peptide toxins. Only 40% of the detected BK channels were blocked by IbTX
when the concentration was increased to 90 nM, while the IC50 of IbTX for the
α subunit is 33 nM (Lippiat et al., 2002). In addition, almost no BK channel
activity was blocked by 100 nM Slotoxin, (data not shown) which is extremely
selective for the α subunit. The low affinity of the peptide toxin indicates that
BK channels in MG63 and HOB cells have typical characteristics of α+β
complex, especially α+β4.
In contrast to the low affinity for the peptide toxins, BK channels in MG63 and
HOB cells have a high sensitivity to alkaloids such as tetrandrine and paxilline.
Tetrandrine is not only a blocker of BK channels but also blocks voltage-gated
Ca2+
channels and intracellular Ca2+
pumps. It is believed to induce effects on
cell proliferation and cytotoxicity (Wang, Lemos and Ladecola, 2004). It
blocks BK channels in neurohypophysial nerve endings (Wang and Lemos,
Page 151
SECTION 5: BK CHANNEL IN OSTEOBLASTS SHOW NEURONAL-
TYPE FEATURES
120
1995), vascular endothelial cells, pituitary tumor (GH3) cells (Wu et al., 2001)
and glial tumor cells (Ransom et al., 2002). Being different to the peptide
toxins, tetrandrine exerts stronger blocking effects on a BK channel that is
coexpressed with β subunit than hSlo alone (Dworetzky et al., 1996). The high
expression and high affinity of tetrandrine for BK channels in MG63 and HOB
cells indicate that the BK channel when modulated could play a key role in
these cells in proliferation, which will be discussed in Section 6.
5.4.3 BK channel react to the quaternary ammonium acids
TEA and other members of the quaternary ammonium acids are useful tools to
probe functionally the pore region of K+ channels. Armstrong and his
colleagues carried out the first elegant studies on the blockage of squid axon
K+ channels by intracellular QA. Based on these studies they proposed some
topological properties of K channel pores long before any relevant structural
information about ion channels was available (Armstrong and Binstock, 1965;
Armstrong, 1969 & 1971; Armstrong and Hille, 1972). In most previous
investigations on BK channel in other tissues only TEA was used as a
“generic” wide spectrum K+ channel blocker. The other members of QA such
as TBuA, TPeAa dn THeA effect on BK channels were seldom, if tested at all.
The results in this section showed that BK channels in MG63 cells have
affinity for the QA. TEA, TBuA blocked the BK channel at millimolar level
and TPeA and THeA at the micromolar level. These concentrations are all
much lower than the ones blocking potassium channels in squid giant axon
Page 152
SECTION 5: BK CHANNEL IN OSTEOBLASTS SHOW NEURONAL-
TYPE FEATURES
121
(Armstrong, 1972). This result indicated the higher affinity of BK channels to
QA. According to the model (Fig. 5.14) created by Armstrong (Armstrong,
1975) accounting for inactivation of IK of C9 QA, this result may implicate the
size of BK channel pore which is close to 8 Å.
Fig.5.14 “A model to account for inactivation of IK of C9. When the K
activation gate is closed, C9 is not likely to be in the pores; but when the gates
open, it may diffuse in at a rate dependent on its concentration in the
axoplasm. The apolar nine carbon chain of C9 binds to a hydrophobic group
in the pore mouth, stabilizing the ion in blocking position.” (this graph and
the description of the model were both taken from Armstrong ,1975)
Additionally, QA apparently reduced channel unitary current which is different
to the picture with other BK channel blockers. The question is whether these
and related compounds are potential therapeutic drugs For example, 4-
Aminopyridine (4-AP) which works as a relatively selective blocker of
members of the Kv1 (Shaker, KCNA) family of voltage-activated K+ channels
has been used clinically in Lambert-Eaton myasthenic syndrome and multiple
sclerosis as it blocks potassium channels, prolonging action potentials duration
Page 153
SECTION 5: BK CHANNEL IN OSTEOBLASTS SHOW NEURONAL-
TYPE FEATURES
122
hence supporting secure nerve conduction and thereby increasing
neurotransmitter release at the neuromuscular junction (Judge, 2006).
5.4.4 BK channels are activated by the opener isopimaric acid
Since BK channels in MG63 cells have high prevalence and activity the effect
of channel openers were harder to investigate. However, we were still able to
see the increase of channel open probability in some cases as shown above.
This indicates that the BK channels in MG63 cells are conventional in being
sensitive to isopimaric acid.
5.5 Conclusion
The systematic pharmacology studies on BK channels in MG63 and HOB cells
not only provides the support for the BK channel existence in these cells but
also indicates the possible functions of BK channel and further provides
pointers to how to develop potential therapeutic drugs.
Page 154
SECTION 5: BK CHANNEL IN OSTEOBLASTS SHOW NEURONAL-
TYPE FEATURES
(5-1)
Fig 5.2. TEA, TBuA , TPeA and THeA blocked BK channels with different
potencies. 0.3 mM TEA and 1 mM TBuA reduced channel open probability by
about 10%. 0.001 mM and 0.01 mM TPeA caused a 20% and 70% reduction in
Po respectively. THeA blocked BK channels at the lowest concentration of all
four compounds, causing a 70% and 90 % reduction at 0.001 mM and 0.003
mM respectively.
Rela
tiv
e P
O
Page 155
SECTION 5: BK CHANNEL IN OSTEOBLASTS SHOW NEURONAL-
TYPE FEATURES
(5-2)
Fig 5.3 Raw data showing outside-out patches at 20 mV patch potential in
asymmetric K (140/3). (A) External 0.3 mM and 1mM TEA caused
‘flickery’ block as well as an apparent decrease of Po. This was reversed on
washout. (B) Blockade of the BK channel by external TBuA. 300 M
TBuA also produced channel ‘flickery’ openings which were reversed on
washing.
20 mV
Im
10 pA
10 ms
Im
10 pA
10 ms
Im
10 pA
10 ms
Im
10 pA
10 ms
10 ms
CONTROL
1 mM TEA
WASH
10 pA
300 M TEA
CONTROL
300 M TBuA
WASH
Im
10 pA
10 ms
Im
10 pA
10 ms
Im
10 pA
10 ms
Im
10 pA
10 ms
A
B
Page 156
SECTION 5: BK CHANNEL IN OSTEOBLASTS SHOW NEURONAL-
TYPE FEATURES
(5-3)
0.0 0.2 0.4 0.6 0.8 1.0
1
2
3
4
5
6
7
8
9
10
0 mV
20 mV
SIN
GL
E C
HA
NN
EL C
UR
RE
NT
(p
A)
TEA (mM)
0.0 0.2 0.4 0.6 0.8 1.0
0
1
2
3
4
5
6
UN
ITA
RY
CU
RR
EN
T (
pA
)
TBuA (mM)
Fig 5.4 The BK channel unitary current appears to decrease as the
concentration of external TEA or TBuA was increased. TBuA induced
decrease of BK channel unitary current was comparable to that produced by
TEA over the same concentration range (at 0 mV).
0 mV
Page 157
SECTION 5: BK CHANNEL IN OSTEOBLASTS SHOW NEURONAL-
TYPE FEATURES
(5-4)
B
Fig 5.5 Typical data with external QA compounds in outside-out patches at
20 mV (A) TPeA reduced the BK channel open probability at 3 and 10 µM.
(B) THeA showed similar effects on the channel at 1 and 3 µM.
Im
10 pA
10 ms
Im
10 pA
10 ms
Im
10 pA
10 ms
Im
10 pA
10 ms
3 µM THeA
1 µM THeA
CONTROL
Im
10 pA
10 ms
Im
10 pA
10 ms
Im
10 pA
10 ms
Im
10 pA
10 ms
Im
10 pA
10 ms
CONTROL
3 M TPeA
10 µM TPeA
WASH
A
Page 158
SECTION 5: BK CHANNEL IN OSTEOBLASTS SHOW NEURONAL-
TYPE FEATURES
(5-5)
0 2 4 6 80
2000
4000
6000
"C" number
M
Fig 5.6 BK channel Po is reduced by TEA (A), TBuA (B), TPeA (C), THeA
(D). TBuA blocked BK channels decreasing the channel open probability. The
blockade at 1 mM was about 20%. TPeA decreased BK channel open
probability (Po) at 1, 3, and 10 M, in a concentration-dependent fashion. 10
M TPeA caused 70% decrease of Po compared to control. BK channels were
blocked by THeA at 0.5, 1, 3 M. 3M THeA decreased the channel open
probability by 90%. The median effective doses (ED50) decrease dramatically
with high carbons number (C- number) in the molecules (E).
A B
C D
0.0 0.2 0.4 0.6 0.8 1.0
0.5
0.6
0.7
0.8
0.9
1.0
Po
TBuA (mM)
0 200 400 600 800 1000
0.2
0.4
0.6
0.8
1.0
Po
TEA (M)
0 5 10 15 20
0.0
0.1
0.2
0.3
0.4
0.5
0.6
0.7
0.8
PO
TPeA (M)
0.0 0.5 1.0 1.5 2.0 2.5 3.0
0.0
0.2
0.4
0.6
0.8
1.0
Po
THeA (M)
E
Page 159
SECTION 5: BK CHANNEL IN OSTEOBLASTS SHOW NEURONAL-
TYPE FEATURES
(5-6)
Fig 5.7 (A) The effects of the blocker tetrandrine on BK channel activity in an
outside-out patch from an MG63 cell. The reversible block by 10 and 30 μM
is shown for a patch potential of 20 mV. (B) The fractional inhibition of BK
channels (calculated from the open probability values) by tetrandrine (5 - 30
μM) is shown for 0 and 50 mV patch potential in 2 outside-out patches. The
degree of block by tetrandrine was not dependent on the patch potential over
this range of values.
A
B
Page 160
SECTION 5: BK CHANNEL IN OSTEOBLASTS SHOW NEURONAL-
TYPE FEATURES
(5-7)
Fig 5.8 The effects of the scorpion toxin blocker IbTX on BK channel activity
in outside-out patches from MG63 cells A) The reversible effect of 10 and 30
nM IbTX is shown in a 1s stretch of current record obtained from a single
patch at +20 mV. B) The fractional inhibition of maxi channels (calculated
from the open probability values) by IbTX (10 – 40 nM) is shown for patch
potentials of 0, 20 and 50 mV in 3 outside-out patches. At concentrations
below 30 nM the block by IbTX was patch potential-dependent being greatest
at 0 mV at 10 nM.
Page 161
SECTION 5: BK CHANNEL IN OSTEOBLASTS SHOW NEURONAL-
TYPE FEATURES
(5-8)
Fig 5.9 (A) The blockade of the BK channel by 10 μM paxilline in an excised
inside-out patch from an MG63 cell at -60 mV (reverse physiological K
gradient). (B) The pooled data from 5 experiments in patches from MG63 cells
showing the mean decrease (30 %, P < 0.05) of open probability induced by 10
μM paxilline.
Page 162
SECTION 5: BK CHANNEL IN OSTEOBLASTS SHOW NEURONAL-
TYPE FEATURES
(5-9)
Fig 5.10 In an outside-out patch of human primary osteoblast at +20 mV 300
µM TEA blocked the BK channel showing both an apparent unitary current
and Po reduction. This effect was reversible by washing out TEA from the
outside of the patch.
Page 163
SECTION 5: BK CHANNEL IN OSTEOBLASTS SHOW NEURONAL-
TYPE FEATURES
(5-10)
Fig 5.11 A) The reversible effect of 10, 30 and 60 μM tetrandrine is shown on
a 1s stretch of current record from an outside-out patch.. The patch potential
was 40 mV. B) The fractional inhibition of BK channels (calculated from the
open probability values) by tetrandrine (10 – 60 μM) is shown at patch
potentials of 0, 20 and 40 mV. Data are means from 7 outside-out patches.
Page 164
SECTION 5: BK CHANNEL IN OSTEOBLASTS SHOW NEURONAL-
TYPE FEATURES
(5-11)
Fig 5.12 The reversible block by 30, 60 and 120 nM IbTX in an outside-out
patch at 40 mV is shown in (A). The fractional inhibition of BK channels by
IbTX (10 - 120 nM) calculated as a reduction in open probability value is
shown at 0, 20 and 40 mV patch potential in 3 outside-out patches in (B).
Page 165
SECTION 5: BK CHANNEL IN OSTEOBLASTS SHOW NEURONAL-
TYPE FEATURES
(5-12)
Fig 5.13 A) The activation of the BK channel by 10 μM isopimaric acid in an
excised outside-out patch from an MG63 cell at 20 mV patch potential. B) The
pooled data from 3 experiments in patches from MG63 cells showing the mean
increase (34%) of open probability induced by 10 μM isopimaric acid.
Page 166
SECTION 6: BK CHANNELS HAVE ROLES IN OSTEOBLAST CELL
FUNCTION
123
SECTION 6: BK CHANNELS HAVE ROLES IN
OSTEOBLAST CELL FUNCTION
6.1 Introduction
The most important function of osteoblasts in vivo is that they are able to
proliferate and differentiate to form mineralized bones. The functions are
correlated to various phenotypic makers such as high alkaline phosphatase
(ALP) activity and synthesizing collagenous and noncollagenous bone matrix
proteins including osteocalcin (Aubin and Liu et al., 1996). In earlier sections
it was reported that BK channels are expressed with high density in both
osteoblast-like cell lines (MG63 or SaOS2) and primary human osteoblasts.
The channels were characteristically sensitive to the quaternary ammonium
acids, and also peptide toxins and alkaloids. If the channels have important
functions in these cells then these functions should be regulated by these
channel modulators.
Page 167
SECTION 6: BK CHANNELS HAVE ROLES IN OSTEOBLAST CELL
FUNCTION
124
6.1.1 Osteoblasts in bone tissue
Firstly, we should ask what the functions of osteoblasts are and what is known
of modulation by K channel ligands. As indicated previously there are three
major types of bone cells. These are the osteoclast, the osteoblast and the
osteocyte. The principal characteristics of osteoblast cells have been described
in the Introduction to this Thesis (section 1) and they are recognised for their
high capacity for proliferation and differentiation. As stated previously the
latter process is modulated by the interleukins, insulin-derived growth factor,
platelet-derived growth factor and estrogen (Guevremont et al., 2003) but to
what extent other factors such as ion channel control impacts, is at present
unknown. Here we only focus on the possible role of the BK channel.
6.1.2 Potassium channels and bone cell proliferation and mineralisation
The important role of K+
channels in proliferation of cells of the immune
system and tumour cells (Arcangeli et al., 1995) was perhaps to be expected.
K+ channels are major contributor in controlling membrane potential. And
recently studies on tumour cell revealed that a transient hyperpolarization was
required for the progression of the early G1 phase of cell cycle (Wonderlin et
al., 1996). Thus blockade of K+ flux leading to depolarization,
should delay
proliferation by inhibition the transient hyperpolarization as described above.
Page 168
SECTION 6: BK CHANNELS HAVE ROLES IN OSTEOBLAST CELL
FUNCTION
125
The BK channel which has a large conductance will lead to a large amount of
K+ ion efflux during channel opening. Its impact is therefore greater than many
other K channel types. This type of channel is consequently an important
membrane potential regulator in the cells where it is expressed and is active. In
conclusion, we might anticipate to see modulators of BK channel modify
osteoblast cell growth and mineralisation in vitro.
6.2 Materials and methods
The contribution of BK channels to function in osteoblast-like cells was
investigated in cell growth assays. MG63 cells were maintained in culture in
the absence and presence of various BK channel modulators of differing
specificity including TEA, IbTX, tetrandrine, paxilline and isopimaric acid.
6.2.1 Cell culture in growth assays
All cells were seeded in 6-well plates for Haemocytometer counting and in 96-
well plates for the MTS assays. The protocol of performing these experiments
is described as follows:
1. Confluent MG63 cells in 25 cm2
flasks were trypsinised and counted.
2. Cells were suspended in complete DMEM medium at a concentration
of 30,000 cells/ml.
3. A 2 ml cell suspension was used in each well of the 6-well plates, a 100
µl cell suspension was used in each well of the 96-well plates and
Page 169
SECTION 6: BK CHANNELS HAVE ROLES IN OSTEOBLAST CELL
FUNCTION
126
another 100 µl complete medium was added to make up a final 200 µl
volume.
4. Cells in the plates were left at 37ºC, 5% CO2, 95% air overnight and
numbers then recorded as day 0.
5. Compounds to be tested were held in stock solutions in DMSO (filtered
through 0.2 µm PVDF syringe filter, Whatman) and kept at -20 ºC,
except TEA which was always dissolved in distilled water. Compounds
were diluted to proper final concentrations in the complete DMEM
medium.
6. Cells were checked that they were attached to the culture surface under
a microscope after an overnight in culture. Only when the cells were
completely attached, was the supernatant medium sucked out and
discarded. 200 µl of medium containing compounds was added to each
well.
7. If compounds were dissolved in DMSO then the same concentration of
DMSO as the test group was used as the blank control. Otherwise
complete DMEM medium was the blank control.
8. Cells were cultured at 37ºC, 5% CO2, 95% air for 96 hours before being
counted by either the Haemocytometer method or using the MTS assay.
6.2.2 Haemocytometer counting
After 96 hours in culture, cells were trypsinised and collected into a centrifuge
tube. Cells from different wells but in the same treated group were collected
Page 170
SECTION 6: BK CHANNELS HAVE ROLES IN OSTEOBLAST CELL
FUNCTION
127
into one tube. After centrifugation, cells were resuspended in 2 ml DMEM
medium. 50 μl cell suspensions were mixed with 50 μl 0.4 % Trypan blue dye.
A cleaned haemocytometer was covered tightly by a piece of coverslip and
care taken to ensure that the volume in a 1 mm2 counting area is 1 µl (see
section 2). 5 µl of cell solution in Trypan blue was added to each side of the
counting area. The unstained live cells were counted using a haemocytometer.
The relative cell number was determined as follows: the total cell count of each
experimental group / total cell count of control group. Each experiment was
repeated twice at different times and the final data were presented as the means
± SD.
6.2.3 MTS
The assays were performed by adding 20 μl of the MTS/PMS solution (20:1)
(CellTiter 96 AQueous One Solution Cell Proliferation Assay, Promega UK Ltd.,
UK) directly to each well, incubating for 1-2 hours then recording the
absorbance at 490 nm with a Tecan® ELISA 96-well plate reader. The
background absorbance was subtracted from the test absorbance values. Data
were expressed as relative cell number as described in section 2. Each
experiment was repeated 4 times. Data were presented as means ± SD (n=4).
6.2.4 Mineralization
Mineralisation staining
Page 171
SECTION 6: BK CHANNELS HAVE ROLES IN OSTEOBLAST CELL
FUNCTION
128
Because MG63 cells do not mineralise in culture, the mineralisation assays
were performed with SaOS2 cells. Cells were seeded into 6- or 12-well plates,
and maintained in culture until almost confluent. They were then treated with
culture medium containing L-ascorbic acid 2-phosphate (50 µg/ml), β-
glycerophosphate (2 mM) and dexamethasone (10-7
M), in the presence or
absence of TPeA (3 µM) and THeA (0.3 µM). The media were changed twice
weekly, and the cells were stained for calcium deposits within the mineralised
matrix 2 weeks after the assay started. Briefly, experiments were terminated by
fixing cell layers in formal saline for 15 minutes. Mineralised bone nodules
were visualised by staining with alizarin red (1% solution in water) for 5
minutes, rinsed with 50% ethanol to remove excess stain, then air-dried.
Protein estimation experiment
The cells were treated with 100% methanol and solubilised in 0.5 M sodium
hydroxide. Bio- Rad protein assay was used to determine total concentration of
solubilised protein in cell lysate samples. The dye binds to proteins giving
differential colour change in response to various concentrations of protein. The
relative protein concentration measurement can then be estimated by reading
absorbance measurements from a standard curve obtained.
6.2.5 Data analysis
Data on cell numbers were analysed by Excel and Origin7. Statistical
significance (p<0.05) was calculated by using one-way ANOVA as described
in section 2.
Page 172
SECTION 6: BK CHANNELS HAVE ROLES IN OSTEOBLAST CELL
FUNCTION
129
6.3 Results
In this study, BK channel blockers such as QAs, paxilline and tertrandrine
interestingly showed dual-effects on MG63 cell growth. They caused an
increase of MG63 cell numbers at low concentrations and a decrease of cell
numbers at high concentrations. In addition, QAs affected SaOS2 cells
mineralisation as cells cultured with the THeA and TPeA showed lower
Alizarin Red S staining and lower protein concentrations.
6.3.1 MTS assay
Firstly, a standard curve for the MTS assay was performed by estimating the
absorbance (OD) of different numbers of cells after 1, 2, and 3 hours
incubation with dye. Fig. 6.1 showed that after 1 hour incubation gave better
linear relation between OD and cell number than the other two incubation
condition. Hence, all the MTS assay data were collected after one hour of
incubation and using the cell numbers that fall in the linear range of the
standard curve to reduce error.
The effects of BK channel blockers on MG63 cell numbers after 96 hours were
then examined. Interestingly, both TEA and tetrandrine had a dual effect on
growth (Figs. 6.2 and 6.3), significantly increasing cell numbers (p<0.05) at
low concentrations (≤ 3 mM and 3 μM respectively), but decreasing cell
numbers at concentrations of ≥ 10 mM and 10 μM respectively (n=4) (p<0.05).
Page 173
SECTION 6: BK CHANNELS HAVE ROLES IN OSTEOBLAST CELL
FUNCTION
130
These stimulatory effects of TEA and tetrandrine occurred at concentrations of
these agents equivalent to those required to achieve BK channel blockade (see
e.g. inset in Fig. 6.2). Paxilline like the other modulators also showed this
trend, stimulating cell numbers at low concentration, and inhibiting at high
concentrations (n=2) (Fig. 6.3). TBuA, TPeA and THeA, three of the
quaternary ammonium acids, produced similar effects on MG63 cell growth.
TBuA produced an increase of MG63 cell number at a concentration ≤500 µM
(Fig. 6.4). TPeA produced a dramatic increase of MG63 cell numbers at the
concentration of 3 µM. And THeA produced an increase of MG63 cell
numbers at the concentration of 0.3 μM. However these increases were only
present over a very narrow concentration range, since the cell numbers dropped
down at 10 µM TPeA and 1 µM THeA respectively (Fig. 6.5 and Fig.6.6).
Neither IbTX (300 nM, n = 5) nor slotoxin (300 nM, n = 3) had any significant
effect on cell numbers (Fig. 6.7).
To test whether blockade of a BK channel was the principal mechanism by
which the stimulation was achieved, MG63 cells were grown in the presence of
TEA and a BK channel opener, isopimaric acid. Importantly, the increase in
cell numbers by TEA could be prevented by the BK channel opener, 50 μM
isopimaric acid. Meanwhile, 50 μM isopimaric acid showed no effect on
MG63 cell numbers in the same assay (Fig. 6.8).
Page 174
SECTION 6: BK CHANNELS HAVE ROLES IN OSTEOBLAST CELL
FUNCTION
131
6.3.2 Haemocytometer counting
MG63 cell numbers were increased at low concentrations and decreased at
high concentrations in the case of both TEA and tetrandrine in repeat
haemocytometer counting experiments (Fig. 6.9). The inhibition of the
stimulatory effect of TEA by isopimaric was also confirmed in repeat growth
assays (n=4).
We have also carried out viability measurements with Trypan blue using
blockers over a full range of concentrations. In summary, low concentrations of
blockers (TEA and tetrandrine) that increase cell numbers do not increase the
percentage of dead cells, whereas higher concentrations of blockers (i.e. 10-30
mM TEA and 10 µM tetrandrine) increase significantly the number of dead
cells. These was confirmed by checking cell morphology under a microscope
and pictures taken of representative cells are shown in Fig. 6.10.
6.3.3 Mineralisation
SaOS2 cells were cultured in the presence of 3 µM TPeA or 0.3 µM THeA for
2 weeks then were stained with Alizarin Red S. The amount of staining
indicated that both 3 µM TPeA and 0.3 µM THeA treated cells produced lower
mineralisation than control (Fig. 6.11). The protein concentrations from lysate
cells treated with THeA (0.3 µM) was lower than cells treated with TPeA (3
µM) and were both significantly lower than control (Fig. 6.12).
Page 175
SECTION 6: BK CHANNELS HAVE ROLES IN OSTEOBLAST CELL
FUNCTION
132
6.4 Discussion
Experiments in this section investigated the possible function of BK channels
in the growth of osteoblasts and osteoblasts-like cells. A range of BK channel
modulators were used to treat cells in culture followed by the measurement of
cell number and cell viability. The results indicated a possible role in
determining growth for BK channels in osteoblasts.
In summary, in the growth assays the BK blockers QAs and tetrandrine caused
cell numbers to increase at low, and to decrease, at higher concentrations. The
stimulatory effect of TEA was shown to be blocked by the BK channel opener
isopimaric acid. The compelling conclusion is that TEA stimulates MG63 cell
growth by modulating BK channels in these cells. Importantly, these
quaternary ammonium acids (3 µM TPeA and 0.3 µM THeA) also decreased
the SaOS2 cell mineralisation in culture.
6.4.1 Peptide toxins showed no effects on MG63 cells growth
Cell growth assays on MG63 cells with IbTX were described above and
showed little effect of the toxin. Indeed such experiments have been conducted
by three different investigators in this laboratory and all results proved
negative, unlike what was found previously by other investigators using glioma
cells (Ransom et al., 2000 and Weaver et al., 2006). However, this is in
keeping with the fact that peptide toxins showed low affinity for the BK
Page 176
SECTION 6: BK CHANNELS HAVE ROLES IN OSTEOBLAST CELL
FUNCTION
133
channels in MG63 cells as described in Section 5. In cell growth assays, IbTX
and slotoxin showed almost no effect on MG63 cell growth suggesting no
obvious link between one class of BK channel (type I) and cell growth. On the
other hand, in the pharmacological characterisation of BK channels described
above in MG63 cells these channels were more sensitive to alkaloids and TEA
than the toxins. Correspondingly, both TEA and tetrandrine showed obvious
and interesting effects on MG63 cell growth.
6.4.2 TEA and other quaternary ammonium acids
Results from Section 5 revealed that TEA and other 3 QAs (TBuA, TPeA and
THeA) blocked BK channels in MG63 cells at different concentrations. In
short the longer the chain length, the greater the potency of blocker. These
compounds also regulate MG63 cell growth as described in this section with
the longer chain blockers being more potent. Although TEA has been reported
to down-regulate cell growth in human gliomas (Weaver et al., 2004) no
effects of other QAs in the literature have been reported before. The work
reported here revealed these QAs (TEA, TBuA and TPeA) cause a cell number
increase at apparently low concentrations, while decreasing at high
concentrations. The compounds at high concentrations caused cell death as the
dead cell numbers clearly increased in the haemocytometer counting
experiments. TPeA showed a very narrow window between the concentrations
causing a cell number increase (3 µM) and a decrease (≥ 10 µM).
Page 177
SECTION 6: BK CHANNELS HAVE ROLES IN OSTEOBLAST CELL
FUNCTION
134
TPeA and THeA caused a decrease of SaOS2 cell mineralisation at the
concentrations (3 and
0.3 µM, respectively)
that cause an increase of
cell growth. According
to Steinand and Lian
(1993) (see graph on the
right), there are three
distinct development
periods of osteoblasts,
including: proliferation, ECM maturation and mineralisation (illustrated in the
diagram shown on the right). They also pointed out that cell proliferation and
mineralisation are associated with different genes. The genes related to cell
cycle are down regulated at the end of proliferation period meanwhile the
genes relating to ECM maturation and differentiation are up regulated. When
the cells were stimulated for growth, in this stage the differentiation associated
genes might be inhibited.
6.4.3 Alkaloids increase and decrease MG63 cell numbers
The key question here is why this alkaloid has a dual effect on cell numbers
depending on the concentration tested. Could the increase in cell number be
due to the reduced apoptosis which would follow any reduction of K efflux?
(see Burg et al. 2006). Does this then dominate at low concentrations of
Page 178
SECTION 6: BK CHANNELS HAVE ROLES IN OSTEOBLAST CELL
FUNCTION
135
tetrandrine? As for the effects of higher concentrations, tetrandrine has
previously been reported as a potential inhibitor of tumour cell proliferation
(Wang et al., 2004). There are two possible tetrandrine-targeted signalling
pathways where putative anti-cancer effects have been described. One is that
the BK channel blockage leads to the depolarization of cell membrane which
could activate P53 and P21 expression. P21 is a key inhibitor of cyclin D-
cyclin-dependent kinases (CDK) complex and the phosphorylation of its target
triggers cell proliferation. Hence P21 expression will inhibit cell proliferation.
In addition, P53 may trigger cell apoptosis. Perhaps this is the dominant
process at higher concentrations. In the cell growth assays with MG63 cells
dual effects were observed: cell number increasing with lower than 3 µM
tetrandrine and declining with high tetrandrine (≥ 10µM) in culture. This result
would indicate that tetrandrine at low concentrations regulates cell growth
through different mechanisms in tumour and osteoblast-like cells.
6.4.4 Experimental design
The MTS assay is a convenient way to investigate any changes of cell number
but it is not able to distinguish between modified proliferation or altered
apoptosis. The cell viability assay and consideration of the morphology of the
cells would help. Hence, viability assays were carried out and cells were
photographed under a microscope as described in Fig. 6.10. MG63 cell
numbers in the experiments with 10 and 30 mM TEA decreased within 4 days
incubation and dead cell number increased as shown in the pictures. These
Page 179
SECTION 6: BK CHANNELS HAVE ROLES IN OSTEOBLAST CELL
FUNCTION
136
results together indicate that 10 mM TEA or higher is toxic to MG63 cells and
causes cell death. But from these experiments it is not possible to determine
whether the cell death is caused by apoptosis or necrosis. Further experiments
could be carried out to find out the underlying reasons for the changes in cell
number. For example, the cells could be labelled with carboxyfluorescein
diacetate succinimidyl ester (CFSE, Invitrogen). After culturing with BK
channel modulators, cells would need to be run through flow cytometry to
identify both the proliferated and dead populations.
Page 180
SECTION 6: BK CHANNELS HAVE ROLES IN OSTEOBLAST CELL
FUNCTION
(6-1)
0 50 100 150 200 2500
1
2
3
4
1 hour incubation
2 hours incubation
3 hours incubation
cell number (x1000)
OD
Fig 6.1 Standard curve of MG63 cells absorbance at 490 nm versus cell
number. The absorbance was obtained after incubation of MG63 cells with
CellTiter96®AQueous for 1, 2 and 3 hours. And after 1 hour incubation, the
absorbance showed better linear relation with cell numbers than the other two
incubation time.
Page 181
SECTION 6: BK CHANNELS HAVE ROLES IN OSTEOBLAST CELL
FUNCTION
(6-2)
0 5 10 15 20 25 30 350.0
0.2
0.4
0.6
0.8
1.0
1.2
1.4
TEA (mM)
RE
LA
TIV
E C
ELL N
UM
BE
R
Im
10 pA
20 ms
Im
10 pA
20 ms
control
3mM
Im
10 pA
20 ms
Fig 6.2 The relationship between MG63 cell numbers and TEA concentration
(1-30 mM) determined by the MTS assay. The points are the means of 4
determinations after 4 days. There is a significant (P<0.05) increase and
decrease in cell numbers at low and high concentrations of TEA respectively.
The inset shows the effect of 3 mM external TEA on BK channel activity in an
excised outside-out patch.
Page 182
SECTION 6: BK CHANNELS HAVE ROLES IN OSTEOBLAST CELL
FUNCTION
(6-3)
Fig 6.3 The relationship between MG63 cell numbers and tetrandrine
concentration (300 nM to 30 μM) and paxilline (300 nM to 30 μM). The
tetrandrine data are the means of 4 determinations after 4 days. There is a
significant (P<0.05) increase and decrease in cell numbers at low and high
concentrations of tetrandrine. Paxilline regulated MG63 cell number in a
similar manner to tetrandrine. It also produced a significant increase at 300 nM
from the pooled data from 2 experiments.
Page 183
SECTION 6: BK CHANNELS HAVE ROLES IN OSTEOBLAST CELL
FUNCTION
(6-4)
Fig 6.4 The relationship between MG63 cell number and concentration of
TBuA determined by MTS assay. There were significant increases in relative
cell number with TBuA ≤ 500 µM and a decrease at 1 mM.
0 50 100 150 200 250 300
0.0
0.2
0.4
0.6
0.8
1.0
1.2
1.4
*
*
*
*
RE
LA
TIV
E C
EL
L
NU
MB
ER
TPeA (
*
Fig 6.5 The changes in relative cell numbers with TPeA treatment determined
by MTS assay. There is a significant increase at 3 µM, and cell numbers
decreased at 10, 30, 100 and 300 µM. The insert is the amplification of the cell
number at 3 µM TPeA.
Page 184
SECTION 6: BK CHANNELS HAVE ROLES IN OSTEOBLAST CELL
FUNCTION
(6-5)
Fig 6.6 The changes in relative cell number with THeA treatment determined
by MTS assay. There is a significant increase at 0.3µM, but cell numbers
decreased at 1, 3, 10 and 30 µM.
0 50 100 150 200 250 3000.2
0.4
0.6
0.8
1.0
1.2
RE
LA
TIV
E C
EL
L N
UM
BE
R
DRUG(nM)
IbTX
Slotoxin
Fig 6.7 The relationship between MG63 cell numbers and IbTX (1-300 nM)
and Slotoxin (1-300 nM) determined by the MTS assay. In the case of IbTX
the points are the means of 5 determinations and 3 in the case of Slotoxin after
4 days. There is no significant difference in cell numbers over the whole
concentration range for either blocker.
Page 185
SECTION 6: BK CHANNELS HAVE ROLES IN OSTEOBLAST CELL
FUNCTION
(6-6)
Fig 6.8 The effects of both TEA and isopimaric acid either alone or in
combination, on MG63 cell numbers after 4 days. TEA alone increased
significantly (p < 0.05, n =3) cell numbers. Isopimaric acid alone (50 μM) did
not affect cell numbers but blocked the effects of TEA.
Page 186
SECTION 6: BK CHANNELS HAVE ROLES IN OSTEOBLAST CELL
FUNCTION
(6-7)
TEA
0
0.2
0.4
0.6
0.8
1
1.2
1.4
0 10 20 30TEA Conc. (mM)
rela
tive
ce
ll n
um
be
r
day1
day2
day3
day4
Tetrandrine
0
0.5
1
1.5
2
2.5
3
0 2 4 6 8 10 12
tetrandrine conc. (uM)
rela
tive c
ell n
um
ber
Fig 6.9 Haemocytometer counting confirmed the concentration and time-
dependent biphasic effect of both blockers TEA and concentration-dependence
of tetrandrine as indicated using the MTS assay. For example, 3mM TEA
stimulated MG63 cell growth as the cell number increased (depending on
culture days) while 10 and 30 mM TEA seemed to cause cell death rather than
just inhibiting cell growth, sinceon day 3 and day 4 the relative cells numbers
were close to 0.
Page 187
SECTION 6: BK CHANNELS HAVE ROLES IN OSTEOBLAST CELL
FUNCTION
(6-8)
(continued)
Page 188
SECTION 6: BK CHANNELS HAVE ROLES IN OSTEOBLAST CELL
FUNCTION
(6-8)
(continued)
Page 189
SECTION 6: BK CHANNELS HAVE ROLES IN OSTEOBLAST CELL
FUNCTION
(6-8)
(continued)
Page 190
SECTION 6: BK CHANNELS HAVE ROLES IN OSTEOBLAST CELL
FUNCTION
(6-8)
(continued)
Page 191
SECTION 6: BK CHANNELS HAVE ROLES IN OSTEOBLAST CELL
FUNCTION
(6-8)
Fig. 6.10 MG63 cell growth with TEA in culture medium were evaluated
microscopically. Pictures of cells cultured with 1, 3, 10 and 30 mM TEA at day
0.5, 1, 2, 3 and 4. All images were taken at x200.
Page 192
SECTION 6: BK CHANNELS HAVE ROLES IN OSTEOBLAST CELL
FUNCTION
(6-9)
Fig. 6.11 Pictures showing the Alizarin Red S staining of SaOS2 cells after 2
weeks culture with 3 µM TPeA, 0.3 µM THeA and DMEM. Both 3 µM TPeA
and 0.3 µM THeA showed weaker staining than DMEM control which
indicates a decrease of cell mineralisation.
contr
ol
M T
PeA
3M
THeA
0.3
0
20
40
60
80
100
Re
lati
ve
pro
tein
co
nc
en
tra
tio
n
Fig. 6.12 Comparison of the relative protein concentrations of 3 µM TPeA or
0.3 µM THeA treated cells to DMEM control. After 2 weeks in culture 3 µM
TPeA or 0.3 µM THeA decreased the protein concentration in SaOS2 cells
significantly with P=0.03 and P=0.003, respectively.
Page 193
SECTION 7: DISCUSSION
137
SECTION 7: DISCUSSION
7.1 Summary
Data from this project systematically characterized the BK channels in human
osteoblast and osteoblast-like cells. The principal findings in this project can be
summarised as follows:
BK channel was observed with high prevalence and activity in all these
following cell types: primary osteoblasts, primary bone marrow cells,
osteoblast-like cells, osteocyte-like cells and BK channel DNA
transfected HEK293 cells. RT-PCR results show that the message for
the BK channel α subunit (KCNMA1) and all the β subunits
(KCNMB1-4) in MG63 cells and human primary osteoblasts is present.
This type of potassium channel, whose PK/PNa estimated in excised
inside-out patches in asymmetric K is 15/1, is voltage-dependent and
has a mean conductance of over 200 pS in symmetrical 140 K. The BK
channels in human primary osteoblast and osteoblast-like MG63 cells
showed high activity with an open probability (Po) > 0.7 over a range
of potentials from inside-out patches.
Page 194
SECTION 7: DISCUSSION
138
BK channels in human osteoblasts and osteoblast-like cells showed
apparently higher affinity to the alkaloid acid (tetrandrine) than to
peptide toxins (IbTX).
Importantly the BK channel was functional since BK channel blockers
such as QAs and tetrandrine modulated osteoblast and osteoblast-like
cell proliferation and mineralisation. Consistent with the view that the
BK channel is the target, TEA effects on cell proliferation were
inhibited by the BK channel opener, isopimaric acid. In addition both
THeA and TPeA had an effect on osteoblast differentiation, decreasing
SaOS2 cell mineralisation capacity in vitro.
7.2 BK channels in osteoblasts may have novel characteristics
It could be argued that features of the BK channel in osteoblasts are novel in
some respects. For example the channel is potentially comprised of β1 subunits
yet lacks the required sensitivity to estrogens which one might hope for. The
published data suggest variable effects of oestrogen on post-menopausal
women. These results indicate the existence of complex estradiol-signaling
mechanisms, mediated by plasma membrane proteins (i.e. non-genomic) rather
than the classic intracellular receptor. The bone cell membrane BK channel is
one such potential target for oestrogen. Both oestrogen and Tamoxifen, a
partial agonist of the estradiol receptor, have been shown to activate BK
channels in both heterologous expression systems and smooth muscle cells,
resulting in greater repolarizing current (Wellman et al., 1996; Darkow et al.,
Page 195
SECTION 7: DISCUSSION
139
1997). Interestingly, Valverde et al. (Valverde et al., 1998) showed that
activation of BK channels by 17ß-estradiol occurs when the channel is
associated with its accessory ß1 subunit. This observation has led to the
intriguing hypothesis that ß1 subunit directly binds estradiol and enhances
channel activity by an unidentified mechanism. However, 2-Methoxyestradiol,
an endogenous and active metabolite of 17β-estradiol, inhibits the BK channel
in cultured vascular endothelial cells (Chiang et al., 2000). In 2003 Korovkina
reported that exposure to 17ß-estradiol induced both a decrease in BK channel
current and a down regulation of channel protein expression in heterologous
systems (HEK293 cells). The presence of the ß1 subunit did not alter channel
expression, and its expression was inhibited by estradiol. The mechanism the
investigation implicated was that estradiol induced proteasomal degradation of
the channel after direct binding of oestrogen to the BK channel. This down-
regulation can be elicited independently of classical nuclear estradiol receptors
or the accessory ß1 subunit, but in the presence of ß1 subunits specific binding
of estradiol to BK channels is increased significantly. In the experiments
reported in chapter 5, acute 17β-estradiol exposure did not alter the open
current of BK channel and even decreased the Po in these experiments. If
however the cells were treated with 17β-estradiol for 48 hours (data not shown)
and then patched, the channels were activated. The open probability was
increased in two experiments. It may be that 17β-estradiol modulated BK
channel through other messengers or by binding to the channel β1-subunit
although the slow development of the activation would then need to be
explained. The β1 subunit of BK channels was detected by RT-PCR in both
Page 196
SECTION 7: DISCUSSION
140
MG63 cells and primary osteoblasts. But the BK channels in these cells do not
show the typical β1 subunit feature, that is the requisite sensitivity to 17β-
estradiol or other oestrogen receptor modulators. This could be partly
explained by De Wet’s discovery on BK channels (De Wet et al 2006). These
authors report that the BK channel’s sensitivity to 17β-estradiol needs at least 3
β1 subunits to be expressed in one native channel. When there is more than one
type of possible β subunit (i.e.4) the chance for all 4 β1 subunits to be present
in one channel is extremely low (< 1/35). Perhaps for this reason alone, acute
application of 17β-estradiol did not cause a simple up- or down- regulation of
BK channel activity.
The voltage-dependence of activation and the pharmacology of the BK channel
can provide clues to the BK channel subunit composition. The characteristics
the BK channel showed in the voltage-dependence of activation suggested a
channel comprised of subunits β1 / β4 + α. However, the pharmacological
results do not support this exactly. The presence of a β4 subunit normally
confers insensitivity to IbTX. The novel feature here is that the osteoblast BK
channel can always be blocked by tetrandrine but in some cases it can be
blocked by both IbTX and tetrandrine. The pharmacology is only partially
diagnostic of the subunit composition and more characterisation of the channel
and quantitative PCR will provide further clues to the precise make up of the
native channel. On the other hand, by analysing wild-type and BK-deficient
(BK-/-
) mice using in vitro and in vivo assays, the different functional
Page 197
SECTION 7: DISCUSSION
141
characteristics of these β subunits have been to some extent defined. (Sausbier
et al., 2005; Prossmann et al., 2009).
7.3 BK channel modulators and MG63 cell growth
Osteoblasts are dynamic cells undergoing proliferation and secretion and are
also also targets of various regulators. These regulators could work through
receptors on the membrane, or regulate cell function through other membrane
proteins such as ion channels. The extent to which they work on the BK
channel depends on its precise characteristics. It appears from this project, that
the single channel conductance of the BK channel and its dependence on
external K+ is similar to other tissues. We believe that it is unamibiguously the
BK channel despite reservations that have just been published in 2011 (see
Sausbier et al. 2011). The ionic selectivity as determined in an excised patch is
perhaps lower than has been previously reported however (Wann and Richards,
1994; Chapman et al. 2007). Although the BK channel subunits were
identified, the relative amount of each subunit and the subunit composition of
naïve channel were not determined. As indicated above the voltage-dependence
of activation and the pharmacology of the BK channel can however provide
clues to the subunit composition. The position of the activation on the voltage
axis is suggestive of a channel comprised of subunits β1 / β4 +α (Lippiat et al.
2003; Chapman et al. 2007) which coincides partly with the recent the data of
Hirukawa et al. (Hirukawa et al., 2008) showing that the principal β subunits of
BK channels expressed in primary human osteoblasts derived from ulnar
Page 198
SECTION 7: DISCUSSION
142
periosteum were β3 and β4. This conclusion would however be at odds with
the pharmacological picture in these cells. The presence of a β4 subunit
normally confers resistance to IbTX (Meera et al. 2000). The novel feature
here is that the osteoblast BK channel can in some cases be blocked by both the
peptide toxin IbTX and the alkaloid tetrandrine.
In this study, quaternary ammonium acids seem to have a high impact on
modulating the BK channels in osteoblasts and osteoblast-like cells. BK
channels in patch-clamp were completely blocked by 3 mM TEA and at this
concentration TEA caused a significant increase of MG63 cell growth. Other
concentrations over 3 mM such as 10 and 30 mM TEA decreased the MG63
cell growth. This might suggest that TEA concentrations above 3 mM affect
MG63 cell growth but this is not related to BK channels. On the other hand,
these conflicting concentrations may be due to the experiments’ sensitivity and
condition. In the patch-clamp studies we were examining the effect of an acute
exposure (tens of seconds - 1 minute) to the blocker on channel activity in
excised patches (cell-free without intracellular machinery) at room temperature
of 20-25° C, whereas the effects on whole cell growth were carried out in
populations of cells over 96 hours at 37° C. The dual effect of TEA and
tetrandrine in the growth assays is however interesting, although at present
difficult to explain. That the cell increase caused by TEA could be inhibited by
isopimaric acid is compelling evidence that the BK channel plays a key role in
this case. One obvious question is whether the decrease in cell number at
higher concentrations is also sensitive to isopimaric acid. Our mineralization
Page 199
SECTION 7: DISCUSSION
143
data with SaOS2 cells show that K channel blockade by quaternary ammonium
acids have a negative impact on this process. These data are perhaps to be
expected, given that the concentrations tested increased cell number and this
may be achieved by a reduction in differentiation as described previously
(section 6.4.2). It is interesting to note that such arguments cannot be easily
invoked to explain the action of TEA on mineralisation in human primary
osteoblasts which we have described (Henney et al., 2009).
Cell number is clearly an output of both proliferative capacity and apoptosis.
Regulation of cell number could be related to changes in both, or either,
proliferation and apoptosis. In this study, the changes of cell numbers at low
and higher concentrations of BK channel blockers could be in principle due to
the fact that the effects of the blockers on either proliferation or apoptosis is
dominant at a particular concentration. Hence at low concentrations modulators
augment proliferation predominantly, and high concentrations they enhance
apoptotic process. Previous studies have demonstrated the links between
activation of K+ channels to both proliferation and apoptosis (Burg et al.,
2006). The contribution of the BK channel to apoptosis could readily be tested
in future work. Our results with low concentrations of blockers may due to that
BK channel blockade stimulates MG63 cell growth by decreasing apoptosis. In
addition, there are a number of reports which link membrane potential to
progression through the cell cycle. The current view is that the antiproliferative
effect in many cells of agents like K+ channel blockers stems from the
depolarisation they produce (Chandy et al., 2004). Such depolarisation would
Page 200
SECTION 7: DISCUSSION
144
occur with these blockers in the cells that the BK channel makes a significant
contribution to the resting membrane potential. Nevertheless, significantly,
blockade of K+ channels also reduces apoptosis perhaps by increasing cell
volume, and in contrast activation of K+ channels increases apoptosis
presumably through enhanced K+
efflux and in turn reduced cell volume.
Blockers like TEA and tetrandrine increase cell numbers in proliferation assay.
This may indicate that the overriding effect at these concentrations is to reduce
apoptosis. But one caveat is that neither QA nor tetrandrine are specific BK
channel blockers. For example tetrandrine blocks L-type Ca channels in
smooth muscle cells (e.g. Wu et al. 1997) and this may contribute to tetradrine-
induced reduction in growth or enhanced apoptosis in the cells studied here.
However, we have shown that the L-type Ca channel blocker dihydropyridine
nifedipine or R/L/PQ or T-type Ca channel blockers such as the toxins SNX-
482, FS-2, ω-agatoxin and kurtotoxin) have no effect on MG63 cell growth
(unpublished observations). The second conclusion is that the IbTX-insensitive
subtype of BK channel modulates growth of these cells be IbTX itself had no
effect over a wide concentration range. Whether this BK channel is equivalent
to the neuronal type of BK channel remains to be investigated further.
Does this mean that depolarisation occurs with these blockers? That would
only occur if the BK channel makes a significant contribution to the resting
membrane potential. As indicated above membrane potential has been linked to
progression through the cell cycle. If the antiproliferative effect in many cells
of K+ channel blockers arises from the depolarisation the produce (Chandy et
Page 201
SECTION 7: DISCUSSION
145
al. 2004; Kunzelmann, 2005), then channel blockers that affect cell growth by
regulation of the BK channel might be a useful future strategy to adopt. The
prospects are particularly encouraging here as there are a number of ligands
specific for BK channels (Imaizumi et al. 2002; Wu, 2003) and drug design
strategies where K+ channels are targets are already well developed.
7.4 Techniques and experiment design
Investigations of cell membrane ion channels typically use many scientific
techniques including electrophysiology “patch clamp”, RT-PCR,
pharmacology, western-blotting and immunohistochemistry. In this project,
target cells were patched for channel survey. Once the high prevalence and
activity K channel was observed, RT-PCR was used to confirm the putative
channel type and the RNA message for constituent subunits. Meanwhile,
electrophysiology and pharmacological properties were investigated by patch-
clamp along with functional assays on target cells. All these methods have their
respective advantages and disadvantages so that the hope is that the
combination of these techniques help us better firm up our conclusions.
7.4.1 Cell culture
Both osteoblast and osteoblast-like cells are adherent cells in culture providing
stability, and to obtain comparable results only isolated single adherent cells
were chosen. MG63 cells in culture displayed a rapid increase in cell density in
Page 202
SECTION 7: DISCUSSION
146
the centre of the culture surface and after 3 days cells were too confluent to be
patched. This is the reason that all patch clamp work was carried out on freshly
seeded cells within 3 days.
On the other hand, mouse primary bone cells did not grow easily. It took over 2
weeks for the cells to grow out from the bone fragments, and only after 6
weeks were cells confluent in the culture flask. Transfering these cells on to
cover slip caused the loss of over than 50% of cell. Some cells died after they
were trypsinised and typically more than 30% cells did not attach to the culture
surface of the coverslip 24 hours after seeding. To achieve a higher percentage
of surviving cells, pieces of bone fragments were cultured on cover slips. After
4 weeks culture, few cells were growing out from bone. There was hardly any
further growth after 6 weeks. These cover-slips were kept in 6 well plates
rather than in a culture flask. Medium was changed twice a week with half of
the well volume to avoid the floating of the cover-slip. With this procedure
there was still not much improvement in the viable cell number. The low
achievable cell number actually limited the work on mouse primary bone cells.
7.4.2 Patch successful rate and seal formation
To gain repeatable results, a high success rate in achieving seals is the key
factor. This success depends on the cell’s condition, the operator and the
experimental environment. First of all, fibroblastic shaped cells were chosen.
On a typical cell culture cover slip, round and oval shaped MG63 cells were
evenly distributed along with the fibroblastic shaped cells. But for some reason
Page 203
SECTION 7: DISCUSSION
147
“giga seals” were hard to obtain on these round cells. These cells did not
appear to be unhealthy cells (e.g. very granular). It may be that the MG63 cells
become rounded or elliptical as they are preparing to divide and perhaps this
renders them unsuitable in some way for patch clamping. Since the majority of
the cells were fibroblastic shaped, the lack of data from round and elliptical
cells was inconvenient but acceptable. In typical experiment, the presence of
BK channel modulators in the pipette was found to reduce the success rate.
This was found with both blockers and openers. If the openers’ binding sites
were on the external domain they could active BK channel causing K efflux
and changes of the membrane potential. Could this unstable membrane
potential cause the low success rate of attaining “giga seals”? Conversely,
blockers binding to external domains of the BK channel blocked BK channels
in the patch. So, even when there were giga seals, the channel presence was
hard to determine. For these reasons, all drugs were applied after successful
seals were achieved as described in Section 5.
7.4.3 Cell growth assays
In this project, MTS assays and cell viability assay (trypan blue staining) were
used to measures the effects of BK channels modulators on primary human
osteoblasts and MG63 cells growth. In the MTS assay we have a convenient
way to investigate any changes of cells number, but it does not reveal the real
underlying cause. Are cells killed, is proliferation affected or is apoptosis
Page 204
SECTION 7: DISCUSSION
148
modified or a combination of these? The cell viability assays helped in a small
way to answer these questions.
7.5 Future work
Due to the time constraints of this project only a hint of the possible role of the
BK channels in osteoblast function has been gleaned. Further investigations to
be carried out should attempt to answer the following important questions.
7.5.1 The composition of BK channel subunits in osteoblast
In this project, RT-PCR indicated that all of the β subunits are expressed in
these cells (KCNMB1-4), but the relative amount of each is unknown, and at
present the precise subunit composition of the native channel is uncertain. It
has been shown that the β1-subunit increased the apparent Ca2+ sensitivity by
increasing open probability and shifting half-activation voltages to significantly
more negative potentials (McManus et al., 1995; Knaus et al., 1994;
Dworetzky et al., 1996; Cox and Aldrich, 2000; Nimigean and Magleby, 1999).
To define the native subunit composition q-PCR, Western-blot and
fluorescence micrograph are potential analytical techniques to be utilised in the
future. Firstly, q-PCR monitors the fluorescence emitted during reactions as an
indicator of amplicon production at each PCR cycle (in real time) as opposed
to the endpoint detection. In compare to RT-PCR it has the advantages: 1) it is
not influenced by non-specific amplification. 2) amplification can be monitored
Page 205
SECTION 7: DISCUSSION
149
real-time. 3) no post-PCR processing of products (high throughput, low
contamination risk). 4) detection is capable down to a 2-fold change. 5)
confirmation of specific amplification by melting point analysis. 6) it is most
specific, sensitive and reproducible. Clearly q-PCR results will provide the
information on the ratio of all native BK channel subunits in osteoblast. Based
on this, west-blotting and fluorescence could indicate the subunit composition
and also the location of these subunits. In some case BK channel have been
shown to co-express with subtypes of Ca2+
channel. Hence the BK channels
isolated from rat brain are assembled into macromolecular complexes with the
voltage-gated calcium channels Cav1.2 (L-type), Cav2.1 (P/Q-type), and
Cav2.2 (N-type). Heterologously expressed BK-Cav complexes then
essentially reconstitute a functional “Ca2+
nanodomain” and Ca2+
influx
through the Ca2+
channel would activate BK in the physiological voltage range
with rapid kinetics. The BK-Cav channel complexes have been considered to
represent a molecular unit producing an effective and precisely timed
hyperpolarization of the membrane potential in response to local Ca2+
influx
(Berkefeld et al., 2006). Perhaps this kind of unit is only relevant to fast
switching of events, in cells such as neurones.
Voltage-gated Ca2+
channel subunits have been identified in osteoblast by
previous work (Barry, 2000). Hence the BK channels in osteoblasts membranes
have the opportunity to form complexes with voltage-gated calcium channels.
The question is what advantage does that provide in the context of bone cell
function? In addition to immunohistochemistry, whole-cell patch is one other
Page 206
SECTION 7: DISCUSSION
150
tool to capture the expression of the complex. Whole-cell patch recording
measures the total macroscopic current through the whole cell membrane
detecting with the appropriate pharmacology both Ca2+
currents and the BK
current, and may be required if expression of individual channels was low or
the channel were too non uniformly distributed in the plasma membrane.
7.5.2 Apoptosis and proliferation
Cell number is clearly a function of both proliferative capacity and apoptotic
mechanisms in MG63 cells, both of which processes may be sensitive to BK
channel blockers, as stated above. K+ channels have been linked previously to
both proliferation and apoptosis and the contribution of the BK channel to
apoptosis should be tested in future work. There are different types of assays
available now such as the caspase assay which assesses apoptosis based on
caspase function or TUNEL and DNA fragmentation Assays which can detect
the cleaved 180-200 bp DNA increments during cell apoptosis.
7.6 Concluding statement
In short the experiments here are of fundamental importance to bone
physiology but also may have implications for therapeutic approaches to bone
disease. Much remains to be clarified, and many unanswered questions need to
be resolved. Ion channel work in the bone arena is still a relatively new field
with there being plenty of scope for future study. This Thesis has only helped
Page 207
SECTION 7: DISCUSSION
151
opened the door on what should be a fruitful and interesting research area ripe
for exploitation.
Page 208
152
References
Abdul M, Santo A, Hoosein N. (2003) Activity of potassium channel-blockers
in breast cancer. Anticancer Res. 23 (4): 3347-51.
Abdul M., Hoosein N. (2002). Expression and activity of potassium ion
channels in human prostate cancer. Cancer Lett. 186:99–105.
Ahluwalia, J., Tinker A., Clapp LH., Duchen MR, Abramov AY, Pope
S.,
Muriel Nobles M., Segal A.W (2004). The large-conductance Ca2+-activated
K+ channel is essential for innate immunity. Nature, 427, 853-858.
Amigorena S, Choquet D, Teillaud JL, Korn H and Fridman WH. (1990). Ion
channels and B cell mitogenesis. Mol Immunol 27:1259–1268.
Armstrong A.M. (2003) Voltage-gated potassium channels. Sci. STKE 24 (188)
p. re10.
Asher V, Warren A, Shaw R, Sowter H, Bali A and Khan R (2011) The role of
Eag and HERG channel in cell proliferation and apoptotic cell death in SK-
OV-3 ovarian cancer cell line. Cancer Cell International 2011, 11:6
Aubin, JE. and Liu, F. (1996). The osteoblast lineage. In Principles of Bone
Biology (ed. J. P. Bilezikian L. G. Raisz and G. A. Rodan), pp. 51-67. San
Diego: Academic Press.
Aubin, JE., Turksen, K. and Heersche, JNM. (1993). Osteoblastic cell lineage.
In Cellular and Molecular Biology of Bone (ed. M. Noda), pp.1 -45. New
York: Academic Press.
Barry ELR. (2000) Expression of mRNAs for the α1 subunit of voltage-gated
calcium channels in human osteoblast-Like cell lines and in normal human
osteoblasts. Calcified Tissue International. 66(2): 145-150.
Basrai, D., Kraft, R., Bollensdorff, C., Liebmann, L., Benndorf, K., Patt, S.
(2002). BK channel blockers inhibit potassium- induced proliferation of human
astrocytoma cells. Neuroreport 13:403–407.
Beeton C. (2001). Selective blockade of T lymphocyte K+ channels ameliorates
experimental autoimmune encephalomyelitis, a model for multiple sclerosis.
Proc Natl Acad Sci U S A. 98:13942–13947.
Berkefeld, H., Sailer CA., Bildl W., Rohde V., Thumfart JO., Eble S.,
Klugbauer N., Reisinger E., Oliver D., Knaus HG., Schulte U. and Fakler B.
(2006). BKCa-Cav channel complexes mediate rapid and localized Ca2+-
activated K+ signaling. Science 314(5799): 615-620.
Page 209
153
Bertran GC, D’Alessio C and Kotsias BA (1995) Ion channels in non excitable
cells. Medicines. 55 (5) Pt 1: 449-456
Binstock L, Goldman L. (1971) Rectification in instantaneous potassium
current–voltage relations in Myxicola giant axons. J. Physiol 217: 517–531.
Blatz, AL. and Magleby, KL. (1986). Single apamin-blocked Ca-activated K+
channels of small conductance in cultured rat skeletal muscle. Nature 323,
718– 720.
Bloch M, Ousingsawat J, Simon R, Schraml P, Gasser TC. (2007). KCNMA1
gene amplification promotes tumor cell proliferation in human prostate cancer.
Oncogene 26:2525–2534.
Bolotina VM, Najibi S, Palacino JJ, Pagano PJ, Cohen RA (1994). Nitric oxide
directly activates calcium-dependent potassium channels in vascular smooth
muscle. Nature.368:850–853.
Booth IR, Edwards MD, and Miller S. (2003) Bacterial ion channels.
Biochemistry 42: 10045-10053
Brayden, JE., and Nelson, MT. (1992). Regulation of arterial tone by activation
of calcium-dependent potassium channels. Science, 256, 532–535.
Brelidze, TI., and Magleby KL. (2005). Probing the geometry of the inner
vestibule of BK channels with sugars. J. Gen. Physiol. 126:105–121.
Brelidze, TI., Niu X, and Magleby K.L (2003). A ring of eight conserved
negatively charged amino acids doubles the conductance of BK channels and
prevents inward rectification. Proc. Natl. Acad. Sci. USA. 100:9017–9022.
Brenner R, Jegla TJ, Wickenden A, Liu Y, Aldrich RW (2000a) Cloning and
functional characterization of novel large conductance calcium-activated
potassium channel β subunits, hKCNMB3 and hKCNMB4. J Biol Chem 275:
6453– 6461.
Brenner R, Perez GJ, Bonev AD, Eckman DM, Kosek JC, Wiler SW, Patterson
AJ, Nelson MT, Aldrich RW (2000b) Vasoregulation by the beta1 subunit of
the calcium-activated potassium channel. Nature 407: 870–876.
Burg ED, Remillard CV and Yuan JXJ. (2006). K+ channels in apoptosis. J
Membr Biol 209, 1-18.
Cahalan, M.D. and Lepple-Wienhues A. (1997) Ion channels in lymphocyte
function: Editorial. Cellular Physiology and Biochemistry 7: 133-134.
Calderone V. (2002) Large-conductance, Ca2+
-activated K+ channels: function,
pharmacology and drugs. Curr Med Chem. 9:1385–1395.
Page 210
154
Candia S, Garcia ML, and Latorre R (1992) Mode of action of iberiotoxin, a
potent blocker of the large conductance Ca2+
-activated K+ channel. Biophys J
63, 583-590.
Carrier GO, Fuchs LC, Winecoff AP, Giulumian AD, White RE (1997).
Nitrovasodilators relax mesenteric microvessels by cGMP-induced stimulation
of Ca-activated K channels. American Journal of Physiology.273:H76–84.
Chandy KG (1984). Voltage-gated potassium channels are required for human
T lymphocyte activation. J Exp Med. 160:369–385.
Chandy KG, Cahalan M, Pennington M, Norton RS, Wulff H, and Gutman GA
(2001) Potassium channels in T lymphocytes: toxins to therapeutic
immunosuppressants. Toxicon 39:1269–1276.
Chandy KG, Wulff H, Beeton C, Pennington M, Gutman GA and Cahalan MD
(2004) K+ channels as targets for specific immunomodulation. TIPS 25, 280-
289.
Chapman H., Piggott C., Andrews PW., and Wann KT. (2007).
Characterisation of large-conductance calcium-activated potassium channels
(BKCa) in human NT2-N cells. Brain Research, 1129, 15-25.
Chavassieux, P., Serre CM., Vergnaud P., Delmas PD., Meunier PJ. (1993). In
vitro evaluation of dose-effects of ethanol on human osteoblastic cells. Bone
Miner 22(2): 95-103.
Cheney JA, Weisser JD, Bareyre FM, Laurer HL, Saatman KE, Raghupathi R,
Gribkoff VK, Starrett JE Jr, and McIntosh TK. (2001) The maxi-K channel
opener BMS-204352 attenuates regional cerebral edema and neurologic moto
impairment after experimental brain injury. J Cereb Blood Flow Metab 21:
396–403.
Chiang HT, Wu SN (2001). Inhibition of large-conductance calcium-activated
potassium channel by 2-methoxyestradiol in cultured vascular endothelial
(HUV-EC-C) cells. J Membr Biol 182: 203–212.
Clay J.R (1991) A paradox concerning ion permeation of the delayed rectifier
potassium ion channel in squid giant axons. J. Physiol 444: 499–511.
Cox DH, Cui J, Aldrich RW. (1997). Separation of gating properties from
permeation and block in mslo large conductance Ca-activated K+ channels.
Journal of General Physiology.109(5):633–646.
Cox, DH. and Aldrich RW. (2000). Role of the beta1 subunit in large-
conductance Ca2+
-activated K channel gating energetics. Mechanisms of
enhanced Ca2+
sensitivity. J Gen Physiol 116(3): 411-432.
Page 211
155
Crockett JC, Rogers MJ, Coxon FP, Hocking LJ, Helfrich MH (2011) Bone
remodelling at a glance. J Cell Sci. 1;124(7):991-8.
Curley, M. and Morrison JJ. (2004). "Analysis of Maxi-K alpha subunit splice
variants in human myometrium." Reprod Biol Endocrinol 2(1): 67.
Czarnecki, A., Dufy-Barbe, L., Huet, S., Odessa, M.F., Bresson-Bepoldin., L.
(2003). Potassiumchannel expression level is dependent on the proliferation
state in the GH3 pituitary cell line. Am. J. Physiol Cell Physiol 284:C1054–
C1064.
Darkow, D.J., Lu L. (1997). Estrogen relaxation of coronary artery smooth
muscle is mediated by nitric oxide and cGMP. Am J Physiol 272: H2765-2773.
Davies AG, Pierce-Shimomura JT, Kim H, VanHoven MK, Thiele TR, Bonci
A, Bargmann CI, McIntire SL. (2003) A central role of the BK potassium
channel in behavioral responses to ethanol in C. elegans. Cell 12;115(6):655-
66.
Davies JH, Evans BA, Jenney ME, and Gregory JW (2002) In vitro effects of
combination chemotherapy on osteoblasts: implications for osteopenia in
childhood malignancy. Bone 31, 319-26.
De Wet, H., Allen M., Holmes C., Stobbart M., Lippiat JD., Callaghan R.
(2006). Modulation of the BK channel by estrogens: examination at single
channel level. Mol Membr Biol 23(5): 420-429.
DeCoursey TE. (1984). Voltage-gated K+ channels in human T lymphocytes: a
role in mitogenesis? Nature 307:465–468.
Deng XL, Lau CP, Lai K, Cheung KF, Lau GK and Li GR (2007) Cell cycle-
dependent expression of potassium channels and cell proliferation in rat
mesenchymal stem cells from bone marrow. Cell Prolif 40, 656-670.
Diamond, T., Stiel D, Luzner M., Wilkinson M., Posen S. (1989). Ethanol
reduces bone formation and may cause osteoporosis. Am J Med 86(3): 282-
288.
Dick GM, Rossow CF, Smirnov S, Horowitz B, and Sanders KM (2001).
Tamoxifen activates smooth muscle BK channels through the regulatory 1
subunit. J Biol Chem 276: 34594-34599.
Dixon, SJ., Aubin JE, and Dainty J. (1984) Electrophysiology of a clonal
osteoblast-like cell line: evidence for the existence of a Ca2+-activated K+
conductance. J. Membr. Biol. 80:49–58.
Page 212
156
Doyle, DA., Morais J., Pfuetzner RA., Kuo A, Gulbis JM., Cohen SL., Chait B.
T., and MacKinnon R. (1998) The structure of the potassium channel:
molecular basis of K+ conduction and selectivity. Science. 280:69–77.
Duncan RL and Hruska KA. (1994). Chronic, intermittent loading alters
mechanosensitive channel characteristics in osteoblast-like cells. Am J Physiol
267, F909-F916.
Dworetzky, SI., Boissard CG. Lum-Ragan JT., McKay MC., Post-Munson DJ.,
Trojnacki JT., Chang CP., Gribkoff VK.(1996). Phenotypic alteration of a
human BK (hSlo) channel by hSlobeta subunit coexpression: changes in
blocker sensitivity, activation/relaxation and inactivation kinetics, and protein
kinase A modulation. J Neurosci 16(15): 4543-4550.
DworetzkySI, Trojnacki JT, and Gribkoff VK. (1994). Cloning and expression
of a human large-conductance calcium-activated potassium channel. Brain Res
27: 189–193.
Dyer, S. A., Buckendahl P. and Sampson HW. (1998). Alcohol consumption
inhibits osteoblastic cell proliferation and activity in vivo. Alcohol 16(4): 337-
341.
Edwards G (1998) Potassium channel modulation: What next? Curr Res Ion
Channel Modulators 3:163–164.
Elso C.M., Lu X., Culiat C.T., Rutledge J.C., Cacheiro N.L., Generoso W.M.,
Stubbs L.J. (2004). Heightened susceptibility to chronic gastritis, hyperplasia
and metaplasia in Kcnq1 mutant mice. Hum. Mol. Genet. 13:2813–2821.
Evans BA, Elford C, Pexa A, Francis K, Hughes AC, Deussen A, and Ham J
(2006) Human osteoblast precursors produce extracellular adenosine, which
modulates their secretion of IL-6 and osteoprotegerin. J Bone Miner Res 21,
228-236.
Fernandez-Fernandez JM, Tomas M, Vazquez E, Orio P, Latorre R, Senti M,
Marrugat J, Valverde MA (2004). Gain-of-function mutation in the KCNMB1
potassium channel subunit is associated with low prevalence of diastolic
hypertension. J Clin Invest.113:1032–9.
Ferrier, J., Dixon, J., Illeman, A., Dillon, E. and Smith, I. (1982), Low-
frequency voltage noise in a mammalian bone cell clone. Journal of Cellular
Physiology 113(2) 267-272.
Frankenhauser B (1962). Potassium permeability in myelinated nerve fibers of
Xenopus laevis J. Physiol 160: 54–61.
Friday, K. E. and Howard GA. (1991). Ethanol inhibits human bone cell
proliferation and function in vitro. Metabolism 40(6): 562-565.
Page 213
157
Fukao M, Mason HS, Britton FC, Kenyon JL, Horowitz B, Keef KD. (1999).
Cyclic GMP-dependent protein kinase activates cloned BKCa channels
expressed in mammalian cells by direct phosphorylation at serine 1072. J Biol
Chem. 274:10927–10935.
Fukushima Y., Hagiwara S. and Henkart M. (1984) Potassium current in clonal
cytotoxic T lymphocytes from the mouse. J Physiol. 351:645–656.
Garcia-Valdes J, Zamudio FZ, Toro L, and Possani LD (2001) Slotoxin,
alphaKTx1.11, a new scorpion peptide blocker of MaxiK channels that
differentiates between alpha and alpha+beta (beta1 or beta4) complexes. FEBS
Lett 505: 369-373.
Gardos, G. (1958). The function of calcium in the potassium permeability of
human erythrocytes. Biochim Biophys Acta 30, 653– 654.
Gavaler, JS. and Van Thiel DH. (1992). Hormonal status of postmenopausal
women with alcohol-induced cirrhosis: further findings and a review of the
literature. Hepatology 16(2): 312-319.
Ghanshani S, Wulff H, Miller MJ, Rohm H, Neben A, Gutman GA, Cahalan
MD, and Chandy KG (2000). Up-regulation of the IKCa1 potassium channel
during T-cell activation. J Biol Chem 275:37137–37149.
Ghatta S, Nimmagadda D, Xu X, and O'Rourke ST (2006) Large-conductance,
calcium-activated potassium channels: structural and functional implications.
Pharmacol Ther 110: 103-116.
Giangiacomo, KM., Garrcia-calvo, M., Knaus HG., Mullmann, TJ., Garcia
ML., Mcmanus, O. (1995). Functional reconstitution of the large conductance,
calcium-activated potassium channel purified from bovine aortic smooth
muscle. Biochemistry, 34, 15849–15862.
Giebisch G (1998) Renal potassium transport: mechanisms and regulation.
AJP-Renal Physiol 274: 5 F817-F833
Goldman D.E (1943) Potential, impedance, and rectification in membranes J.
Gen. Physiol 27 37–60.
Goldstein SA, Bockenhauer D, O'Kelly I, and Zilberberg N. (2001). Potassium
leak channels and the KCNK family of two-P-domain subunits. Nat Rev
Neurosci 2: 175–184.
Goldstein SA, Price LA, Rosenthal DN, and Pausch MH. (1996). ORK1, a
potassium-selective leak channel with two pore domains cloned from
Drosophila melanogaster by expression in Saccharomyces cerevisiae. Proc
Natl Acad Sci USA 93: 13256–13261.
Page 214
158
Gribkoff VK, Starrett JE Jr, Dworetzky SI, Hewawasam P, Boissard CG, Cook
DA, Frantz SW, Herman K, Hibbard JR, Huston K, Johnson G., Krishnan BS.,
Kinney GG., Lombardo LA., Meanwell NA., Molinoff PB., Mayers RA.,
Moon SL, Ortiz A., Rakor l., Pieschl RL., Post-Munson DJ., Signor LJ.,
Srinivas N., Taber MT., Thalody G., Trojnacki JT., Wiener H., Yeleswaran K.,
Yeola SW. (2001) Targeting acute ischemic stroke with a calcium sensitive
opener of Maxi-K potassium channels. Nat Med 7: 471–477.
Gu Y and Publicover SJ (2000). Expression of functional metabotropic
glutamate receptors in primary cultured rat osteoblasts. J Biol Chem 275,
34252-34259.
Gu Y, Genever PG, Skerry TM, and Publicover SJ (2002) The NMDA type
glutamate receptors expressed by primary rat osteoblasts have the same
electrophysiological characteristics as neuronal receptors. Calcif Tissue Int 70,
194-203.
Guevremont, M., Martel-Pelletier J. Massicotte F., Tardif G., Pelletier JP.,
Ranger P., Lajeunesse D., Reboul P. (2003). Human adult chondrocytes
express hepatocyte growth factor (HGF) isoforms but not HgF: potential
implication of osteoblasts on the presence of HGF in cartilage. J Bone Miner
Res 18(6): 1073-81.
Hagen BM, Bayguinov O, Sanders KM.(2003). Beta 1-subunits are required
for regulation of coupling between Ca2+
transients and Ca2+
-activated K+ (BK)
channels by protein kinase C. Am J Physiol Cell Physiol 285:C1270–C1280.
Hamill, O. P., A. Marty, Neher E, Sakmann B, Sigworth FJ. (1981). Improved
patch-clamp techniques for high-resolution current recording from cells and
cell-free membrane patches. Pflugers Arch 391(2): 85-100.
Hanner, M., R. Vianna-Jorge, A. Kamassah, W.A. Schmalhofer, H.G. Knaus,
G.J. Kaczorowski, and M.L. Garcia. 1998. The β subunit of the high
conductance calcium-activated potassium channel. Identification of residues
involved in charybdotoxin binding. J. Biol. Chem. 273:16289–16296.
Harbour ME, Gegory JW, Jenkins HR, and Evans BAJ (2000). Proliferative
response of different human osteoblast-like cell models to proinflammatory
cytokines. Pediatr Res 48, 163-168.
Hattori T, Maehashi H, Miyazawa T, and Naito M (2001) Potentiation by
Stannous Chloride of Calcium Entry into Osteoblastic MC3T3-E1 Cells
Through Voltage-Dependent L-Type Calcium Channels. Cell Calcium 30, 67-
72.
He J, Kargacin ME, Kargacin GJ, and Ward CA (2003) Tamoxifen inhibits
Na+ and K
+ currents in rat ventricular myocytes. Am J Physiol Heart Circ
Physiol 285:H661–H668.
Page 215
159
Henney, N.C., Li, B., Evans, B. A. J., Hall, E.J. and Wann, K.T. (2006)
Potassium channel subunits in human osteoblast-like cells. J. Bone Miner. Res.
21, 7, 1169.
Hewawasam P, Gribkoff VK, Dworetzky SI, Ortiz AA, Kinney GG, Boissard
CG, Post-Munson DJ, Trojnacki JT, Huston K, Signor LJ, Lombardo LL, Reid
SA, Hibbard JR, Myers RA, Moon SL, Wiener HL, Thalody G, Yeleswaram
K, Pajor LM, Knipe JO, Meanwell NA, Johnson G, Molinoff PB, Starrett JE
and Gao Q (2000) Discovery of openers of large-conductance, calcium
activated potassium (maxi-K) channels: A new approach to stroke
neuroprotection (Abstract). 219th
ACS National Meeting, March 25–29, San
Francisco, CA.
Hille, B. (1992) Ion channels of excitable membranes (third ed.1992).
Sunderland, Mass: Sinauer Associates. ISBN 0-87893-321-2.
Hodgkin A.L, Katz B. (1949). The effect of sodium ions on the electrical
activity of the giant axon of the squid. J. Physiol 108: 37–77
Hoebertz A, Arnett TR, and Burnstock G. (2003). Regulation of bone
resorption and formation in purines and pyrimidines. TIPS 24, 290-297.
Hoffman, J.F., W. Joiner, K. Nehrke, O. Potapova, K. Foye, and A. Wickrema.
(2003). The hSK4 (KCNN4) isoform is the Ca2+
-activated K+ channel (Gardos
channel) in human red blood cells. Proc. Natl. Acad. Sci. USA. 100:7366–7371.
HoK, Nichols CG, Lederer WJ, Lytton J, Vassilev PM, Kanazirska MV, and
Hebert SC. (1993) Cloning and expression of an inwardly rectifying ATP-
regulated potassium channel. Nature 362: 31–38.
Holbrook, T. L. and Barrett-Connor E. (1993). A prospective study of alcohol
consumption and bone mineral density. BMJ 306(6891): 1506-1509.
Huang Y, Rane SG (1994) Potassium channel induction by the Ras/Raf signal
transduction cascade. J Biol Chem 269:31183–31189.
Hughes S, Magnay J, Foreman M, Publicover SJ, Dobson JP, and El Haj AJ
(2006) Expression of the mechanosensitive 2PK+ channel TREK-1 in human
osteoblasts. J Cell Physiol 206, 738-748.
Ikeda M, Dewar D and McCulloch J (1991) Selective reduction of [125I]
apamin binding sites in Alzheimer hippocampus: A quantitative
autoradiographic study. Brain Res 567:51–56.
Iliev IG and Marino AA (1993) Potassium channels in epithelial cells. Cell
Mol. Biol. Res. 39(6):601-11.
Page 216
160
Imaizumi Y, Sakamoto K, Yamada A, Hotta A, Ohya S, Muraki K, Uchiyama
M, Ohwada, T (2002) Molecular basis of pimarane compounds as novel
activators of large-conductance Ca2+
-activated K+ channel α-subunit. Mol
Pharmacol 62 (4), 836-46.
Ishii, TM., Silvia, C., Hirschberg, B., Bond, CT, Adelman, JP., & Maylie, J.
(1997). A human intermediate conductance calcium-activated potassium
channel. Proc Natl Acad Sci USA 94, 11651– 11656.
Jager H., Dreker T., Buck A., Giehl K., Gress T., Grissmer S. (2004). Blockage
of intermediate-conductance Ca2+-activated K+ channels inhibit human
pancreatic cancer cell growth in vitro. Mol. Pharmacol. 65:630–638.
Jaggar JH, Nelson MT (2000). Differential regulation of Ca2+
sparks and Ca2+
waves by UTP in rat cerebral artery smooth muscle cells. Am J Physiol.
279:C1528–C1539.
Jiang Y, Lee A, Chen J, Ruta V, Cadene M, Chait BT, MacKinnon R (2003).
X-ray structure of a voltage-dependent K+ channel. Nature 423 (6935): 33–41.
Jiang, Y., A. Lee, J. Chen, M. Cadene, B.T. Chait, and R. MacKinnon. (2002).
Crystal structure and mechanism of a calcium-gated potassium channel.
Nature. 417:515–522.
Jiang, Y., Lee A., Chen J., Cadene M., Chait B. T., and MacKinnon R. (2002)
The open pore conformation of potassium channels. Nature 417:523–526.
Jørgensen NR, Henriksen Z, Brot C, Eriksen EF, Sorensen OH, Civitelli R, and
Steinberg TH (2000). Human osteoblastic cells propagate intracellular calcium
signals by two different mechanisms. J Bone Miner Res 15, 1024-1032.
Judge S, Bever C (2006). "Potassium channel blockers in multiple sclerosis:
neuronal Kv channels and effects of symptomatic treatment". Pharmacol. Ther.
111 (1): 224–59.
Kartsogiannis, V. and Ng KW. (2004). Cell lines and primary cell cultures in
the study of bone cell biology. Mol Cell Endocrinol 228(1-2): 79-102.
Khanna R, Chang MC, Joiner WJ, Kaczmarek LK and Schlichter LC (1999)
hSK4/hIK1, a calmodulin-binding KCa channel in human T lymphocytes.
Roles in proliferation and volume regulation. J Biol Chem 274:14838–14849.
Klein, R. F., Fausti KA. And Carlos AS. (1996). Ethanol inhibits human
osteoblastic cell proliferation. Alcohol Clin Exp Res 20(3): 572-578.
Knaus HG, McManus OB, Lee SH, Schmalhofer WA, Garcia-Calvo M, Helms
LM, Sanchez M, Giangiacomo K, Reuben JP, Smith AB 3rd, (1994)
Page 217
161
Tremorgenic indole alkaloids potently inhibit smooth muscle high-conductance
calcium-activated potassium channels. Biochemistry 33: 5819-5828.
Knaus, HG., Eberhart, A., KochRO., Munujos P., Schmalhofer WA., Warmke
JW., Kaczorowski GJ., Garcia ML. (1995). Characterization of tissue-
expressed alpha subunits of the high conductance Ca-activated K channel. J
Biol Chem 270(38): 22434-9.
Kohler M, Hirschberg B, Bond CT, Kinzie JM, Marrion NV, Maylie J, and
Adelman JP.(1996). Small-conductance, calcium-activated potassium channels
from mammalian brain. Science 273: 1709–1714.
Komarova SV, Dixon SJ, Sims SM (2001) Osteoclast ion channels: potential
targets for antiresorptive drugs. Curr. Pharm. Des. 7: 637-654.
KuboY, Baldwin TJ, Jan YN, and Jan LY. (1993). Primary structure and
functional expression of a mouse inward rectifier potassium channel. Nature
362: 127–133.
Kuhlmann C.R., Schafer M., Li F., Sawamura T., Tillmanns H., Waldecker B.,
Wiecha J. (2003). Modulation of endothelial Ca(2+)-activated K(+) channels
by oxidized LDL and its contribution to endothelial proliferation. Cardiovasc.
Res 60:626–634.
Kuhlmann C.R., Wu Y., Li F., Munz B.M., Tillmanns H., Waldecker B.,
Wiecha J. (2004). bFGF activates endothelial Ca2+-activated K+ channels
involving G-proteins and tyrosine kinases. Vascul. Pharmacol. 41:181–186.
Kuhlmann CR, Gast C, Li F, Schäfer M, Tillmanns H, Waldecker B, Wiecha J.
(2004). Cerivastatin activates endothelial calcium-activated potassium channels
and thereby modulates endothelial nitric oxide production and cell
proliferation. J Am Soc Nephrol. 15(4):868-75.
Kuhlmann CR, Most AK, Li F, Münz BM, Schaefer CA, Walther S, Raedle-
Hurst T, Waldecker B, Piper HM, Tillmanns H, Wiecha J. (2005). Endothelin-
1-induced proliferation of human endothelial cells depends on activation of K+
channels and Ca+ influx. Acta Physiol Scand. 183(2):161-9.
Kunzelmann K (2005). Ion channels and cancer. J Membr Biol 205,159-173.
Laitinen, K. and Valimaki M. (1991). Alcohol and bone. Calcif Tissue Int 49
Suppl: S70-73.
Laitinen, K., Lamberg-Allardt C, Tunninen R., Karonen SL., Ylikahri R.,
Valimaki M. (1991). Effects of 3 weeks' moderate alcohol intake on bone and
mineral metabolism in normal men. Bone Miner 13(2): 139-151.
Page 218
162
Lajeunesse D., Frondoza C., Schoffield B., Sacktor B. (1990) Osteocalcin
secretion by the human osteosarcoma cell line MG-63. J. Bone Miner. Res.
5(9): 915.
Lastraioli E., Guasti L., Crociani O., Polvani S., Hofmann G., Witchel H.,
Bencini L., Calistri M., Messerini L., Scatizzi M., Moretti R., Wanke E.,
Olivotto M., Mugnai G., Arcangeli A. (2004). herg1 gene and HERG1 protein
are overexpressed in colorectal cancers and regulate cell invasion of tumor
cells. Cancer Res. 64:606–611.
Lehenkari P, Parikka V, Rautiala TJ, Weckstrom M, Dahllund J, Harkonen PL,
and Vaanaanen, HK (2003). The effects of tamoxifen and toremifene on bone
cells involve changes in plasma membrane ion conductance. J Bone Miner Res
18, 473-481.
Leonard RJ, Garcia ML, Slaughter RS, and Reuben JP (1992). Selective
blockers of voltage-gated K+ channels depolarise human T-lymphocytes:
mechanism of the antiproliferative effect. Proc Nat Acad Sci USA 89, 10094-
10098.
Lesage F and Lazdunski M. (2000). Molecular and functional properties of
two-pore-domain potassium channels. Am J Physiol Renal Physiol 279: F793–
F801.
Lesage F, Guillemare E, Fink M, Duprat F, Lazdunski M, Romey G, and
Barhanin J. (1996). TWIK-1, a ubiquitous human weakly inward rectifying K+
channel with a novel structure. EMBO J 15: 1004–1011.
Lesage, F., Hibino, H., and Hudspeth, A. J. (2004). Association of beta-catenin
with the alpha-subunit of neuronal large-conductance Ca2+
-activated K+
channels. Proc. Natl. Acad. Sci. USA 101, 671-675.
Li GR, Deng XL, Sun H, Chung SSM, Tse HF, and Lau CP (2006). Ion
channels in mesenchymal stem cells from rat bone marrow. Stem Cells 24,
1519-1528.
Li GR, Sun H, Deng X, and Lau C-P (2005). Characterisation of ionic currents
in human mesenchymal stem cells from bone marrow. Stem Cells 23, 371-382.
Li, W., and R.W. Aldrich. (2004). Unique inner pore properties of BK channels
revealed by quaternary ammonium block. J. Gen. Physiol. 124:43–57.
Liegeois JF., Mercier F., Graulich A., Graulich-Lorge F., Scuvee-Moreau J.,
Seutin V. (20003). Modulation of small conductance calcium-activated
potassium (SK) channels: a new challenge in medicinal chemistry. Curr. Med.
Chem. 10:625–647.
Page 219
163
Ling, S., Sheng, J. Z., Braun, J. E., and Braun, A. P. (2003). Syntaxin 1A co-
associates with native rat brain and cloned large conductance, calcium-
activated potassium channels in situ. J. Physiol. 553, 65-81.
Lippiat JD, Standen NB, Harrow ID, Phillips SC, and Davies NW (2003).
Properties of BKCa channels formed by bicistronic expression of hSloα and β1-
4 subunits on HEK293 cells. J Membr Biol 192:141-148.
Liu X, Chang Y, Reinhart PH, Sontheimer H, Chang Y. (2002). Cloning and
characterization of glioma BK, a novel BK channel isoform highly expressed
in human glioma cells. J Neurosci. 22:1840–1849.
Liu, G., Shi, J., Yang, L., Cao, L., Park, SM., Cui, J., and Marx, SO. (2004).
Assembly of a Ca2+
-dependent BK channel signaling complex by binding to
beta2 adrenergic receptor. EMBO J. 23: 2196-2205.
Logsdon, NJ., Kang, J., Togo, JA., Christian, EP., and Aiyar, J. (1997). A
novel gene, hKCa4, encodes the calcium-activated potassium channel in
human T lymphocytes. J Biol Chem 272: 32723– 32726.
Marty, A. (1981). Ca-dependent K channels with large unitary conductance in
chromaffin cell membranes. Nature 291: 497–500.
Matteson DR, Deutsch C. (1984). K+ channels in T lymphocytes: a patch
clamp study using monoclonal antibody adhesion. Nature 307:468–471.
McManus, OB., Helms LM, Pallanck l., Ganetzky B., Swanson R., Leonard.,
RJ. (1995). Functional role of the beta subunit of high conductance calcium-
activated potassium channels. Neuron 14(3): 645-650.
Meera P, Wallner M, and Toro L. (2000). A neuronal β subunit (KCNMB4)
makes the large conductance, voltage- and Ca2+
-activated K+
channel resistant
to charybdotoxin and iberiotoxin. Proc Nat Acad Sci USA 97, 5562-5567.
Miller, C. (2003). A charged view of voltage-gated ion channels. Nature
Structural Biology 10(6): 422-424.
Mistry DK, Garland CJ (1998). Nitric oxide (NO)-induced activation of large
conductance Ca2+
-dependent K+ channels (BKCa) in smooth muscle cells
isolated from the rat mesenteric artery. British Journal of
Pharmacology.124:1131–1140.
Moreau R, Aubin R, Lapointe JY, Lajeunesse D (1997). Pharmacological and
biochemical evidence for the regulation of osteocalcin secretion by potassium
channels in human osteoblast-like MG63 cells. J Bone Miner Res 12: 1984-
1992.
Page 220
164
Moreau R, Hurst AM, Lapointe JY, and Lajeunesse D. (1996). Activation of
maxi-K channels by parathyroid hormone and prostaglandin E2 in human
osteoblast bone cells. J Membr Biol 150: 175-84.
MutoS, Asano Y, Seldin D, and Giebisch G. (1999). Basolateral Na+ pump
modulates apical Na+ and K
+ conductances in rabbit cortical collecting ducts.
Am J Physiol Renal Physiol 276: F143–F158.
Neylon C.B. (2002). Potassium channels and vascular proliferation. Vascul.
Pharmacol. 38:35–41.
Nimigean, C.M., J.S. Chappie, and C. Miller. (2003). Electrostatic tuning of
ion conductance in potassium channels. Biochemistry. 42:9263–9268.
Nimigean, CM. and Magleby KL. (1999). The beta subunit increases the Ca2+
sensitivity of large conductance Ca2+-activated potassium channels by
retaining the gating in the bursting states. J Gen Physiol 113(3): 425-440.
O’Grady, S.M., Lee, S.Y. (2005). Molecular diversity and function of voltage-
gated (Kv) potassium channels in epithelial cells. Int. J Biochem Cell Biol
37:1578–1594.
OriasM, Velazquez H, Tung F, Lee G, and Desir GV. (1997). Cloning and
localization of a double-pore K channel, KCNK1: exclusive expression in
distal nephron segments. Am J Physiol Renal Physiol 273: F663–F666.
Orio, P., Rojas P., Ferreira G. and Latorre R. (2002). New disguises for an old
channel: MaxiK channel beta-subunits. News Physiol Sci 17: 156-61.
Orriss IR, Knight GE, Ranasinghe S, Burnstock G, and Arnett TR (2006).
Osteoblast responses to nucleotides increase during differentiation. Bone 39,
300-309.
Ottolia M, Toro L. (1994) Potentiation of large conductance KCa channels by
niflumic, flufenamic, and mefenamic acids. Biophys J. 67:2272–2279.
Ouadid-Ahidouch H., Roudbaraki M., Delcourt P., Ahidouch A., Joury N.,
Prevarskaya N. (2004). Functional and molecular identification of
intermediate-conductance Ca-activated K channels in breast cancer cells:
association with cell cycle progression. Am. J Physiol Cell Physiol 287:C125–
C134.
Pallanck, L., and B. Ganetzky. (1994). Cloning and characterization of human
and mouse homologs of the Drosophila calcium-activated potassium channel
gene, slowpoke. Hum. Mol. Genet. 3:1239–1243.
Page 221
165
PalmerLG, Antonian L, and Frindt G. (1994). Regulation of apical K and Na
channels and Na/K pumps in rat cortical collecting tubule by dietary K. J Gen
Physiol 104: 693–710.
Papazian DM, Schwarz TL, Tempel BL, Jan YN, Jan LY (1987) Cloning of
genomic and complementary DNA from Shaker, a putative potassium channel
gene from Drosophila. Science 1987, 237:749-753.
Pardo LA, Camino DD., Sanchez A., Alves F., Bruggemann A., Beckh S.,
Stuhmer W. (1999). Oncogenic potential of EAG K channels. EMBO J.
18:5540–5547.
Parfitt AM. (2001) Skeletal heterogeneity and the purposes of bone
remodelling: implications for the understanding of osteoporosis. In: Marcus R,
Zfeldman D, Kelsey J, eds. Osteoporosis. San Diego, CA: Academic Press
2001: 433–444.
Parihar A.S., Coghlan M.J., Gopalakrishnan M., Shieh C.C. (2003). Effects of
intermediate-conductance Ca(2+
)-activated K(+) channel modulators on human
prostate cancer cell proliferation. Eur. J Pharmacol. 471:157–164.
Park, Y. B. (1994). Ion selectivity and gating of small conductance Ca(2+
)-
activated K+ channels in cultured rat adrenal chromaffin cells. J Physiol 481(Pt
3), 555– 570.
Pedarzani P., Kulik A., Muller M., Ballanyi K., Stocker M. (2000). Molecular
determinants of Ca2+
-dependent K+ channel function in rat dorsal vagal
neurones. J. Physiol. (Lond.) 527:283–290.
Peng, TC., Lian JB, Hirsch PF., Kusy RP.(1991). Lower serum osteocalcin in
ethanol-fed rats. J Bone Miner Res 6(2): 107-115.
Pfeilschifter J, Köditz R, Pfohl M, Schatz H (2002). Changes in
proinflammatory cytokine activity after menopause. Endocr Rev 23 : 90–119.
Pluger S, Faulhaber J, Furstenau M, Lohn M, Waldschutz R, Gollasch M,
Haller H, Luft FC, Ehmke H, Pongs O. (2000) Mice with disrupted BK channel
β1 subunit gene feature abnormal Ca spark/STOC coupling and elevated blood
pressure. Circ Res 87:E53–E60.
Pluznick JL, Wei P, Carmines PK, Sansom SC. (2003) Renal fluid and
electrolyte handling in BKCa-beta1-/-
mice. Am J Physiol Renal Physiol 284:
F1274–F1279.
Pluznick JL, Wei P, Grimm PR, Sansom SC. (2005). BK-β1 subunit:
immunolocalization in the mammalian connecting tubule and its role in the
kaliuretic response to volume expansion. Am J Physiol Renal Physiol.
288:F846–F854.
Page 222
166
Purohit, V. (1998). Moderate alcohol consumption and estrogen levels in
postmenopausal women: a review. Alcohol Clin Exp Res 22(5): 994-997.
Ramsdell JS. (1991). Voltage-dependent calcium channels regulate GH4
pituitary cell proliferation at two stages of the cell cycle. J Cell Physiol.
146:197–206.
Ravesloot JH, van Houten RJ, Ypey DL, and Nijweide PJ (1990).
Identification of Ca2+
-activated K+
channels in cells of embryonic chick
osteoblast cultures. J Bone Miner Res 5: 1201-10.
Reinhart PH, Chung S, and Levitan I.B (1989). A family of calcium-dependent
potassium channels from rat brain. Neuron 2:1031-41.
Reinhart PH, Chung S, Martin Brautigan DL, and Levitan IB (1991).
Modulation of calcium-activated potassium channels from rat brain by protein
kinase A and phosphatase 2A. J Neurosci 11: 1627-1635.
Rezzonico R, Cayatte C, Bourget-Ponzio I, Romey G, Belhacene N, Loubat A,
Rocchi S, van Obberghen E, Girault J-A, Rossi B, and Schmid-Antomarchi H
(2003). Focal adhesion kinase pp125KK
interacts with the large conductance
calcium-activated hSlo potassium channel in human osteoblasts: potential role
in mechanotransduction. J Bone Miner Res 18: 1863-1871.
Rezzonico R, Schmid-Alliana A, Romey G, Bourget-Ponzio I, Breuil V,
Breittmayer V, Tartare-Deckert S, Rossi B, and Schmid-Antomarchi H (2002).
Prostaglandin E2 induces interaction between hSlo potassium channel and Syk
tyrosine kinase in osteosarcoma. J Bone Miner Res 17: 869-878.
Richter C, and Ferrier J (1991) Continuously active sodium channels in
osteoblastic ROS 17/2.8 cells. Bone and Mineral 15: 57-71.
Robertson BE, Schubert R, Hescheler J, Nelson MT (1993). cGMP-dependent
protein kinase activates Ca-activated K channels in cerebral artery smooth
muscle cells. Am J Physiol. 265:C299–303.
Roger S., Potier M., Vandier C., Le Guennec J.Y., Besson P. (2004).
Description and role in proliferation of iberiotoxin-sensitive currents in
different human mammary epithelial normal and cancerous cells. Biochim.
Biophys Acta 1667:190–199.
Roussellea A V, Heymann D (2001) Osteoclastic acidification pathways during
bone resorption. Bone 30(4):533-540.
Russell RG (2003). Pathogenesis of osteoporosis. (In: Rheumatology.
Hochberg MC, Silman AJ, Smolen SJ, Weinblatt ME, Weisman MH, editor.
Mosby) New York. pp. 2075–2147.
Page 223
167
Russell RG, Espina B, Hulley P (2006). Bone biology and the pathogenesis of
osteoporosis. Curr Opin Rheumatol.18(Suppl1):S3–S10.
Ruttiger L, Sausbier M, Zimmermann U, Winter H, Braig C, Engel J, Knirsch
M, Arntz C, Langer P, Hirt B, Mu¨ller M, Kopschall I, Pfister M, Munkner S,
Rohbock K, Pfaff I, Rusch A, Ruth P, Knipper M (2004) Deletion of the Ca-
activated potassium (BK) β-subunit but not the BK_1-subunit leads to
progressive hearing loss. Proc Natl Acad Sci USA 101: 12922–12927.
Rybalchenko V, Prevarskaya N, Van Coppenolle F, Legrand G, Lemonnier L,
Le Bourhis X, Skryma R. (2001) Verapamil inhibits proliferation of LNCaP
human prostate cancer cells influencing K+ channel gating. Mol Pharmacol.
59(6):1376-87.
Saito M, Nelson C, Salkoff L, Lingle CJ (1997). A cysteine-rich domain
defined by a novel exon in a Slo variant in rat adrenal chromaffin cells and
PC12 cells. J Biol Chem 272:11710–11717
Sampson, H. W. (1998). Alcohol's harmful effects on bone. Alcohol Health Res
World 22(3): 190-4.
Sampson, HW., Hebert VA., Booe HL and Champney TH (1998). Effect of
alcohol consumption on adult and aged bone: composition, morphology, and
hormone levels of a rat animal model. Alcohol Clin Exp Res 22(8): 1746-1753.
Sausbier U, Dullin C, Missbach-Guentner J, Kabagema C, Flockerzie K,
Kuscher GM, Stuehmer W,
Neuhuber
W, Ruth
P, Alves
F, Sausbier M.,(2011).
Osteopenia Due to enhanced cathepsin K release by BK channel ablation in
osteoclasts. PLoS ONE: 6 e21168.
Sausbier, M., Hu, H., Arntz, C., Feil, S., Kamm, S., Adelsberger, H., Sausbier,
U., Sailer, C. A., Feil, R., Hofmann, F., et al. (2004) Cerebellar ataxia and
Purkinje cell dysfunction caused by Ca2+-activated K+ channel deficiency.
Proc. Natl. Acad. Sci. USA 101, 9474–9478.
Schnitzler, C. M. and Solomon L. (1984). Bone changes after alcohol abuse. S
Afr Med J 66(19): 730-734.
Schubert R, Nelson MT. (2001). Protein kinases: tuners of the BKCa channel
in smooth muscle. Trends Pharmacol Sci.22:505–512.
Scornik FS, Codina J, Birnbaumer L, Toro L.(1993). Modulation of coronary
smooth muscle KCa channels by Gsα independent of phosphorylation by protein
kinase A. American Journal of Physiology. 265:C708–713.
Shieh, C. C., M. Coghlan (2000). Potassium channels: molecular defects,
diseases, and therapeutic opportunities. Pharmacol Rev 52(4): 557-94.
Page 224
168
Siemer, C. and S. Grissmer (1999). MaxiK channels: Molecular structure,
function, and tissue distribution. Perspectives in Drug Discovery and Design
16: 155-165.
Skryma RN, Prevarskaya NB., Dufy-Barbe L., Odessa MF., Audin J. and Dufy
B. (1997). Potassium conductance in the androgen-sensitive prostate cancer
cell line, LNCaP: involvement in cell proliferation. Prostate. 33:112–122.
Stein GS, Lian JB. Molecular mechanisms mediating
proliferation/differentiation interrelationships during progressive development
of the osteoblast phenotype. Endocr Rev. 1993;14:424–442.
Steinert M, and Grissmer S (1997). Novel Activation Stimulus of Chloride
Channels by Potassium in Human Osteoblasts and Human Leukaemic T-
Lymphocytes. J Physiol 500: 653-660.
Stocker M, Pedarzani P. (2000). Differential distribution of three Ca2+
-
activated K+ channel subunits, SK1, SK2, and SK3, in the adult rat central
nervous system. Mol Cell Neurosci.15:476–493.
Stocker M. (2004) Ca2+
-activated K+ channels: molecular determinants and
function of the SK family. Nat. Rev. Neurosci. 5:758-770.
Stumpff F, Strauss O, Boxberger M, Wiederholt M. Characterization of maxi-
K-channel in bovine trabecular meshwork and their activation by cyclic
guanosine monophosphate. Invest Ophthalmol Vis Sci 1997; 38:1883–1892.
Suzuki T., Takimoto K. (2004). Selective expression of HERG and Kv2
channels influences proliferation of uterine cancer cells. Int. J Oncol. 25:153–
159.
Tammaro P, Smith AL, Hutchings SR, and Smirnov SV (2004)
Pharmacological evidence for a key role of voltage-gated K+ channels in the
function of rat aortic smooth muscle cells. Br J Pharmacol 143: 303-317.
Tanaka M, Sasaki Y, Hukui T, Kyotani J, Hayashi S, Hamada K, Kimura Y,
Ukai Y, Kitano M and Kimura K (1998). A novel pyrrole derivative, NS-8,
activates the Ca21-sensitive K1 channels and suppresses micturition reflex in
rats. J Urol 159 (suppl):21.
Toro L, Wallner M, Meera P, Tanaka Y. Maxi-Kca, (1998). A unique member
of the voltage-gated K channel superfamily. News Physiol Sci. 13:112–7.
Toro L, Alioua A, Lu R, Garcia-Valdes J, Zarei MM, Nishimaru K, Eghbali M,
and Stefani E. (2005) Ca2+
-activated voltage dependent K+ channels. In: Ion
Channels in the Pulmonary Vasculature. Lung Biology in Health and Disease.
Vol 197. J. X.-J. Yuan, ed. Taylor and Francis Group. Boca Raton, FL. Chapter
12, pp. 237-256.
Page 225
169
Tseng-Crank J, Foster CD, Krause JD, Mertz R, Godinot N, Di Chiara TJ, and
Reinhart PH (1994). Cloning, expression and distribution of functionally
distinct Ca2+
-activated K+ channel isoforms from human brain. Neuron 13:
315-1330.
Valverde, M.A., P. Rojas, J. Amigo, D. Cosmelli, P. Orio, M.I. Bahamonde,
G.E. Mann, C. Vergara, and R. Latorre. (1999). Acute activation of Maxi-K
channels (hSlo) by estradiol binding to the β subunit. Science. 285:1929–1931.
Wallner, M., Meera, P., and Toro, L. (1996) Determinant for beta-subunit
regulation in high-conductance voltage-activated and Ca(2+)-sensitive K+
channels: an additional transmembrane region at the N terminus. Proc Natl
Acad Sci U S A 93: 14922– 14927.
Walz W. (2002) Patch-Clamp Analysis advanced techniques. Neuromethods.
38.
Wang G, and Lemos JR (1992). Tetrandrine blocks a slow, large-conductance,
Ca2+
-activated potassium channel besides inhibiting a non-inactivating Ca2+
current in isolated nerve terminals of the rat neurohypophysis. Pflügers Arch
421: 558-565.
Wang G., Lemos J R., Ladecola C. (2004) Herbal alkaloid tetrandrine: from an
ion channel blocker to inhibitor of tumor proliferation. TIPS. 25 (3): 120-123.
Wang WH, Geibel J, and Giebisch G. (1993). Mechanism of apical K+ channel
modulation in principal renal tubule cells. Effect of inhibition of basolateral
Na+-K
+-ATPase. J Gen Physiol 101: 673–694.
Wang, G. and J. R. Lemos (1995). Tetrandrine: a new ligand to block voltage-
dependent Ca2+ and Ca(+)-activated K+ channels. Life Sci 56(5): 295-306.
Wann KT, Henney N, Prajerová I, Boolaky UV, and Evans BAJ (2004). Single
channels in human osteoblast-like cells. J Physiol 555P, PC59.
Wann KT, Henney N, Prajerová I, Boolaky UV, and Evans BAJ (2004b).
Human osteoblast-like cells have high density maxi-K channels. J Bone Miner
Res 19:1051.
Wann KT, Henney N, Prajerová I, Boolaky UV, Evans BAJ (2004a) Single
channels in human osteoblast-like cells. J Physiol 555P: PC59.
Wann, KT and Richards, CD (1994). Properties of single calcium-activated
potassium channels of large conductance in rat hippocampal neurons in culture.
Eur J Neurosci 6: 607-617.
Page 226
170
Webster SM, Del Camino D, Dekker JP, Yellen G (2004) Intracellular gate
opening inShaker K+ channels defined by high-affinity metal bridges. Nature
428:864–868.
Wellman GC & Nelson MT (2003). Signaling between SR and plasma
membrane in smooth muscle: sparks and the activation of Ca2+-sensitive ion
channels. Call Calcium 34, 211–229.
Wellman, GC., Bonev AD. Nelon MT., Brayden JE. (1996). Gender
differences in coronary artery diameter involve estrogen, nitric oxide, and
Ca(2+)-dependent K+ channels. Circ Res 79(5): 1024-1030.
Weskamp M, Seidl W, and Grissmer S (2000). Characterisation of the increase
in [Ca2+
]i during hypotonic shock and the involvement of Ca2+
-activated K+
Channels in the regulatory volume decrease in human osteoblast-like cells. J
Membr Biol 178: 11-20.
Wiltink, A., Nijweide PJ., Scheenen WJ., Ypey DL., Van Duijn B. (1995). Cell
membrane stretch in osteoclasts triggers a self-reinforcing Ca2+ entry pathway.
Pflugers Arch 429(5): 663-71.
Wolfart J., Neuhoff H., Franz O., Roeper J. (2001). Differential expression of
the small-conductance, calcium-activated potassium channel SK3 is critical for
pacemaker control in dopaminergic midbrain neurons. J. Neurosci.21:3443–
3456.
Wolfram Kuhlmann C.R., Wiebke L.D., Schaefer C.A., Kerstin M.A.,
Backenkohler U., Neumann T., Tillmanns H., Erdogan A. (2004).
Lysophosphatidylcholine-induced modulation of Ca2+
-activated K+channels
contributes to ROS-dependent proliferation of cultured human endothelial
cells. J Mol. Cell Cardiol. 36:675–682
Wonderlin WF, and Strobl JS (1996). Potassium channels, proliferation and G1
progression. J Membr Biol 154: 91-107.
Wu SN (2003). Large conductance Ca2+
-activated K+ channels: physiological
role and pharmacology. Curr Med Chem 10: 649-661.
Wu, SN, Hwang, TL, Jan, CR, and Tseng, CJ. (1997). Ionic mechanisms of
tetrandrine in cultured rat aortic smooth muscle cells. Eur J Pharm 327(2),
233-238.
Wu, SN., Li, HF. Lo YC. (2000) Characterization of tetrandrine-induced
inhibition of large-conductance calcium-activated potassium channels in a
human endothelial cell line (HUV-EC-C). J Pharmacol Exp Ther 292(1): 188-
95.
Page 227
171
Xia XM, Fakler B, Rivard A, Wayman G, Johnson-Pais T, Keen JE (1998).
Mechanism of calcium gating in small-conductance calcium-activated
potassium channels. Nature 395:503–507.
Yao X, Kwan HY. (1999). Activity of voltage-gated K+ channels is associated
with cell proliferation and Ca2+
influx in carcinoma cells of colon cancer. Life
Sci. 65:55–62.
Yellen, G. (1984). Ionic permeation and blockade in Ca2+-activated K+
channels of bovine chromaffin cells. J Gen Physiol 84(2): 157-86.
Yellowley CE, Hancox JC, Skerry TM, and Levi AJ. (1998). Whole-cell
membrane currents from human osteoblast-like cells. Calcif Tissue Int 62: 122-
132.
Zanello LP, and Norman A (2006). 1α, 25(OH)2 Vitamin D3 actions on ion
channels in osteoblasts. Steroids 71: 291-297.
Zhou, Y., Morais-Cabral J. H., Kaufman A., and MacKinnon R. (2001).
Chemistry of ion coordination and hydration revealed by a K+ channel-Fab
complex at 2.0 A resolution. Nature. 414:43–48.


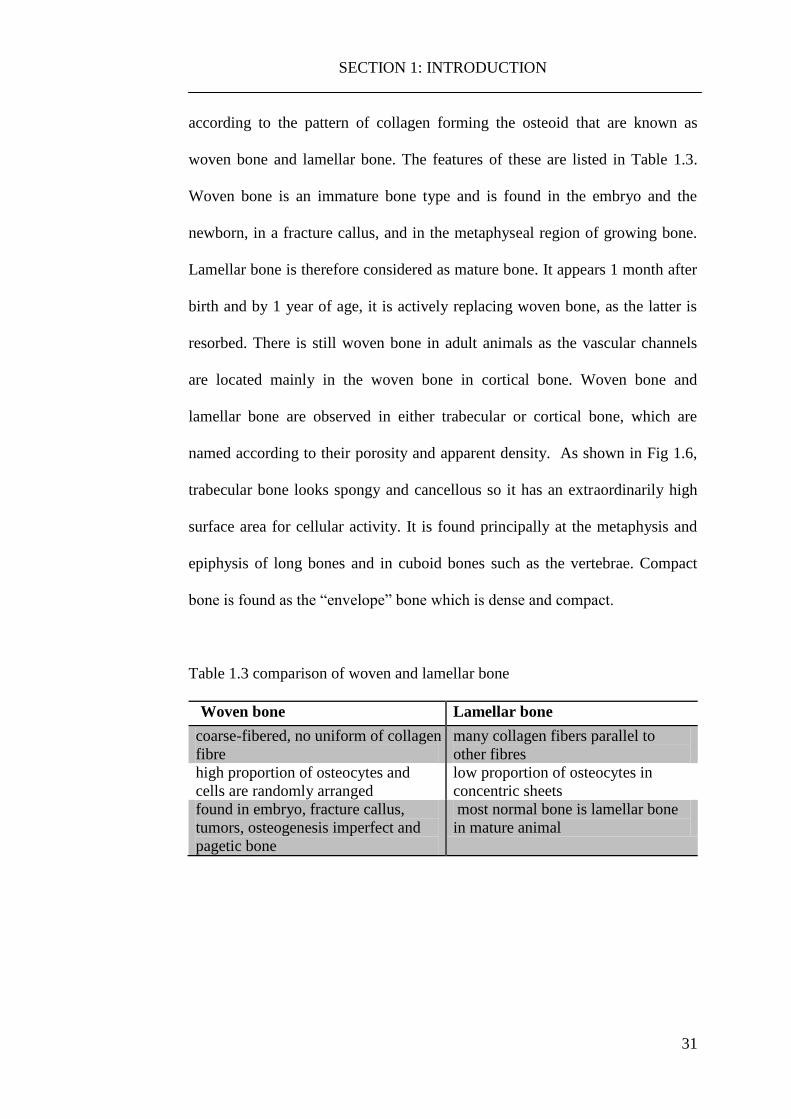


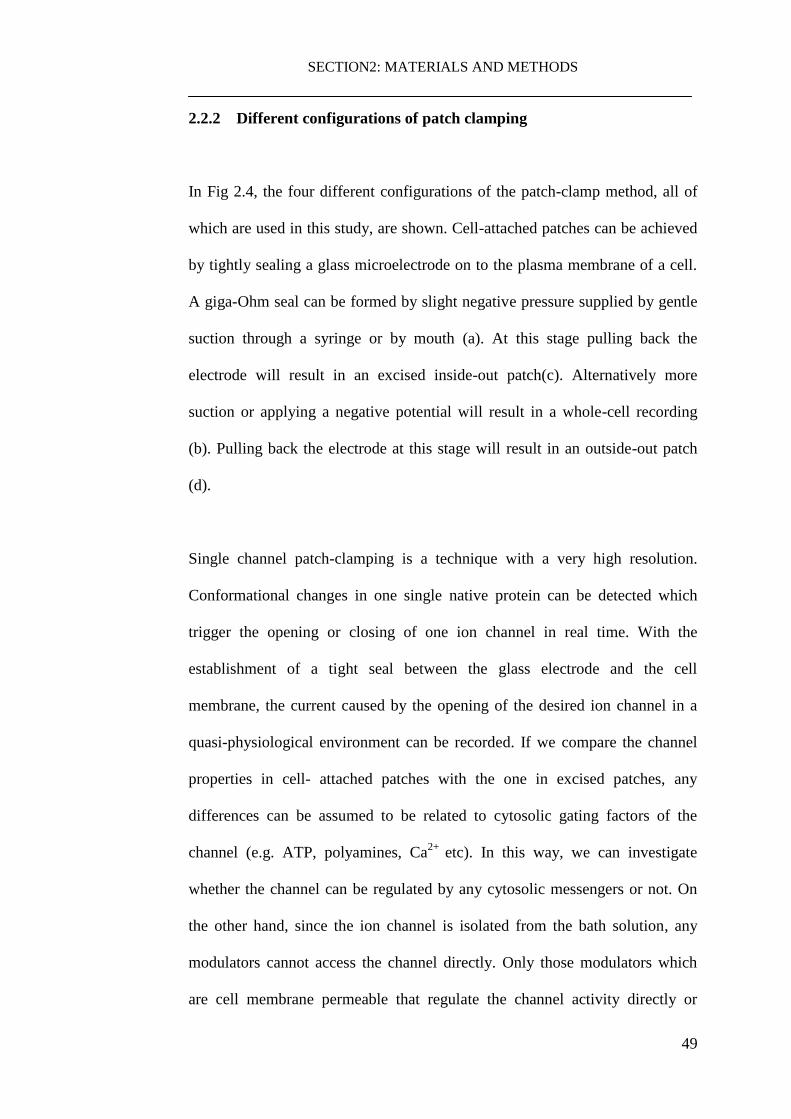


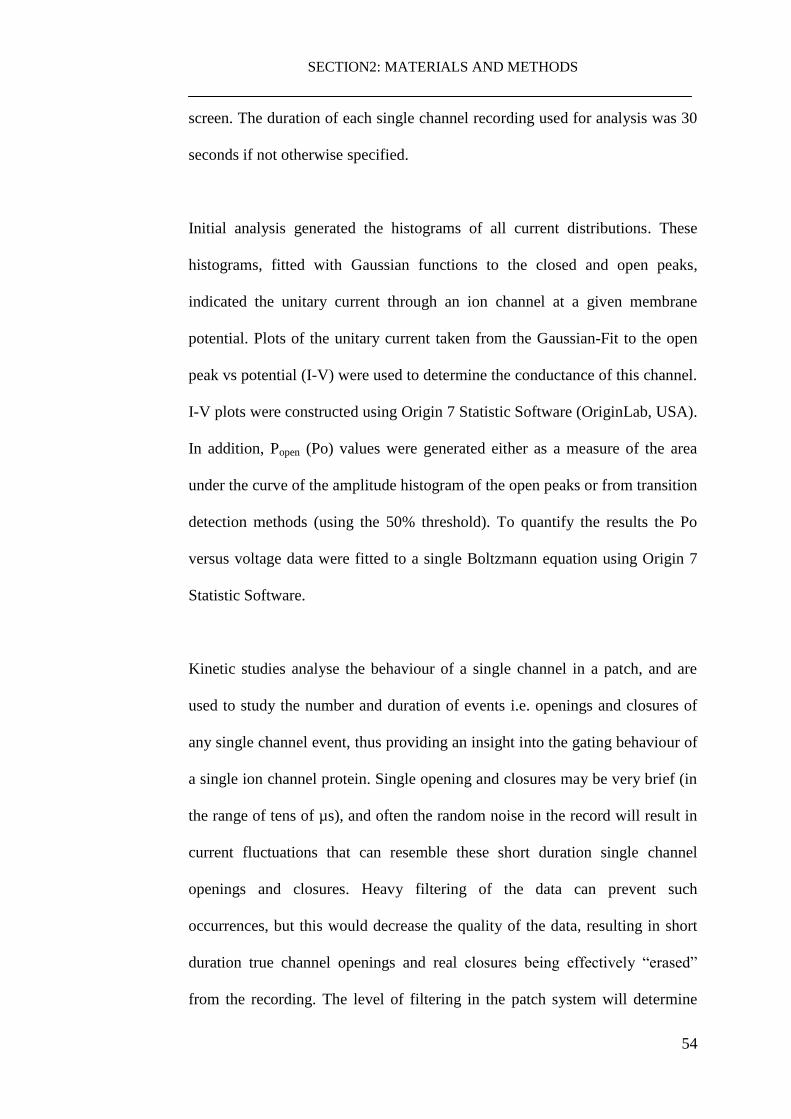


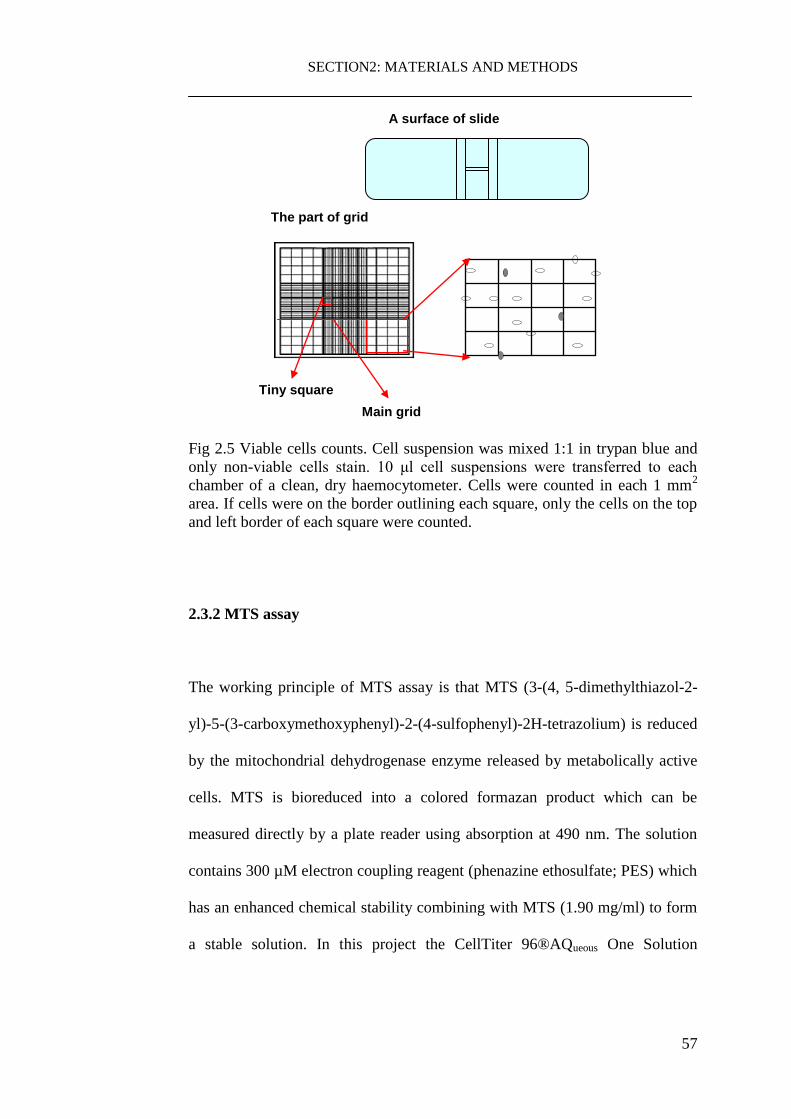


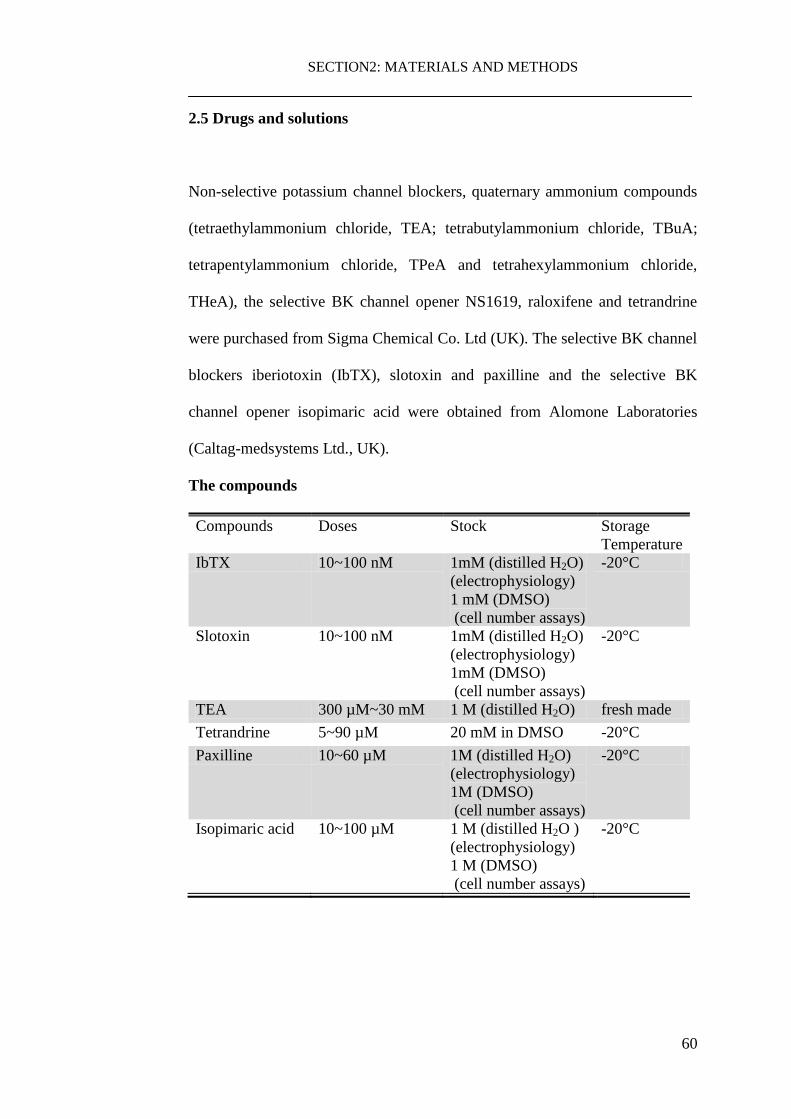


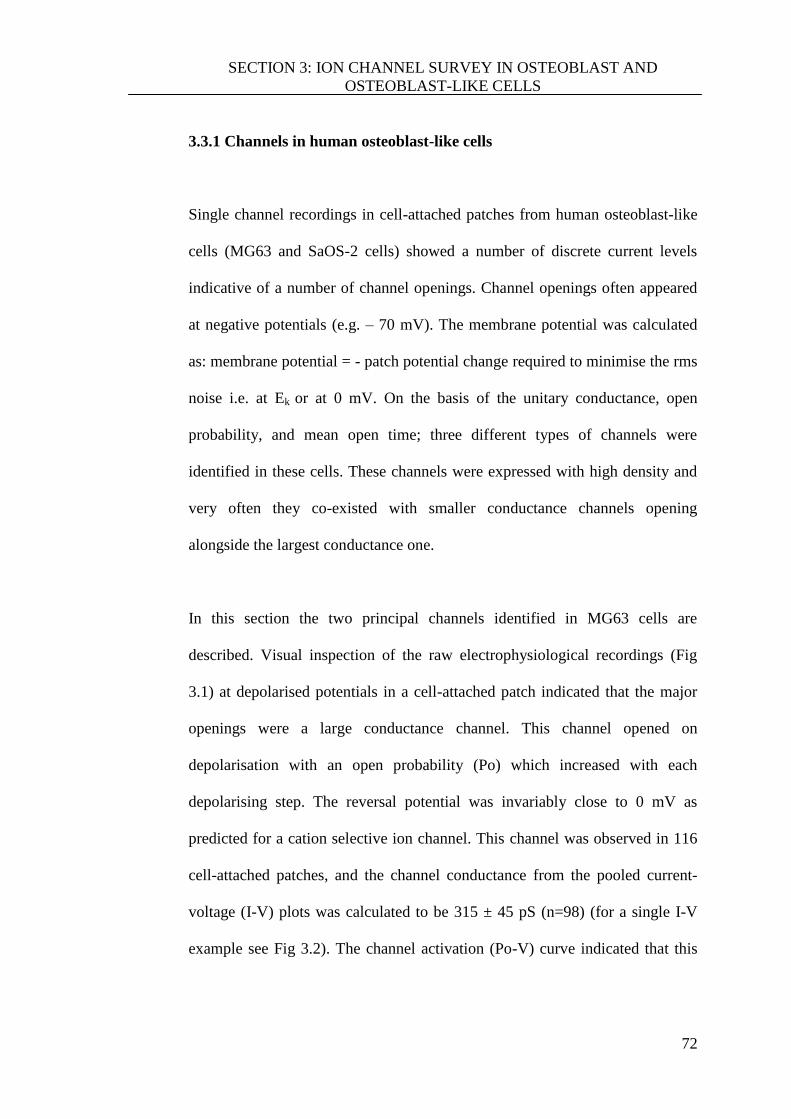


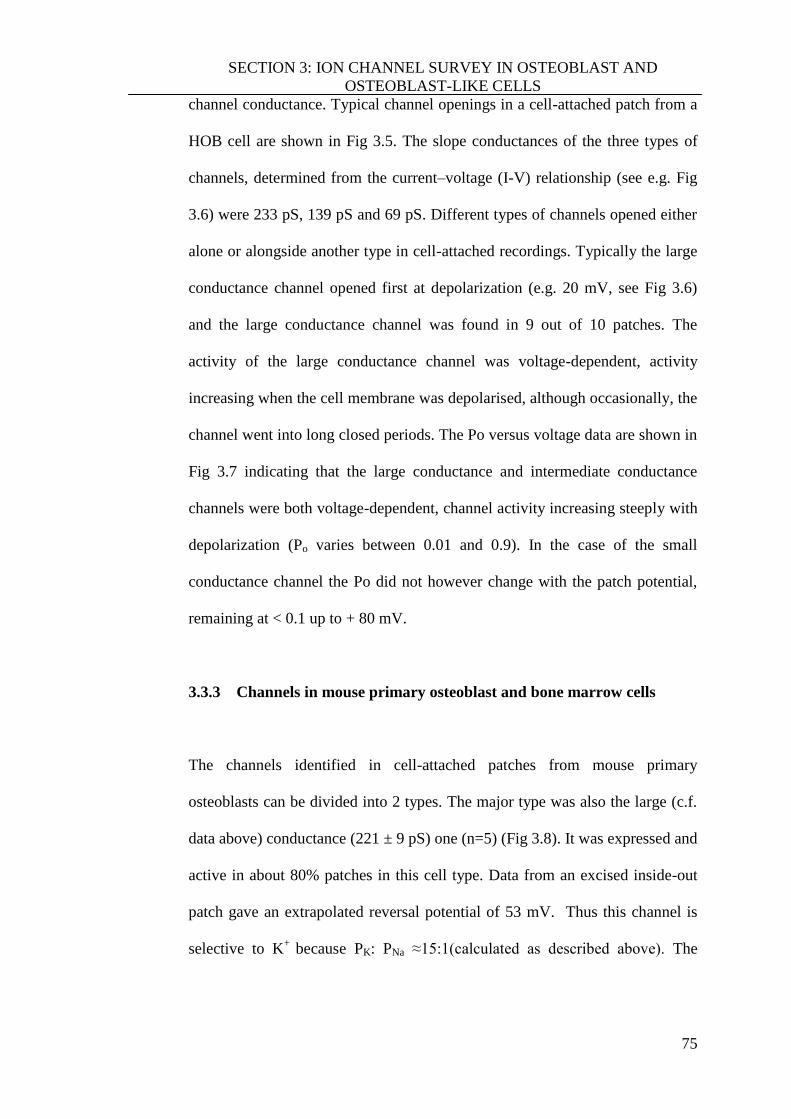


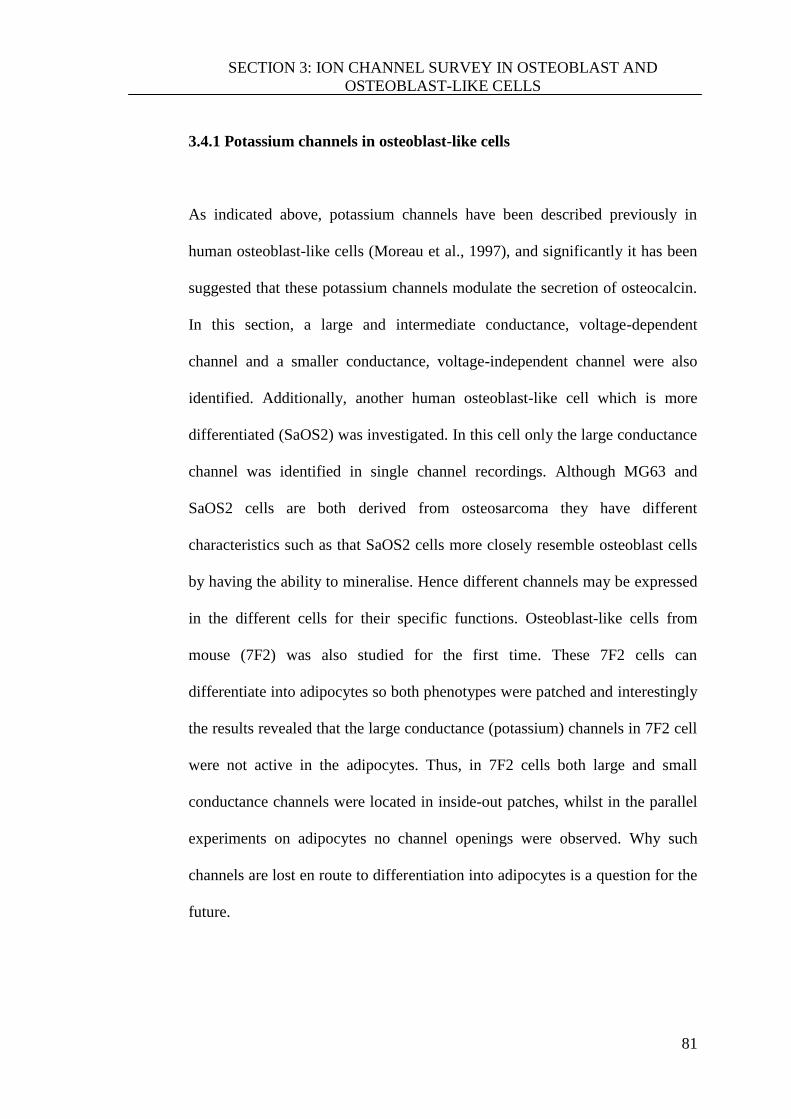


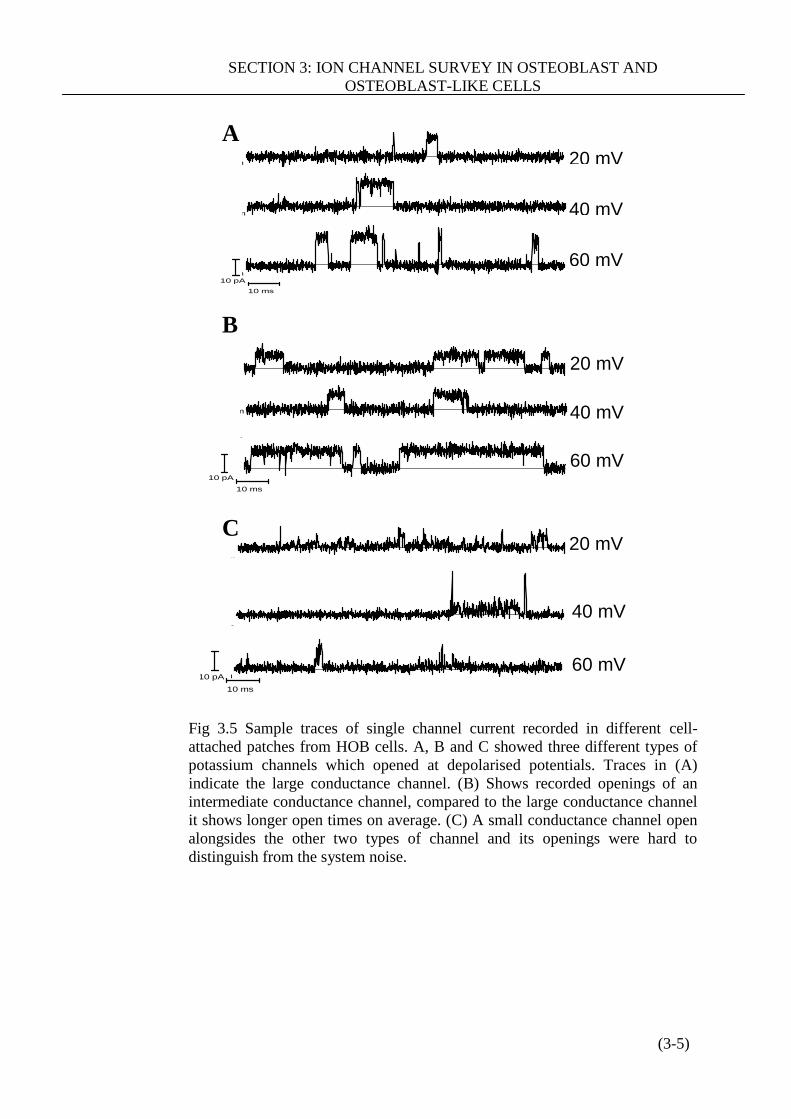


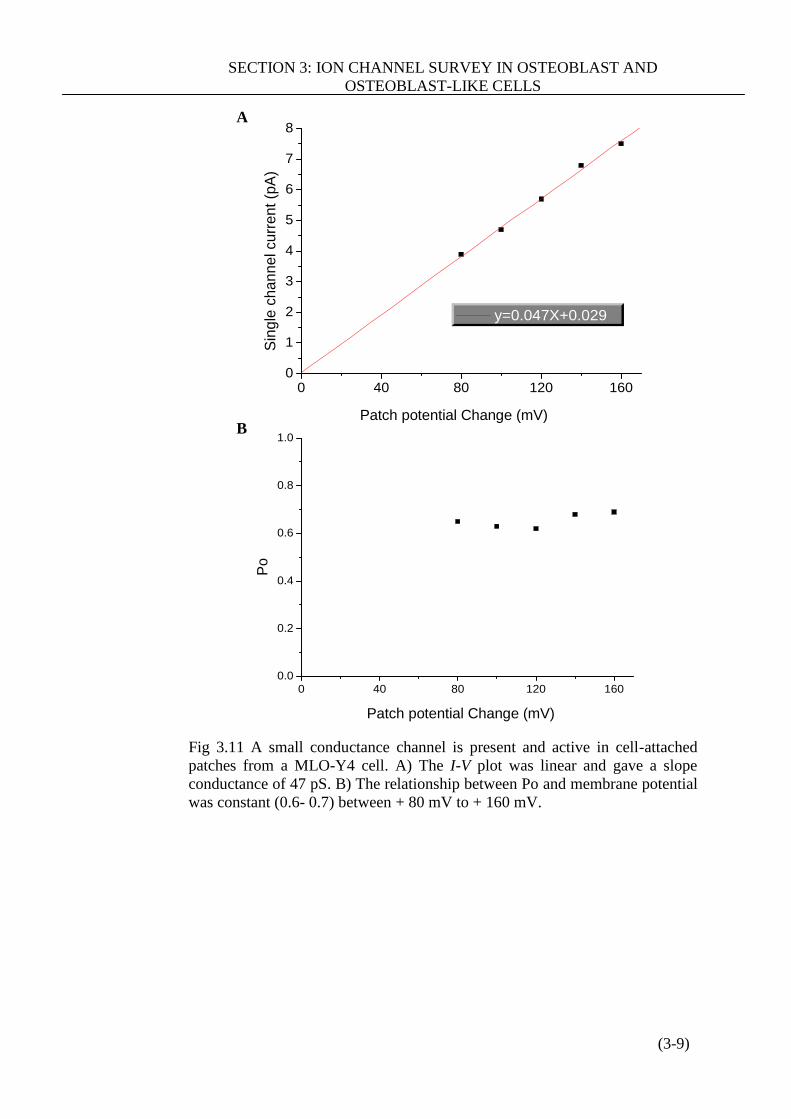


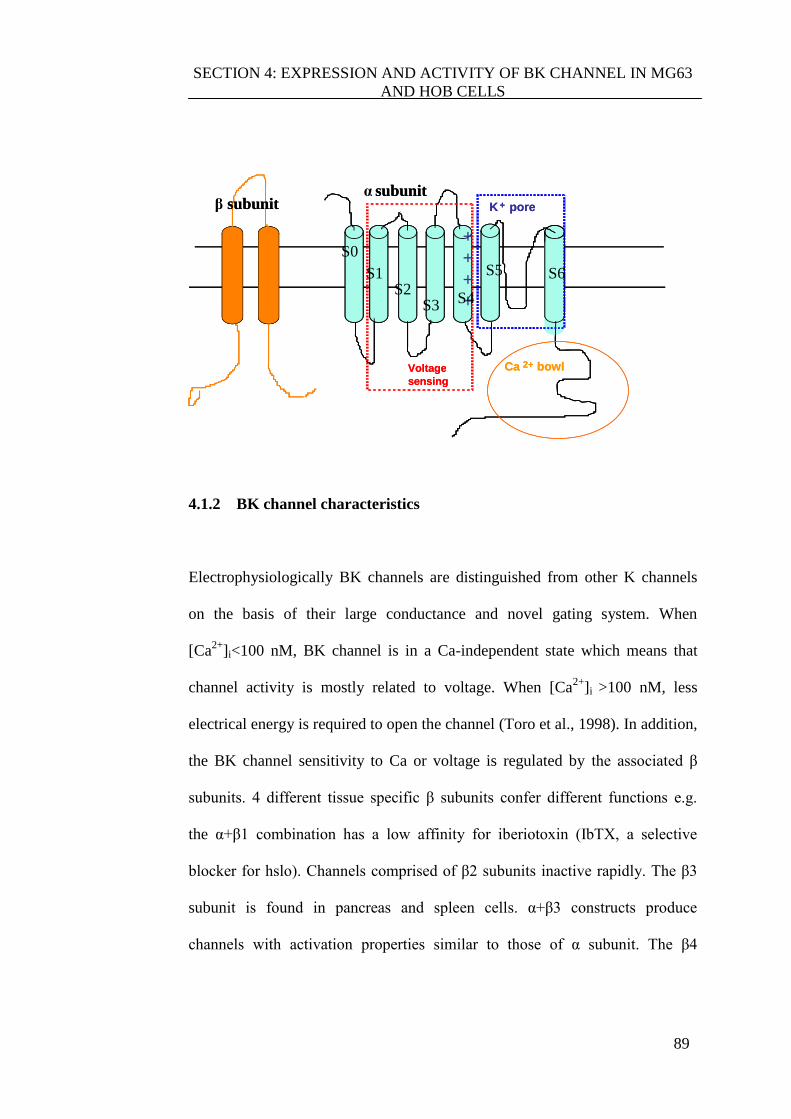


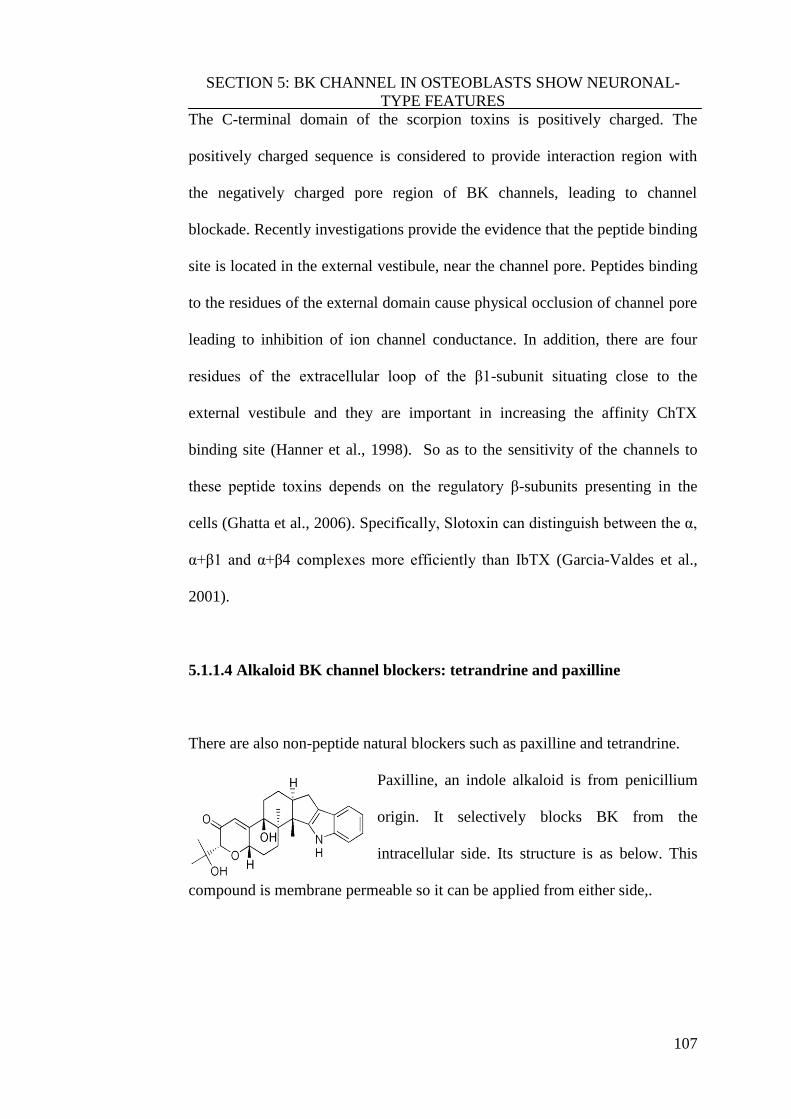


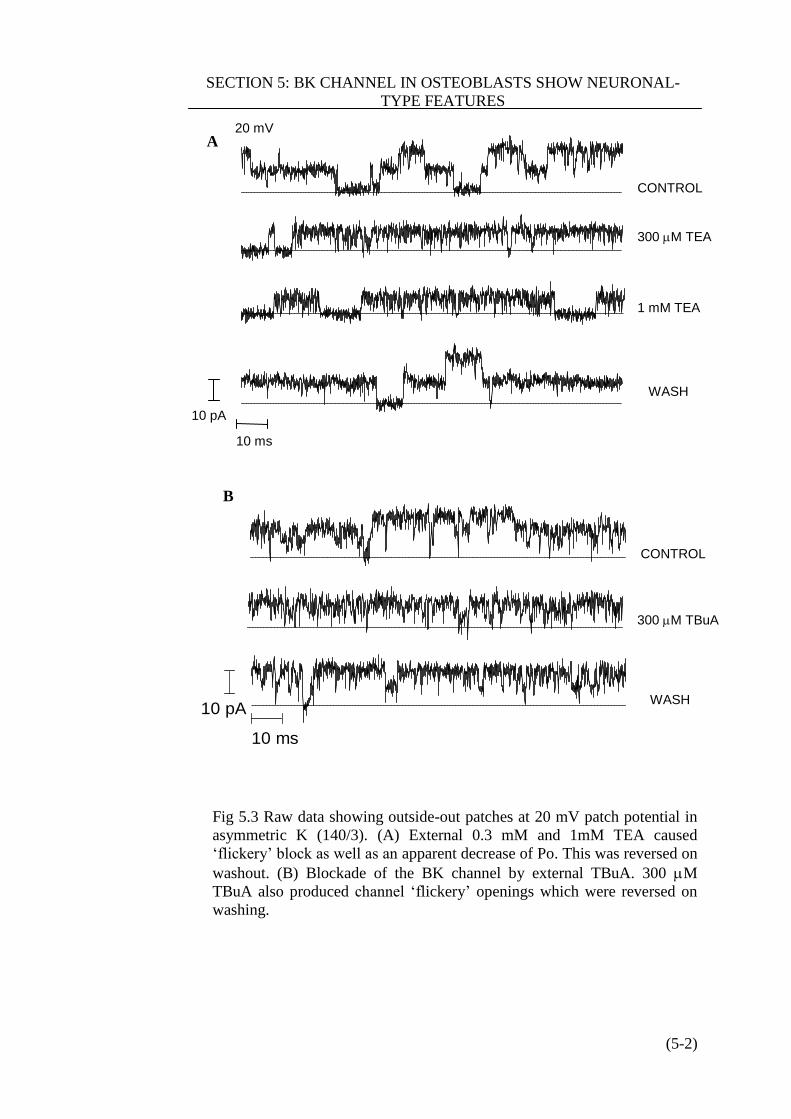


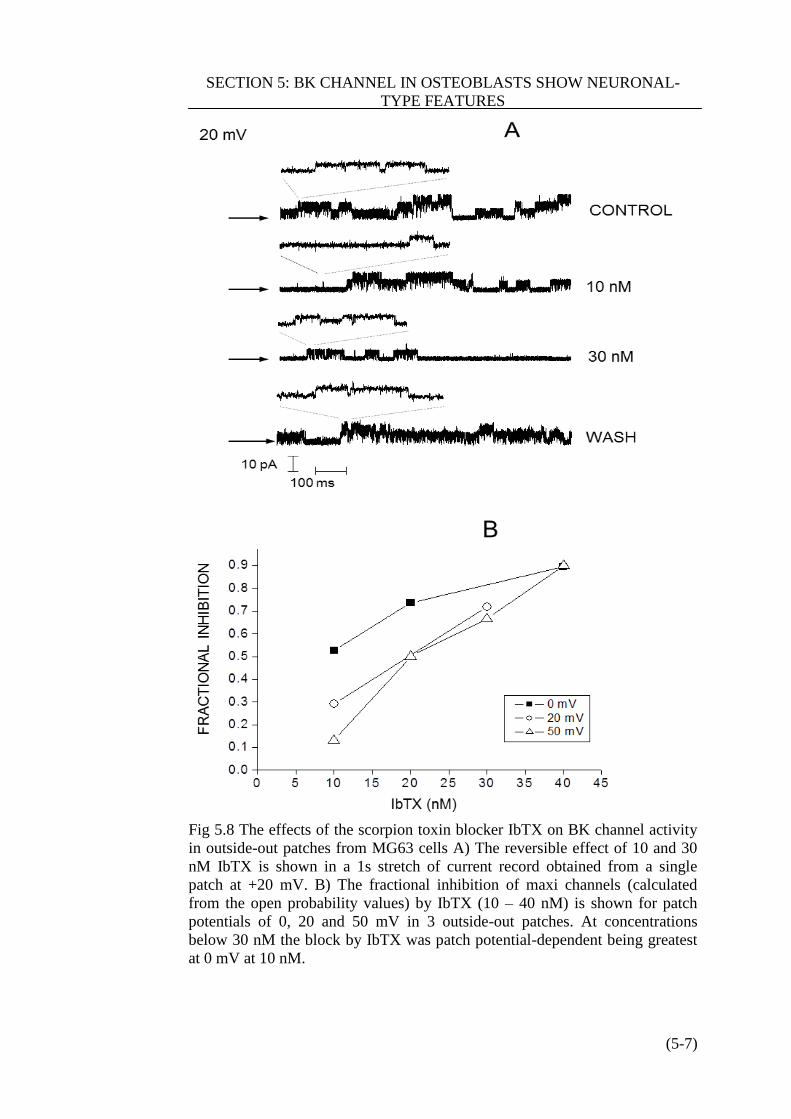


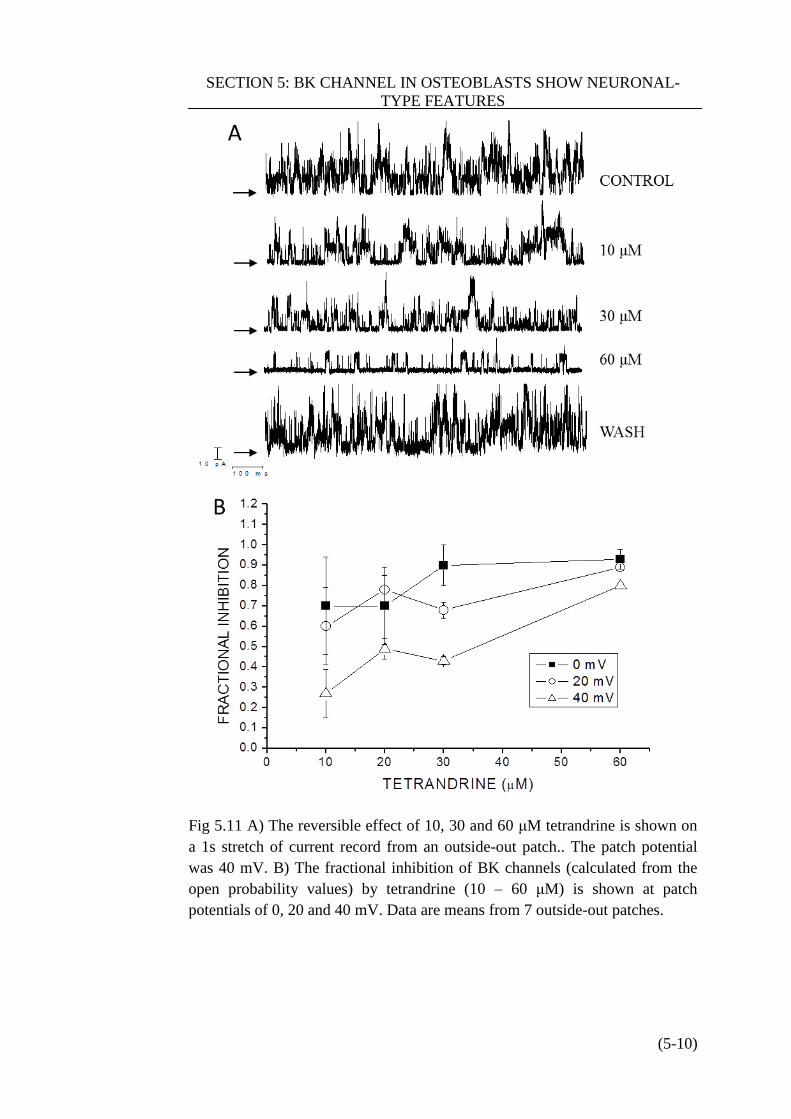


![Inhibiting of Proliferation, Migration, and Invasion in Lung Cancer … · 2019. 7. 30. · a player in many cellular functions such as adhesion and proliferation []. It is also important](https://static.documents.pub/doc/80x56/61199694301423358d066ed1/inhibiting-of-proliferation-migration-and-invasion-in-lung-cancer-2019-7-30.jpg)


