The role of dew as a night-time reservoir and morning source foratmospheric ammoniaGregory R. Wentworth1, Jennifer G. Murphy1, Katherine B. Benedict2, Evelyn J. Bangs2, and Jeffrey L. Collett Jr.21Department of Chemistry, University of Toronto, 80 St. George Street, M5S 3H6, Toronto, ON, Canada2Department of Atmospheric Science, Colorado State University, 3915 W. Laporte Ave., 80523, Fort Collins, CO, USA
Received: 24 February 2016 – Published in Atmos. Chem. Phys. Discuss.: 7 March 2016Revised: 20 May 2016 – Accepted: 1 June 2016 – Published: 15 June 2016
Abstract. Several field studies have proposed that thevolatilization of NH3 from evaporating dew is responsiblefor an early morning pulse of ammonia frequently observedin the atmospheric boundary layer. Laboratory studies con-ducted on synthetic dew showed that the fraction of ammo-nium (NH+4 ) released as gas-phase ammonia (NH3) duringevaporation is dependent on the relative abundances of an-ions and cations in the dew. Hence, the fraction of NH3 re-leased during dew evaporation (Frac(NH3)) can be predictedgiven dew composition and pH. Twelve separate ambientdew samples were collected at a remote high-elevation grass-land site in Colorado from 28 May to 11 August 2015. Av-erage [NH+4 ] and pH were 26 µM and 5.2 respectively andwere on the lower end of dew [NH+4 ] and pH observationsreported in the literature. Ambient dew mass (in g m−2) wasmonitored with a dewmeter, which continuously measuredthe mass of a tray containing artificial turf representative ofthe grass canopy to track the accumulation and evaporationof dew. Simultaneous measurements of ambient NH3 indi-cated that a morning increase in NH3 was coincident in timewith dew evaporation and that either a plateau or decreasein NH3 occurred once the dew had completely evaporated.This morning increase in NH3 was never observed on morn-ings without surface wetness (neither dew nor rain, represent-ing one-quarter of mornings during the study period). Dewcomposition was used to determine an average Frac(NH3) of0.94, suggesting that nearly all NH+4 is released back to theboundary layer as NH3 during evaporation at this site. Anaverage NH3 emission of 6.2 ng m−2 s−1 during dew evap-oration was calculated using total dew volume (Vdew) andevaporation time (tevap) and represents a significant morn-ing flux in a non-fertilized grassland. Assuming a boundary
layer height of 150 m, the average mole ratio of NH+4 in dewto NH3 in the boundary layer at sunrise is roughly 1.6± 0.7.Furthermore, the observed loss of NH3 during nights withdew is approximately equal to the observed amount of NH+4sequestered in dew at the onset of evaporation. Hence, thereis strong evidence that dew is both a significant night-timereservoir and strong morning source of NH3. The possibil-ity of rain evaporation as a source of NH3, as well as dewevaporation influencing species of similar water solubility(acetic acid, formic acid, and HONO), is also discussed. Ifrelease of NH3 from dew and rain evaporation is pervasivein many environments, then estimates of NH3 dry depositionand NHx (≡NH3+NH+4 ) wet deposition may be overesti-mated by models that assume that all NHx deposited in rainand dew remains at the surface.
1 Introduction
Ammonia (NH3) is the most prevalent alkaline gas in the at-mosphere and has important implications for both climateand air quality (Seinfeld and Pandis, 2006). For instance,NH3 partitions to acidic fine particulate matter (PM2.5,aerosol with diameter < 2.5 µm) to form particulate-phaseammonium (NH+4 ), which alters aerosol properties such ashygroscopicity (Petters and Kreidenweis, 2007) and scat-tering efficiency (Martin et al., 2004). High atmosphericloadings of PM2.5 can lead to adverse health effects (Popeet al., 2002) as well as reduced visibility. NH3 is primar-ily emitted to the atmosphere through agricultural activi-ties (e.g. fertilization, animal husbandry) in addition to nat-ural sources (e.g. soil, vegetation, oceans, volcanoes, wild-
Published by Copernicus Publications on behalf of the European Geosciences Union.
7436 G. R. Wentworth et al.: Dew as a reservoir and morning source for ammonia
fires) and other anthropogenic sources (vehicles and indus-try) (Reis et al., 2009). Deposition of atmospheric NHx(≡NH3+NH+4 ) can cause eutrophication and soil acidifi-cation in sensitive ecosystems (Krupa, 2003). Hence, thereis great interest in being able to accurately model sources,sinks, and reservoirs of NHx .
A common feature in the diurnal cycle of atmosphericNH3 mixing ratios is a morning increase or “spike” that typi-cally occurs around 07:00–10:00 LT. Frequently observed inmany environments, current hypotheses to explain the morn-ing NH3 increase include dew evaporation (Gong et al., 2011;Wentworth et al., 2014; Wichink Kruit et al., 2007), plantand/or soil emissions (Bash et al., 2010; Ellis et al., 2011),mixing down of NH3-rich air during the break-up of thenocturnal boundary layer (Walker et al., 2006), and automo-bile emissions during morning rush hour (Gong et al., 2011;Löflund et al., 2002; Nowak et al., 2006; Whitehead et al.,2007). Several field studies have indicated that NH3 desorp-tion from microscopic water films on leaf surfaces can yieldsignificant fluxes (Burkhardt et al., 2009; Flechard et al.,1999; Neirynck and Ceulemans, 2008; Sutton et al., 1998);therefore, it is reasonable to suggest that macroscopic dewdroplets have the same effect. Wentworth et al. (2014) ob-served a larger morning increase following nights with highrelative humidity (RH, a surrogate for dew) and WichinkKruit et al. (2007) found increasing upward fluxes as soonas the canopy began to dry as measured by a leaf wetnesssensor.
Dew generally forms during calm, clear nights when ra-diative cooling of the surface favours the condensation ofwater (Richards, 2004). Formation typically starts shortly af-ter sunset and lasts until sunrise when surface heating anda drop in RH initiate evaporation. Over the last 5 decades,several dozen studies have characterized dew compositionand have found that NH+4 is a ubiquitous constituent of dewand, in some environments, can be the most abundant cation(e.g. Polkowska et al., 2008; Wagner et al., 1992; Yaalon andGanor, 1968; Yadav and Kumar, 2014). Average [NH+4 ] re-ported in dew ranges from 25 µM (Lekouch et al., 2010) to1600 µM (Yadav and Kumar, 2014). The composition of dewis primarily controlled by dissolution of water-soluble gases(e.g. NH3, HNO3, CO2, SO2) and deposition of coarse modeparticles (larger than PM2.5 but smaller than 10 µm in diam-eter) (Takeuchi, 2003).
Field-scale models typically allow NH3 to only depositon leaf cuticles (i.e. it cannot desorb) and use an empiri-cally derived function of RH and cuticle acidity to calcu-late a cuticle deposition velocity. This parameterization ac-counts for enhanced deposition to acidic water films on leafsurfaces. There are only a handful of field-scale NH3 mod-els that allow for desorption of NH3 from drying water filmson leaf cuticles (Burkhardt et al., 2009; Flechard et al., 1999;Neirynck and Ceulemans, 2008; Sutton et al., 1998). Threeof these studies (Flechard et al., 1999; Neirynck and Ceule-mans, 2008; Sutton et al., 1998) compared models with and
without cuticle desorption and found that allowing for NH3emission from water films on cuticles agrees better with ob-served fluxes during the morning. Other field-scale measure-ments attribute discrepancies between measured and mod-elled morning fluxes to NH3 emission during the drying ofcanopies (e.g. Bash et al., 2010; Walker et al., 2013; Wyersand Erisman, 1998). Most larger-scale (regional or global)chemical transport models (CTMs) still employ highly sim-plified deposition schemes for NH3 using look-up tables fordeposition velocity and canopy resistance terms (Wesely,1989). In other words, they treat deposition and emissionof NH3 independently despite abundant field evidence thatthese processes are often highly coupled. However, some re-cent studies have successfully incorporated a bi-directionalNH3 exchange framework into regional and global CTMs(Bash et al., 2013; Wichink Kruit et al., 2012; Zhu et al.,2015).
Although most NH3 surface–air exchange studies accountfor enhanced deposition to microscopic water films and sev-eral even model NH3 desorption, far fewer have attemptedto assess the role that macroscopic dew has on influencingNH3 fluxes. This partly stems from the inherent difficulty inmeasuring dew amount, composition, and pH. Only a fewNH3 surface–air exchange studies have attempted to measuredew composition and pH, doing so by manually collectingenough individual droplets in pipettes to perform bulk anal-yses (Bash et al., 2010; Burkhardt et al., 2009; Walker et al.,2013). To constrain dew amount, Burkhardt et al. (2009) usedan empirically derived relationship to approximate water filmthickness from a leaf wetness sensor. Walker et al. (2013) es-timated dew amount by difference in water mass betweenwet and dried leaves. Both studies acknowledge the large un-certainties associated with these methods for estimating totaldew amount in the canopy. Regardless, Walker et al. (2013)estimated a maximum flux of 17.6 ng NH3 m−2 s−1 from dewevaporation in a fertilized corn canopy. One key assumptionin this calculation is that all of the NH+4 present in dew isreleased as NH3 during evaporation.
Few studies have examined the fate of semi-volatile so-lutes (e.g. NH+4 /NH3, NO−2 /HONO, acetate/acetic acid)in rain, cloud, fog, or dew during droplet evaporation. Tak-enaka et al. (2009) studied the chemistry of drying aqueoussalts in a series of lab experiments and found that the frac-tion of “volatile” anions (which they operationally definedas NO−2 , acetate, and formate) remaining on the surface asa salt upon evaporation depends on the relative equivalentsof “non-volatile” cations (Na+, K+, Mg2+, and Ca2+) and“non-volatile” anions (Cl−, NO−3 , and SO2−
4 ). The fractionof volatile anion (X−) that is released during evaporation (asHX(g)) can then be predicted using the following equation(Takenaka et al., 2009):
G. R. Wentworth et al.: Dew as a reservoir and morning source for ammonia 7437
where Frac(X) is the fraction of the initial anion released tothe atmosphere during evaporation, [X]i is the initial equiva-lents of “volatile” anionX, and6cations and6anions are thesums of “non-volatile” cations and anions respectively. Theauthors performed numerous experiments for NO−2 , acetate,and formate under a wide range of solute concentrations andpH values and found that Eq. (1) was consistently able to pre-dict the fraction of each constituent liberated during evapora-tion of aqueous salt solutions. Although not the focus of thework, Takenaka et al. (2009) also performed some evapora-tion experiments on solutions containing NH+4 and were ableto predict Frac(NH3) with an analogous equation:
Frac(NH3)=[NH4
+]i − (6anions−6cations)[NH4
+]i, (2)
where [NH+4 ]i is the initial ammonium concentration in thesolution.
Few field studies have simultaneously quantified bothdew and atmospheric composition. He et al. (2006) ob-served HONO emission from a drying forest canopy andperformed lab studies to show that, on average, ∼ 90 % ofNO−2 was released as HONO during droplet evaporation. Ru-bio et al. (2009, 2012) found positive correlations betweenformaldehyde, phenols, and HONO in dew and the atmo-sphere. However, none of these studies, or those mentionedearlier for NH3, accurately measured dew amount (in g m−2)
on the surface, so the relative abundances of the analyte inthe dew and gas phase could not be reliably calculated.
Therefore, great uncertainty exists regarding the influenceof dew on boundary layer composition, particularly with re-spect to NH3 mixing ratios. Motivated by the paucity ofdata on dew–atmosphere NH3 fluxes, as well as uncertaintiesabout the origin(s) of the frequently observed yet currentlyunexplained morning NH3 spike, the specific goals of thisstudy are as follows:
– Determine the fate of NH+4 during dew evaporation(Sect. 3.1). What is the ratio of NHx released as NH3vs. NH+4 remaining on the surface as a non-volatile salt?What factor(s) govern this ratio?
– Simultaneously quantify dew amount, NH3 mixing ra-tio, and dew composition at the onset of evaporation ata field site (Sect. 3.2).
– Calculate the relative abundance of NH+4 in dew andNH3 in the boundary layer, as well as NH3 fluxes fromdew evaporation (Sect. 3.3). Is dew a significant night-time sink or reservoir for NH3? Is NH3 release from dewan important morning source?
– Evaluate whether NH3 is also released during rain evap-oration (Sect. 3.4).
– Assess the impact of dew evaporation for other water-soluble gases (Sect. 3.5).
2 Materials and methods
2.1 Drying chamber
A drying chamber was used to determine the fraction of NH+4lost as NH3 during droplet evaporation and was based onthe set-up used by Takenaka et al. (2009). The set-up con-sists of a zero air cylinder (AI Z300, AirGas) and mass flowcontroller which deliver zero air at a controlled flow rateinto a drying chamber (URG-2000-30H, URG Corp.) con-taining droplets of synthetic dew. Downstream of the dryingchamber is an annular denuder (URG-2000-30, URG Corp.)coated with a phosphorous acid solution (10 g H3PO3 in100 mL deionized water and 900 mL HPLC grade methanol)to capture any NH3 emitted during dew drying.
At the beginning of each experiment, 26 droplets (20 µLeach) of synthetic dew were deposited in the drying cham-ber and dried over the course of several hours by exposureto a flow of 2 L min−1 of zero air. Immediately after thelast droplet had dried, the residue remaining in the cham-ber was extracted twice using two separate 10 mL aliquotsof deionized water (18.2 M� cm−1) and vigorous wash-ing. The second aliquot always contained < 10 % of eachanalyte relative to the first aliquot. The annular denuderwas extracted by adding 10 mL of deionized water and ro-tating for 10 min. Concentrations of ions in all three ex-tracts were quantified using ion chromatography (IC) sys-tems (DX-500, Dionex Inc.) and an isocratic elution scheme(1.8 / 1.7 mM Na2CO3 /NaHCO3 solution for anions and0.020 mM methanesulfonic acid solution for cations). ThepH of the dew was determined using a commercial pH metre(Orion Model 250A, Thermo Scientific). The fraction of eachanalyte remaining in the salt residue was then calculated, aswell as the fraction of ammonium lost as NH3 based on thetotal NHx amount measured in the three aliquots.
Experimental parameters (composition, pH, and dryingtime) were varied to determine the factor(s) responsible forthe fraction of NH3 that is released from dew as it dries. Syn-thetic dew was prepared by dissolving salts in deionized wa-ter to the desired concentration. All salts were reagent grade,obtained from Sigma Aldrich, and used without further pu-rification. The pH was then adjusted with either concentratedacid (HCl) or base (NaOH). A total of nine different syntheticdew were prepared to mimic ambient dew composition re-ported from previous studies (e.g. Lekouch et al., 2010; Tak-enaka et al., 2003; Yadav and Kumar, 2014). The pH and con-centrations of the nine synthetic dew are listed in Table S1 inthe Supplement.
Synthetic dew was deposited as 20 µL droplets, whichcorresponds to a hemispherical diameter of ∼ 4.25 mm.Takeuchi et al. (2002) found that the diameter of most dewdroplets range from 0.8 to 1.0 mm in diameter; however, ap-plying such small droplets would bring the concentrationof the extracts below detection limit. In order to maintainsolute concentrations relevant to ambient dew, but generate
7438 G. R. Wentworth et al.: Dew as a reservoir and morning source for ammonia
sufficient signal for analysis, it was necessary to use 20 µLdroplets. The impact of larger droplet size on NH3 liberationwas tested by performing several drying experiments on four140 µL drops (∼ 8.1 mm in diameter). These larger dropletshad no effect on the fraction of NH3 emitted relative to the20 µL droplets.
2.2 Field site
Ambient measurements of dew composition, dew volumeand gas-phase NH3 were obtained at a field site situatedon the eastern edge of Rocky Mountain National Park(RMNP) in Northern Colorado (40.2783◦ N, 105.5457◦W;2784 m a.s.l.) from 28 May to 31 August 2015. The field siteis remote with the nearest town (Estes Park, CO, popula-tion ∼ 6000) located approximately 14 km north. This site isalso used by the Interagency Monitoring of Protected VisualEnvironments (IMPROVE) and EPA Clean Air Status andTrends Network (CASTNet) programs for air quality moni-toring and has been the location of extensive studies on ni-trogen deposition (Beem et al., 2010; Benedict et al., 2013a)and atmospheric reactive nitrogen (Benedict et al., 2013b).The field site is a grassland clearing approximately 150 min diameter surrounded by a mixed aspen and pine forest(average summertime maximum leaf area index of 1.5). Inaddition, excessive nitrogen deposition at RMNP has beenlinked to ecological impacts including changes in diatom as-semblages (Baron, 2006; Wolfe et al., 2003) and shifts in adry alpine meadow community (Bowman et al., 2012). Re-cently, Nanus et al. (2012) suggested that the critical load fornitrogen deposition (a value beyond which negative ecolog-ical impacts are observed) has been exceeded in ∼ 21 % ofthe Rocky Mountains. The existing body of knowledge re-garding reactive nitrogen at RMNP makes this site ideal toexamine how dew–atmosphere interactions affect NH3 in theboundary layer as well as its deposition.
2.3 Atmospheric measurements
NH3 was measured using a Picarro G1103 Analzyer, a cav-ity ring-down spectroscopy instrument. The inlet line was3.56 cm diameter Teflon tubing located approximately 2.5 mabove ground level. The entire length of the 0.61 m inlet linewas insulated and heated to 40 ◦C to minimize wall losses.A filter (Picarro P/N S1021) was placed on the end of theinlet to prevent particles from entering the instrument. Thefilter was also heated, which may have caused NH4NO3 tovolatilize from the filter or air stream, resulting in an overes-timation of the ammonia concentration. However, a previousstudy at the site found that, on average, only a small fractionof particulate NH+4 exists as NH4NO3 during the summer(Benedict et al., 2013b). Furthermore, the same study foundthat NH3 was the majority of the NHx (≡NH3+NH+4 ) load-ing. Hence, it is unlikely that there is a large interferencefrom NH4NO3 volatilization.
Calibrations were performed twice during the field deploy-ment using MKS mass flow controllers, a certified 2 ppmNH3 cylinder (AirGas), and a zero air source (Teledyne ZeroAir Generator Model 701). The calibration gas was split be-tween the Picarro and a phosphorous acid (10 %w/v) coateddenuder to act as a check of the concentration. The denuderwas sampled at 2 L min−1 and the total volume was recordedusing a dry gas metre. The concentration determined by thedenuder was used as the “true” concentration in the calibra-tion curve.
Meteorological measurements were made at the site by a10 m tower operated by the National Park Service. Measure-ments are reported at 1 h intervals for solar radiation, temper-ature, wind speed, wind direction, standard deviation of thewind direction over the period, relative humidity, and rain-fall.
2.4 Dew measurements
Ambient dew samples at RMNP were gathered using a dewcollector with a design similar to Guan et al. (2014). The col-lector was built in-house and consists of a wooden base thatsupports a 7 cm thick polystyrene foam block with an areaof 48× 60 cm. The top surface of the polystyrene block iscovered by a 0.2 mm thick polytetrafluoroethylene (Teflon®)sheet. The Teflon® sheet is parallel to the ground at a heightof 30 cm. During the night the Teflon® sheet undergoes ra-diative cooling while the polystyrene insulates the sheet frombelow. This results in dew formation on the Teflon® surfacewhich can be manually collected into clean sample bottlesthe following morning using a pre-cleaned scraper and fun-nel. The emissivity of Teflon® is 0.94 (Baldridge et al., 2009)and is very similar to that of vegetation (0.95) (Guan et al.,2014).
The dew collector was deployed before dusk on nights thathad a forecast favourable for dew formation (high relative hu-midity, light winds, and clear skies). The Teflon® surface wascleaned immediately before deployment in a two-step pro-cess: (1) splashing ∼ 1 L of deionized water across the sur-face, followed by (2) squirting ∼ 30 mL of deionized wateron the surface and scraping it off using a plastic scraper. Thelatter step was repeated 10 times, and the tenth rinse was col-lected and used as a field blank for dew collected the follow-ing morning. Prior to dew collection, the funnel and scraperwere rinsed 10 times with deionized water. This cleaning pro-cedure proved sufficient and is similar to prior studies usinga similar collector (e.g. Okochi et al., 2008; Wagner et al.,1992). Dew samples were collected into 15 mL polypropy-lene sample bottles in order to minimize headspace duringtransport and storage.
When rain had occurred during the night, then rain sam-ples were also collected off of the dew collector in a simi-lar fashion the following morning. Rain samples were unam-biguously identified using data from the dewmeter describedbelow.
G. R. Wentworth et al.: Dew as a reservoir and morning source for ammonia 7439
Chemical analyses of all dew samples were performedwithin 6 h of collection, with the exception of one samplewhich was stored at 4 ◦C and analysed 48 h later. The con-centration of ions (Na+, NH+4 , K+, Mg2+, Ca2+, Cl−, NO−2 ,NO−3 , SO2−
4 , PO3−4 , acetate, formate, and oxalate) in dew
samples was determined through ion chromatography andpH was measured with a pH metre, as outlined in Sect. 2.1.The total organic carbon (TOC) and inorganic carbon (IC)were quantified with a commercial TOC analyser (TOC-VCSH, Shimadzu Corp.) equipped with a total nitrogen (TN)analyser (TNM-1, Shimadzu Corp.) for quantification of TN.Concentrations of analytes in ambient dew samples werebackground corrected by subtracting the volume-weightedconcentration in the tenth rinse collected the prior evening,which is likely an upper bound for the background signalgiven that some volatile solutes will be scavenged from theair during application and collection of the rinse.
It was also necessary to quantify the volume of dew (Vdew)
that formed each night. The dew collector is not suitablesince Vdew obtained from the collector is not necessarilyrepresentative of Vdew that forms naturally on the grasslandcanopy at RMNP. Numerous methods and instruments existto measure Vdew; for instance, the cloth-plate method (Ye etal., 2007), lysimeter-related instruments (Grimmond et al.,1992; Price and Clark, 2014), and eddy-correlation tech-niques (Moro et al., 2007). Although there is no standardmethod to measure Vdew, Richards (2004) provides a detailedoverview of various techniques that have been used to collectand quantify dew.
For this study, we constructed a dewmeter similar to thatof Price and Clark (2014). The design consists of a circularcollection tray (diameter of 35 cm) that is attached to the topof an analytical balance (HRB 3002, LWC Measurements).The balance has a resolution of 0.01 g and a maximum loadof 3000 g. The tray contains artificial turf that is intended tobe representative of the grass at the RMNP field site duringthe early part of the growing season. The balance was con-tained in a weatherproof box with a hole cut in the lid toaccommodate the tray/turf. The mass on top of the balancewas recorded to a laptop at a rate of 5 Hz so that the massof dew was continuously monitored as it formed and evap-orated. The data were averaged to 10 min to achieve bettersignal-to-noise ratio.
Price and Clark (2014) performed an extensive char-acterization of the dewmeter and compared dew forma-tion/evaporation on co-located dewmeters containing realturf and artificial turf. The authors found that Vdew and thedew deposition rate were identical between the two turfs. Inother words, the radiative properties and surface area of arti-ficial turf sufficiently mimic real turf such that artificial turfcan be used as a surrogate to quantify Vdew and its temporalevolution. The advantage of using artificial turf is that thereare no changes in mass due to evapotranspiration during thedaytime. The dewmeter is also capable of quantifying rain-
fall and its evaporation. However, if the rainfall is too in-tense (≥ 2 mm) then the tray becomes flooded and must bereplaced with a dry tray/turf.
2.5 Flux calculation
NH3 fluxes from dew evaporation were calculated using thefollowing equation:
FNH3 =[NH4
+] ·Vdew
tevap·Frac(NH3) · 17 031, (3)
where FNH3 is the average emission flux (in ng m−2 s−1) dur-ing dew drying, [NH+4 ] is the concentration of ammonium indew (in µM), Vdew is the volume of dew in the canopy (inL m−2), tevap is the time it takes for dew to evaporate (in s),Frac(NH3) is the fraction of NH+4 in the dew that is releasedas NH3, and 17 031 is to convert µmol to ng. It is importantto note that Eq. (3) yields the average FNH3 during evapora-tion and cannot account for any variations in FNH3 over theevaporation period. The dewmeter was used to record Vdewand tevap, whereas sample from the dew collector was usedto quantify [NH+4 ] and calculate Frac(NH3). The dewmeteris automated and was deployed continuously from 22 Juneuntil 31 August (and intermittently between 27 May and21 June), whereas the dew collector requires manual clean-ing and collection and so was only deployed when forecastswere favourable for dew formation.
3 Results and discussion
3.1 Fraction of NH3 that evaporates from drying dew
We tested the validity of Eq. (2) by performing a series ofdrying experiments similar to Takenaka et al. (2009) butspecifically targeting conditions relevant for dew (i.e. compo-sition and drying time). Takenaka et al. (2009) used solutionsin the mM range with drying times of ∼ 9 h, whereas natu-ral dew is typically less concentrated (µM range) and usuallydries within a few hours. The composition of synthetic dew(Table S1 in the Supplement) and drying time (∼ 2.5 h) inthis work is a better representation of natural dew.
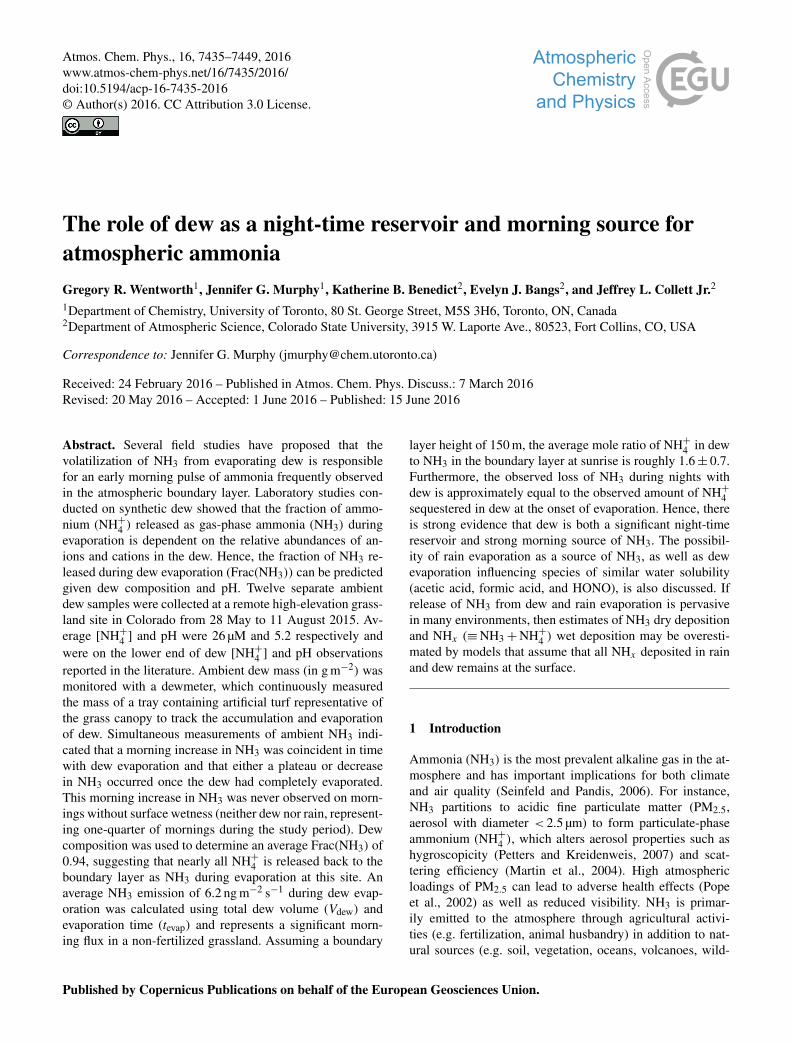
Figure 1 shows the measured Frac(NH3) vs. predictedFrac(NH3) from an updated form of Eq. (2) (see below fordetails) for the nine synthetic dew. Drying experiments wereperformed three times per dew composition, and error barsin Fig. 1 denote the standard deviation between experiments.The amount of NHx (≡NH+4 +NH3) recovered was alwayswithin 20 % of the amount of NH+4 added at the beginning ofthe experiment. There is good agreement between the mea-sured and predicted Frac(NH3), which is mostly consistentwith the findings of Takenaka et al. (2009) with a few keydifferences: (1) the majority of acetate and formate remainedas a salt after evaporation, (2) HCO−3 was an important con-stituent in the anion balance, and (3) the pKa of each sub-stance must be considered. Although acetic acid, formic acid,
7440 G. R. Wentworth et al.: Dew as a reservoir and morning source for ammonia
Figure 1. Fraction of NH3 liberated during drying experiments vs.the fraction predicted according to an updated Eq. (2) to include ac-etate, formate, CO2−
3 , and HCO−3 in the anion balance. Excludingthese anions significantly reduces the correlation. Error bars repre-sent ±σ from three experiments per synthetic dew. The dashed lineis the 1 : 1 line.
and carbonic acid are relatively volatile, the conjugate basescan (and do) form non-volatile salts upon evaporation whenthere is an excess of cations. Furthermore, if the pH is nearor less than the pKa of the acids then a significant fractionwill be neutral (protonated) and unable to form a salt. Hence,we update the definition of 6anions in Eq. (2) to includeacetate, formate, and bicarbonate (also reflected in Fig. 1),which yield much better agreement in predicted vs. measuredFrac(NH3).
Since ion chromatography quantifies the total amount ofeach species (i.e. both charged and neutral forms) it is nec-essary to use pH and the acid dissociation constant (Ka) foreach species to calculate the ionic fraction of each. Further-more, Takenaka et al. (2009) recommend including carbon-ate/bicarbonate in the ion balance for field samples. The au-thors did not account for CO2 equilibria since their lab ex-periments were performed under strict CO2-free conditions,whereas our synthetic dew samples had sufficient exposureto lab air to equilibrate with atmospheric CO2 (∼ 500 ppm inthe lab) as verified by subsequent inorganic carbon measure-ments (Sect. 2.4). Hence, we calculated the amount of HCO−3and CO2−
3 in synthetic dew using pH and carbonate equilib-ria assuming PCO2 = 500 ppm. Charge imbalance calculatedin Eq. (2) is a result of CO2 dissolving (or outgassing whena large quantity of bicarbonate/carbonate salt was added) aswell as the addition of HCl or NaOH.
3.2 Dew parameters
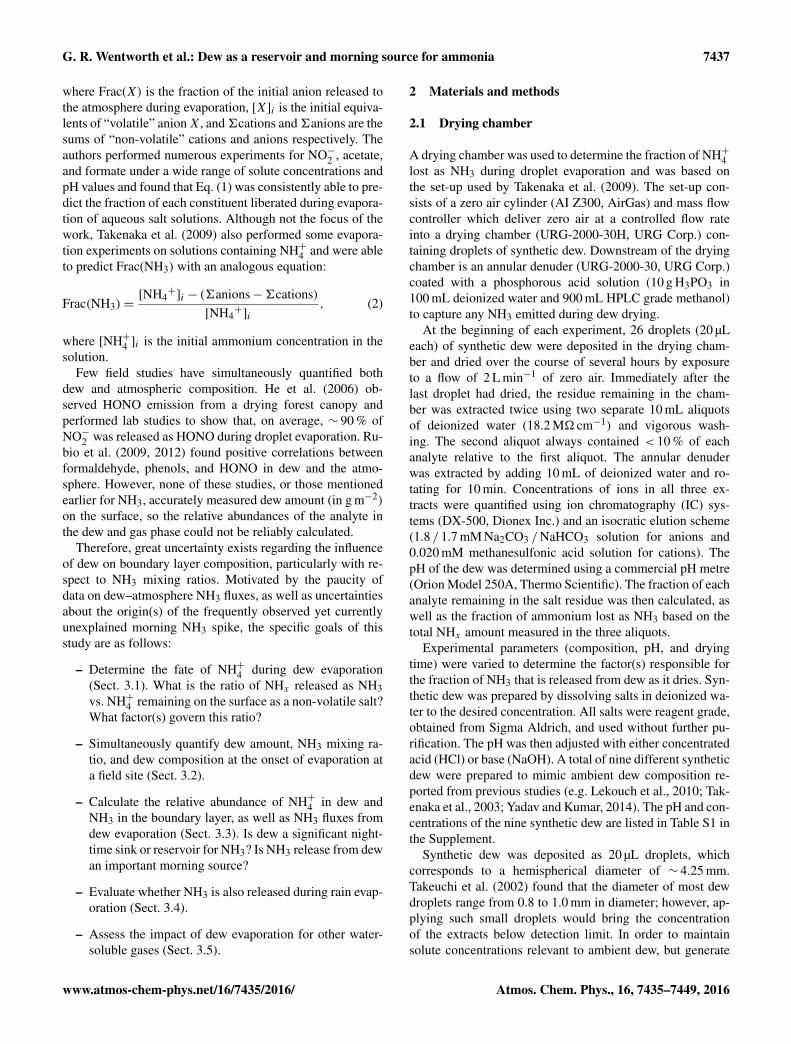
A total of 12 dew samples for chemical analysis were col-lected at RMNP over the study period. The equivalent con-centrations of ions are given in Fig. 2 and TOC, IC, TN,pH, and Frac(NH3) in Table 1. Average values of [NH+4 ]in dew found in the literature span several orders of magni-tude ranging from 25 µM in coastal Croatia (Lekouch et al.,
Figure 2. Ionic composition (in µN) of ambient dew collected atRMNP.
2010) to 1600 µM in urban India (Yadav and Kumar, 2014).Dew at RMNP is at the lower end of this range with me-dian [NH+4 ]= 28 µM. In general, the concentrations of allspecies in RMNP dew are lower than most previous studies(e.g. Singh et al., 2006; Takenaka et al., 2003; Wagner et al.,1992). This is due to the remoteness of RMNP resulting inlow levels of coarse mode aerosol and water-soluble gaseswhich tend to control the composition of dew via deposi-tion and dissolution (Takeuchi, 2003; Wagner et al., 1992).The dominant cations in dew at RMNP are Ca2+ and NH+4 .The former is likely from the deposition of coarse mode soiland/or dust particles and the latter from gas-phase dissolutionof NH3. Acetate and formate are the major anions and maybe the result of dissolution of acetic and formic acid (Wagneret al., 1992) and/or the products of aqueous-phase oxidationof semi-volatile organics (SVOCs, e.g. aldehydes) which hasbeen observed in cloud and fog water (Herckes et al., 2007,2013; Munger et al., 1989). The area surrounding the fieldsite is heavily forested and the boundary layer is likely rich inbiogenic SVOCs, which could explain the high TOC contentin the dew (average= 6.23 mg C L−1). The ability for dew toact as a medium for aqueous-phase oxidation of SVOCs isoutside the scope of this paper but warrants further investiga-tion.
The average pH of dew at RMNP was 5.19 (me-dian= 5.34), which is on the lower range of what has beenreported for dew. For instance, Yaalon and Ganor (1968)and Xu et al. (2015) found median dew pH of 7.7 and 6.72in Jerusalem and Changchun, China, respectively, whereasPierson et al. (1986) reported an average dew pH of 4.0 at arural site in Pennsylvania in a region containing several coal-fired power plants. Given the remoteness of RMNP and lowionic concentrations, CO2 dissolution plays an important rolein governing dew pH. Acidic dew are considered to enhancedeposition of NH3 and hinder that of certain weakly acidicgases (e.g. SO2, organic acids) (Chameides, 1987; Okochi etal., 1996). In addition, the average summertime NH3 mixing
G. R. Wentworth et al.: Dew as a reservoir and morning source for ammonia 7441
Table 1. Total organic carbon (TOC), total nitrogen (TN), inorganic carbon (IC), pH, the ratio of measured to predicted [NH+4 ] in dew, andparameters pertinent to NH3 flux calculations in the field dew samples.
Date TOC IC TN pH Frac(NH3) Vdew tevap Flux [NH+4 ]meas : [NH+4 ]eqm(mg C L−1) (mg C L−1) (mg N L−1) (mL m−2) (s) (ng m−2 s−1)
ratio at RMNP is about a factor of 3 higher than that of HNO3(Benedict et al., 2013b), which is roughly the same ratio asNH+4 : NO−3 in dew measured in this study.
Figure 2 reveals a persistent ion imbalance for ambi-ent dew samples. On average, about 25 % more anion isneeded to achieve ion balance with the measured cations.This implies that some anions are unaccounted for in thesystem. Possible explanations include (1) longer chain or-ganic acids (e.g. succinate, maleate, malonate, and pyruvate)and/or (2) silicates from wind-blown dust.
Equation (2) was used to calculate Frac(NH3) for ambi-ent dew samples (average= 0.94). Only 3 of the 12 sampleshad a Frac(NH3) less than 1 meaning that, in most cases, allof the NH+4 present is predicted to volatilize as NH3 duringdew evaporation. It is important to note that acetate, formate,and HCO−3 were included in the
∑anion budget in contrast
to Takenaka et al. (2009). Had the aforementioned anions notbeen included in the Frac(NH3) calculation then all dew sam-ples would have Frac(NH3)= 1.
The high Frac(NH3) has an important implication for Ndeposition: NH3 that is dry deposited onto a surface wettedwith dew does not necessarily contribute to N deposition. Inother words, NH3 deposited into dew overnight should notnecessarily be counted towards the total N-deposition bud-get for a given ecosystem. The consequence of this implica-tion likely extends beyond RMNP and merits additional fieldmeasurements of dew to calculate Frac(NH3) in other envi-ronments (e.g. agricultural, urban, and rural). To our knowl-edge, this is the first field study to quantify the extent towhich NH+4 is released as NH3 during dew evaporation. Ad-ditional research is needed to examine the effects of (1) saltsalready present on vegetative surfaces on dew composition,(2) dew transfer from leaf to soil prior to evaporation, and(3) different canopies (e.g. forest, tall grass) on the amountand timing of dew accumulation and evaporation.
3.3 Dew–atmosphere NH3 fluxes
In this section we examine how the formation and evapo-ration of dew impacts NH3 in the boundary layer. Figure 3shows time series (from 19:00 to 11:00 the following day)of dew mass (g m−2), air temperature (◦C), and NH3 mixingratio (ppbv) on four separate nights with dew. One featurecommon to all four panels is the increase of NH3 at the on-set of dew evaporation followed by a plateau or decrease ofNH3 once the surface had dried completely. The features inFig. 3 are representative of the other 29 nights in which dewformed during the study period (27 May to 31 August). Itshould be noted that in Fig. 3c and d the start of the morn-ing NH3 increase is slightly delayed from the onset of dewevaporation. This may be attributed to canopy growth overthe course of the campaign – during May and June (Fig. 3aand b) the grassland canopy was relatively short (∼ 5 cm) androughly the same height as the artificial turf on the dewme-ter. However, during July (Fig. 3c) and August (Fig. 3d) thecanopy had grown significantly (up to ∼ 30 cm), providingsignificant shade to lower parts of the grass such that dewfinished evaporating off the dewmeter prior to complete dry-ing of the canopy. This would also cause an underestimationof dew amount by the dewmeter towards the end of the mea-surement period.
The consistent timing between dew evaporation and the in-crease in NH3 mixing ratio is strong evidence that dew evap-oration and the early morning NH3 increases are linked, butother phenomena must be considered. For instance, it is wellknown that NH3 emissions from plant stomata and soil areheavily temperature dependent and increase at higher tem-peratures (Massad et al., 2010; Sutton et al., 2013; Zhanget al., 2010). However, NH3 decreases after dew evapora-tion ceases despite a continued increase in temperature, sug-gesting that this morning increase is not from stomata or
7442 G. R. Wentworth et al.: Dew as a reservoir and morning source for ammonia
Figure 3. Dew accumulation (blue, g m−2), NH3 mixing ratio (or-ange, ppbv), and air temperature (red, ◦C) overnight on (a) 22 June,(b) 27 June, (c) 21 July, and (d) 9 August 2015. The black line in(b) is the best fit for the NH3 mixing ratio to an exponential decayfunction (see Eq. 4) between 20:00 and the onset of dew evapora-tion.
soil emissions. Another possible explanation is reduced de-position after dew evaporation since wet canopies provide alower resistance to deposition for water-soluble gases (e.g.NH3) relative to dry canopies (Fowler et al., 2009; Neirynckand Ceulemans, 2008); however, this scenario requires othercontinuous source(s) of NH3. If this were the mechanism re-sponsible for morning NH3 increases then one would expecta plateau in NH3 after canopy drying. However, Fig. 3a, b,and d all show NH3 decreases after dew evaporation. In ad-dition, RMNP is sufficiently remote that morning NH3 in-creases cannot be from rush-hour traffic or industrial sources.
It is also useful to consider the behaviour of NH3 on morn-ings without dew. Of the 72 nights during which the dewme-ter was deployed and functioning, there was night-time rainon 23 of the nights and no surface wetness (neither rain nordew) at sunrise on 16 nights. Typically, dew formation be-gan around 20:30 and it had completely evaporated by 09:00the following morning. Figure 4 compares NH3 mixing ra-tios from 04:00 to 11:00 on mornings with dew (Fig. 4a)and without dew or rain (Fig 4b). The clear morning NH3increase only happens on mornings with dew, further sup-
Figure 4. Time series of NH3 mixing ratio (in ppb) from 04:00 to11:00 on (a) mornings with dew and (b) mornings with no surfacewetness. Traces are coloured according to the average NH3 mixingratio measured the previous night between 19:00 and 21:00.
porting the hypothesis that dew evaporation has a significantinfluence on near-surface NH3 mixing ratios. The traces inFig. 4 are coloured according to the average NH3 mixingratio the previous night (from 19:00 to 21:00). The magni-tude of the morning increase is related to the amount of NH3present the previous night suggesting that most of the NH+4in dew is a result of NH3 dissolution. This is additional evi-dence that NH3 deposited in dew overnight at RMNP is re-cycled back to the atmosphere the following morning uponevaporation and should not be counted towards total N depo-sition. In other words, the dew acts as a temporary reservoirfor atmospheric ammonia and the cycle of dew formation andevaporation has a strong influence on boundary layer NH3concentrations.
Table 1 shows the calculated NH3 fluxes from dew dur-ing evaporation (average= 6.2 ng m−2 s−1) as well as therelevant parameters required for flux calculations (tevap,Frac(NH3), and Vdew). To our knowledge, only two studiesto date have reported NH3 fluxes in a non-fertilized grass-land. Wichink Kruit et al. (2007) used the aerodynamic gra-dient method to measure a daily average summertime NH3flux of 4 ng m−2 s−1 in a field in the Netherlands, whereasWentworth et al. (2014) inferred a daily average soil emis-sion flux of 2.6 ng m2 s−1 during August in a rural field nearToronto, Canada, using simultaneous soil and atmosphericmeasurements and a simple resistance model. In the contextof these previous studies over the same land type, the dew-related NH3 fluxes at RMNP are significant. Furthermore, itis likely that dew-related NH3 fluxes would be substantiallylarger at the other field sites given that NH3 mixing ratioswere a factor of 3–10 higher which would result in higherdew [NH+4 ].
It is likely that during some periods the emis-sion/deposition footprint of the atmospheric and dew mea-surements extends beyond the grassland clearing and into thesurrounding forest. While we did not find that the overnightloss rate of ammonia depended on dew amount, the deposi-
G. R. Wentworth et al.: Dew as a reservoir and morning source for ammonia 7443
tion rate of ammonia likely depends on surface type, so esti-mates of moles of NH3 deposited per m2 from the dew col-lector may not be representative of the surrounding forest.Upslope and downslope flow conditions could also explainsome of the variability in nocturnal NH3 since the latter isprevalent during the night-time and delivers cleaner air fromthe west of RMNP. Subsequent work should be performedto examine the representativeness of grassland dew measure-ments to the larger surrounding ecosystem.
For the 12 dew samples listed in Table 1, a simple cal-culation was performed to estimate the moles of NH+4 con-tained in dew relative to the moles of NH3 in the boundarylayer. Particulate NH+4 is not considered due to its low massloadings at RMNP (Benedict et al., 2013b). The µmol m−2
of NH+4 in dew at the onset of evaporation was calculatedby multiplying Vdew by dew [NH+4 ]. One inherent assump-tion is that [NH+4 ]dew on the collector is representative ofthe dew on the dewmeter. An equivalent mole loading (alsoin µmol m−2) of NH3 in the boundary layer was calculatedby first converting the measured mixing ratio from ppbv toµmol m−3 and then multiplying by an assumed boundarylayer depth of 150 m. The average ratio of NH+4,dew : NH3,BLis 1.6± 0.7 for the 12 dew samples collected. In other words,on a per mole basis there is nearly double the NH+4 in dewthan there is NH3 in a 150 m deep boundary layer. Unfor-tunately, there are no measurements at RMNP that allow abetter constraint of the boundary layer height. Assuming asmaller (larger) boundary layer height would increase (de-crease) the NH+4,dew : NH3,BL ratio.
The measured loss of NH3 (in ppbv) during dew nightswas used to estimate the sink of NH3 (in µmol m−2) be-tween the onset of dew formation and evaporation. Thisloss was estimated in a similar fashion as above, assuming(1) 150 m nocturnal boundary layer, (2) no reactive sinks(e.g. NH4NO3 formation), (3) no exchange with the free tro-posphere, and (4) no influence from horizontal advection (i.e.upslope/downslope flow) on NH3. Figure 5 shows a correla-tion plot of estimated NH3 lost on dew nights vs. the ob-served NH+4 accumulated in dew. The good correlation andnear-unity slope (0.71) show that there is approximate massclosure between NH3 lost overnight and NH3 sequestered bydew. Although these calculations are simplistic it is evidentthat, on average, dew sequesters a significant portion (esti-mated at nearly two-thirds) of NH3 over the course of thenight. Subsequent studies on dew–atmosphere interactionsshould include measurements of boundary layer height so amore thorough mass balance calculation can be performed.
The loss rate of NH3 on dew nights vs. dry nights was ex-amined by fitting the NH3 mixing ratio to an exponential de-cay function between 20:00 and 09:00 (or dew evaporation)on the 46 nights in Fig. 4. The fit function used was
[NH3]t = [NH3]sunsete−kt+ [NH3]overnight, (4)
Figure 5. Estimated NH3 lost overnight assuming a 150 m bound-ary layer vs. measured NH+4 accumulated in dew by the onset ofevaporation. The red line is the best fit line (forced through the ori-gin) and the dashed grey line is the 1 : 1 line.
where [NH3]t is the mixing ratio of NH3 at time t ,[NH3]sunset is the mixing ratio at 20:00, [NH3]overnight is theplateau in nocturnal NH3 mixing ratio, and k is an empiricalfit parameter representing the apparent first-order loss rateconstant of NH3. An example of the fit is shown by the blacktrace in Fig. 3b.
The average NH3 loss rate constant on dew nights was1.33± 0.5× 10⁻⁴ s−1 compared to 1.35± 0.3× 10⁻⁴ s−1 ondry nights. In other words, there is no significant difference inthe rate of NH3 loss on dew vs. non-dew nights. This impliesthat dew does not actually enhance NH3 deposition underthese conditions, suggesting that the aerodynamic and quasi-laminar resistances dominate over surface resistances. Theaverage nocturnal wind speed on dew nights was lower thanon dry nights (1.3 m s−1 vs. 2.2 m s−1). Lower wind speedstypically result in a higher Ra and Rb. It is possible that in-creased aerodynamic and quasi-laminar resistances on dewnights are partially compensated for by a lower surface re-sistance due to dew, such that the overall canopy resistanceis similar on dew nights and dry nights. Average nocturnalwind direction was from the northwest (i.e. downslope flow)on both dew nights (307◦) and dry nights (313◦). The averagenocturnal maximum for RH was 75 % on dew nights and only53 % on dry nights. The lower wind speeds and higher RH ondew nights are consistent with the meteorological conditionsfavourable for dew formation.
Deposition of NH3 on dry nights could be to either leafcuticles and/or soil pore water. However, it is not possibleto unambiguously attribute the nocturnal NH3 loss solely todeposition. Enhanced downslope flow of cleaner air on drynights cannot be ruled out as a contributor to nocturnal NH3loss. Since NH3 deposition is independent of dew amount,there could be a large discrepancy between [NH+4 ] for dewon the dewmeter vs. the dew collector if Vdew is significantlydifferent on the two surfaces. However, the campaign aver-ages of Vdew on the dewmeter (Table 1) are within 10 % of
7444 G. R. Wentworth et al.: Dew as a reservoir and morning source for ammonia
dew volume obtained off the collector (data not shown) so[NH+4 ] is likely similar for dew on both platforms.
Since most of the NH+4 in dew volatilizes and the presenceof dew does not affect NH3 deposition overnight, the net im-pact is a reduction in the overall removal of NH3. As a result,the atmospheric lifetime and range of NH3 transport will beextended.
3.4 Potential Influence from rain evaporation
Numerous studies have reported rapid increases of near-surface NH3 within 1–2 h after some rain events (e.g. Cooteret al., 2010; Walker et al., 2013; Wentworth et al., 2014).Given the findings discussed in the previous section, onepossible explanation is the emission of NH3 from dryingrain droplets. However, unlike dew, some difficult-to-predictfraction of rain will permeate through the soil, thus pre-venting or delaying the release of NH3. Nonetheless, we at-tempt to qualitatively explore this hypothesis by examiningthe Frac(NH3) of four rain samples collected at RMNP aswell as the behaviour of NH3 during rainfall evaporation.Rain samples were collected with the same procedure used tocollect dew, which differs from the usual method of captur-ing precipitation via an automated precipitation bucket (e.g.Benedict et al., 2013a). The precipitation bucket is normallyequipped with an O ring and lid to prevent dry depositionand dissolution of water-soluble gases when it is not precip-itating. However, precipitation on the dew collector surfacewas left exposed and its composition is influenced by dry de-position and gas-phase dissolution until it was collected atthe onset of evaporation.
Table S2 in the Supplement gives the concentration of ionsmeasured in rain samples. In general, concentrations of ionsare comparable between dew and rain samples, with the ex-ception of NH+4 , SO2−
4 , and NO−3 , which are a factor of 2–4times more concentrated in rain samples. The enhancementof these species in rain may reflect additional in-cloud andbelow-cloud scavenging of gases (NH3, HNO3, and SO2)
and PM2.5 aloft. Another possibility is that rain generallyforms during upslope conditions which coincide with morepolluted air masses from east of RMNP, whereas dew typi-cally forms during downslope (cleaner) conditions. Numer-ous studies have compared dew composition to rain compo-sition and, in general, have found that concentrations are en-hanced in dew relative to rain (e.g. Polkowska et al., 2008;Wagner et al., 1992). However, Pierson et al. (1986) reporteddew composition to be similar to, but more dilute than, rainat a rural site in Pennsylvania.
Table S3 shows the TOC, IC, TN, pH, and calculatedFrac(NH3) for the four rain samples. Rain samples weremore acidic (average pH= 4.54) than dew samples (aver-age pH= 5.19). The average Frac(NH3) for rain sampleswas 0.66 suggesting that, on average, roughly two-thirds ofNH+4 contained in precipitation on surfaces should be liber-ated as NH3 upon evaporation. This could pose a significant
flux of NH3 to the boundary layer; however, since the frac-tion of rain that remains on surfaces after rainfall where itcan readily evaporate is not constrained, only an upper es-timate on NH3 fluxes from drying rain can be calculated(21.2± 13 ng m−2 s−1). This value was calculated in samemanner as the dew samples and assumes all rainfall evapo-rates.
Figure 6 shows time series of rain accumulation (g m−2),air temperature (◦C), and NH3 mixing ratio (ppbv) on 4separate days with observed rainfall. The rain accumulationwas measured with the dewmeter; 1000 g m−2 of accumula-tion is equivalent to 1 mm of rainfall. Rainfall in excess of2000 g m−2 flooded the collection tray and could not be re-liably recorded by the dewmeter. On 24 June (Fig. 6a) therewere three light rainfalls at 15:00, 16:00, and 19:00. The firstevent at 15:00 was accompanied by a rapid decrease in NH3likely due to scavenging by rain droplets; however, this wasnot observed for the other two rainfalls that day. For the sec-ond rain event in Fig. 6a (at 16:00) a substantial increasein NH3 (from 0.5 to 1.5 ppbv) was observed during evapo-ration and is consistent with NH3 liberation from evaporat-ing rain. However, evaporation of the other rain events on24 June (Fig. 6a) as well as those on 27 June (Fig. 6b) and11 July (Fig. 6c) is not associated with concomitant increasesin NH3, implying that these rain evaporation events did notrelease NH3. The evaporation of a more substantial rainfallon 13 August (Fig. 6d) is associated with a temporary rise inNH3 until evaporation ceases at sundown. The instances ofrain evaporation not associated with NH3 increases could bedue to rain with a low Frac(NH3), an insignificant amount ofNH+4 in the rain, more atmospheric dilution than dew morn-ings due to higher turbulence, and/or significant rain penetra-tion into the soil.
The results from Fig. 6 are consistent with previous lit-erature showing NH3 increase immediately following onlysome rainfall events (Cooter et al., 2010; Walker et al., 2013;Wentworth et al., 2014). The timing of some rain evaporationevents with NH3 increases, as well as the high Frac(NH3)
(average= 0.66) of the four measured rain samples, sug-gests it is possible for rain evaporation from surfaces to be asubstantial source of NH3. Neirynck and Ceulemans (2008)reported NH3 increases concomitant with a drying forestcanopy (after rainfall) as measured by a leaf wetness sensor.
Currently, all NH+4 collected in precipitation samples iscounted towards N deposition. However, if a fraction of NH+4in rainfall is emitted as NH3 during evaporation then N de-position could be overestimated. At RMNP, wet depositionof NHx and dry deposition of NH3 account for 35 and 18 %respectively of total reactive nitrogen deposition to the site(Benedict et al., 2013a). This budget does not take into ac-count any re-emission of NH3 from drying rain. This bud-get also does not explicitly account for ammonia uptake oremission during dew formation and evaporation. A more ex-tensive suite of dew and rainfall measurements is necessary
G. R. Wentworth et al.: Dew as a reservoir and morning source for ammonia 7445
Figure 6. Rain accumulation (blue, g m−2), NH3 mixing ratio (or-ange, ppbv), and air temperature (red, ◦C) during the afternoon andevening on a) 24 June, (b) 27 June, (c) 11 July, and (d) 13 Au-gust 2015; 100 g m−2 is equivalent to 0.1 mm of rain.
to quantify the impact of evaporation on annual N-depositionbudgets at RMNP.
3.5 Implications for other Gases
Other water-soluble gases with similar or larger effectiveHenry’s law constants (Keff
H ) to NH3 are likely influencedby dew and rain evaporation as well, provided that the rela-tive abundance of counterions allows for volatilization dur-ing evaporation. Keff
H is the equilibrium constant for describ-ing gas-aqueous partitioning and accounts for chemical equi-libria in solution. Since acid–base equilibria are pH depen-dent, then the Keff
H for acidic and basic species is also pHdependent (Sander, 2015). Keff
H of NH3 was calculated forthe 12 dew samples using data from Sander (2015) to deter-mine the temperature-dependent Henry’s law constant (KH)
and from Bates and Pinching (1950) for the temperature-dependent acid dissociation constant (Ka) of NH+4 requiredfor the calculation of Keff
H . During the study, dew KeffH
spanned 2 orders of magnitude and ranged from 4.5× 10⁵
to 2.7× 10⁷ M atm−1. These high values are indicative ofthe high water solubility of NH3 at the observed pHs andtemperatures. Chameides (1987) used a simple resistancemodel to show that deposition of gas-phase species with
KeffH > 105 M atm−1 to wetted surfaces (i.e. dew) will be lim-
ited by the aerodynamic resistance since the surface resis-tance is negligible for such highly water-soluble species. Inother words, it is likely that dew will be a significant night-time sink for other trace gas species withKeff
H > 105 M atm−1
since the dissolution into dew is controlled by aerodynamicprocesses independent of the identity of the gas.
Table 1 shows the ratio of [NH+4 ] measured in dew to theconcentration predicted from equilibrium calculations usingKeff
H and measured NH3 mixing ratio at the onset of evapora-tion. The average ratio is low (0.04), consistent with a signif-icant aerodynamic resistance that prevents NH+4 saturation indew droplets overnight.
It has been suggested that dew can act as a reservoir forphenol, nitrophenols, formaldehyde, and HONO based onobservations of these species in dew in Santiago, Chile (Ru-bio et al., 2009, 2012). Zhou et al. (2002) found a correlationbetween high night-time RH (a surrogate for dew formation)and HONO increases the following morning coincident witha decrease in RH. A follow-up study (He et al., 2006) con-firmed aqueous solutions mimicking dew can release> 90 %of NO−2 as HONO upon evaporation and observed similarHONO pulses during canopy drying at a rural forest site inMichigan. Indeed, there is some evidence in the literaturethat water-soluble gases (primarily HONO) exhibit a simi-lar behaviour to NH3 during dew formation and evaporationobserved in this study.
Table 2 shows the calculated KeffH (at 10 ◦C) for com-
mon water-soluble gases that could be influenced by dewformation/evaporation. This table is by no means exhaus-tive, but it highlights the important role dew may have asa night-time reservoir and morning source for gases otherthan NH3. Formic acid (HCOOH), acetic acid (CH3COOH),nitrous acid (HONO), and nitric acid (HNO3) all have in-creasing Keff
H with increasing pH since a more basic solu-tion will promote dissociation of the acid into its conjugatebase. The average pH of dew at RMNP (∼ 5.2) is likely suf-ficiently acidic for HONO to experience a surface resistance(Keff
H � 105 M atm−1), which would limit its transport acrossthe dew–air interface. This is consistent with the low average[NO−2 ] (0.2 µM) in dew at RMNP, although this might simplyreflect low HONO mixing ratios at the remote RMNP site.
Future field studies on these species should include simul-taneous measurements of dew composition, dew amount, andgas-phase mixing ratios to determine whether dew is an im-portant night-time reservoir and morning source. The latterwill be dependent on the fraction of gas released upon dewevaporation, which requires further investigation specific toeach gas. Based on the findings in this work and Takenakaet al. (2009) it is likely that acidic semi-volatiles (e.g. aceticacid, formic acid, HONO) will be retained as salts duringdew evaporation at RMNP due to the excess of cations.
7446 G. R. Wentworth et al.: Dew as a reservoir and morning source for ammonia
Table 2. KeffH of NH3 and other water-soluble gases at 10 ◦C and
various pHs.
Gas pH KeffH (M atm−1)
NH3 (ammonia) 4.5 2.1× 10⁷
6 6.7× 10⁵
7.5 2.1× 10⁴
HCOOH (formic acid) 4.5 1.1× 10⁵
6 2.8× 10⁶
7.5 8.9× 10⁷
CH3COOH (acetic acid) 4.5 1.9× 10⁴
6 2.3× 10⁵
7.5 7.0× 10⁶
HONO (nitrous acid) 4.5 1.3× 10³
6 3.9× 10⁴
7.5 1.2× 10⁶
HNO3 (nitric acid) 4.5 5.3× 10¹²
6 1.7× 10¹⁴
7.5 5.3× 10¹⁵
4 Conclusions
Laboratory experiments involving synthetic dew were per-formed to determine the factor(s) controlling the fraction ofNH+4 released as NH3 upon dew evaporation. Results weremostly consistent with Takenaka et al. (2009), who foundthat the amount of NH3 that volatilized from drying aqueoussolutions is governed by the relative abundances of NH+4 andexcess “non-volatile” anions (6anions−
∑cations). How-
ever, our findings suggest that acetate, formate, and HCO−3should also be counted towards the anion budget. Hence, theFrac(NH3) released from a drying dew sample can be pre-dicted given the ionic composition and pH.
A dewmeter (for dew amount, deployed continuously from22 June to 31 August) and dew collector (for dew composi-tion, deployed successfully on 12 occasions) were set up at aremote field site in Colorado. Dew was relatively dilute com-pared to previous studies and had an average [NH+4 ] of 26 µMand pH of 5.2 at sunrise. Simple calculations revealed thatdew can act as a significant night-time reservoir of NH3. Atthe onset of dew evaporation there was, on average, roughlytwice as much NH+4 in dew as NH3 in the boundary layer.Furthermore, the observed NH3 loss overnight was roughlyequivalent to the amount of NH+4 that accumulated in dewby sunrise. Dew composition was used to calculate an aver-age Frac(NH3) of 0.94, suggesting that the vast majority ofNH3 sequestered in dew overnight is emitted during evapo-ration shortly after sunrise. Mornings with dew experience alarge increase in NH3 coincident with dew evaporation. Oncethe dew has completely evaporated, NH3 mixing ratios ei-ther plateau or decrease. Fluxes of NH3 from dew averaged
6.2± 5 ng m−2 s−1 during evaporation and were calculatedusing measured [NH+4 ], Vdew, tevap, and Frac(NH3). Thesefluxes are substantial compared to previously reported fluxesin non-fertilized grasslands (Wentworth et al., 2014; WichinkKruit et al., 2007). Mornings without any surface wetness(neither dew nor rain) never experienced a sharp increase inNH3. Dew-related NH3 fluxes are likely much more substan-tial in urban and agricultural areas where NH3 and [NH+4 ] indew are significantly higher than at RMNP.
Morning increases of NH3 frequently observed at RMNP(and other sites) are very likely the result of NH3 emis-sions during dew evaporation. This hypothesis is supportedby (1) coincident timing of morning NH3 increases/decreasesat the start/completion of dew evaporation, (2) lack of NH3morning increase on every non-dew morning, (3) significantNH3 fluxes calculated from dew, (4) relative abundances ofNH+4 in dew and NH3 in the boundary layer, and (5) approx-imate mass balance closure between NH3 lost overnight andNH+4 accumulated in dew. The phenomenon of dew “recy-cling” atmospheric NH3 could lead to an overestimation ofNH3 dry deposition in some ecosystems since dew formedovernight can take up much of the near-surface ammonia andthen release most of it again in the morning upon evapora-tion. Such phenomena are generally not considered in currentmodels of NH3 dry deposition. In addition, nocturnal lossrates of NH3 were unaffected by the presence of dew. Ourresults suggest the net effect of dew is to reduce the overallremoval of NH3 and prolong its atmospheric lifetime as longas the dew composition yields a high Frac(NH3).
Similar behaviour (coincident timing of NH3 increases andevaporation) was occasionally observed for rain. Analysisof four rain samples yielded an average Frac(NH3) of 0.66,suggesting NH3 can be released from evaporation of rain inRMNP as well. However, due to the limited number of sam-ples and lack of constraint for amount of rain sequesteredbelow ground it is currently impossible to be even semi-quantitative about potential NH3 fluxes from rain evapora-tion. This uncertainty merits further research since NHx wetdeposition does not account for re-release of NH3 from evap-oration. Subsequent studies should also examine (1) the roleof biological processes on surface water composition (e.g.stomatal exchange, modification via microbes) and (2) in-fluence of guttation (leaf exudate) on surface–air NH3 ex-change.
Additional field measurements quantifying NH3 releasefrom dew and rain evaporation are needed to determine howrelevant these phenomena are for modulating NH3 mixingratios and N deposition in different environments (e.g. ur-ban, rural, agricultural). Although the majority of NH+4 indew was released back to the atmosphere at RMNP, this isnot necessarily the case at other locations. For instance, en-vironments with HNO3 deposition exceeding NH3 deposi-tion to dew would cause a low (or zero) Frac(NH3). In addi-tion, a tall canopy can recapture near-surface NH3 emissionsand might modulate emissions from dew drying in the lower
G. R. Wentworth et al.: Dew as a reservoir and morning source for ammonia 7447
canopy (Walker et al., 2013). Regardless, the ability for dewto act as a morning source of NH3 is currently absent fromatmospheric models, with the exception of a few field-scalemodels based on the work of Flechard et al. (1999). The ob-servations from this study suggest dew imparts a large in-fluence on boundary layer NH3; hence, future work shouldalso focus on developing model parameterizations for NH3uptake during dew formation and release from evaporatingdew.
To our knowledge, this is the first study to quantitativelyexamine the influence of dew on any water-soluble gas by si-multaneously measuring dew amount, dew composition, andatmospheric composition. Although NH3 is the focus of thiswork, gases with similar Keff
H (> 105 M atm−1) might be in-fluenced by dew formation and evaporation in a comparablemanner. Such species include, but are not limited to, aceticacid, formic acid, HONO, and HNO3. Methodology similarto this study should be used to conduct quantitative field stud-ies for the aforementioned species to better understand thedynamic influence of dew on boundary layer composition.
5 Data availability
Hourly averaged meteorology data for the field site (ROMO-LP) are available from the National Park Service (NPS, 2016)at http://ard-request.air-resource.com/data.aspx. Underlyingdata not given in the paper or on the NPS website can beaccessed by contacting the corresponding author.
The Supplement related to this article is available onlineat doi:10.5194/acp-16-7435-2016-supplement.
Acknowledgements. The National Park Service (NPS) maintainedthe field site, provided meteorological data, and supported the costsof field and laboratory measurements. Gregory R. Wentworth ac-knowledges funding from NSERC and the Integrating AtmosphericChemistry and Physics from Earth to Space (IACPES) program fortravel funding. The authors wish to thank C. Wallesen, G. Perry,and the staff at the Saddle & Surrey Motel in Estes Park, CO, forproviding generously discounted rates during peak tourist season.Lastly, R. Clark and J. Price, and H. Guan provided valuable insighton construction of the dewmeter and dew collector respectively.
Edited by: S. E. Pusede
References
Baldridge, A. M., Hook, S. J., Grove, C. I., and Rivera, G.: Theaster spectral library version 2.0, Remote Sens. Environ., 113,711–715, doi:10.1016/j.rse.2008.11.007, 2009.
Baron, J. S.: Hindcasting nitrogen deposition to determine an eco-logical critical load, Ecol. Appl., 16, 433–439, 2006.
Bash, J. O., Walker, J. T., Katul, G. G., Jones, M. R., Nemitz, E.,and Robarge, W. P.: Estimation of In-Canopy Ammonia Sourcesand Sinks in a Fertilized Zea mays Field, Environ. Sci. Technol.,44, 1683–1689, 2010.
Bash, J. O., Cooter, E. J., Dennis, R. L., Walker, J. T., and Pleim, J.E.: Evaluation of a regional air-quality model with bidirectionalNH3 exchange coupled to an agroecosystem model, Biogeo-sciences, 10, 1635–1645, doi:10.5194/bg-10-1635-2013, 2013.
Bates, R. G. and Pinching, G. D.: Dissociation Constant of Aque-ous Ammonia at 0 to 50◦ from E. m. f. Studies of the Ammo-nium Salt of a Weak Acid, J. Am. Chem. Soc., 72, 1393–1396,doi:10.1021/ja01159a087, 1950.
Beem, K. B., Raja, S., Schwandner, F. M., Taylor, C., Lee, T., Sul-livan, A. P., Carrico, C. M., McMeeking, G. R., Day, D., Levin,E., Hand, J., Kreidenweis, S. M., Schichtel, B., Malm, W. C., andCollett, J. L.: Deposition of reactive nitrogen during the RockyMountain Airborne Nitrogen and Sulfur (RoMANS) study, En-viron. Pollut., 158, 862–872, doi:10.1016/j.envpol.2009.09.023,2010.
Benedict, K. B., Carrico, C. M., Kreidenweis, S. M., Schichtel, B.,Malm, W. C., and Collett, J. L.: A seasonal nitrogen deposi-tion budget for Rocky Mountain National Park, Ecol. Appl., 23,1156–1169, doi:10.1890/12-1624.1, 2013a.
Benedict, K. B., Day, D., Schwandner, F. M., Kreidenweis, S. M.,Schichtel, B., Malm, W. C., and Collett, J. L.: Observations of at-mospheric reactive nitrogen species in Rocky Mountain NationalPark and across northern Colorado, Atmos. Environ., 64, 66–76,doi:10.1016/j.atmosenv.2012.08.066, 2013b.
Bowman, W. D., Murgel, J., Blett, T., and Porter, E.: Nitro-gen critical loads for alpine vegetation and soils in RockyMountain National Park, J. Environ. Manage., 103, 165–171,doi:10.1016/j.jenvman.2012.03.002, 2012.
Burkhardt, J., Flechard, C. R., Gresens, F., Mattsson, M., Jongejan,P. A. C., Erisman, J. W., Weidinger, T., Meszaros, R., Nemitz, E.,and Sutton, M. A.: Modelling the dynamic chemical interactionsof atmospheric ammonia with leaf surface wetness in a managedgrassland canopy, Biogeosciences, 6, 67–84, doi:10.5194/bg-6-67-2009, 2009.
Chameides, W. L.: Acid dew and the role of chemistry in the drydeposition of reactive gases to wetted surfaces, J. Geophys. Res.,92, 11895–11908, 1987.
Cooter, E. J., Bash, J. O., Walker, J. T., Jones, M. R., andRobarge, W.: Estimation of NH3 bi-directional flux frommanaged agricultural soils, Atmos. Environ., 44, 2107–2115,doi:10.1016/j.atmosenv.2010.02.044, 2010.
Ellis, R. A., Murphy, J. G., Markovic, M. Z., VandenBoer, T. C.,Makar, P. A., Brook, J., and Mihele, C.: The influence of gas-particle partitioning and surface-atmosphere exchange on am-monia during BAQS-Met, Atmos. Chem. Phys., 11, 133–145,doi:10.5194/acp-11-133-2011, 2011.
Flechard, C., Fowler, D., Sutton, M. A., and Cape, J. N.: A dynamicchemical model of bi-directional ammonia exchange betweensemi-natural vegetation and the atmosphere, Q. J. Roy. Meteor.Soc., 125, 2611–2641, doi:10.1002/qj.49712555914, 1999.
Fowler, D., Pilegaard, K., Sutton, M. A., Ambus, P., Raivonen, M.,Duyzer, J., Simpson, D., Fagerli, H., Fuzzi, S., Schjoerring, J.K., Granier, C., Neftel, A., Isaksen, I. S. A., Laj, P., Maione, M.,
7448 G. R. Wentworth et al.: Dew as a reservoir and morning source for ammonia
Monks, P. S., Burkhardt, J., Daemmgen, U., Neirynck, J., Per-sonne, E., Wichink-Kruit, R., Butterbach-Bahl, K., Flechard, C.,Tuovinen, J. P., Coyle, M., Gerosa, G., Loubet, B., Altimir, N.,Gruenhage, L., Ammann, C., Cieslik, S., Paoletti, E., Mikkelsen,T. N., Ro-Poulsen, H., Cellier, P., Cape, J. N., Horváth, L.,Loreto, F., Niinemets, Ü., Palmer, P. I., Rinne, J., Misztal, P.,Nemitz, E., Nilsson, D., Pryor, S., Gallagher, M. W., Vesala,T., Skiba, U., Brüggemann, N., Zechmeister-Boltenstern, S.,Williams, J., O’Dowd, C., Facchini, M. C., de Leeuw, G., Floss-man, A., Chaumerliac, N., and Erisman, J. W.: Atmospheric com-position change: Ecosystems-Atmosphere interactions, Atmos.Environ., 43, 5193–5267, doi:10.1016/j.atmosenv.2009.07.068,2009.
Gong, L., Lewicki, R., Griffin, R. J., Flynn, J. H., Lefer, B. L., andTittel, F. K.: Atmospheric ammonia measurements in Houston,TX using an external-cavity quantum cascade laser-based sensor,Atmos. Chem. Phys., 11, 9721–9733, doi:10.5194/acp-11-9721-2011, 2011.
Grimmond, C. S. B., Isard, S. A., and Belding, M. J.: Developmentand evaluation of continuously weighing mini-lysimeters,Agr. Forest Meteorol., 62, 205–218, doi:10.1016/0168-1923(92)90015-V, 1992.
Guan, H., Sebben, M., and Bennett, J.: Radiative- andartificial-cooling enhanced dew collection in a coastalarea of South Australia, Urban Water J., 11, 175–184,doi:10.1080/1573062X.2013.765494, 2014.
He, Y., Zhou, X., Hou, J., Gao, H., and Bertman, S. B.: Impor-tance of dew in controlling the air-surface exchange of HONOin rural forested environments, Geophys. Res. Lett., 33, L02813,doi:10.1029/2005GL024348, 2006.
Herckes, P., Chang, H., Lee, T., and Collett, J. L.: Air pollutionprocessing by radiation fogs, Water. Air. Soil Pollut., 181, 65–75, doi:10.1007/s11270-006-9276-x, 2007.
Herckes, P., Valsaraj, K. T., and Collett, J. L.: A review of obser-vations of organic matter in fogs and clouds: Origin, processingand fate, Atmos. Res., 132–133, 434–449, 2013.
Krupa, S. V.: Effects of atmospheric ammonia (NH3) on ter-restrial vegetation: A review, Environ. Pollut., 124, 179–221,doi:10.1016/S0269-7491(02)00434-7, 2003.
Lekouch, I., Mileta, M., Muselli, M., Milimouk-Melnytchouk, I.,Šojat, V., Kabbachi, B., and Beysens, D.: Comparative chemi-cal analysis of dew and rain water, Atmos. Res., 95, 224–234,doi:10.1016/j.atmosres.2009.10.002, 2010.
Löflund, M., Kasper-Giebl, A., Stopper, S., Urban, H., Biebl, P.,Kirchner, M., Braeutigam, S., and Puxbaum, H.: Monitoring am-monia in urban, inner alpine and pre-alpine ambient air, J. Envi-ron. Monitor., 4, 205–209, doi:10.1039/b109727j, 2002.
Martin, S. T., Hung, H.-M., Park, R. J., Jacob, D. J., Spurr, R. J.D., Chance, K. V., and Chin, M.: Effects of the physical stateof tropospheric ammonium-sulfate-nitrate particles on globalaerosol direct radiative forcing, Atmos. Chem. Phys., 4, 183–214, doi:10.5194/acp-4-183-2004, 2004.
Massad, R.-S., Nemitz, E., and Sutton, M. A.: Review and param-eterisation of bi-directional ammonia exchange between vegeta-tion and the atmosphere, Atmos. Chem. Phys., 10, 10359–10386,doi:10.5194/acp-10-10359-2010, 2010.
Moro, M. J., Were, A., Villagarcía, L., Cantón, Y., and Domingo,F.: Dew measurement by Eddy covariance and wetness sensor
in a semiarid ecosystem of SE Spain, J. Hydrol., 335, 295–302,doi:10.1016/j.jhydrol.2006.11.019, 2007.
Munger, J. W., Collett, J., Daube, B. C., and Hoffmann, M. R.:Carboxylic acids and carbonyl compounds in southern Califor-nia clouds and fogs, Tellus B, 41, 230–242, doi:10.1111/j.1600-0889.1989.tb00303.x, 1989.
Nanus, L., Clow, D. W., Saros, J. E., Stephens, V. C., and Campbell,D. H.: Mapping critical loads of nitrogen deposition for aquaticecosystems in the Rocky Mountains, USA, Environ. Pollut., 166,125–135, doi:10.1016/j.envpol.2012.03.019, 2012.
NPS (National Park Service): Validated meteorological data, avail-able at: http://ard-request.air-resource.com/data.aspx, last ac-cess: 2 January 2016.
Neirynck, J. and Ceulemans, R.: Bidirectional ammonia exchangeabove a mixed coniferous forest, Environ. Pollut., 154, 424–438,doi:10.1016/j.envpol.2007.11.030, 2008.
Nowak, J. B., Huey, L. G., Russell, A. G., Tian, D., Neuman, J.A., Orsini, D., Sjostedt, S. J., Sullivan, A. P., Tanner, D. J.,Weber, R. J., Nenes, A., Edgerton, E., and Fehsenfeld, F. C.:Analysis of urban gas phase ammonia measurements from the2002 Atlanta Aerosol Nucleation and Real-Time Characteriza-tion Experiment (ANARChE), J. Geophys. Res., 111, D17308,doi:10.1029/2006JD007113, 2006.
Okochi, H., Kajimoto, T., Arai, Y., and Igawa, M.: Effect of AcidDeposition on Urban Dew Chemistry in Yokohama, Japan, B.Chem. Soc. Jpn., 69, 3355–3365, 1996.
Okochi, H., Sato, E., Matsubayashi, Y., and Igawa, M.: Effect ofatmospheric humic-like substances on the enhanced dissolutionof volatile organic compounds into dew water, Atmos. Res., 87,213–223, doi:10.1016/j.atmosres.2007.11.003, 2008.
Petters, M. D. and Kreidenweis, S. M.: A single parameter repre-sentation of hygroscopic growth and cloud condensation nucleusactivity, Atmos. Chem. Phys., 7, 1961–1971, doi:10.5194/acp-7-1961-2007, 2007.
Pierson, W. R., Brachaczek, W. W., Gorse, R. A., Japar, S. M., andNorbeck, J. M.: On the acidity of dew, J. Geophys. Res., 91,4083, doi:10.1029/JD091iD03p04083, 1986.
Polkowska, Z., Błas, M., Klimaszewska, K., Sobik, M., Małk, S.,and Namiesnik, J.: Chemical characterization of dew water col-lected in different geographic regions of Poland, Sensors, 8,4006–4032, doi:10.3390/s8064006, 2008.
Pope, C. A., Burnett, R. T., Thun, M. J., Calle, E. E., Krewski, D.,and Thurston, G. D.: Lung cancer, cardiopulmonary mortality,and long-term exposure to fine particulate air pollution, J. Am.Med. Assoc., 287, 1132–1141, 2002.
Price, J. D. and Clark, R.: On the Measurement of Dewfall andFog-Droplet Deposition, Bound.-Lay. Meteorol., 152, 367–393,doi:10.1007/s10546-014-9930-6, 2014.
Reis, S., Pinder, R. W., Zhang, M., Lijie, G., and Sutton, M.A.: Reactive nitrogen in atmospheric emission inventories, At-mos. Chem. Phys., 9, 7657–7677, doi:10.5194/acp-9-7657-2009,2009.
Richards, K.: Observation and simulation of dew in ruraland urban environments, Prog. Phys. Geogr., 28, 76–94,doi:10.1191/0309133304pp402ra, 2004.
Rubio, M. A., Lissi, E., Villena, G., Elshorbany, Y. F., Kleffmann,J., Kurtenbach, R., and Wiesen, P.: Simultaneous measurementsof formaldehyde and nitrous acid in dews and gas phase in the
G. R. Wentworth et al.: Dew as a reservoir and morning source for ammonia 7449
atmosphere of Santiago, Chile, Atmos. Environ., 43, 6106–6109,doi:10.1016/j.atmosenv.2009.09.017, 2009.
Rubio, M. A., Lissi, E., Herrera, N., Pérez, V., and Fuentes,N.: Phenol and nitrophenols in the air and dew wa-ters of Santiago de Chile, Chemosphere, 86, 1035–1039,doi:10.1016/j.chemosphere.2011.11.046, 2012.
Sander, R.: Compilation of Henry’s law constants (version 4.0)for water as solvent, Atmos. Chem. Phys., 15, 4399–4981,doi:10.5194/acp-15-4399-2015, 2015.
Seinfeld, J. H. and Pandis, S. N.: Atmospheric Chemistry andPhysics: From Air Pollution to Climate Change, 2nd Edn., JohnWiley & Sons, Toronto, 2006.
Singh, S. P., Khare, P., Kumari, K. M., and Srivastava, S. S.:Chemical characterization of dew at a regional representa-tive site of North-Central India, Atmos. Res., 80, 239–249,doi:10.1016/j.atmosres.2005.09.003, 2006.
Sutton, M. A., Burkhardt, J. K., Guerin, D., Nemitz, E., and Fowler,D.: Development of resistance models to describe measurementsof bi-directional ammonia surface-atmosphere exchange, Atmos.Environ., 32, 473–480, doi:10.1016/S1352-2310(97)00164-7,1998.
Sutton, M. A., Reis, S., Riddick, S. N., Dragosits, U., Nemitz, E.,Theobald, M. R., Tang, Y. S., Braban, C. F., Vieno, M., Dore, A.J., Mitchell, R. F., Wanless, S., Daunt, F., Fowler, D., Blackall,T. D., Milford, C., Flechard, C. R., Loubet, B., Massad, R., Cel-lier, P., Personne, E., Coheur, P. F., Clarisse, L., Van Damme,M., Ngadi, Y., Clerbaux, C., Skjøth, C. A., Geels, C., Hertel,O., Wichink Kruit, R. J., Pinder, R. W., Bash, J. O., Walker, J.T., Simpson, D., Horváth, L., Misselbrook, T. H., Bleeker, A.,Dentener, F., and de Vries, W.: Towards a climate-dependentparadigm of ammonia emission and deposition, Philos. T. R. Soc.B, 368, 20130166, doi:10.1098/rstb.2013.0166, 2013.
Takenaka, N., Soda, H., Sato, K., Terada, H., Suzue, T., Bandow, H.,and Maeda, Y.: Difference in amounts and composition of dewfrom different types of dew collectors, Water. Air. Soil Pollut.,147, 51–60, doi:10.1023/A:1024573405792, 2003.
Takenaka, N., Takayama, K., Ojiro, N., Shimazaki, W., Ohira, K.,Soda, H., Suzue, T., Sadanaga, Y., Bandow, H., and Maeda, Y.:The chemistry of drying an aqueous solution of salts, J. Phys.Chem. A, 113, 12233–12242, doi:10.1021/jp9054395, 2009.
Takeuchi, M.: Deposition of coarse soil particles and ambientgaseous components dominating dew water chemistry, J. Geo-phys. Res., 108, 1–5, doi:10.1029/2002JD003058, 2003.
Takeuchi, M., Hasegawa, T., Okochi, H., and Igawa, M.: Sizedistribution of dew droplets and dew formation effect ondeposition fluxes, Bull. Chem. Soc. Jpn., 75, 1299–1300,doi:10.1246/bcsj.75.1299, 2002.
Wagner, G. H., Steele, K. F., and Peden, M. E.: Dew and FrostChemistry at a Midcontinent Site, United States, J. Geophys.Res., 97, 20591–20597, 1992.
Walker, J. T., Robarge, W. P., Wu, Y., and Meyers, T. P.: Measure-ment of bi-directional ammonia fluxes over soybean using themodified Bowen-ratio technique, Agr. Forest Meteorol., 138, 54–68, doi:10.1016/j.agrformet.2006.03.011, 2006.
Walker, J. T., Jones, M. R., Bash, J. O., Myles, L., Meyers, T.,Schwede, D., Herrick, J., Nemitz, E., and Robarge, W.: Pro-cesses of ammonia air–surface exchange in a fertilized Zea mayscanopy, Biogeosciences, 10, 981–998, doi:10.5194/bg-10-981-2013, 2013.
Wentworth, G. R., Murphy, J. G., Gregoire, P. K., Cheyne, C.A. L., Tevlin, A. G., and Hems, R.: Soil–atmosphere exchangeof ammonia in a non-fertilized grassland: measured emissionpotentials and inferred fluxes, Biogeosciences, 11, 5675–5686,doi:10.5194/bg-11-5675-2014, 2014.
Wesely, M. L.: Parameterization of surface resistances to gaseousdry deposition in regional-scale numerical models, Atmos. Envi-ron., 23, 1293–1304, doi:10.1016/j.atmosenv.2007.10.058, 1989.
Whitehead, J. D., Longley, I. D., and Gallagher, M. W.: Sea-sonal and Diurnal Variation in Atmospheric Ammonia in an Ur-ban Environment Measured Using a Quantum Cascade LaserAbsorption Spectrometer, Water Air Soil Poll., 181, 317–329,doi:10.1007/s11270-007-9381-5, 2007.
Wichink Kruit, R. J., van Pul, W. A. J., Otjes, R. P., Hofschreuder,P., Jacobs, A. F. G., and Holtslag, A. A. M.: Ammonia fluxesand derived canopy compensation points over non-fertilized agri-cultural grassland in The Netherlands using the new gradientammonia-high accuracy-monitor (GRAHAM), Atmos. Environ.,41, 1275–1287, doi:10.1016/j.atmosenv.2006.09.039, 2007.
Wichink Kruit, R. J., Schaap, M., Sauter, F. J., van Zanten, M. C.,and van Pul, W. A. J.: Modeling the distribution of ammoniaacross Europe including bi-directional surface–atmosphere ex-change, Biogeosciences, 9, 5261–5277, doi:10.5194/bg-9-5261-2012, 2012.
Wolfe, A. P., Van Gorp, A. C., and Baron, J. S.: Recent eco-logical and biogeochemical changes in alpine lakes of RockyMountain National Park (Colorado, USA): a response toanthropogenic, Geobiology, 1, 153–168, doi:10.1046/j.1472-4669.2003.00012.x, 2003.
Wyers, G. P. and Erisman, J. W.: Ammonia exchange over conif-erous forest, Atmos. Environ., 32, 441–451, doi:10.1016/S1352-2310(97)00275-6, 1998.
Xu, Y., Zhu, H., Tang, J., and Lin, Y.: Chemical Compositions ofDew and Scavenging Particles in Changchun, China, Adv. Mete-orol., 2015, 104048, doi:10.1155/2015/104048, 2015.
Yaalon, D. H. and Ganor, E.: Chemical Composition of Dew andDry Fallout in Jerusalem, Israel, Nature, 217, 1139–1140, 1968.
Yadav, S. and Kumar, P.: Pollutant scavenging in dew water col-lected from an urban environment and related implications,Air Qual. Atmos. Health, 7, 559–566, doi:10.1007/s11869-014-0258-7, 2014.
Ye, Y., Zhou, K., Song, L., Jin, J., and Peng, S.: Dew amountsand its correlations with meteorological factors in urbanlandscapes of Guangzhou, China, Atmos. Res., 86, 21–29,doi:10.1016/j.atmosres.2007.03.001, 2007.
Zhang, L., Wright, L. P., and Asman, W. A. H.: Bi-directional air-surface exchange of atmospheric ammonia: A review of mea-surements and a development of a big-leaf model for applicationsin regional-scale air-quality models, J. Geophys. Res.-Atmos.,115, D20310, doi:10.1029/2009JD013589, 2010.
Zhou, X., Civerolo, K., Dai, H., Huang, G., Schwab, J., and Demer-jian, K.: Summertime nitrous acid chemistry in the atmosphericboundary layer at a rural site in New York State, J. Geophys.Res.-Atmos., 107, 1–11, doi:10.1029/2001JD001539, 2002.
Zhu, L., Henze, D., Bash, J., Jeong, G.-R., Cady-Pereira, K., Shep-hard, M., Luo, M., Paulot, F., and Capps, S.: Global evalu-ation of ammonia bidirectional exchange and livestock diur-nal variation schemes, Atmos. Chem. Phys., 15, 12823–12843,doi:10.5194/acp-15-12823-2015, 2015.