The Role of Psychological Characteristics in the Relation Between Socioeconomic Status and Perceived Health 1 SHELDON COHEN2 Carnegie Mellon University GEORGE A. KAPLAN Human Population Laboratory California Department of Health Services JUKKA T. SALONEN University of Kuopio. Finland Separate analyses of United States and Finnish samples demonstrate a graded (almost lin- ear) relation between socioeconomic status (SES) and risk of poor perceived health. In both studies, positive psychological factors (greater social support; less anger, depression, and perceived stress) and beneficial health practices (nonsmoking; drinking and exercis- ing moderately) were associated with both higher levels of SES and better self-reported health. Psychological and health practice variables were both able to account for some of the SES and poor health gradient. However, contrary to expectations, these factors did not playa more important role in explaining decreasedrisk at the middle and highest levels of SES, and instead may be most important at lowest levels. Personslow in socioeconomic status (SES) suffer from relatively poor health. This relation holds, irrespective of whether SES is measured as education, income, or occupation. Moreover, it is found for rates of mortality and morbidity from almost every disease condition (Antonovsky, 1967; Illsley & Baker, 1991; Kaplan, Haan, Syme, Minkler, & Winkleby, 1987; Syme & Berkman, 1976). Although many authors have focused on comparing individuals at the very bot- tom of the SES hierarchy to those who are better off, a number have emphasized that there is evidence for an association between increasing SES and increasing health at every level of the SES hierarchy, not just in comparisons with those below the threshold of poverty (e.g., Adler et al., 1994; Haan, Kaplan, & Syme, 1989; Marmot, Kogevinas, & Elston, 1987). 1 Preparation of this article was supported by the John D. and Catherine T. MacArthur Foundation Planning Initiative on Socioeconomic Status and Health, by a Senior Scientist Award from the National Institute of Mental Health (MHOO721) to S. Cohen, and by a grant from the National Heart, Lung and Blood Institute (HL44199) to G. A. Kaplan, and grants from the Academy of Finland and the Finnish Ministry of Education to J. T. Salonen. 2Correspondence concerning this article should be addressed to Sheldon Cohen, Department of Psychology, Carnegie Mellon University, Pittsburgh, PA 15213. e-mail: [email protected]. 445 Journal of Applied Social Psychology, 1999,29,3, pp. 445-468 Copyright @ 1999 by V. H. Winston & Son, Inc. All rights reserved.
Transcript
The Role of Psychological Characteristics in theRelation Between Socioeconomic Status and
Perceived Health 1
SHELDON COHEN2
Carnegie Mellon University
GEORGE A. KAPLAN
Human Population Laboratory
California Department of Health Services
JUKKA T. SALONEN
University of Kuopio. Finland
Separate analyses of United States and Finnish samples demonstrate a graded (almost lin-ear) relation between socioeconomic status (SES) and risk of poor perceived health. In
both studies, positive psychological factors (greater social support; less anger, depression,and perceived stress) and beneficial health practices (nonsmoking; drinking and exercis-ing moderately) were associated with both higher levels of SES and better self-reportedhealth. Psychological and health practice variables were both able to account for some ofthe SES and poor health gradient. However, contrary to expectations, these factors did notplaya more important role in explaining decreased risk at the middle and highest levels of
SES, and instead may be most important at lowest levels.
Persons low in socioeconomic status (SES) suffer from relatively poor health.This relation holds, irrespective of whether SES is measured as education,income, or occupation. Moreover, it is found for rates of mortality and morbidityfrom almost every disease condition (Antonovsky, 1967; Illsley & Baker, 1991;Kaplan, Haan, Syme, Minkler, & Winkleby, 1987; Syme & Berkman, 1976).Although many authors have focused on comparing individuals at the very bot-tom of the SES hierarchy to those who are better off, a number have emphasizedthat there is evidence for an association between increasing SES and increasinghealth at every level of the SES hierarchy, not just in comparisons with thosebelow the threshold of poverty (e.g., Adler et al., 1994; Haan, Kaplan, & Syme,1989; Marmot, Kogevinas, & Elston, 1987).
1 Preparation of this article was supported by the John D. and Catherine T. MacArthur Foundation
Planning Initiative on Socioeconomic Status and Health, by a Senior Scientist Award from the
National Institute of Mental Health (MHOO721) to S. Cohen, and by a grant from the National Heart,Lung and Blood Institute (HL44199) to G. A. Kaplan, and grants from the Academy of Finland and
the Finnish Ministry of Education to J. T. Salonen.
2Correspondence concerning this article should be addressed to Sheldon Cohen, Department of
Psychology, Carnegie Mellon University, Pittsburgh, PA 15213. e-mail: [email protected].
445
Journal of Applied Social Psychology, 1999,29,3, pp. 445-468
Copyright @ 1999 by V. H. Winston & Son, Inc. All rights reserved.
446 COHEN ET AL.
There is substantial evidence for a graded relation with every increment inSES associated with an increment in health. Studies reporting evidence for gradedrelations between SES and prevalence of disease include a study where the fre-quency of 32 of 37 conditions increased with decreased educational attainment(Pincus, Callahan, & Burkhauser, 1987). A study of patients with rheumatoidarthritis similarly indicated that the lower a patient's educational level, the greaterthe chance of subsequent mortality or major decline in functional status (Pincus &Callahan, 1985). Other notable examples of the SES gradient are the associationbetween rank in the British Civil Service and mortality (Marmot, Shipley, & Rose,1984), a drop in occupational status and increased mortality (Susser, Watson, &Hopper, 1985), and decreased education (Kitagawa & Hauser, 1973; Pappas,Queen, Hadden, & Fisher, 1993) and income and increased mortality (Pappaset al., 1993). Further examples of this gradient are given in a number of reviews(e.g., Antonovsky, 1967; Haan et al., 1989; Kaplan et al., 1987; Marmot et al.,1987; Syme & Berkman, 1976). In many cases, the gradient is approximately lin-ear (e.g., Marmot et al., 1987), although others find that those lowest in SES(especially income) have a somewhat accentuated risk ( e.g., Pappas et al., 1993 ).
The graded nature of the SES and health relation presents a puzzle in regardto how SES influences health. Traditional explanations for the association oflower SES and poor health include poorer health care, greater environmental risk,poorer nutrition, and poorer health practices among lower SES groups. Althoughthese provide plausible explanations of why persons lowest on the gradient sufferfrom poorer health, it is less clear why observed differences occur on the middle
and highest parts of the gradient.There are three categories of possible explanations for the graded association
between SES and health (Adler et al., 1994; Black, Morris, Smith, & Townsend,1982; Haan et al., 1989; Marmot et al., 1987): (a) genetically based differencesexist between SES groups; (b) illness influences SES (drift hypothesis), ratherthan SES influencing illness; and (c) SES affects biological function that in turninfluences health status. Adler et al. (1994) argue that although the first twoexplanations might contribute to the gradient, on the whole they are relativelyimplausible explanations. They instead focus on the third explanation. Theirargument is that components of SES, including income, education, and occupa-tion, shape one's life course and are enmeshed in key domains of life, includingthe physical and social environment, socialization and experiences that influencepsychological development, and ongoing mood, cognition, and health practices(Anderson & Armstead, 1995). Recent evidence suggests that increasing SES isassociated with more positive mood and cognition (Barefoot et al., 1991; Houseet al., 1992, 1994; Mat thews, Kelsey, Meilahn, Kuller, & Wing, 1989; Ross &Wu, 1995) as well as with the performance of more beneficial health practices(e.g., Matthews et al., 1989; Ross & Wu, 1995). Increases in these psychologicaland behavioral characteristics with increases in SES may explain the graded
PSYCHOLOGICAL FACTORS, SES, AND HEALTH 447
relation between SES and health (House et al., 1990, 1992; Ross & Wu, 1995;Williams, 1990), especially the decreased risk at the middle through highest lev-els of SES where there may be little health-relevant variation in the quality ofphysical environments or health care (Adler et al., 1994).
This article is an attempt to assess whether health practices and psychologicalcharacteristics can help us to understand part of the graded relation between SESand health. We present data from two large studies that include information onSES, self-reported health, psychological variables, and health practices. The twosamples differ in age, gender composition, nationality, SES scaling, and range,and we present both to test the generality of the relations we address.
One data set derives from a survey of a probability sample of the UnitedStates conducted in 1983 to assess the role of stress in people's lives (HarrisPoll). The other derives from the data collected between 1984 and 1989 in an epi-demiologic study of Finnish men at risk for coronary heart disease (KuopioIschemic Heart Disease Risk Factor Study [KIHD]). In both cases, we establishthe graded type relation between SES and health found in the work described ear-lier. We then attempt to assess the extent to which the relation may reflect pat-terns of health practices and psychological factors which differ between SESlevels. The studies we report here were not primarily designed to examine thehypotheses we propose, and the psychometric quality of the measures is some-times not optimal. In this context, it is a testimony to the robustness of the rela-tions we find that there are clear associations and that they occur consistentlyacross the two studies.
The outcome in both studies we report is self-reported physical health. Self-reported health reflects an individual's awareness of symptoms, diagnoses, andperformance decrements and is a reasonable (but imperfect) marker of health sta-tus. More than a dozen long-term prospective studies have reported an associa-tion between self-reported poor health and mortality (e.g., Idler, 1992; Kaplan,Barell, & Lusky, 1988; Kaplan & Camacho, 1983). Although self-reports ofhealth may reflect biases in interpreting physical sensations as well as underlyingpathophysiology (Cohen & Williamson, 1991), the vast majority of variance inthis measure has been found to be attributable to functional status, diagnosedphysical illness, and medication use (Schulz et al., 1994). Keeping its limitationsin mind, we treat self-reported health as a marker of subclinical and clinical mor-bidity and as a direct indicator of perceptions of health status.
Method
Participants
Harris Poll study. Respondents were 960 men and 1,427 women residents ofthe United States, 18 years of age and older (mean age = 42.8, SD = 17.2), who
448 COHEN ET AL.
completed a telephone interview conducted by Louis Harris and Associates, Inc.in 1983. No contact was made at 1,819 phone numbers. The 2,387 persons meet-ing the criteria for inclusion in the analyses represented 73.8% of the 3,235 eligi-ble individuals with whom telephone contact was made (926 refused to beinterviewed, and 117 terminated the interview prior to completion).
KIND study. Of the 3,433 men, aged 42,48,54, and 60 years old, residing inthe town of Kuopio, Finland, or its surrounding rural communities, 2,682 (82.9%of the 3,235 eligible men) agreed to participate in a 2-day examination. Of the non-participants, 198 were excluded because of death between listing on the populationregistry and baseline data collection, serious illness, or migration out of the area.
Sampling Techniques
Harris Poll study. Based on Bureau of Census information, a national areaprobability sample was developed from the distribution of the adult, noninstitu-tionalized population of the United States. Stratification was done according togeographic regions and by size of residential community. With counties as pri-mary sampling units, a random-digit dialing procedure was used to select tele-phone numbers to be called within each sampling unit. To further ensure anunbiased sample, the interviewer asked to speak to the person in the householdwho was 18 years of age or over and whose birthday had been most recent. Atotal of2,387 respondents was interviewed. The demographic profile of the sam-ple population obtained through these procedures closely matched statistics fromthe 1980 U.S. Census.
KIHD study. The sampling frame for the KIHD study was based on a popula-tion registry which includes all Finnish citizens. Subjects were recruited in twowaves. The first group (n = 1,166) was selected from all men aged 54 years ofage in the area, with baseline data collection beginning March 1984 and endingJune 1986. The second group consisted of a stratified random sample of one thirdof the men aged 42, 48, 54, and 60 years of age, with baseline data collectionbetween August 1986 and December 1989.
Measures of SES and Demographics
Because the two samples derive from different cultures, the SES categoriesare not directly comparable. In the case of education, the educational systems aredesigned differently, and thus specific completion ofa particular level is not com-parable to the completion of the same level in the other system. For example, ahigh-school degree in Finland is probably equivalent to lor 2 years of college inthe United States. In the case of income, converting Finnish currencies into dol-lars does not provide comparable categories in terms of actual spending power.As a consequence, we only compare specific income and educational categories
PSYCHOLOGICAL FACTORS, SES, AND HEALTH 449
within countries. Cross-country comparisons focus on the nature of the entire dis-tribution of SES categories in relation to specific variables ( e.g., poor health).
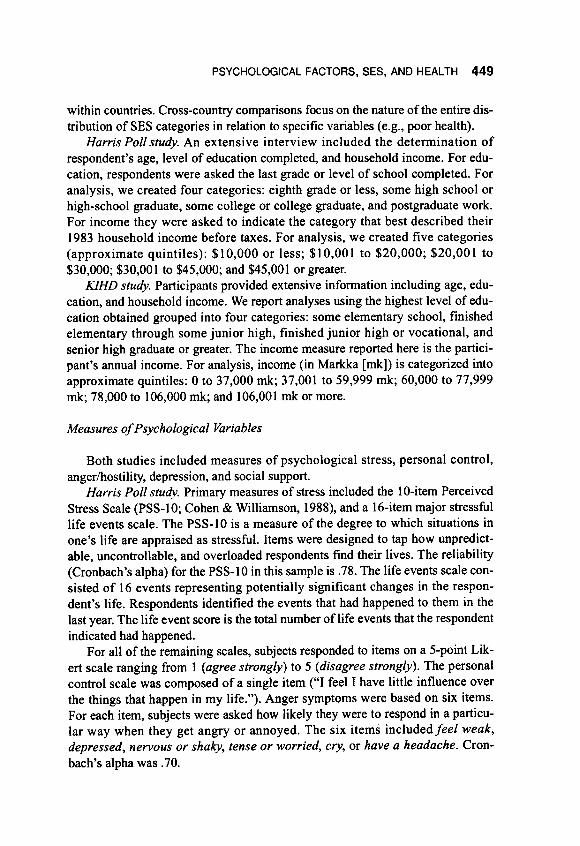
Harris Poll study. An extensive interview included the determination ofrespondent's age, level of education completed, and household income. For edu-cation, respondents were asked the last grade or level of school completed. Foranalysis, we created four categories: eighth grade or less, some high school orhigh-school graduate, some college or college graduate, and postgraduate work.For income they were asked to indicate the category that best described their1983 household income before taxes. For analysis, we created five categories(approximate quintiles): $10,000 or less; $10,001 to $20,000; $20,001 to$30,000; $30,001 to $45,000; and $45,001 or greater.
KIHD study. Participants provided extensive information including age, edu-cation, and household income. We report analyses using the highest level of edu-cation obtained grouped into four categories: some elementary school, finishedelementary through some junior high, finished junior high or vocational, andsenior high graduate or greater. The income measure reported here is the partici-pant's annual income. For analysis, income (in Markka [mk]) is categorized intoapproximate quintiles: 0 to 37,000 mk; 37,001 to 59,999 mk; 60,000 to 77,999mk; 78,000 to 106,000 mk; and 106,001 mk or more.
Measures of Psychological Variables
Both studies included measures of psychological stress, personal control,anger/hostility, depression, and social support.
Harris Poll study. Primary measures of stress included the 10-item PerceivedStress Scale (PSS-IO; Cohen & Williamson, 1988), and a 16-item major stressfullife events scale. The PSS-10 is a measure of the degree to which situations inone's life are appraised as stressful. Items were designed to tap how unpredict-able, uncontrollable, and overloaded respondents find their lives. The reliability(Cronbach 's alpha) for the PSS-I 0 in this sample is. 78. The life events scale con-sisted of 16 events representing potentially significant changes in the respon-dent's life. Respondents identified the events that had happened to them in thelast year. The life event score is the total number of life events that the respondent
indicated had happened.For all of the remaining scales, subjects responded to items on a 5-point Lik-
ert scale ranging from I (agree strongly) to 5 (disagree strongly). The personalcontrol scale was composed of a single item ("I feel I have little influence overthe things that happen in my life."). Anger symptoms were based on six items.For each item, subjects were asked how likely they were to respond in a particu-lar way when they get angry or annoyed. The six items included feel weak,depressed, nervous or shaky, tense or worried, cry, or have a headache. Cron-
bach's alpha was. 70.
450 COHEN ET AL.
Social support was assessed by three items addressing the perception of sup-port from others. The items included "1 can always rely on my spouse or girl-friend (boyfriend) for emotional support," "1 often feel lonely, like I don't haveanyone to reach out to," and "My family and friends provide me with satisfactionand a sense of strength." The reliability of the scale was .53.
KIND study. The stress measure was a 33-item major stressful life eventsscale. Life events were assessed by reports of their occurrence during the last 12months. Because the responses were highly skewed (toward 0), respondents weregrouped into approximate tertiles-O, 1, or 2 or more events. Personal controlwas assessed with a two-item hopelessness measure (presumably the opposite offeelings of control) scored on a 5-point Likert scale and added together (higherscores indicate less control). The score is strongly associated with risk of deathfrom all causes and other outcomes (Everson et al., 1996).
Social support was assessed using the Quality of Social Relationship Scale(Kaplan et al., 1994). The eight items reflect the extent to which the respondentfeels loved and close to others. The scale is significantly associated with risk ofdeath (Kaplan et al., 1994). The scale's reliability in this sample was .83.
Anger was assessed by a short eight-item version of the Cook-Medley Hostil-ity scale. The scale assesses cynical distrust and is thought to reflect the majortoxic component of hostility. In this cohort, it is independently related to progres-sion of carotid atherosclerosis (Julkunen, Salonen, Kaplan, Chesney, & Salonen,1994). Cronbach's alpha was .80, and the 12-month test-retest correlation was
.82.Finally, depression was measured with a shortened, 59-item version of the
Minnesota Multiphasic Personality Inventory Depression scale which has beenused previously in Finnish populations. Raw scores were converted to t scores.Those in the top quartile are at significantly increased risk of death from cardio-vascular causes in this sample (Everson et al., 1995). Cronbach's alpha was. 71and the 12-month test-retest correlation was .66.
Measures of Health Practices
Health practices assessed in both studies included smoking, alcohol con-
sumption, and exercise.Harris Poll study. Respondents were categorized as either current smokers or
nonsmokers. Frequency (1 = never to 7 = daily) and quantity (1 = J drink to 5 =
more than 5 drinkl:) of alcoholic beverage consumption was also assessed. Drinkrate was computed by multiplying the number of days a person drank by thenumber of beverages consumed on an average day they drank. This result is cate-gorized as either 0 drinks per day, more than 0 but not more than I drink per day,more than I but not more than 2 drinks per day, and more than 2 drinks per day.Subjects rated how often they exercised strenuously for at least 20 min on a scale
PSYCHOLOGICAL FACTORS, SES, AND HEALTH 451
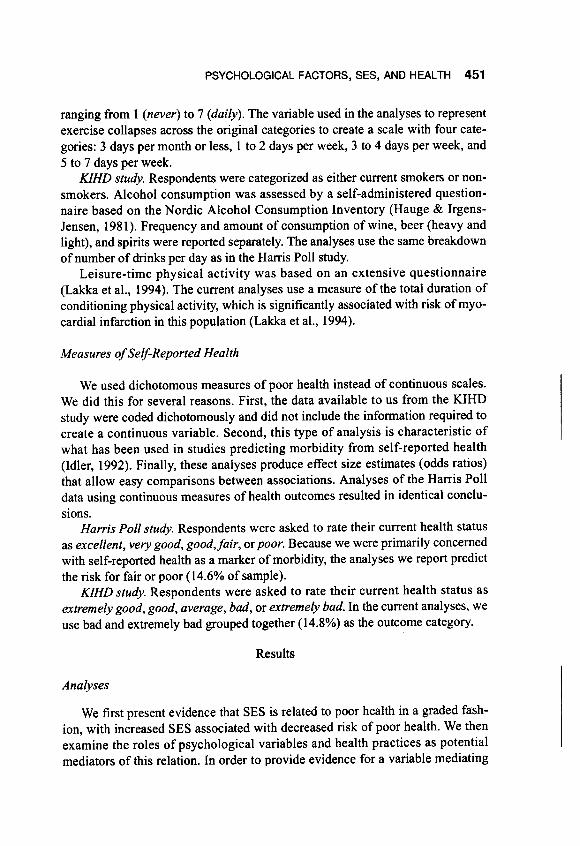
ranging from 1 (never) to 7 (daily). The variable used in the analyses to representexercise collapses across the original categories to create a scale with four cate-gories: 3 days per month or less, 1 to 2 days per week, 3 to 4 days per week, and5 to 7 days per week.
KIND study. Respondents were categorized as either current smokers or non-smokers. Alcohol consumption was assessed by a self-administered question-naire based on the Nordic Alcohol Consumption Inventory (Hauge & Irgens-Jensen, 1981 ). Frequency and amount of consumption of wine, beer (heavy andlight), and spirits were reported separately. The analyses use the same breakdownof number of drinks per day as in the Harris Poll study.
Leisure-time physical activity was based on an extensive questionnaire(Lakka et al., 1994). The current analyses use a measure of the total duration ofconditioning physical activity, which is significantly associated with risk ofmyo-cardial infarction in this population (Lakka et al., 1994).
Measures of Self-Reported Health
We used dichotomous measures of poor health instead of continuous scales.We did this for several reasons. First, the data available to us from the KIHDstudy were coded dichotomously and did not include the information required tocreate a continuous variable. Second, this type of analysis is characteristic ofwhat has been used in studies predicting morbidity from self-reported health(Idler, 1992). Finally, these analyses produce effect size estimates ( odds ratios)that allow easy comparisons between associations. Analyses of the Harris Polldata using continuous measures of health outcomes resulted in identical conclu-
sions.Harris Poll study. Respondents were asked to rate their current health status
as excellent, very good, good,fair, or poor. Because we were primarily concernedwith self-reported health as a marker of morbidity, the analyses we report predictthe risk for fair or poor (14.6% of sample).
KIHD study. Respondents were asked to rate their current health status asextremely good, good, average, bad, or extremely bad. In the current analyses, weuse bad and extremely bad grouped together (14.8%) as the outcome category.
Results
Analyses
We first present evidence that SES is related to poor health in a graded fash-ion, with increased SES associated with decreased risk of poor health. We thenexamine the roles of psychological variables and health practices as potentialmediators of this relation. In order to provide evidence for a variable mediating
452 COHEN ET AL
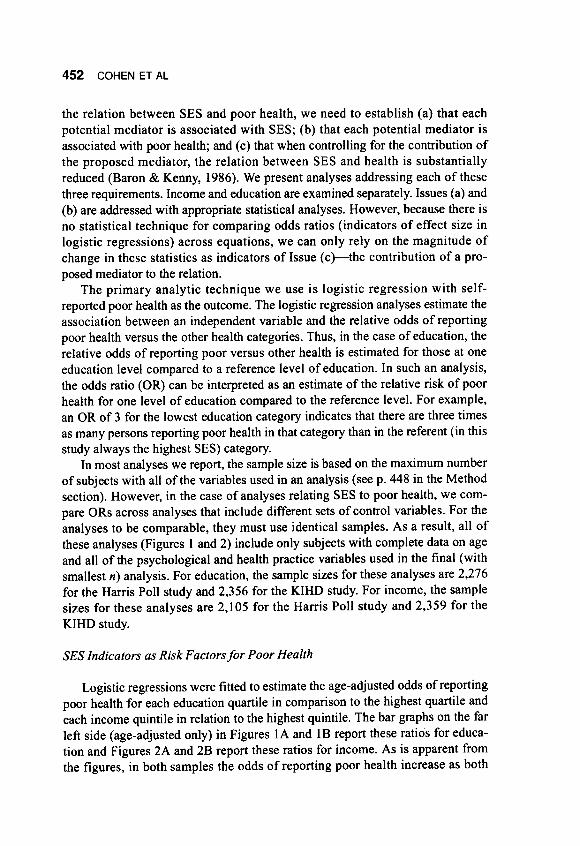
the relation between SES and poor health, we need to establish (a) that eachpotential mediator is associated with SES; (b) that each potential mediator isassociated with poor health; and ( c ) that when controlling for the contribution ofthe proposed mediator, the relation between SES and health is substantiallyreduced (Baron & Kenny, 1986). We present analyses addressing each of thesethree requirements. Income and education are examined separately. Issues (a) and(b) are addressed with appropriate statistical analyses. However, because there isno statistical technique for comparing odds ratios (indicators of effect size inlogistic regressions) across equations, we can only rely on the magnitude ofchange in these statistics as indicators of Issue ( c )-the contribution of a pro-posed mediator to the relation.
The primary analytic technique we use is logistic regression with self-reported poor health as the outcome. The logistic regression analyses estimate theassociation between an independent variable and the relative odds of reportingpoor health versus the other health categories. Thus, in the case of education, therelative odds of reporting poor versus other health is estimated for those at oneeducation level compared to a reference level of education. In such an analysis,the odds ratio (OR) can be interpreted as an estimate of the relative risk of poorhealth for one level of education compared to the reference level. For example,an OR of 3 for the lowest education category indicates that there are three timesas many persons reporting poor health in that category than in the referent (in this
study always the highest SES) category.In most analyses we report, the sample size is based on the maximum number
of subjects with all of the variables used in an analysis (see p. 448 in the Methodsection). However, in the case of analyses relating SES to poor health, we com-pare ORs across analyses that include different sets of control variables. For theanalyses to be comparable, they must use identical samples. As a result, all ofthese analyses (Figures 1 and 2) include only subjects with complete data on ageand all of the psychological and health practice variables used in the final (withsmallest n) analysis. For education, the sample sizes for these analyses are 2,276for the Harris Poll study and 2,356 for the KIHD study. For income, the samplesizes for these analyses are 2,105 for the Harris Poll study and 2,359 for the
KIHD study.
SES Indicators as Risk Factors for Poor Health
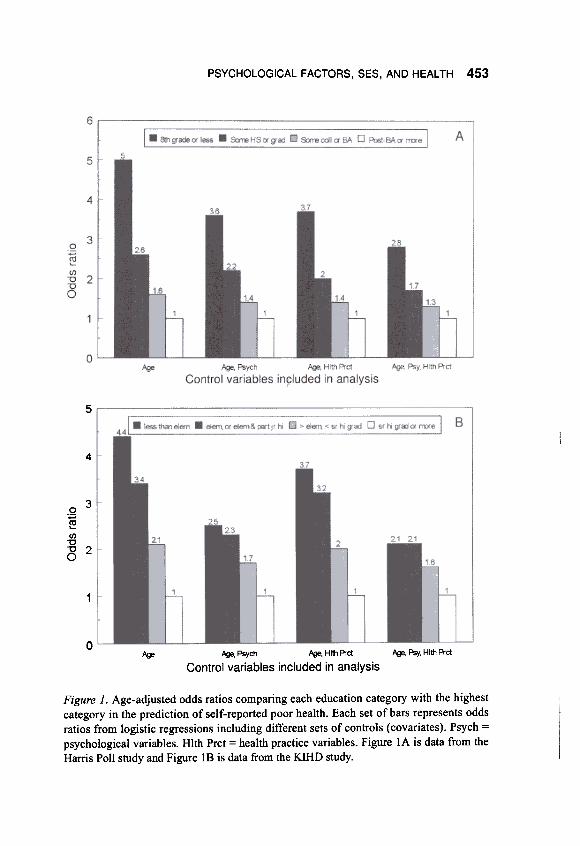
Logistic regressions were fitted to estimate the age-adjusted odds of reportingpoor health for each education quartile in comparison to the highest quartile andeach income quintile in relation to the highest quintile. The bar graphs on the farleft side (age-adjusted only) in Figures IA and IB report these ratios for educa-tion and Figures 2A and 2B report these ratios for income. As is apparent fromthe figures, in both samples the odds of reporting poor health increase as both
PSYCHOLOGICAL FACTORS, SES, AND HEAL TH 453
5
4
.2 3
~(/)"0"0 2O
1
0~, Psy, Hlth A-ct~ psych ~, Hltt1 Prct
Control variables included in analysis~
Figure 1. Age-adjusted odds ratios comparing each education category with the highestcategory in the prediction of self-reported poor health. Each set of bars represents oddsratios from logistic regressions including different sets of controls (covariates). Psych =
psychological variables. Hlth Prct = health practice variables. Figure lA is data from the
Harris Poll study and Figure 18 is data from the KIHD study.
454 COHEN ET AL.
5
4
Q 3'@"'"0
8 2
0~ f./¥', Psych f./¥', Hlth Prct
Control variables included in analysis~, Psy, Hlt!1 Prct
6
5
.2 4
~In"0 3"0O
2
1
0~ ~. Psych ~. Hlth Prct
Control variables included in analysis.AQe, Psy, Hlth Prct
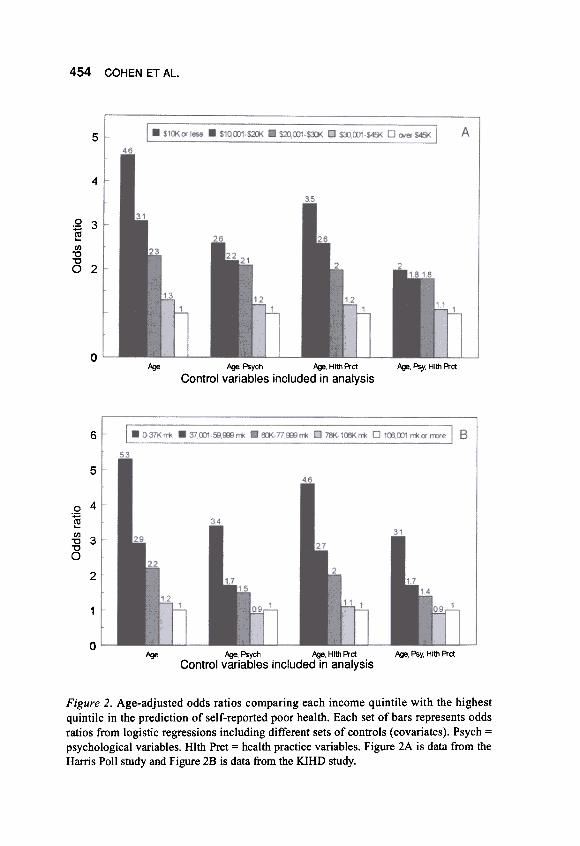
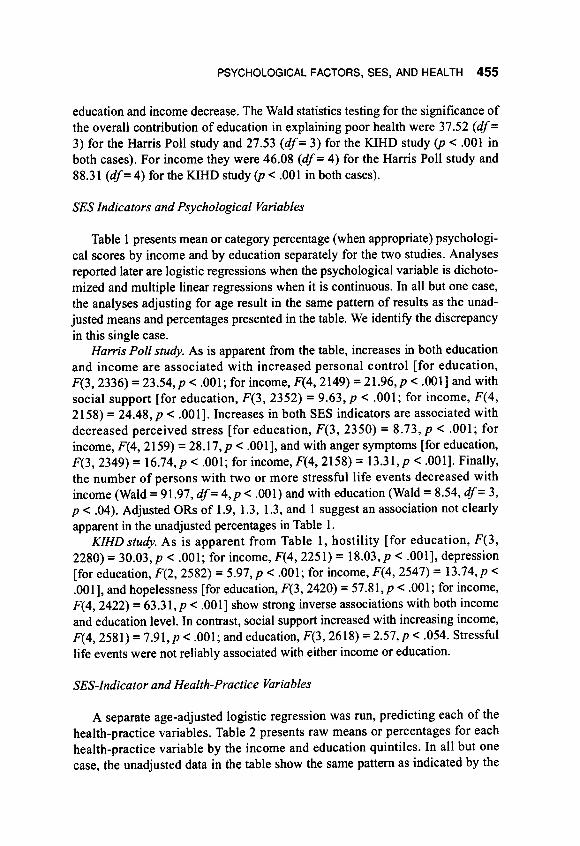
Figure 2. Age-adjusted odds ratios comparing each income quintile with the highestquintile in the prediction of self-reported poor health. Each set of bars represents oddsratios from logistic regressions including different sets of controls (covariates). Psych =psychological variables. Hlth Prct = health practice variables. Figure 2A is data from the
Harris Poll study and Figure 2B is data from the KIHD study.
PSYCHOLOGICAL FACTORS, SES, AND HEALTH 455
education and income decrease. The Wald statistics testing for the significance ofthe overall contribution of education in explaining poor health were 37.52 (dl=3) for the Harris Poll study and 27.53 (dl= 3) for the KIHD study (p < .001 inboth cases). For income they were 46.08 (dl= 4) for the Harris Poll study and88.31 (dl= 4) for the KIHD study (p < .001 in both cases).
SES Indicators and Psychological Variables
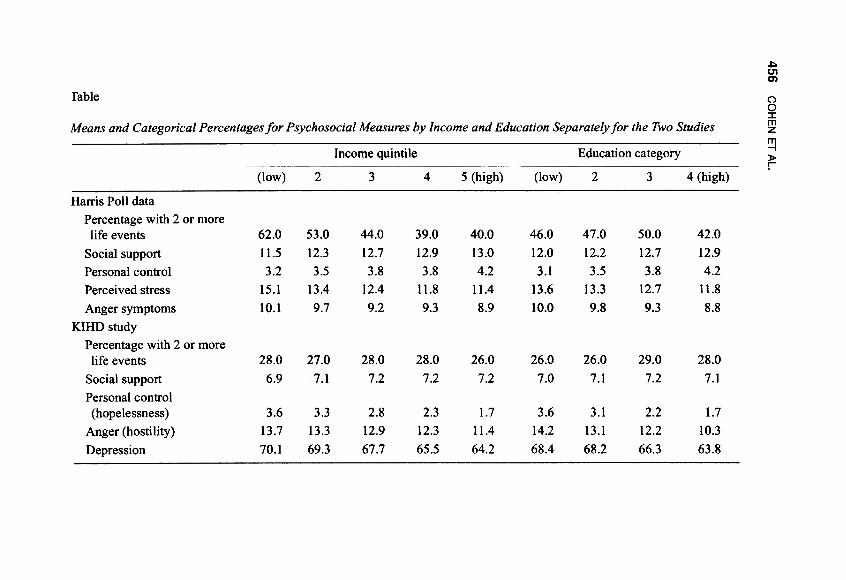
Table 1 presents mean or category percentage (when appropriate) psychologi-cal scores by income and by education separately for the two studies. Analysesreported later are logistic regressions when the psychological variable is dichoto-mized and multiple linear regressions when it is continuous. In all but one case,the analyses adjusting for age result in the same pattern of results as the unad-justed means and percentages presented in the table. We identify the discrepancy
in this single case.Harris Poll study. As is apparent from the table, increases in both education
and income are associated with increased personal control [for education,F(3, 2336) = 23.54,p < .001; for income, F(4, 2149) = 21.96,p < .001] and withsocial support [for education, F(3, 2352) = 9.63,p < .001; for income, F(4,2158) = 24.48, p < .001 ] .Increases in both SES indicators are associated withdecreased perceived stress [for education, F(3, 2350) = 8.73, p < .001; forincome, F(4, 2159) = 28.17, p < .001], and with anger symptoms [for education,F(3, 2349) = 16.74, p < .001; for income, F(4, 2158) = 13.31, p < .001]. Finally,
the number of persons with two or more stressful life events decreased withincome (Wald = 91.97, dl= 4,p < .001) and with education (Wald = 8.54, dl= 3,
p < .04). Adjusted ORs of 1.9, 1.3, 1.3, and 1 suggest an association not clearlyapparent in the unadjusted percentages in Table 1.
KIHD study. As is apparent from Table 1, hostility [for education, F(3,2280) = 30.03,p < .001; for income, F(4, 2251) = 18.03,p < .001], depression[for education, F(2, 2582) = 5.97, p < .001; for income, F(4, 2547) = 13. 74,p <.001], and hopelessness [for education, F(3, 2420) = 57.81,p < .001; for income,
F(4, 2422) = 63.31,p < .001] show strong inverse associations with both incomeand education level. In contrast, social support increased with increasing income,F(4, 2581) = 7.91,p < .001; and education, F(3, 2618) = 2.57,p < .054. Stressful
life events were not reliably associated with either income or education.
SES-Indicator and Health-Practice Variables
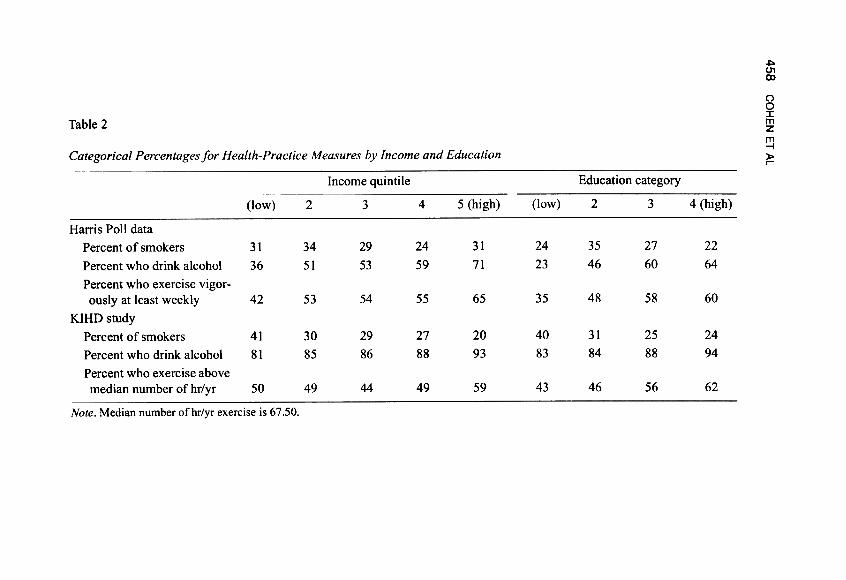
A separate age-adjusted logistic regression was run, predicting each of thehealth-practice variables. Table 2 presents raw means or percentages for eachhealth-practice variable by the income and education quintiles. In all but onecase, the unadjusted data in the table show the same pattern as indicated by the
456 C
OH
EN
E
T
AL.
~:0~
"'.~-s~t")c~~~...
~..?:-~~~e-r;')~c.-...~\J;s
~~~~~Ec\J
~.:6'
~;s"'~~~.-\Jc"'c~\Jf;;-Q
,;...
~"'~~~~~-~\J.~c~...
c;,3
~~~"'~~~
.£.==.g.ueo~- c000Q)
~uco.~~u=-0~
N M 'Ot
,-,-fo6IrI
N M ,-.,'fo6..,.~oc,,-..~0::::,
O('f")'r1"1't-
~N
~~
o\'r1 O
r---OO
VN
..'..N..;N
o\v- O
OlO
OO
Orf")
0\ N
...;...:. 0\
rf")- -
OO
N'O
I'OI
o..;.":'..;oci'01'
00-\00-oN
r.-ir.-io~
---
O~
l/')r"IOO
r-.."Nr..)r..)O
\-.t-
-
or-oor oN
;N
o\
II') --
OO
\NO
OO
ON
N
.q: :00
.q.- -
0 V
) ~
N
...;Mor\o
-.0
u u
o o
e e
o 0
N
"' N
-~
---5
o~
"' -5
o'00'a.-t
b U
0
.-t b
"' .-
;3~
o=l::p.
~
0=2::.;
"'U!!J.C
.Ot1)~
U
!!J.C.O
..",=~
01!=
c.U
~
"' >
-01!=
c.U~
00
=
"' U
~
-=
U
~
~
"'
U
~
-=
U
,c, .rn
->
~.
.~
>
~.
!:j ->
~
. .~
--"'
,,0 =
u
-=
=
u -=
u
...u-u
"'OU
U"'U
"'°C
.U...
"' ~
~
.u
~
~
01! '"'
~
~
.u ~
0
01! c.
.t: u
.-0 u
u =
u
.-0 u
.=
=
u
...~-rn~
~<
:I:~-rn~
'-'<O
"' -
:I: ~
O
0-~
ION 0-~~
N ON
OO
r-.:N O
Noor..:N O
N
I.c)r...:N 00lO
r-.:N 0
-IoC
r..:N O
N
O\r-.:
N 0:-:oor-N
\Ot"--
r..)r..)o-t"-
r'"Ir'"Ir'"I...;...;0.;
-1,0
OO
OIr-.
N
N
r-.:--0
t"It"IV)
NN
.';-'0
t'-~N
...; ...;
~-'-0
;oN-:!"
M..':oO
-;0
~~
C"i
MM
OO-10
N
N
r'"\N
N-o
1,0
r---~oo
.-:0...;--0
PSYCHOLOGICAL FACTORS, SES, AND HEAL TH 457
age-adjusted ORs that result from the logistic regressions. We note the singleexception in our description of the results.
Harris Poll study. Relations between SES and smoking were irregular andinconsistent across education and income. The greatest smoking occurred amongthe two lowest and the highest income quintiles, with the lowest likelihood ofsmoking occurring in the fourth quintile (Wald = 12.3, dl= 4,p < .02). Similarly,
the lowest smoking rates were in the lowest and highest education quartiles.However, this is the single case where age-adjusted ORs display a different pat-tern, with those below the median in education more likely to smoke than thoseabove the median (ORs = 1.5, 1.9, 1.3, I; Wald = 29.0, dl= 3,p < .001). Increases
in both income and education were associated with a greater likelihood of exer-cising vigorously (Wald = 19.5, dl= 4,p < .001; Wald = 17.6, dl= 3,p < .001,respectively) and drinking alcohol (Wald = 62.3, dl= 4,p < .001; Wald = 66.2,
dl= 3,p < .001, respectively).KIHD study. Smoking decreased with increasing income and education (for
income, Wald = 56.6, dl= 4, p < .001; for education, Wald = 30.9, dl= 3,p <
.001). The percentage of persons who drink alcohol increased with SES (forincome, Wald = 23.8, dl= 4,p < .001; for education, Wald = 14.8, dl= 3,p <.002). Duration of physical activity increased with education (Wald = 41.0, dl=
3,p < .001), but was less regularly associated with income although there was apeak in highest income group (Wald = 25.9, dl= 4,p < .001).
Psychological Variables as Risk Factors for Poor Health
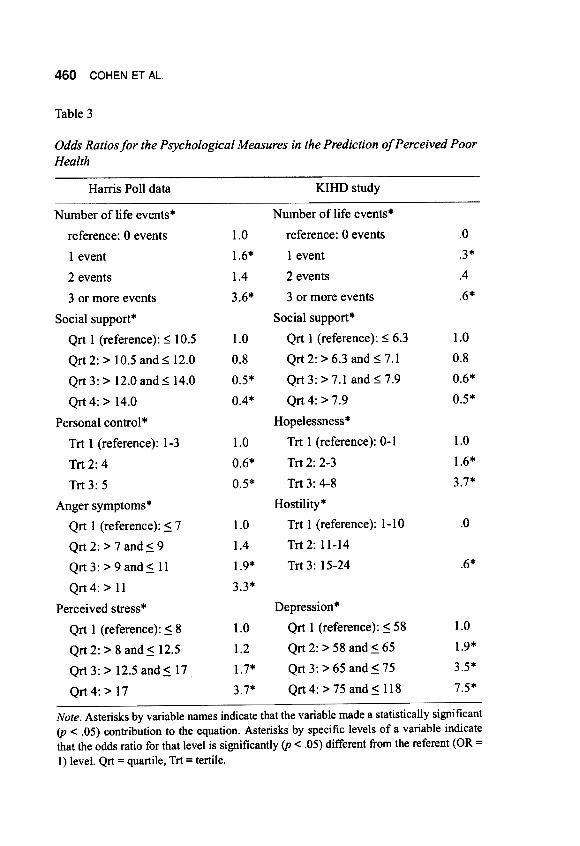
A separate age-adjusted logistic regression was run for each of the psycholog-ical variables predicting risk of poor health. This provides the approximate age-adjusted relative risk for each psychological variable. In the following section,we present the Wald statistics that indicate whether each variable contributed tothe explanation of poor health. Table 3 presents the ORs for each category ofeach psychological variable. This allows a closer examination of the nature ofeach relation. Continuous variables were categorized for these analyses (quartilesif the distribution allowed and tertiles if it did not) so that ORs could be calcu-lated. Age is treated as a continuous variable in all analyses. ORs that were sig-nificantly different from the reference category are indicated by asterisks in the
table.Harris Poll data. Higher scores on the life events (Wald = 59.93, dl= 3, p <
.001), perceived stress (Wald = 71.31, dl= 3,p < .001), and anger symptoms(Wald = 56.93, dl= 3, p < .001) scales were all related to greater risk of poorhealth, while higher scores on social support (Wald = 39.81, dl= 3,p < .001) andpersonal control (Wald = 24.40, dl= 2, p < .001) were associated with less risk.Examination of the ORs comparing each level of the category to its referencelevel suggests the approximate linearity of all of these relations.
458
NQ)
:0~
CO
HE
N
ET
A
L
::0.~~\.)
~~::~~Eo\.)~:t;.~,~~~~.::1t~0..I"5~~"-
~~~~::~~~0..-~\.).~~~a
~..:c.;C'
~eouc- r:;.Obl>Q
)~uco.~u~'Q~
N t")N '""'
~ ,-.,~6'rI ,.-.
~~ ,-.,'fo:2'-'"'1"
,-..
~c
"1" r'1
N
N
II") \0
r")..'.
1- O
N\O
N
~N
\0
--0M
M
~
-M
'r\
0- M
N
tr\
-.to-N
V
)
t"I 1""--
00.q-
00V')
O-0N.q-
MV)
~'r\
Ir\Ir\
\r)'0 'r\r"1
0 '"'"'
"'" 00
-~r")OO
1/")00N
00
'Ot
'Ot
NO
\
---.too
C'rl
r'")OO
0\\0N
o0
r-ooN
o0
O
r"\N
O\
~
Q)
-0 ->
0bJ) 00
.=
.-.=
.c >
.0
>
0 "'
'i::;~
Q
),:?:;0 ~
Q
).="'
"'~
"' "',
"' .-.,
"' .-~
~U
~
~U
oQ
)1: Q
)1: ~
.-~
~
~
.-Q
) Q
)
o~
Q)
o~
~.c
~eoo~
eooe
","'.=.=
Q)
"'.=.=
="0"-'
,. ,.-
>."-'
,. ,.I:
-0 ~
"0° 1:
0:1 ,.0
I: I:
I: >
. ..I:
I: I:
.~-Q
) Q
) Q
)- "'
Q)
Q)
Q)"O
.A
U
U
U
"' U
U
U
Q
)W
. =
0
e.t:
Q)
Q)
Q)
0 ...Q
) Q
) Q
)
a~~
~
=~
~~
=
~
0\V)
M"'" 10~ '0tr)
N-00V)
0-~ ~ 0\"1'
0""11"---.0.~Q
)"'
.~Q)
~>:,
]"-'O...Q)
e;I~~tU
~~~~
PSYCHOLOGICAL FACTORS, SES, AND HEALTH 459
KIND study. Increases in life events (Wald = 9.68, dl= 2, p < .008), depres-sion (Wald = 140.30, dl= 3,p < .001), hostility (Wald = 9.48, dl= 2,p < .01), andhopelessness (Wald = 76.04, dl= 2,p < .001) were all associated with increased
risk of poor health. Increased social support was associated with decreased risk(Wald = 24.72, dl= 3,p < .001). As is apparent from Table 3, these relations are
also approximately linear.
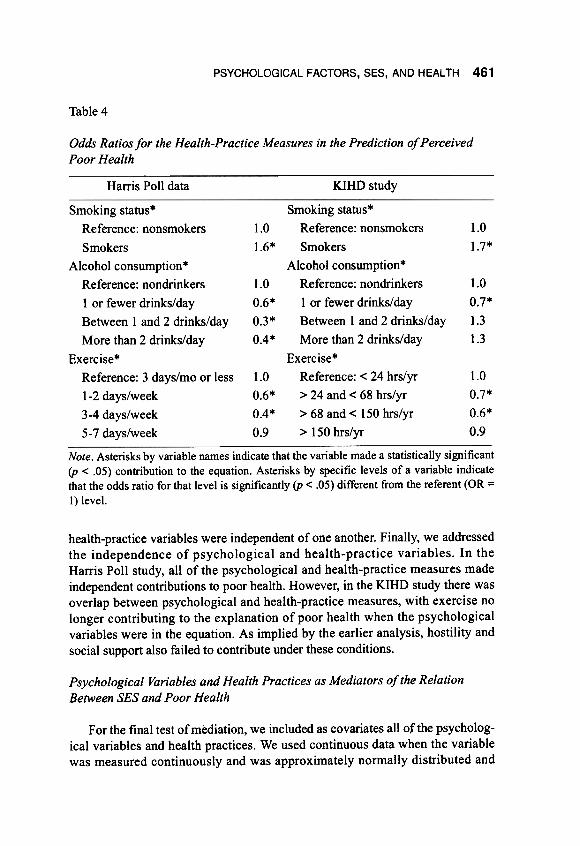
Health Practices as Risk Factors for Poor Health
Table 4 presents the odds ratios for each category ofhealth-practice variables.Harris Poll study. As is apparent from the table, smokers were at higher risk
of poor health than were nonsmokers (Wald = 12.16, dl= l,p < .001). Increasesin drinking (Wald = 28.32, dl= 3,p < .001) were associated with less risk of poor
health, and the association was approximately linear. Increases in exercise wereassociated with better health except for those who exercise the most, whosehealth was equivalent to those with the least exercise (Wald = 18.76, dl= 3,p <
.001).KIHD study. Consistent with the Harris Poll study, smoking was associated
with an increased risk of poor health (Wald = 22.50, dl = 1, p < .001), while exer-
cise was associated with decreased risk except for those who exercise the most(Wald = 10.67, dl= 3,p < .014). In contrast to the United States study, the KIHD
data suggest a U-shaped relation between alcohol consumption and health, withmoderate drinking associated with a lower risk of poor health, and abstinence andheavy drinking associated with a relative risk similar to nondrinkers (Wald =
19.64, dl= 3,p < .001).
Independence of Psychological and Health-Practice Measures in PredictingPoor Health
Because we are interested in assessing the independent roles of both the psy-chological and the health-practice variables, we fit additional regression equa-tions predicting poor health for each study in which we entered (along with age)either all of the psychological variables, all of the health-practice variables, or allof the psychological and health-practice variables. The first question addressedby these analyses was whether there is substantial overlap of the psychologicalvariables. In the Harris Poll study, life events, perceived stress, personal control,social support, and anger symptoms all made independent contributions toexplaining poor health (p < .02). In the KIHD study, all of the psychological vari-ables except social support and hostility made independent contributions (p <.01). The second question was whether the individual health-practice variablesmade independent contributions. In both studies, the contributions of all three
460 COHEN ET AL.
Table 3
Odds Ratios for the Psychological Measures in the Prediction of Perceived PoorHealth
KIHD studyHarris Poll data
.0
.3*
.4
.6*
1.0
1.6*
1.4
3.6*
1.0
0.8
0.6*
0.5*
1.0
0.8
0.5*
0.4*
1.0
1.6*
3.7*
1.0
0.6*
0.5*
Number of life events*
reference: 0 events
1 event
2 events
3 or more events
Social support*
Qrt 1 (reference): ~ 6.3
Qrt2:>6.3and~7.1Qrt 3: > 7.1 and ~ 7.9
Qrt4:>7.9
Hopelessness*Trt 1 (reference): 0-1
Trt 2: 2-3
Trt 3: 4-8
Hostility*Trt 1 (reference): 1-10
Trt 2: 11-14
Trt 3: 15-24
.01.0
1.4
1.9*
3.3*
.6*
1.0
1.9*
3.5*
7.5*
Depression*
Qrt 1 (reference): ~ 58
Qrt 2: > 58 and ~ 65
Qrt 3: > 65 and ~ 75
Qrt 4: > 75 and ~ 118
1.0
1.2
1.7*
3.7*
Number of life events*
reference: 0 events
I event
2 events
3 or more events
Social support*
Qrt I (reference): ~ 10.5
Qrt 2: > 10.5 and ~ 12.0
Qrt 3: > 12.0 and ~ 14.0
Qrt 4: > 14.0
Personal control *
Trt I (reference): 1-3
Trt 2: 4
Trt 3: 5
Anger symptoms*
Qrt I (reference): ~ 7
Qrt 2: > 7 and~ 9
Qrt 3: > 9 and~ II
Qrt4: > II
Perceived stress*
Qrt I (reference): ~ 8
Qrt2: > 8 and~ 12.5
Qrt 3: > 12.5 and ~ 17
Qrt4: > 17
Note. Asterisks by variable names indicate that the variable made a statistically significant(p < .05) contribution to the equation. Asterisks by specific levels of a variable indicatethat the odds ratio for that level is significantly (p < .05) different from the referent (OR =
I) level. Qrt = quartile, Trt = tertile.
PSYCHOLOGICAL FACTORS, SES, AND HEAL TH 461
Table 4
Odds Ratios for the Health-Practice Measures in the Prediction of PerceivedPoor Health
KIHD studyHarris Poll data
1.0
1.6*
1.0
1.7*
1.0
0.7*
1.3
1.3
1.0
0.6*
0.3*
0.4*
1.0
0.7*
0.6*
0.9
Smoking status*
Reference: nonsmokers
Smokers
Alcohol consumption*
Reference: nondrinkers
lor fewer drinks/day
Between I and 2 drinks/day
More than 2 drinks/day
Exercise*
Reference: 3 days/mo or less
1-2 days/week
3-4 days/week
5- 7 days/week
1.0
0.6*
0.4*
0.9
Smoking status*
Reference: nonsmokers
Smokers
Alcohol conswnption*
Reference: nondrinkers
lor fewer drinks/day
Between 1 and 2 drinks/day
More than 2 drinks/day
Exercise*Reference: < 24 hrs/yr
> 24 and < 68 hrs/yr
> 68 and < 150 hrs/yr
> 150hrs/yr
Note. Asterisks by variable names indicate that the variable made a statistically significant(p < .05) contribution to the equation. Asterisks by specific levels of a variable indicatethat the odds ratio for that level is significantly (p < .05) different from the referent (OR =
I) level.
health-practice variables were independent of one another. Finally, we addressedthe independence of psychological and health-practice variables. In theHarris Poll study, all of the psychological and health-practice measures madeindependent contributions to poor health. However, in the KIHD study there wasoverlap between psychological and health-practice measures, with exercise nolonger contributing to the explanation of poor health when the psychologicalvariables were in the equation. As implied by the earlier analysis, hostility andsocial support also failed to contribute under these conditions.
Psychological Variables and Health Practices as Mediators of the Relation
Between SES and Poor Health
For the final test ofmediation, we included as covariates all of the psycholog-ical variables and health practices. We used continuous data when the variablewas measured continuously and was approximately normally distributed and
462 COHEN ET AL.
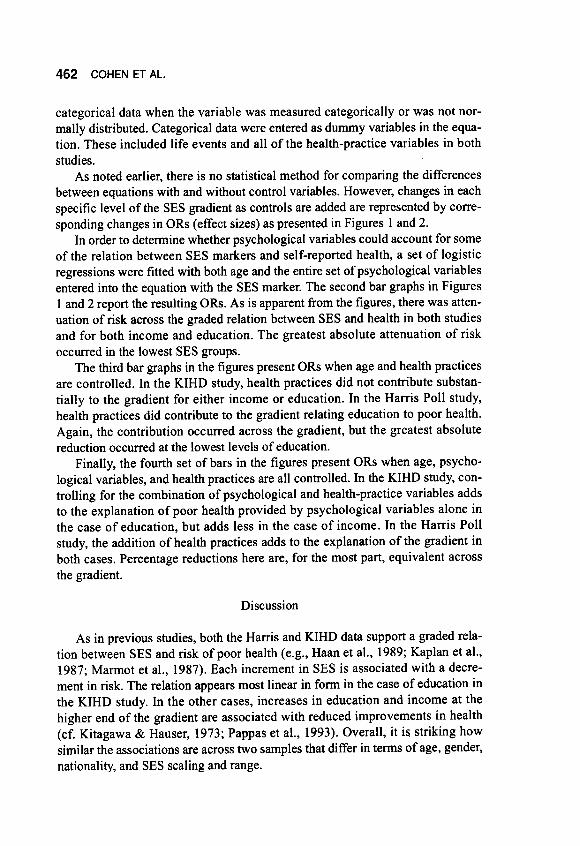
categorical data when the variable was measured categorically or was not nor-mally distributed. Categorical data were entered as dummy variables in the equa-tion. These included life events and all of the health-practice variables in both
studies.As noted earlier, there is no statistical method for comparing the differences
between equations with and without control variables. However, changes in eachspecific level of the SES gradient as controls are added are represented by corre-sponding changes in ORs (effect sizes) as presented in Figures 1 and 2.
In order to determine whether psychological variables could account for someof the relation between SES markers and self-reported health, a set of logisticregressions were fitted with both age and the entire set of psychological variablesentered into the equation with the SES marker. The second bar graphs in Figures1 and 2 report the resulting ORs. As is apparent from the figures, there was atten-uation of risk across the graded relation between SES and health in both studiesand for both income and education. The greatest absolute attenuation of risk
occurred in the lowest SES groups.The third bar graphs in the figures present ORs when age and health practices
are controlled. In the KIHD study, health practices did not contribute substan-tially to the gradient for either income or education. In the Harris Poll study,health practices did contribute to the gradient relating education to poor health.Again, the contribution occurred across the gradient, but the greatest absolutereduction occurred at the lowest levels of education.
Finally, the fourth set of bars in the figures present ORs when age, psycho-logical variables, and health practices are all controlled. In the KIHD study, con-trolling for the combination of psychological and health-practice variables addsto the explanation of poor health provided by psychological variables alone inthe case of education, but adds less in the case of income. In the Harris Pollstudy, the addition of health practices adds to the explanation of the gradient inboth cases. Percentage reductions here are, for the most part, equivalent across
the gradient.
Discussion
As in previous studies, both the Harris and KIHD data support a graded rela-tion between SES and risk of poor health ( e.g., Haan et al., 1989; Kaplan et al.,1987; Marmot et al., 1987). Each increment in SES is associated with a decre-ment in risk. The relation appears most linear in form in the case of education inthe KIHD study. In the other cases, increases in education and income at thehigher end of the gradient are associated with reduced improvements in health(cf. Kitagawa & Hauser, 1973; Pappas et al., 1993). Overall, it is striking howsimilar the associations are across two samples that differ in terms of age, gender,
nationality, and SES scaling and range.
PSYCHOLOGICAL FACTORS, SES, AND HEAL TH 463
The major focus of this work was to examine whether differences across theSES gradient in psychological variables or health practices could account for therelation between SES and poor health. We first considered psychological vari-ables. We found consistent evidence indicating that increases in both income andeducation were associated with increases in positive and decreases in negativepsychological characteristics ( cf. House et al., 1992, 1994; Ilfeld, 1978; Wills,McNamara, & Vaccaro, 1995). These associations are consistent with thehypothesis that differing psychological styles are produced as a function of thedifferences in experiences of persons at different levels of SES.
All of the psychological variables were also associated with poor perceivedhealth. Again, these relations were all approximately monotonic and indicatedincreased risk with increases in negative psychological characteristics anddecreases in risk with increases in positive characteristics. Such relations are con-sistent with a growing literature associating psychological variables and diseaseoutcomes (see reviews in Cohen & Herbert, 1996; Friedman & Booth-Kewley,
1987).Finally, when the psychological characteristics were covaried out of the rela-
tion between the SES markers and poor health, there was some attenuation of thegraded relation. In both studies and with both SES markers, most of the absoluteattenuation occurred in the lowest SES category (cf. House et al., 1994). How-ever, decreased risk occurs in all of the categories across the gradient. These dataprovide support for the contention that these psychological markers may consti-tute a proximal pathway through which SES is associated with health. However,the data are not consistent with Adler et al.'s (1994) argument that psychologicalcharacteristics are most important in explaining the middle and higher ranges ofthe gradient. It is surprising that the psychological variables are of equal orgreater importance in helping us to understand the source of risk in the lowestSES categories. There are many more compelling explanations for increased riskamong low SES persons, including poorer health care, greater environmentalrisk, and poorer nutrition. It seems likely that the psychological characteristicscovary with these other sources of risk and that the large proportion of riskaccounted for in the lowest SES groups in this study reflects these covaryingpathways as well as independent contributions of psychological characteristics to
poor health.We then considered health-practice variables. Although SES was generally
associated with health practices in both studies, the forms of the relations weresomewhat different. In the Harris Poll study, there were greater numbers ofsmokers in the lowest and highest income group and fewest in the middle groups.In contrast, for edupation there were more smokers in the two lowest than in thetwo highest quartiles (after age adjustment). Increases in both SES markers wereassociated with increased exercise and increased alcohol consumption. In theKIHD study, increases in both SES markers were associated with less smoking.
464 COHEN ET AL
Lowest and highest SES categories consumed the most alcohol (for both incomeand education) and exercised the most (education only). The differences in theserelations across studies is difficult to explain. As we discussed earlier, the SESmarkers are not readily comparable across cultures, and the highest and lowestgroups (where most of the differences occur) may reflect differences in extremesin the two societies or differences in social norms regarding health practices. Onthe other hand, the Harris Poll data on income and smoking seem inconsistentand might be anomalous. However, there is quite a bit of inconsistency acrosspublished studies addressing the relation between SES and smoking (Wills et al.,
1995).Relations between health practices and perceived poor health were more con-
sistent across the studies than were relations between health practices and SES.In both cases, smoking was associated with a higher prevalence and moderateexercise with a lower prevalence of perceived poor health. Although moderatedrinkers were at relatively low risk in both studies, higher consumption was asso-ciated with decreasing risk in the Harris Poll data but with increasing risk in theKIHD data. Differences in the results for alcohol (particularly the rise in riskamong heavier drinkers in the KIHD study) may reflect the greater consumptionin the highest consumption group. Finally, we covaried health practices out of therelation between the SES markers and poor health. In general, this reduced therelation between the SES markers and poor health, although the effect wassmaller than that of the psychological variables. The one exception was the rela-tion between education and poor health in the Harris Poll study. In this case, thehealth practices had an effect equivalent to that of covarying the psychologicalfactors. Again, the greatest absolute changes were in the low SES group. Ourimplicit hypotheses that increases in SES would be associated with increases inhealth-enhancing behaviors was not strongly supported in either study. Withoutsuch relations, health practices cannot provide strong explanatory variables for agraded !ype of relation between SES and poor health.
The final set of analyses examined the degree to which psychological charac-teristics and health practices overlapped in helping us to understand the pathwayslinking SES and poor health. In all cases, the combination of psychological andhealth-practice variables explained more than did either set alone. However, thereduction associated with the combination of the two sets of variables is gener-ally not considerably greater than that which occurred when only age and thepsychological variables were entered into the equation. This is to some extentattributable to the overlap of psychological and health-practice variables in theirprediction of poor health (especially in the KIHD study).
The work we report is subject to a number of disclaimers. The data are cross-sectional and hence causal interpretations are not possible. As note4 in the intro-duction, it is possible that illness influences SES (drift hypothesis) or that theserelations are attributable to genetically based differences between groups or to
PSYCHOLOGICAL FACTORS, SES, AND HEALTH 465
some other spurious factor associated with both SES and health. The scales usedin these studies are not always as psychometrically sound as one would desire,and better measurement would undoubtedly provide more explanatory power.Moreover, because poor health is self-reported, it may reflect biases in respond-ing to bodily sensations as well to pathophysiological states. This problem, how-ever, is attenuated by the fact that this measure has been a reliable predictor ofmortality in prospective studies and is substantially correlated with functionalstatus, diagnosed physical illness, and medication use (Schulz et al., 1994 ).However, even if one rejects self-reported health as a reasonable marker ofhealth status, the results we report are striking in terms of the importance ofindi-vidual representations of health in relation to psychological variables, healthpractices, and SES. Finally, there is the issue of whether correlations betweenperceived health and psychological measures are not merely a reflection of theoverlap of these measures; for example, the possibility that they both are tappingneuroticism. Interestingly, our data are not especially susceptible to this alterna-tive since the psychological variables are roughly linearly related to both SESmarkers and self-reported health, but their impact as mediators is not linear butrather occurs primarily at the lowest levels of SES. Moreover, all of the psycho-logical variables made independent contributions to poor health, suggesting thatthey were not serving as markers of a single underlying characteristic.
We also feel that it is important to emphasize that the psychological charac-teristics and health practices we have conceptualized as mediators are proximalproducts of the kinds of experiences that vary across SES. It is these experiencesthat cause people to feel more or less stress, control, anger, or social support, orto smoke, drink, or exercise. As noted earlier, the mediators we test may, in part,reflect their covariation with these experiences as opposed to their roles as causalagents. However, within these limits in interpretation, the consistency ofmany ofthe results in this study across two countries is striking. It is clear that a gradedrelation between SES and poor health exists and that, at least in part, it can beunderstood in terms of differences across the gradient in psychological factors
and health practices.
References
Adler, N., Royce, T., Chesney, M., Cohen, S., Folkman, S., Kahn, R., & Syme, S.L. (1994). Socioeconomic status and health: The challenge of the gradient.
American Psychologist, 49, 15-24.Anderson, N. R., & Armstead, C. A. (1995). Toward understanding the associa-
tion of socioeconomic status and health: A new challenge for the biopsycho-
social approach. Psychosomatic Medicine, 57,213-225.Antonovsky, A. (1967). Social class, life expectancy and overall mortality. Mil-
bank Memorial Fund Quarterly, XLV, 31-73.
466 COHEN ET AL.
Barefoot, J. C., Peterson, B. L., Dahlstrom, W. J., Siegler, I. C., Anderson, N. B.,& Williams, R. B., Jr. (1991 ). Hostility patterns and health implications: Cor-relates of Cook-Medley Hostility Scale scores in a national survey. HealthPsychology, 10, 18-24.
Baron, R. M., & Kenny, D. A. ( 1986). The moderator-mediator variable distinc-tion in social psychological research: Conceptual strategies and statisticalconsiderations. Journal of Personality and Social Psychology, 51, 1173-1182.
Black, D., Morris, J. N., Smith, C., & Townsend, P. (1982). Inequalities inhealth; The Black Report. Middlesex, UK: Penguin.
Cohen, S., & Herbert, T. B. (1996). Health psychology: Psychological factorsand physical disease from the perspective of human psychoneuroimmunol-ogy. In J. T. Spence, J. M. Darley, & D. J. Foss (Eds.), Annual review ofpsy-chology (VoI. 47, pp. 113-142). El Camino, CA: Annual Review.
Cohen, S., & Williamson, G. M. (1988). Perceived stress in a probability sampleof the United States. In S. Spacapan & S. Oskamp (Eds.), The social psychol-ogy of health (pp. 31-67). Newbury Park, CA: Sage.
Cohen, S., & Williamson, G. M. (1991). Stress and infectious disease in humans.Psychological Bulletin, 109, 5-24.
Everson, S. A., Goldberg, D. E., Kaplan, G. A., Cohen, R. D., Pukkala, E.,Tuomilehto, J., & Salonen, J. T. (1996). Helplessness and risk of mortality,and incidence of myocardial infarction and cancer. Psychosomatic Medicine,58, 113-121.
Everson, S. A., Kaplan, G. A., Goldberg, D. E., Cohen, R. D., Tuomilehto, J., &Salonen, J. T. (1995). Depressive symptoms and risk ofmortality, myocardialinfarction in Eastern Finnish men. Unpublished manuscript, CaliforniaDepartment of Health.
Friedman, H. S., & Booth-Kewley, S. (1987). The "disease-prone personality": Ameta-analytic view of the construct. American Psychologist, 42,539-555.
Haan, M. N., Kaplan, G. A., & Syme, S. L. (1989). Socioeconomic status andhealth: Old observations and new thoughts. In J. Bunker, D. Gomby, &B. Kehrer (Eds.), Pathways to health; The role ofsocialfactors (pp. 76-135).Menlo Park, CA: Henry H. Kaiser Family Foundation.
Hauge, R., & Irgens-Jensen, 0. (1981). Scandinavian Drinking Survey: Samplingoperations and data collections. Oslo, Norway: National Institute for Alcohol
Research (SIFA).House, J. S., Kessler, R. C., Herzog, A. R., Mero, R. P., Kinney, A. M., &
Breslow, M. J. (1990). Age, socioeconomic status, and health. Milbank Quar-
terly, 68, 383-411.House, J. S., Kessler, R. C., Herzog, A. R., Mero, R. P., Kinney, A. M., &
Breslow, M. J. (1992). Social stratification, age, and health. In K. W. Schaie,D. Blazer, & J. S. House (Eds.), Aging, health behaviors, and health out-comes (pp. 1-32). Hillsdale, NJ: Lawrence Erlbaum.
PSYCHOLOGICAL FACTORS, SES, AND HEAL TH 467
House, I. S., Lepkowski, I. M., Kinney, A. M., Mero, R. P., Kessler, R. C., &Herzog, A. R. ( 1994 ). The social stratification of aging and health. Journal ofHealth and Social Behavior, 35,213-234.
Idler, E. L. ( 1992). Self-assessed health and mortality: A review of studies. Inter-national Review of Health Psychology, 1, 33-54.
Ilfeld, F. W., Ir. (1978). Psychologic status of community residents along majordemographic dimensions. Archives of General Psychiatry, 35, 716-724.
Illsley, R., & Baker, D. (1991). Contextual variations in the meaning of healthinequality. Social Science and Medicine, 32,359-365.
Julkunen, I., Salonen, R., Kaplan, a. A., Chesney, M. A., & Salonen, J. T.(1994). Hostility and the progression of carotid atherosclerosis. Psychoso-matic Medicine, 56, 519-525.
Kaplan, a. A., Barell, V., & Lusky, A. (1988). Subjective state of health and sur-vival in elderly adults. Journal of Gerontology, 43, S 114-S 120.
Kaplan, a. A., & Camacho, T. (1983). Perceived health and mortality: A nine-year follow-up of the human population laboratory cohort. American Journalof Epidemiology, 117, 292-304.
Kaplan, a. A., Haan, M. N., Syme, S. L., Minkler, M., & Winkleby, M. (1987).Socioeconomic status and health. In R. W. Amler & H. B. Dull (Eds.), Clos-ing the gap: The burden ofunnecessary illness (pp. 125-129). New York, NY:
Oxford University Press.Kaplan, a. A., Wilson, T. W., Cohen, R. D., Kauhanan, I., Wu, M., & Salonen, I. T.
(1994). Social functioning and overall mortality: Prospective evidence from theKuopio Ischemic Heart Disease Risk Factor study. Epidemiology, 5,495-500.
Kitagawa, E. M., & Hauser, P. M. (Eds.). (1973). Differential mortality in theUnited States: A study in socioeconomic epidemiology. Cambridge, MA: Har-
vard University Press.Lakka, T. A., Venalainen, I., Rauramaa, R., Salonen, R., Tuomilehto, I., &
Salonen, I. T. (1994). Relation of leisure-time physical activity andcardiorespiratory fitness to the risk of acute myocardial infarction in men.New England Journal of Medicine, 330, 1549-1554.
Marmot, M. a., Kogevinas, M., & Elston, M. A. (1987). Social/economic statusand disease. Annual Review of Public Health, 8, 111-135.
Marmot, M. a., Shipley, M. I., & Rose, a. (1984). Inequalities in death: Specificexplanations ofa general pattern? Lancet, 1, 1003-1006.
Mat thews, K. A., Kelsey, S. F., Meilahn, E. N., Kuller, L. H., & Wing, R. R.( 1989). Educational attainment and behavioral and biologic risk factors forcoronary heart disease in middle-aged women. American Journal of Epidemi-
ology, 129,1132-1144.Pappas, a., Queen, s., Hadden, W., & Fisher, a. (1993). The increasing disparity
in mortality between socioeconomic groups in the United' States, 1960 and1986. The New England Journal of Medicine, 329(2), 103-109.
468 COHEN ET AL.
Pincus, T., & Callahan, L. F. (1985). Fonnal education as a marker for increasedmortality and morbidity in rheumatoid arthritis. Journal of Chronic Disease,38, 973-984.
Pincus, T., Callahan, L. F., & Burkhauser, R. V. (1987). Most chronic diseases arereported more frequently by individuals with fewer than 12 years of fonnaleducation in the age 18-64 U .S. population. Journal of Chronic Diseases, 40,865-874.
Ross, C. E., & Wu, C-L. ( 1995). The links between education and health. Ameri-can Sociological Review, 60,719-745.
Schulz, R., Mittelmark, M., Kronmal, R., Polak, J. F., Hirsch, C. H., Gennan, P.,& Bookwala, J. (1994). Predictors of perceived health status in elderly menand women. Journal of Aging and Health, 6,419-447.
Susser, M., Watson, W., & Hopper, K. (1985). Sociology in medicine (3rd ed.).Oxford, UK: Oxford University Press.
Syme, S. L., & Bennan, L. F. (1976). Social class, susceptibility and sickness(reviews and commentary). American Journal of Epidemiology, 104, 1-8.
Williams, R. B. (1990). The role of the brain in physical disease. Journal of theAmerican Medical Association, 263,1971-1972.
Wills, T. A., McNamara, G., & Vaccaro, D. (1995). Parental education related toadolescent stress-coping and substance use: Development of a mediational