Appendix A ....................................................................................................... 108
vii
Appendix B ....... -................................................................................................. 118
viii
List of Figures
Figure 1: Correlations between baseline serum calcidiol (nmol/L) and baseline anthropometric measurements ................................................................ 51
Figure 2: Correlations between baseline serum calcidiol (nmol/L) and baseline glycemic and lipid profile ................................................................................................. 52
· Figure 3: Correlations between baseline serum calcidiol (nmol/L) and baseline other biomarkers ................................................................................. 53
Figure 4: Correlations at 3 years between serum calcidiol (nmol/L) and anthropometric measurements at 3 years ................................................. 56
Figure 5: Correlations at 3 years between serum calcidiol (nmol/L) and glycemic and lipid profile at 3 years ....................................................................... 57
Figure 6: Correlations at 3 ·years between serum calcidiol (nmol/L) and other biomarkers at 3 years ................................. · ............................................ 58
Figure 7 Correlations between the absolute change fl in serum calcidiol (nmol/L) and the absolute change fj, anthropometric measurements ........................... 61
Figure 8: Correlations between the absolute change h. in serum calcidiol (nmol/L) and the absolute change A in glycemic and lipid profile .................... 62
Figure 9: Correlations between the absolute change fl in serum calcidiol (nmol/L) and the absolute change /1 in other biomarkers ............................... 63
Figure 10: Correlations between the relative change (/1 % ) in serum calcidiol (nmol/L) and the relative change (fj,o/o) in anthropometric measurements .......... 66
Figure 11: Correlations between the relative change (fl%) in serum calcidiol (nmol/L) and the relative change (fj,o/o) in glycemic and lipid profile ................. 67
Figure 12: Correlations between the relative change (/1%) in serum calcidiol (nmol/L) and the relative change (/1 % ) in other biomarkers ............................ 68
ix
List of Tables
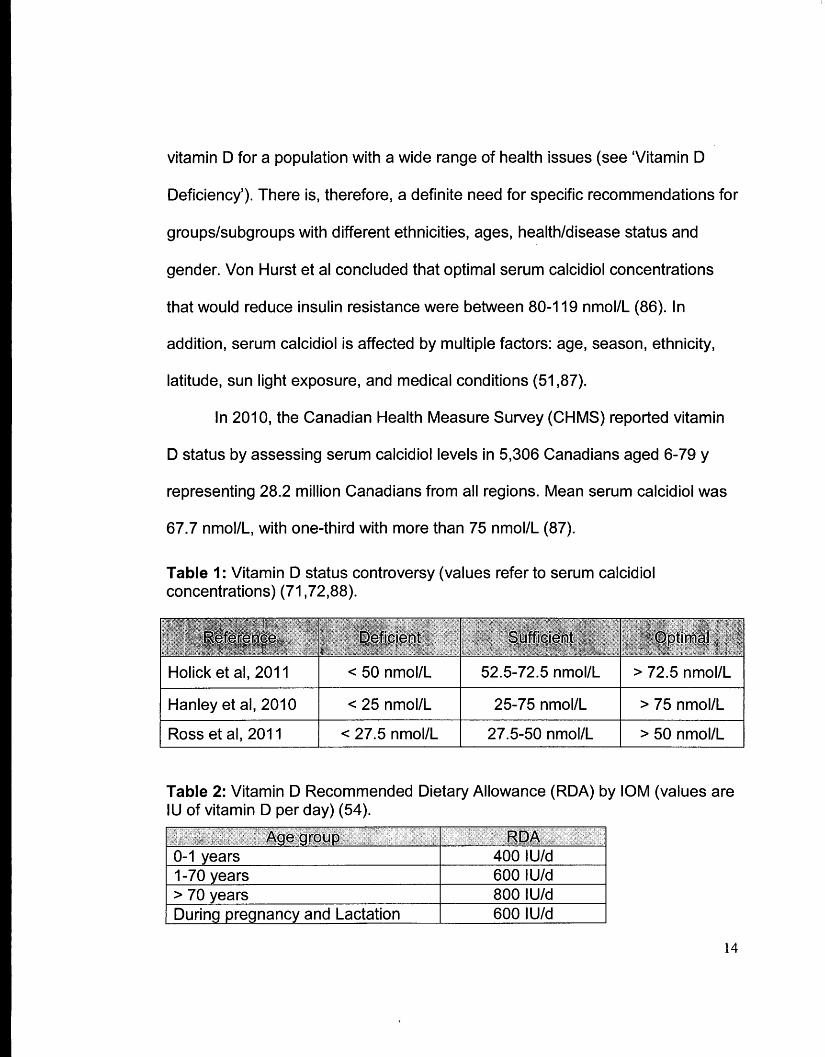
Table 1: Vitamin D status controversy (values refer to serum calcidiol concentrations) .................................................................................... 14
Table 2: Vitamin D Recommended Dietary Allowance (RDA) by IOM (values are IU of vitamin D per day) ......................................................................... 14
Table 4: Baseline characteristics presented as medians (percentiles 25%-75%) following per-protocol analysis, for T2DM subjects (n = 11 ) .......................... .42
Table 5: Baseline characteristics presented as medians (percentiles 25%-75%) following retrospective analysis, for T2DM subjects (n = 11 ) ......................... .44
Table 6: Subject characteristics at 3 y, presented as medians (percentiles 25%-75%), following per-protocol analysis ....................................................... .46
Table 7: Subject characteristics at 3 y, presented as medians (percentiles 25%-75%), following retrospective analysis ...................................................... 48
Table 8: Spearman's rank coefficient bivariate correlations at baseline, for serum calcidiol, with the different outcome measures (n = 11 ) ................................ 50
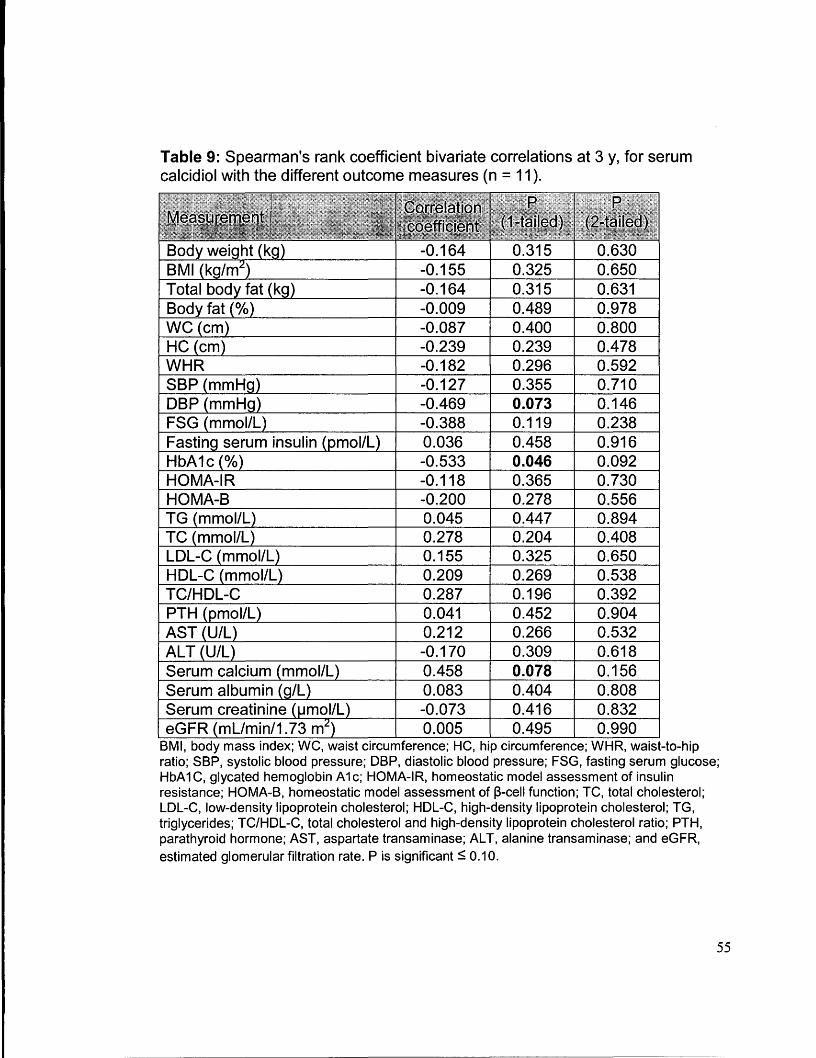
Table 9: Spearman's rank coefficient bivariate correlations at 3 y, for serum calcidiol with the different outcome measures (n = 11 ) ................................. 55
Table 10: Spearman's rank coefficient bivariate correlation for the absolute change over 3 y in serum calcidiol with the different outcome measures (n = 11) .. :···········~· ...................................................................................... 60
Table 11: Spearman's rank coefficient bivariate correlation for the relative change over 3 y in serum calcidiol with the different outcome measures (n = 11) .................................................................................................... 65
Table 12: Comparison of the medians in outcome measures in participants, both within group and between groups, following per-protocol analysis ................ 70
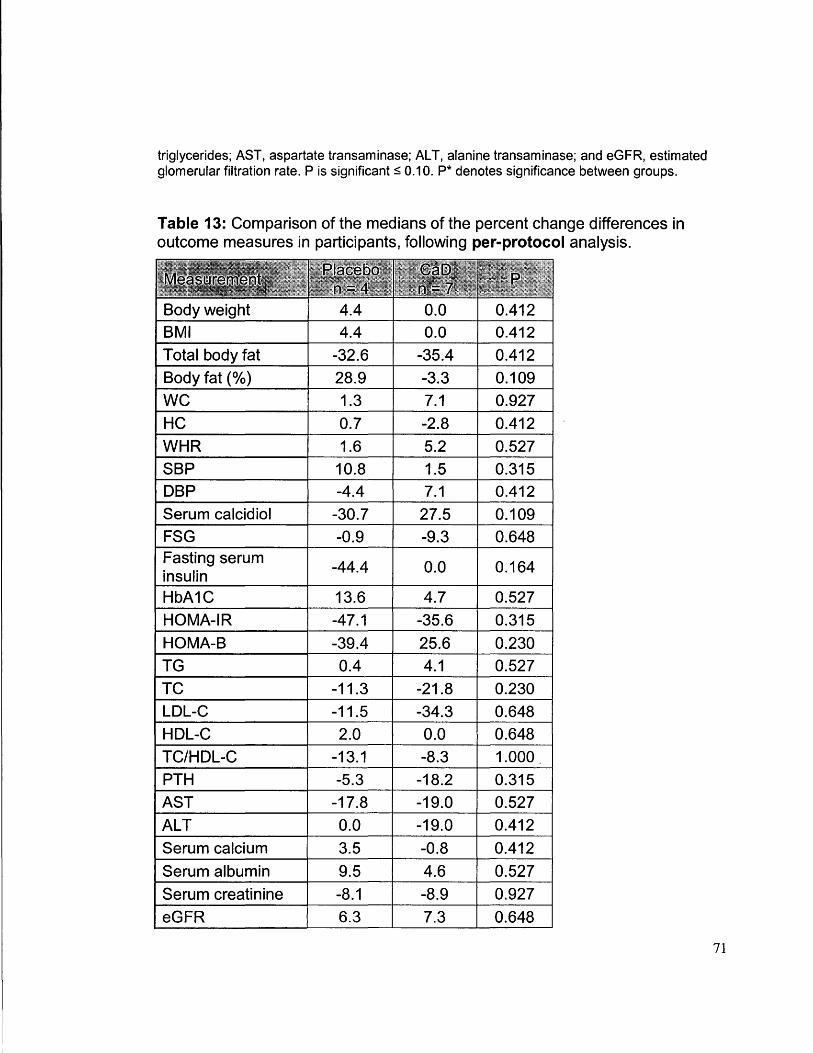
Table 13: Comparison of the relative change in outcome measures medians in participants, following per-protocol analysis ............................................. 71
x
Table 14: Comparison of the medians in outcome measures in participants, both within group and between groups, following retrospective analysis ................. 73
Table 15: Comparison of the relative change' in outcome measures medians in participants, following retrospective analysis ................. : ............................ 75
Table 16: Macronutrients intake at baseline and 3 years for all T2DM subjects .............................................................................................. 76
Appendix A
Table 17: Baseline characteristics presented as means± SD following per-protocol analysis, for T2DM subjects (n = 11) ........................................... :_109
Table 18: Baseline characteristics presented as means ± SD following retrospective analysis, for T2DM subjects (n = 11) .................................... 110
Table 19: Subject characteristics at 3 y, presented as means SD, following per-protocol analysis ........................................................ : ....................... 111
Table 20: Subject characteristics at 3 y, presented as means± SD, following retrospective analysis, for T2DM subjects (n = 11) .................................... 112
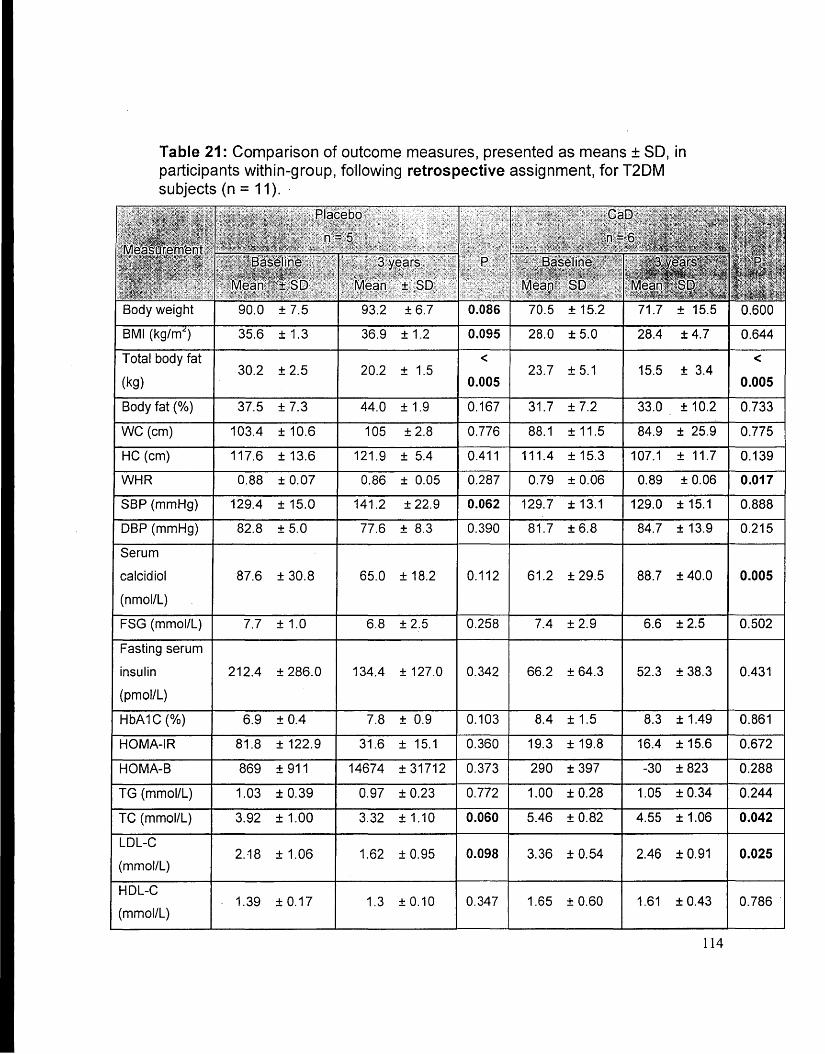
Table 21: Comparison of outcome measures in participants within-group·, following retrospective analysis, for T2DM subjects (n = 11) ........................ 114
Table 22: Comparison of outcome measures in participants between groups at 3 years, following retrospective analysis, for T2DM subjects (n = 11 ) ................ 116
xi
Abbreviations
1-aOHase 25-hyd roxyvitamin 0 3-1-ahyd roxylase
1,25(0H)2D3 Calcitriol
25-0Hase Vitamin D-25-hydroxylase
25(0H)03 Calcidiol
7-DHC 7-dehydrocholesterol
ALS Amyotrophic lateral sclerosis
ALT Alanine transaminase
AST Aspartate transaminase
b-cell Beta cells
BIA Bioelectric impedance analysis
BMI Body mass index
bw/d Body weight per day
Ca Calcium
CaD Vitamin D and calcium
Ca DOM Calcium and vitamin D for diabetes mellitus
CHC Community health centre
CHMS ·Canadian health measure survey
Cl Confidence interval
CRP C-reactive protein
CVD Cardiovascular disease
DBP Diastolic blood pressure
DCY Vitamin D and calcium fortified yogurt
DY Vitamin D fortified yogurt
FBG Fasting blood glucose
FF As Free fatty acids
xii
FPG Fasting plasma glucose
FSG Fasting serum glucose
GLUT-2 Glucose transporters-2
GLUT-4 Glucose transporters-4
GTA Greater Toronto area
,HbA1C Glycated hemoglobin A 1 C
HC Hip circumference
HDL High-density lipoprotein
HDL-C High-density lipoprotein cholesterol
HF High fat
HOMA-2%8 Homeostatic model assessment of insulin sensitivity
HOMA-IR Homeostatic model assessment of insulin resistance
HR Hazard ratio
hsCRP High sensitivity C-reactive protein
hsll-6 High sensitivity inerleukin-6
hsTNF- a High sensitivity tumor necrosis factor a
IGI lnsulinogenic index
IGT Impaired glucose tolerance
IL-10 lnterleukin-10
IL-1 f3 lnterleukin-1 a
IL-6 lnterleukin-6
INF-y Interferon gamma
iNOS Nitric oxide synthase
IOM Institute of Medicine
IR Insulin receptor
IRS Insulin receptor substrate
IU/d International units per day
xiii
IVGTT Intravenous glucose tolerance test
KATP Potassium adenosine triphosphate
KIHD Kuopio ischemic heart disease
LDL Low-density lipoprotein
LDL-C Low-density lipoprotein cholesterol
MS Multiple sclerosis
Mets Metabolic syndrome
NHANES National Health and Nutrition Examination Survey
NO Nitric oxide
OGIS Oral glucose insulin sensitivity
OGTT Oral glucose tolerance test
OR Odds ratio
PG Plasma glucose
Pl3K Phosphatidylinositol 3'-kinase
PTH Parathyroid hormone
PY Plain yogurt
QUICKI Quantitative Insulin Sensitivity Check Index
RDA Recommended dietary allowance
ROS Reactive oxygen species
RR Relative risk
RXR Retinoid X receptor
SBP Systolic blood pressure
SD Standard deviation
SEM Standard error of the mean
SOD Superoxide dismutase
T2DM Type 2 diabetes mellitus
TBF Total body fat
XIV
TC Total cholesterol
TC/HDL-C Total cholesterol HDL-C ratio
TG Triglycerides
TNF-a T,umor necrosis factor-alpha
UKPDS United Kingdom prospective diabetes study
UPR Unfolded protein response
UVB Ultraviolet B rays
VDR Vitamin D receptor
VORE Vitamin D response element
WC Waist circumference
WHR Waist-to-hip ratio
WHWH-CHC Women's Health in Women's hands Community Health Centre
xv
Introduction
1.0 Type 2 Diabetes Mellitus: Epidemiology and Background
Type 2 diabetes mellitus (T2DM) is one of the most prevalent metabolic
disorders, with 171 million cases around the world (1 ). It is anticipated that this
number will double by 2030 to 366 million (1). In Canada, it is expected that 3.7
million Canadians will suffer from diabetes by 2020, with a cost of more than 15
billion dollars (2). These numbers indicate an epidemic and call for immediate
interventions. Diabetes patients also suffer from serious secondary illnesses
such as coronary heart disease (CHO), blindness, kidney disease, amputation,
and depression (3). The aetiology of T2DM is complex with a number of
interacting genetic and environmental factors. These can be attenuated through
lifestyle changes such as increasing physical activity and improving diet (4).
T2DM is characterized by altered macronutrient metabolism, specifically
glucose, protein and lipids. Glucose homeostasis is a state in which plasma
glucose concentrations are regulated to within normal ranges, even through
periods of fasting (S 7 .0 mmol/L) and feeding (S 11.1 mmol/L) (5). Normal
glycaemia is mediated through two main physiological pathways: glucose
production from the liver and glucose uptake by peripheral tissue, namely
adipose tissue and muscle. Two key hormones regulate these physiological
processes, respectively: glucagon and insulin. T2DM is diagnosed when fasting I
plasma glucose (FPG) exceeds 7 mmol/L, or when plasma glucose (PG) of
;?!11.1 mmol/L is detected 2h post-75 g oral glucose tolerance test (OGTT} (5).
Insulin resistance (inability to respond properly to insulin) and ~-cell dysfunction
(inability to produce insulin) are the key defects in this endocrine disorder. Insulin
resistance precedes J3-cell dysfunction, whereby high circulating insulin levels
are found in the plasma as a result of J3-cell compensation for increased insulin
demand. Nevertheless, as insulin resistance progresses J3-cell function
deteriorates. And by the time T2DM is diagnosed, individuals had lost
approximately 80% of their J3-cell function (6-7, 179).
1.1 Risk Factors
Numerous risk factors contribute to the development of T2DM. Evidence
suggests a crucial role of obesity in T2DM pathogenesis (8) as it contributes
approximately 60% of total T2DM cost in the United States (9). Additionally,
obesity is associated with a cluster of metabolic disorders that underlie T2DM
pathogenesis such as: insulin resistance (10), hyperlipidemia (11 ), and
inflammation ( 12). Other risk factors include: ethnicity ( 13), dietary habits, life
style (14-17), and genetics (18).
The Nurses' Health Study is a prospective cohort study that examined the
association between adiposity and T2DM risk in women, it included follow-up
throughout 1976-1990. It demonstrated that the increase in BMI, an important
2
marker of adiposity, was associated with increased risk for T2DM (19). The
increase in T2DM risk was more pronounced in those who had a BMI > 30
kg/m2
(RR %95 Cl = 27.6 [22.7 to 33.5]) and > 35 kg/m2 (RR %95 Cl = 93.2
[81.4 to 106.6]) as compared to those with a BMI < 29 kg/m2 (19). Findings of
the Nurses' Health Study were confirmed in another prospective study
conducted in males (8). Waist circumference (WC), an adiposity index, was
also positively correlated with insulin resistance (r = 0.88) in non-diabetic
women (10). Hyperlipidemia is characterized by abnormally high lipid profile
indices such as low-density lipoprotein (LDL) and total cholesterol (TC). High
lipid indices correlate with obesity and contribute to T2DM pathogenesis (20).
Some ethnic backgrounds exhibit greater susceptibility to T2DM (21-24). A
cross-sectional study by Goff et al. examined ethnic variation in insulin
resistance and other biomarkers in three ethnic groups: South Asians, Black
Africans, and white Europeans (21 ). Male South Asians had significantly higher
HOMA-IR, homeostatic model of assessment insulin resistance; a marker of
insulin resistance, than white European men by 49% (P < 0.001 ). Female
South Asians and Black Africans showed higher HOMA-IR than white
European women by 15. 7% (P = 0.015) and 32.8% (P = 0.021 ), respectively
(21 ). Black African women have 9.8% higher body fat(%) (P = 0.024) than
South Asians, and significantly lower lipid profile indices: total cholesterol by
13%, LDL-C by 14%, triacylglycerol by 42%; than South Asian women.
3
Nevertheless, after adjustment for gender, age, and BMI, South Asians and
Black Africans had significantly lower insulin sensitivity assessed by intra
venous glucose tolerance test (IVGTT) (21 ). High insulin resistance in South
Asians was confirmed in another meta-analysis that examined the
pathogenesis of T2DM in this group (22).
Lastly, genetic predisposition is a key risk factor in T2DM. The Finnish Twin
Cohort Study examined the genetic aspects of chronic disease development,
such as T2DM. Forty-one pairs of twins were included in the analysis to
determine the heritability of insulin sensitivity and insulin secretion (25). IVGTT
and euglycemic hyperinsulinaemic clamp were used to assess insulin secretion
(first and late response) and insulin sensitivity. In monozygotic twins, insulin
secretion positively correlated with heritability (first response r = 0.55, and late
response r = 0.66) (25). Moreover, whole-body insulin sensitivity also positively
correlated with heritability (r = 0.46) (25). Findings of this study confirmed the
strong effect of heritability on two predominant contributors (decreased insulin
secretion and insulin sensitivity) to T2DM pathogenesis.
1.2 Pathophysiology
T2DM is a multifaceted endocrine disorder in which alterations in different
metabolic pathways and hormones contribute to the pathophysiology. Insulin
resistance and J3-cell dysfunction are the two main key defects in T2DM etiology.
4
Other underlying metabolic defects include: oxidative stress, lipotoxicity,
glucotoxicity and systemic inflammation.
1.2.1 Insulin Resistance
Insulin, a potent anabolic hormone, is produced by the pancreatic ~-cells
of the islets of Langerhans. It regulates carbohydrates, protein and lipid
metabolism. Insulin action is mediated through alterations in cell proliferation
(26), gene expression (27), and apoptosis (28). For proper glucose uptake,
multi-step insulin signaling must occur. Elevated plasma glucose concentration
results in bi-phasic insulin release in an electrogenic fashion (29). It relies on two
key ion channels: KA TP and Ca2+ voltage-sensitive channels. A rapid first
response is initiated after the entry of glucose into the J3-cells by glucose
transporters-2 (GLUT-2), which is mediated by glucose-induced KATP channel
inhibition causing cell depolarization. Cell membrane depolarization results in the
opening of Ca2+ voltage-sensitive channels, allowing Ca2
+ influx and insulin
exocytosis (30,31 ).
Once insulin is released into circulation, it binds to the cell surface insulin
receptor (IR) on peripheral tissues, resulting in the autophosphorylation of
tyrosine ~-subunits. Insulin receptor substrates (IRS1/2) are then
phosphorylated, and hence activated, to act on phosphatidylinositol 3'-kinase
(Pl3K), an important signaling molecule. The activation of Pl3K will ultimately
5
facilitate glucose entry into the cell through the translocation of GLUT-4 to the
cell membrane (32). Insulin resistance develops when the above mechanism is
altered and target peripheral tissues (muscle and adipose tissue) are unable to
respond properly to insulin secretion (32). There are several proposed
mechanisms underlie insulin resistance: alteration in lipid metabolism, activation
of unfolded protein response (UPR), and systemic inflammation (33).
Collectively, these mechanisms result in altered insulin receptor phosphorylation
(an increase in serine and threonine phosphorylation and decrease in tyrosine
phosphorylation) and signaling pathways (34).
1.2.2 13-cell Dysfunction
J3-cells are an important component of the endocrine system, and play a
key role in T2DM pathogenesis. Impaired J3-cell function is pronounced in T2DM
pathogenesis in both younger and older patients, and features high
concentrations of plasma pro-insulin (an insulin precursor) (35). A recent study
by Elder et al. compared ~-cell preservation in T2DM adults (52.3 ± 2.8 y),
healthy adolescents (14.5 ± 0.3 y) and newly T2DM-diagnosed adolescents
(15.8 ± 0.5 y) (35). The disposition index, a measure of ~-cell function, was
significantly lower by== 900% in both T2DM groups compared to healthy
adolescents (35). In T2DM, ~-cell function is compromised, and hence insulin
secretion is reduced. The decline in ~-cell function can be explained through the
decrease in J3-cell mass. A unique study by Butler and colleagues was
6
conducted on 124 human pancreata autopsies to understand the aetiology of J3-
cell deficit in T2DM (36). This study suggested that increased J3-cell apoptosis is
responsible for the observed decrease in J3-cell mass. Frequency of J3-cell
apoptosis was significantly higher in lean diabetics by 571 % compared to their
South Asian 1 (9.1) Caribbean 7 (63.6) Black 3 (27.3)
Education Elementary (grades 1-8) 5 (45.5) High school (grades 9-12 or 13) 5 (45.5) University, community college, trade
1 (9.1) school apprenticeship
Household Couple without children 1 (9.1) Live alone 4 (36.4) Siblings 1 (9.1) Extended family 1 (9.1) Grandparents with grandchildren 1 (9.1) Single parent family (mother) 3 (27.3)
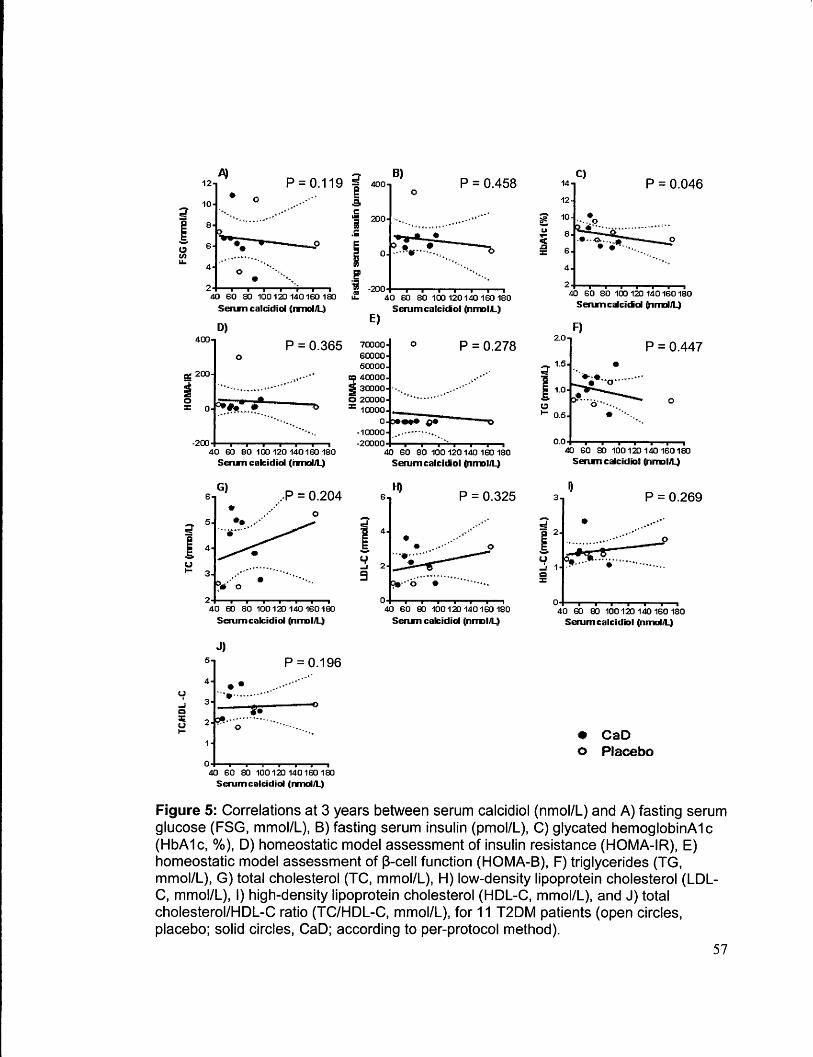
Figure 5: Correlations at 3 years between serum calcidiol (nmol/L) and A) fasting serum glucose (FSG, mmol/L), B) fasting serum insulin (pmol/L), C) glycated hemoglobinA 1 c (HbA 1 c, % ), D) homeostatic model assessment of insulin resistance (HOMA-IR), E) homeostatic model assessment of J3-cell function (HOMA-8), F) triglycerides (TG, mmol/L), G) total cholesterol {TC, mmol/L), H) low-density lipoprotein cholesterol (LDLC, mmol/L), I) high-density lipoprotein cholesterol (HDL-C, mmol/L), and J) total cholesterol/HDL-C ratio (TC/HDL-C, mmol/L), for 11 T2DM patients (open circles, placebo; solid circles, CaD; according to per-protocol method).
Figure 6: Correlations at 3 years between serum calcidiol (nmol/L) and A) parathyroid hormone (PTH, pmol/L), B) aspartate transaminase (AST, U/L), C) alanine transaminase (ALT, U/L), D) serum calcium (mmol/L), E) serum albumin (g/L), F) serum creatinine (µmol/L), and G) estimated glomerular filtration rate ( eGFR, mUmin/1. 73 m2
)
for 11 T2DM patients (open circles, placebo; solid circles, CaD; according to perprotocol method).
58
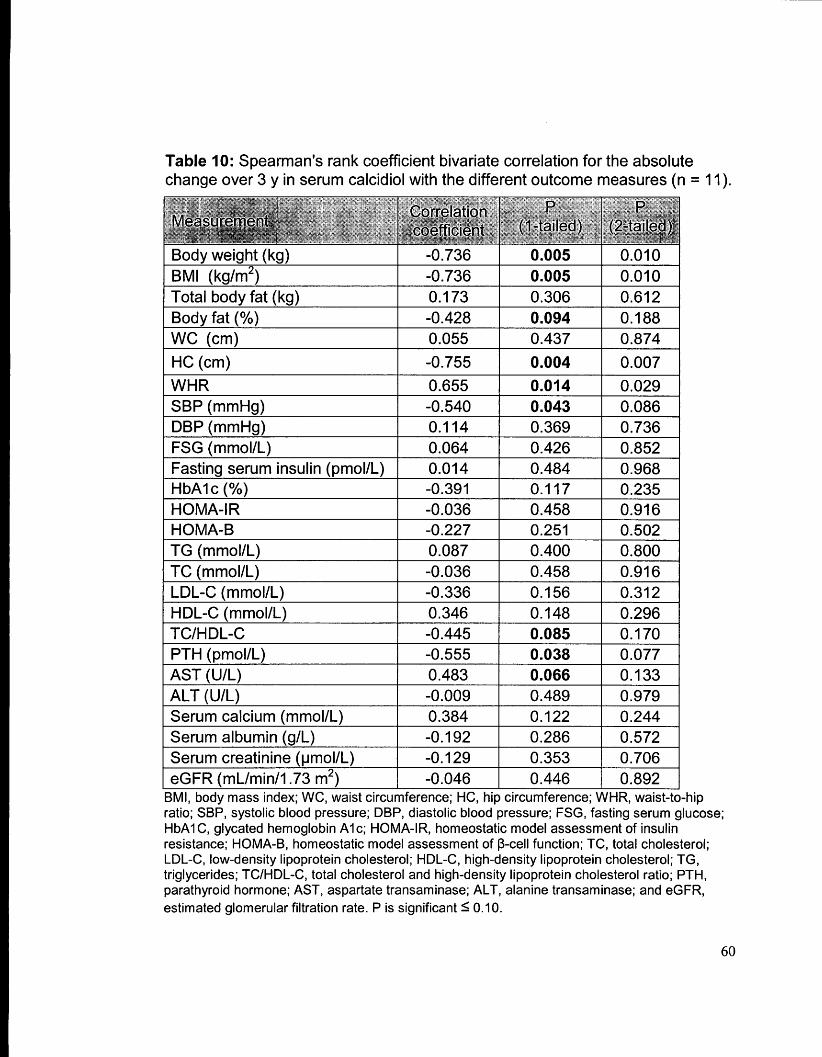
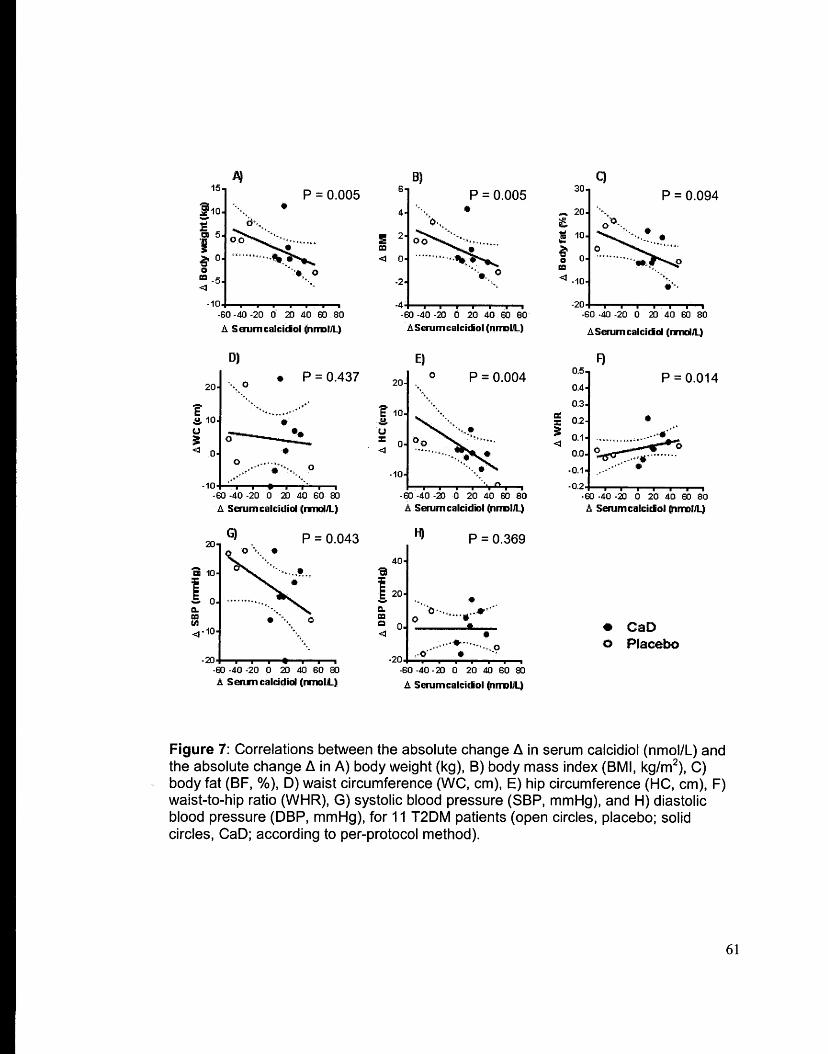
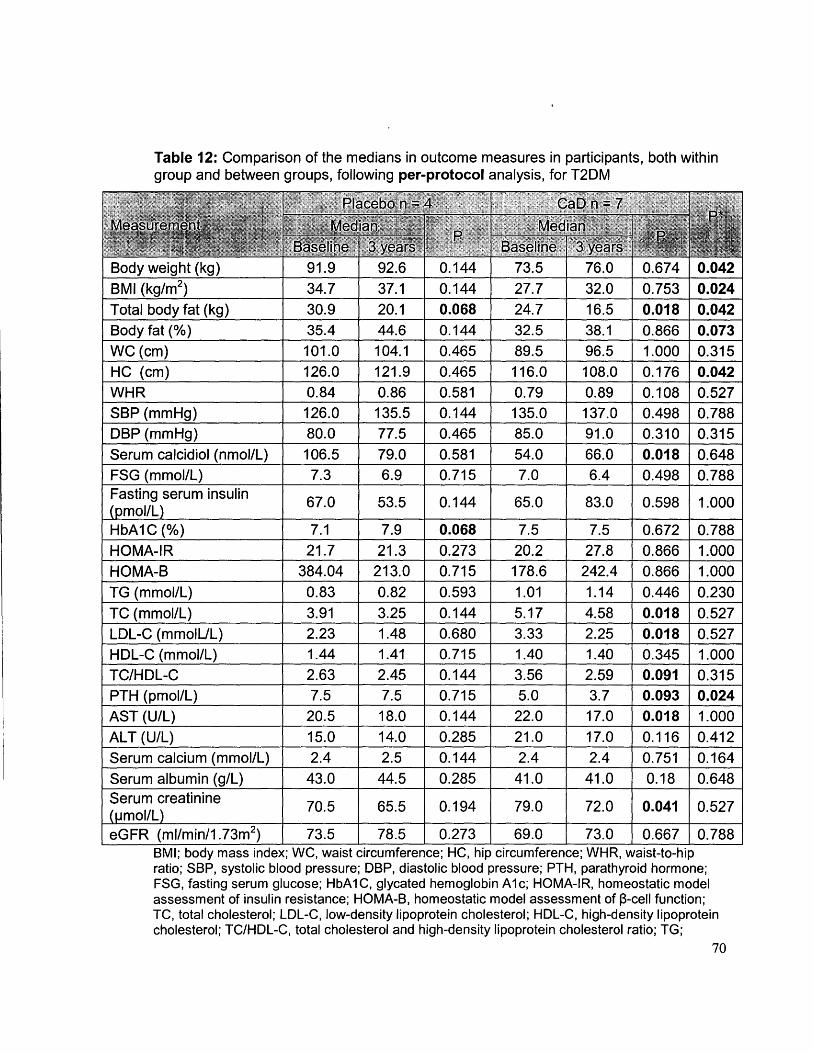
Absolute change in serum calcidiol over 3 years was negatively correlated
with the absolute change in body weight, BMI, TBF, HC, SBP, and TC/HDL-C,
PTH, AST (P = 0.005, P = 0.005, P = 0.094, P = 0.004, P = 0.043, P = 0.085, P
= 0.038, P = 0.066, respectively) and positively correlated with the absolute
change in WHR (P = 0.014) (Figures 7,8, and 9). A negative trend was observed
between serum calcidiol and HbA 1 c (P = 0.117), LDL-C (P = 0.156), and a
positive trend was observed between serum calcidiol and HDL-C (P = 0.148),
and serum calcium (P = 0.122) (See Table 10 and Figures 7, 8, and 9).
59
Table 10: Spearman's rank coefficient bivariate correlation for the absolute change over 3 y in serum calcidiol with the different outcome measures (n = 11 ).
Body weight (kg) -0.736 0.005 0.010 BMI (kg/m2
) -0.736 0.005 0.010 Total body fat (kg) 0.173 0.306 0.612 Body fat(%) -0.428 0.094 0.188 WC (cm) 0.055 0.437 0.874
Figure 7: Correlations between the absolute change fl in serum calcidiol (nmol/L) and the absolute change fl in A) body weight (kg), B) body mass index (BMI, kg/m2
), C) body fat (BF,%), D) waist circumference (WC, cm), E) hip circumference (HC, cm), F) waist-to-hip ratio (WHR), G) systolic blood pressure (SBP, mmHg), and H) diastolic blood pressure (DBP, mmHg), for 11 T2DM patients (open circles, placebo; solid circles, CaD; according to per-protocol method).
61
A) P = 0.426
- • • 9
•GO •40 .;2Q 0 20 ,(.() GO 80 ASorumea~(n~
_.O..;I040 0 20 ..0 to·~ A Scrum c:dcidid(~
G)
p = 0.458
,,.GO ~.co 40 0 20 40 GO •
A Strum~a~(~ft.3
J)
p = 0.085
p = 0.484
•GO <40 «20 0 20 40 GO 80 A Sorum eackUcl (nmdJ4
E) 0 p = 0.251
•GO ·'4& ,.'2;) 0 20 "° GO W A Sot'Um ¢:3lQ:idld (nrnotAJ
-0 40 40 0 20 .co GO e:o A Sotum catcfd&ol (nmcl'-)
• cao o Placebo
Figure 8: Correlations between the absolute change fl. in serum calcidiol (nmol/L) and the absolute change fl. in A) fasting serum glucose (FSG, mmol/L), 8) fasting serum insulin (pmol/L), C) glycated hemoglobinA 1 c (HbA 1 c, % ), D) homeostatic model assessment of insulin resistance (HOMA-IR), E) homeostatic model assessment of 13-cell function (HOMA-8), F) triglycerides (TG, mmol/L), G) total cholesterol (TC, mmol/L), H) low-density lipoprotein cholesterol (LDL-C, mmol/L), I) high-density lipoprotein cholesterol (HDL-C, mmol/L), and J) total cholesterol/HDL-C ratio {TC/HDL-C, mmol/L),
62
at 3 years for 11 T2DM patients (open circles, placebo; solid circles, CaD; according to per-protocol method).
A) p = 0.038
p = 0.122
p = 0.066 .. .,...~ __ ... _., 0 •••• • • .... •
•ED "'11··2& o ~ i!i. S8'1'lllH:~1el~ ~m~
E) p = 0.286
p = 0.489
..,. ...... ,,,,.,, .. •••• 0 • . . ·"
,....A .. ., ,, .. ~"'" ... , .... . '
F) p = 0.353
• Cao o Placebo
Figure 9: Correlations between the absolute change b. in serum calcidiol (nmol/L) and the absolute change b. in A) parathyroid hormone {PTH, pmol/L), B) aspartate transaminase (AST, U/L), C) alanine transaminase (ALT, U/L), D) serum calcium (mmol/L), E) serum albumin (g/L), F) serum creatinine (µmol/L), and G) estimated glomerular filtration rate (eGFR, mUmin/1.73 m2
) for 11 T2DM patients (open circles, placebo; solid circles, CaD; according to per-protocol method).
63
Relative change in serum calcidiol over 3 years was negatively correlated
with the relative change in body weight, BMI, TBF, HC, TC/HDL-C, and PTH (P
= 0.005, P = 0.005, P = 0.085, P = 0.013, P = 0.095, and P = 0.014,
respectively), and positively with WHR and serum calcium (P = 0.008 and P =
0.059) (See figures 10, 11, and 12). A negative trend was observed between
serum calcidiol and SBP (P = 0.123). In addition, a positive trend was observed
between serum calcidiol and DBP (P = 0.123) and HDL-C (P = 0.156) (Table
11 ).
64
Table 11: Spearman's rank coefficient bivariate correlation for the relative change over 3 y in serum calcidiol, with the different outcome measures (n = 11 ).
Figure 10: Correlations between the relative change(~%) in serum calcidiol (nmol/L) and the relative change(~%) in A) body weight (kg), B) body mass index (BMI, kg/m2
),
C) body fat (BF,%), D) waist circumference (WC, cm), E) hip circumference (HC, cm), F) waist-to-hip ratio (WHR), G) systolic blood pressure (SBP, mmHg), and H) diastolic blood pressure (DBP, mmHg), for 11 T2DM patients (open circles, placebo; solid circles, CaD; according to per-protocol method).
Figure 11: Correlations between the relative change(~%) in serum calcidiol (nmol/L) and the relative change(~%) in A) fasting serum glucose (FSG, mmol/L), B) fasting serum insulin (pmol/L), C) glycated hemoglobinA 1c(HbA1 c, % ), D) homeostatic model assessment of insulin resistance (HOMA-IR),. E) homeostatic model assessment of~cell function (HOMA-B), F) triglycerides {TG, mmol/L), G) total cholesterol {TC, mmol/L), H) low-density lipoprotein cholesterol (LDL-C, mmol/L), I) high-density lipoprotein cholesterol (HDL-C, mmol/L), and J) total cholesterol/HDL-C ratio {TC/HDL-C, mmol/L),
67
for 11 T2DM patients (open circles, placebo; solid circles, CaD; according to perprotocol method).
0.018) and serum creatinine (P = 0.041 ), compared to their baseline levels. In
the placebo group, total body fat decreased significantly (P = 0.068), and HbA 1 c
increased significantly (P = 0.068), compared to their baseline levels. Moreover,
after 3 years, Cao group had significantly lower body weight (P = 0.042), BMI (P
= 0.024), total body fat (P = 0.042), body fat(%) (P = 0.073), HC (P = 0.042),
and PTH (P = 0.024 ), compared to the placebo group
69
Table 12: Comparison of the medians in outcome measures in participants, both within group and between groups, following per-protocol analysis, for T2DM
no effect of vitamin D3 supplementation on T2DM outcomes (178). .
This pilot study demonstrates that vitamin D3 supplementation may
attenuate T2DM severity in postmenopausal women of multi-ethnic backgrounds
even in with modest increases in serum calcidiol level. We suggest a revision of
the current vitamin D RDA with particular consideration for diverse ethnicities
and different health conditions. We have also confirmed the negative association
between serum calcidiol and adiposity, PTH, and LDL-C. Nevertheless, findings
of this study are weakened due to poor compliance. Further research is indeed
warranted to produce more robust results as well as investigate the underlying
mechanisms of vitamin D action in diabetes control.
87
14. Significance of research
Despite the limitations, the current clinical intervention indeed suggests that
a modest increase in serum calcidiol mitigates diabetes outcomes and provides
us with some insight into the potential role of vitamin D3 and calcium
supplementation in attenuating diabetes severity. Our participant sample was
relatively small, however it included individuals from three different ethnic groups
(Caribbean, South Asian, and BlackBlack) that reside in Toronto, Ontario. The
results of this study serve as the basis for other larger clinical trials to further
elucidate the role of vitamin D supplementation in mitigating T2DM
Although the Institute of Medicine (IOM) concluded its revision of the vitamin
D RDA in 2010, the current study suggests that the committee should reconsider
the benefit that could be derived from vitamin D supplementation in those
suffering vitamin D-related diseases such as T2DM.
88
References
1. Wild S, Roglic G, Green A, Sicree Rand KH. Estimates for the year 2000 and projections for 2030. Diabetes Care 2004;27:1047-53.
2. Association CD. The prevalence and costs of diabetes. 2010 p. 1-2.
3. Zhao Y, Ye W, Boye KS, Holcombe JH, Hall JA, Swindle R. Prevalence of other diabetes-associated complications and comorbidities and its impact
· on health care charges among patients with diabetic neuropathy. J Diabetes Complications 2010;24(1):9-19.
4. Knowler WC, Barrett-Connor E, Fowler SE, Hamman RF, Lachin JM, Walker EA ND. N Engl J Med 2002;393-403.
5. Canadian Diabetes Association Clinical Practice Guidelines Expert, Committee. Canadian diabetes association 2008 clinical practice guidlines for the prevention and management of diabetes in canada. Can J Diabetes 2008;32.
6. _DeFronzo RA, Eleuterio F. Insulin Resistance: A multifaceted syndrome responsible for NIDDM, obesity, hypertension, dyslipidemia, and atherosclerotic Cardiovascular Diseas. Diabetes Care 1991; 14(3): 173-94.
7. Kahn SE. Clinical review 135: The importance of beta-cell failure in the development and progression of type 2 diabetes. J Clin Endocrinol Metab 2001 ;86(9):4047-58.
8. Chan JM, Rimm EB, Colditz GA, Stampfer MJ, and Willett WC.RECGSM and WW. -Obesity, fat istribution, and weight gain as risk factors for clinical diabetes in men. Diabetes Care 1994;17(9):961-9.
9. Wolf AM, Colditz GA. Current estimates of the economic cost of obesity in the United States. Obes Res 1998;6(2):97-106.
10. Edwards KL, Austin MA, Newman B, Mayer E, Krauss RM, Selby JV. Multivariate analysis of the insulin resistance syndrome in women. Arterioscler Thromb Vase Biol 1994;14(12):1940-5.
11. Robertson RP, Harmon J, Tran P, Poitout V. Oxidative stress in type 2 diabetes. Diabetes 2004;53(9): 119-24.
89
12. Berg AH, Scherer PE. Adipose tissue, inflammation, and cardiovascular disease. Circ Res 2005;96(9):939-49.
13. Kodama K, Tojjar D, Yamada S, Toda K, Patel CJ., Butte AJ. Ethnic differences in the relationship between insulin sensitivity and insulin response: a systematic review and meta-analysis. Diabetes Care 2013;36(6): 1789-96.
14. Franz MJ. Nutrition therapy for diabetes: effectiveness, carbohydrates and alcohol. Expert Rev Endocrinol Metab 2012;7(6):647-57.
15. Gao D, Ning N, Wang C, Wang Y, Li Q, Meng Z, Liu Y, and Li Q. Dairy products consumption and risk of type 2 diabetes: systematic review and dose-response meta-analysis. PLosOne 2013;8(9):e73965.
16. Dekker MJ, Lee S, Hudson R, Kilpatrick K, Graham TE, Ross R, and Robinson L. An e?<ercise intervention without weight loss decreases circulating interleukin-6 in lean and obese men with and without type 2 diabetes mellitus. Metabolism 2007;56(3):332-8.
17. Laferrere B, Reilly D, Arias S, Swe~dlow N, Gorroochurn P, Bawa B, Bose M, Teixeira J, Stevens R, Wenner B, Bain J, Muehlbauer MJ, Haqq A, Lien L, Shah SH, Svetkey LP, and Newgard CB. Differential metabolic impact of gastric bypass surgery versus dietary intervention in obese diabteic subjects despite identical weight loss. Sci Transl Med. 2011 ;3(80).
18. · Temelkova-kurktschiev T and Stefanov T. Lifestyle and genetics in obesity and type 2 diabetes. Exp Clin Endocrinol Diabetes 2012;120:1-6.
19. Colditz GA, Willett WC, Rotnitzky A, Manson JE. Weight Gain as a Risk Factor for Clinical Diabetes Mellitus in Women. Ann Intern Med 1995; 122(7):481-6.
20. Kruszynska Y, Olefsky J, Frias J. Effect of obesity on susceptibility to fatty acid-induced peripheral tissue insulin resistance. Metabolism 2 003; 52 (2): 2 33-8.
21. Goff LM, Griffin BA, Lovegrove JA, Sanders TA, Jebb SA, Bluck LJ, and Frost GS,. Ethnic differences in beta-cell function, dietary intake and expression of the metabolic syndrome among UK adults of South Asian, Black African-Caribbean and white-European origin at high risk of metabolic syndrome. Diab Vase Dis Res 2013;10(4):315-23.
90
22. Bakker LEH, Sleddering MA, Schoones JW, Meinders AE, Jazet IM. Pathogenesis of type 2 diabetes in South Asians. Eur J Endocrinol 2013;169(5):R99-:R 114.
23. Godsland IF, Johnston DG, Chaturvedi N. Mechanisms of disease: lessons from ethnicity in the role of triglyceride metabolism in ischemic heart disease. Nat Clin Pract Endocrinol Metab 2007;3(7):530-8.
24. Grinstein G, Muzumdar R, Aponte L, Vuguin P, Saenger P, DiMartinoNardi J. Presentation and 5-Year Follow-Up of Type 2 Diabetes mellitus in African-American and Caribbean-Hispanic Adolescents. Harm Res 2003;60(3): 121-6.
25. Lehtovirta M, Kaprio J, Forsblom C, Eriksson J, Tuomilehto J, Groop L. Insulin sensitivity and insulin secretion in monozygotic and dizygotic twins. Diabetologia 2000;43(3):285-93. ·
26. Rutti S, Sauter NS, Bouzakri K, Prazak R, Halban P a, Donath MY. In vitro proliferati~n of adult human beta-cells. PLoS One 2012;7(4):e35801.
27. Dickens M, Svitek CA, Culbert AA, O'Brien RM, Tavare JM. Central role for phosphatidylinositide 3-kinase in the repression of glucose-6;_ phosphatase gene transcription by insulin. J Biol Chem 1998;273(32):20144-9.
28. Bertrand F, Atfi A, Cadoret A, L'Allemain G, Robin H, Lascols O,Capeau J, and Cherquil G. A role for nuclear factor· kappaB in the antiapoptotic function of insulin. J Biol Chem 1998;273(5):2931-8.
29. Rorsman P and. Renstrom E. Insulin granule dynamics in pancreatic beta cells. Diabetologia. 2003;46(8): 1029-45.
30. Straub SG and Sharp GWG. Glucose-stimulated signaling pathways in biphasic insulin secretion. Diabetes Metab Res Rev 2002;18(6):451-63.
31. MacDonald PE and Wheeler MB. Voltage-dependent K(+) channels in pancreatic beta cells: role, regulation and potential as therapeutic targets. Diabetologia 2003;46(8): 1046-62.
32. Rains JL and Jain SK. Oxidative stress, insulin signaling, and diabetes. Free Radie Biol Med 2011 ;50(5):567-75.
91
33. Shulman GI and Samuel VT. Mechanisms for Insulin Resistance: Common Threads and Missing Links. Cell 2012;148:852-71.
34. Draznin 8. Molecular mechanisms of insulin resistance: Serine phsphorylation of insulin receptor substrate~ 1 and increased expression of p85a. Diabetes 2006;55:2392-7.
35. Elder DA, Herbers PM, Weis T, Standiford D, Woo JG, and D'Alessio DA. B-Cell Dysfunction in Adolescents and Adults With Newly Diagnosed Type 2 Diabetes Mellitus. J Pediatr 2012;160(6):904-10.
36. Butler AE, Janson J, Bonner-Weir S, Ritzel R, Rizza RA and Butler PC.~cell Deficit and Increased ~-cell Apoptosis in Humans With Type 2 Diabetes. Diabetes 2003;52:102-10.
37. Corbett JA, Sweetland MA, Wang JL, Lancaster JR, and McDaniel ML. Nitric oxide mediates cytokine-induced inhibition of insulin secretion by human islets of Langerhans. Pree Natl Acad Sci USA 1993;90(5):1731-5.
38. Giaccari A, Sorice G, and Muscogiuri G. Glucose toxicity: the leading acfor in the pathogenesis and clinical history of type 2 diabetes - mechanisms and potentials for treatment. Nutr Metab Cardiovasc Dis 2009; 19(5):365-77.
39. Bensellam M, Laybutt DR, and Jonas JC. The molecular mechanisms of pancreatic ~-cell glucotoxicity: recent findings and future research directions. Mel Cell Endocrinol 2012;364(1-2):1-27.
40. Van Haeften TW. Early disturbances in insulin secretion in the development of type 2 diabetes mellitus. Mel Cell Endocrinol 2002;197(1-2): 197-204.
41. Kahn SE, Hull RL, and Utzschneider KM. Mechanisms linking obesity to insulin resistance and type 2 diabetes. Nature 2006;444(7121 ):840-6.
42. Yu C, Chen Y, Cline GW, Zhang D, Zeng H, Wang Y, Bergeron R, Kim JK, Cushman SW, Cooney GJ, Atcheson B, White MF, Kraegen EW, and Shulman GI. Mechanism by which fatty acids inhibit insulin activation of insulin receptor substrate-1 (I RS-1 )-associated phosphatidylinositol 3-kinase activity in muscle. J Biol Chem 2002;277(52):50230-6.
92
43. Guilherme A, Virbasius J, Puri V, and Czech M. Adipocyte dysfunctions linking obesity to insulin resistance and typ2 2 diabetes. Nat Rev Mol cell Biol 2008;9.
44. Boden G. Role of fatty acids in the pathogenesis of insulin resistance and NIDDM. Diabetes 1997;46(1):3-10.
45. Holman RR, Paul SK, Bethel MA, Matthews DR, and Neil HAW. 10-Year Follow-Up of Intensive Glucose Control in Type 2 Diabetes. N Engl J Med 2008;359(15): 1577-89.
46. Sharman MJ and Volek JS. Weight loss leads to reductions in inflammatory biomarkers after a very-low-carbohydrate diet and a low-fat diet in overweight men. Clin Sci 2004;107(4):365-9.
47. Shab-bidar S, Neyestani TR, Djazayery A, Eshraghian M, Houshiarrad A, Kalayi A, Shariatzadeh N, Khalaji N, and Gharavi A. Improvement of vitamin D status resulted in amelioration of biomarkers of systemic inflammation in the subjects with type 2 diabetes. 2012;(11):424-30.
48. Gillies CL, Abrams KR, Lambert PC, Cooper NJ, Sutton AJ, Hsu RT, and Khunti K. Pharmacological and lifestyle interventions to prevent or delay type 2 diabetes in people with impaired glucose tolerance: systematic review and meta-analysis. BMJ 2007;334(7588):299.
49. Fang Y, Van Meurs JBJ, Arp P, Van Leeuwen JPT, Hofman A, Pols HAP, and Uitterlinden AG. Vitamin p binding protein genotype and osteoporosis. Calcif Tissue Int 2009;85(2):85-93.
50. Bar A, Shani M, Fullmer CS, Brindak ME, Striem S. Modulation of chick intestinal and renal calbindin gene expression by dietary vitamin D3, 1,25-dihydroxyvitamin D3, calcium and phosphorus. Mol Cell Endocrinol 1990;72(1):23-31.
51. Feldman D, Krishnan A, and Sawami S. Vitamin D: Biology, Actions, and clinical implications. Osteoprosis (fourth Ed. 2013. p. 283-328.
52. Pludowski P, Halick MF, Pilz S, Wagner CL, Hollis BW, Grant WB, Shoenfeld Y, Lerchbaum E, Llewellyn DJ, Kienreich K, and Soni M. Vitamin D effects on musculoskeletal health, immunity, autoimmunity, cardiovascular disease, cancer, fertility, pregnancy, dementia and mortality A review of recent evidence. Autoimmun Rev 2013; 12(10):976-89.
93
53. Bikle DD. Vitamin D metabolism and function in the skin. Mal Cell Endocrinol 2011 ;347(1-2):80-9.
54. Holden JM, Lemar LE. Assessing vitamin D contents in foods and supplements: challenges and needs. Am J Clin Nutr 2008;88(2):551 S-553S.
55. Farrar MD, Webb AR, Kitt R, Durkin MT, Allan D, Herbert A, et al. Efficacy of a dose range of simulated sunlight exposures in raising vitamin D status in South Asian adults: implications for targeted guidance on sun exposure. Am J Clin Nutr 2013;25:1210-6.
56. MF Halick, JE Frommer, SC McNeil!, NM Richtand, JW Henley, and JT Potts J. Photometabolism of 7-dehydrocholeterol to previtamin D3 in skin. Biochem Biophys Res Commun 1977;76(1):107-14.
57. Hollis BW. Circulating 25-hydroxyvitamin D levels indicative of vitamin D sufficiency: Implications for establishing a new effective dietary intake recommendation for vitamin D. J Nutr 2005;317-22.
58. Guo YD, Strugnell S, Back OW, Jones G. Transfected human liver cytochrome P-450 hydroxylates vitamin D analogs at different side-chain positions. Proc Natl Acad Sci USA 1993;90(18):8668-72.
59. Iida K, Shinki T, Yamaguchi A, Deluca HF, Kurokawa K, Suda T. A possible role of vitamin D receptors in regulating vitamin D activation in the kidney. Proc Natl Acad Sci USA 1995;92(13):6112-6.
60. Hibler EA, Jurutka PW, Egan JB, Hu C, LeRoy EC, Martinez ME, et al. Association between polymorphic variation in VDR and RXRA and circulating levels of vitamin D metabolites. J Steroid Biochem Mol Biol 201 0; 121 ( 1-2): 438-41 .
61. Segersten U, Holm PK, Bjorklund P, Hessman 0, Nordgren H, Binderup L, et al. 25-Hydroxyvitamin 03 1 alpha-hydroxylase expression in breast cancer and use of non-1 alpha-hydroxylated vitamin D analogue. Breast Cancer Res 2005;7(6):R980-6.
62. Zehnder D, Bland R, Williams M, McNinch R, Howie A, Stewart P, and Hewison M. Extrarenal expression of the 25-hydroxyvitamin D-1-hydroxylase. J Clin Endocrinol Metab 2001 ;86:888-94.
94
63. Eyles OW, Smith S, Kinobe R, Hewison M, McGrath JJ. Distribution of the vitamin D receptor and 1 alpha-hydroxylase in human brain. J Chem Neuroanat 2005;29(1 ):21-30.
64. Norman AW, Nemere I, Taoka T, Sergeev I, Zhou L-X, Bishop JE, et al. 1.,25(0H)-vitamin 03, a steroid hormone that produces biologic effects via both genomic and non-genomic pathways. J Steroid Biochem Mclee Biol 1992;41 (3):231-40.
65. Pruter K, Racz A, Lin GC, Barsony J. Dimerization with retinoid X receptors promotes nuclear localization and subnuclear targeting of vitamin D receptors. J Biol Chem 2000;275(52):41114-23.
66. Haussler M, Haussler C, Jurutka P, Thompson P, Hsieh J, Remus L, et al. The vitamin D hormone and its nuclear receptor: molecular actions and disease states. J Endocrinol 1997;25.
67. Jones G, Strugnell SA, Deluca HF. Current understanding of the molecular actions of vitamin D. Physiol Rev 1998;78(4):1193-231.
68. Lips P. Vitamin D physiology. Prog Biophys Mal Biol 2006;92(1):4-8.
69. Halick MF. Sunlight and vitamin D for bone health and prevention of autoimmune diseases, cancers, and cardiovascular disease. Am J Clin Nutr. 2004;80(6 Suppl): 1678S-88S.
70. Dawson-Hughes B, Heaney RP, Halick MF, Lips P, Meunier PJ, Vieth R. Estimates of optimal vitamin D status. Osteoporos Int 2005;16(7):713-6.
71. Ross a C, Manson JE, Abrams SA, Aloia JF, Brannon PM, Clinton SK, et al. The 2011 report on dietary reference intakes for calcium and vitamin D from the Institute of Medicine: what clinicians need to know. J Clin Endocrinol Metab 2011 ;96(1 ):53-8.
72. Holick MF, Binkley NC, Bischoff-Ferrari HA, Gordon CM, Hanley DA, Heaney RP, Murad MH and WC. Guidelines Evaluation, Treatment, and Prevention of Vitamin D Deficiency. J Clin Endo Metab 2011;96(7):1911-30.
73. Pittas AG, Dawson-Hughes B, Li T, Van Dam RM, Willett WC, Manson JE, et al. Vitamin D and calcium intake in relation to type 2 diabetes in women. Diabetes Care 2006;29(3):650-6.
95
74. Pittas AG, Lau J, Hu FB, Dawson-Hughes B. The role of vitamin D and calcium in type 2 diabetes. A systematic review and meta-analysis. J Clin . Endocrinol Metab 2007;92(6):2017~29.
75. Soilu-Hanninen M, Laaksonen M, Laitinen I, Eralinna JP, Lilius E-M, Mononen I. A longitudinal study of serum 25-hydroxyvitamin D and intact parathyroid hormone levels indicate the importance of vitamin D and calcium homeostasis regulation in multiple sclerosis. J Neural Neurosurg Psychiatry 2008;79(2): 152-7.
76. Gianforcaro A and Hamadeh MJ. Dietary vitamin D3 supplementation at 1 Ox the adequate intake improves functional capacity in the G93A transgenic mouse model of ALS, a pilot study. CNS Neurosci Ther 2012;18(7):547-57.
77. Gianforcaro A, Solomon JA, and Hamadeh MJ. Vitamin 0(3) at 50x Al attenuates the decline in paw grip endurance, but not disease outcomes, in the G93A mouse model of ALS, and is toxic in females. Plos One 2013;8(2):e30243.
78. Solomon JA, Gianforcaro A, and Hamadeh MJ. Vitamin 03 deficiency differentially affects functional and disease outcomes in the G93A mouse
·model of amyotrophic lateral sclerosis. Plos One 2011 ;6(12):e29354.
79. Tretli S, Hemes E, Berg JP, Hestvik UE, and Robsahm TE. Association between serum 25(0H)D and death from prostate cancer. Br J Cancer 2009; 100(3):450-4.
80. McCullough ML, Bandera EV, Moore OF, and Kushi LH. Vitamin D and calcium intake in relation to risk of endometrial cancer: a systematic review of the literature. Prev Med 2008;46(4):298-302.
81. Grant WB. An estimate of the global reduction in mortality rates through doubling vitamin D levels. Eur J Clin Nutr Nature Publishing Group; 2011;65(9):1016-26.
82. Deng X, Song Y, Manson JE, Signorello LB, Zhang SM, Shrubsole MJ, et al. Magnesium, vitamin D status and mortality: results from US National Health and Nutrition Examination Survey (NHANES) 2001 to 2006 and NHANES Ill. BMC Med 2013;11(1):187.
96
83. Munger KL, Levin LI, Massa J, Horst R, Orban T, and Ascherio A. Preclinical serum 25-hydroxyvitamin D levels and risk of type 1 diabetes in a cohort of US military personnel. Am J Epidemiol 2013;177(5):411-9.
84. Scragg R, Sowers M and BC. Serum 25-hydroxyvitamin D, diabetese, and ethnicity in the Third National Health and Nutrition Examination. Diabetese Care 2004;27(12).
85. Kayaniyil S, Vieth R, Harris SB, Retnakaran R, Knight JA, Gerstein HC, et al. Association of 25(0H)D and PTH with metabolic syndrome and its traditional and nontraditional components. J Clin Endocrinol Metab 2011 ;96(1):168-75.
86. Von Hurst PR, Stonehouse W, and Coad J. Vitamin D supplementation reduces insulin resistance in South Asian women living in New Zealand who are insulin resistant and vitamin D deficient - a randomised, placebocontrolled trial. Br J Nutr 201O;103(4):549-55.
87. Langlois K, Greene-Finestone L, LittleJ, Hidiroglou N, and Whiting S. Vitamin D status of Canadians as measured in the 2.007 to 2009 Canadian Health Measures Survey. Health Rep 2010;21(1):47-55.
88. Hanley DA, Cranney A, Jones G, Whiting SJ, Leslie WO, Cole DEC, et al. Vitamin D in adult health and disease: a review and guideline statement from Osteoporosis Canada. CMAJ 2010;182(12):E610~8.
89. Christensen MHE, Lien EA, Hustad S, and Almas B. Seasonal and age-· related differences in serum 25-hydroxyvitamin D, 1,25-dihydroxyvitamin D and parathyroid hormone in patients from Western Norway. Scand J Clin Lab Invest 2010;70(4):281-6.
90. Dong Y, Pollock N, Stallmann-Jorgensen IS, Gutin B, Lan L, Chen TC, et al. Low 25-hydroxyvitamin D levels in adolescents: race, season, adiposity, physical activity, and fitness. Pediatrics 2010;125(6):1104-11.
91. Harris SS and Dawson-Hughes B. Seasonal changes in plasma 25-hydroxyvitamin D concentrations of young American Black and white women. Am J Clin Nutr 1998;67(6): 1232-6.
92. Lips P, Duong T, Oleksik A, Black D, Cummings S, and Cox D. A global study of vitamin D status and parathyroid function in postmenopausal women with osteoporosis: baseline data from the multiple outcomes of
'93. Rajakumar K, De las Heras J, Chen TC, Lee S, and Halick MF, Arslanian SA. Vitamin D status, adiposity, and lipids in Black American and Caucasian children J Clin Endocrinol Metab 2011 ;96(5):1560-7
94. Johnson JA, Beckman MJ, Pansini-Porta A, Christakos S, Bruns ME, Beitz DC, et al. Age and gender effects on 1 ,25-dihydroxyvitamin D3-regulated gene expression. Exp Gerontol 1995;30(6):631-43.
95. Hagenau T, Vest R, Gissel TN, Poulsen CS, Erlandsen M, Mosekilde L, et al. Global vitamin D levels in relation to age, gender, skin pigmentation and latitude: an ecologic meta-regression analysis. Osteoporos Int 2009;20(1):133-40.
96. Dawson-Hughes 8. Racial/ethnic considerations in making recommendations for vitamin D for adult and elderly men and women. Am J Clin Nutr 2004;80(6 Suppl): 1763S-6S.
97. Bell NH, Epstein S, Greene A, Shary J, Oexmann MJ, and Shaw S. Evidence for alteration of the vitamin D-endocrine system in obese subjects. J Clin Invest 1985;76:370-3.
98. Chiu KC, Chu A, Go VLW, and Saad MF. Hypovitaminosis D is associated with insulin resistance and (3-cell. Am J Clin Nutr. 2004;25(4):820-5.
99. Harris SS and Dawson-Hughes B. Seasonal changes in plasma 25-hydroxyvitamin D concentrations of young American Black and white women. Am J Clin Nutr 1998;67(6): 1232-6.
100. Snijder MB, Van Dam RM, Visser M, Deeg DJH, Dekker JM, Souter LM, et al. Adiposity in relation to vitamin D status and parathyroid hormone levels: a population-based study in older men and women~ J Clin Endocrinol Metab 2005;90(7):4119-23.
101. Dong Y, Stallmann-Jorgensen IS, Pollock NK, Harris R a, Keeton D, Huang Y, et al. A 16-week randomized clinical trial of 2000 international units daily vitamin D3 supplementation in Black youth: 25-hydroxyvitamin D, adiposity, and arterial stiffness. J Clin Endocrinol Metab 2010;95(10):4584-91.
98
102. Rosenstreich SJ, Rich C, and Volwiler W. Deposition in and Release of Vitamin D3 from Body Fat: Evidence for a Storage Site in the Rat. J Clin Invest 1971 ;50:679-87.
103. Bienaime F, Prie D, Friedlander G, and Souberbielle JC. Vitamin D metabolism and activity in the parathyroid gland. Mal Cell Endocrinol 2011 ;347(1-2):30-41 ..
104. Bellido T, Saini V, and Pajevic PD. Effects of PTH on osteocyte function. Bone 2013;54(2):250-7.
105. Brown EM. Role of the calcium-sensing receptor in extracellular calcium homeostasis. Best Pract Res Clin Endocrinol Metab 2013;27(3):333-43.
106. Weng S, Sprague JE, Oh J, Riek AE, Chin K, Garcia M, et al. Vitamin D deficiency induces high blood pressure and accelerates atherosclerosis in mice. PLoS One. 2013;8(1):e54625.
107. Kruger M, Kruger MC, Doak CM, Schutte AE, Huisman HW, Malan NT, et al. The Association of 25 ( OH ) D with Blood Pressure , Pulse Pressure and Carotid-Radial Pulse Wave Velocity in African Women. PLoS One 2013;8(1 ).
108. McCarty M and Thomas C. PTH excess may promote weight gain by impeding catecholamine-induced lipolysis-implications for the impact of calcium, vitamin D, and alcohol on body weight. Med Hypotheses 2003;61 (5-6):535-42.
109. Riek AE, Oh J, and Bernal-Mizrachi C. Vitamin D regulates macrophage cholesterol metabolism in diabetes. J Steroid Biochem Mal Biol 2010;121 (1-2):430-3.
110. Oh J, Weng S, Felton SK, Bhandare S, Riek A, Butler B, et al. 1,25(0H)2 vitamin D inhibits foam cell formation and suppresses macrophage cholesterol uptake in patients with type 2 diabetes mellitus. Circulation 2009; 120(8):687-98.
111. Nikooyeh B, Neyestani TR, Farvid M, Alavi-majd H, Houshiarrad A, Kalayi A, et al. Daily consumption of vitamin D- or vitamin D+ calcium - fortified yogurt drink improved glycemic control in patients with type 2 diabetes: a. randomized clinical trial. Am J Clin Nutr 2011 ;(1 ).
99
112. Johnson J, Grande P, Roche P and KR. lmmunohistochemical receptor and calbindin D 28k in human and rat pancreas. Am. J Physiol 1994;25(23):356-60.
113. Bland R, Markovic 0, Hills CE, Hughes S V, Chan SLF, Squires PE, et al. Expression of 25-hydroxyvitamin 03-1 alpha-hydroxylase in pancreatic islets. J Steroid Biochem Mol Biol 2004;89-90(1-5):121-5.
114. Bourlon PM, Billaudel B, Faure-Oussert a. Influence of vitamin 03 deficiency and 1,25 dihydroxyvitamin 03 on de nova insulin biosynthesis in the islets of the rat endocrine pancreas. J Endocrinol 1999; 160(1 ):87-95.
115. Kajikawa M, Ishida H, Fujimoto S, Mukai E, Nishimura M, Fujita J, et al. An insulinotropic effect of vitamin D analog with increasing intracellular Ca2+ concentration in pancreatic beta-cells through nongenomic signal transduction. Endocrinology 1999;140(10):4706~12.
116. Milner RD and Hales CN. The role of calcium and magnesium in insulin secretion from rabbit pancreas studied in vitro. Diabetologia 1967;3(1 ):47-9.
117. Billaudel BJL, Delbancut APA, Sutter BCJ, Faure AG. dihydroxyvitamin D 3 on calcium handling and insulin secretion by islets from vitamin 03-deficient rats. Steroids 1993;58:335-41.
118. McTernan P, Harte A, Anderson L, Green A, Smith S, Holder J, Barnett A, Eggo M, Kumar S. lnsu.lin and rosiglitazone regulation of lipolysis and lipogenesis in human adipose tissue in vitro. Diabetes 2002;51 :1493-1498
119. Groop LC, Bonadonna RC, DelPrato S, Ratheiser K, Zyck K, Ferrannini E, et al. Glucose and free fatty acid metabolism in non-insulin-dependent diabetes mellitus. Evidence for multiple sites of insulin resistance. J Clin Invest 1989;84(1):205-13.
120. Miranda PJ, OeFronzo Ra, Califf RM, Guyton JR. Metabolic syndrome: definition, pathophysiology, and mechanisms. Am Heart J 2005 ; 149(1 ):33-45.
121. Samuel VT, Liu Z-X, Qu X, Elder BD, Bilz S, Befroy D, et al. Mechanism of hepatic insulin resistance in non-alcoholic fatty liver disease. J Biol Chem 2004;279(31 ):32345-53.
100
122. Lteif a a, Han K, Mather KJ. Obesity, insulin resistance, and the metabolic syndrome: determinants of endothelial dysfunction in whites and Blacks. Circulation 2005; 112(1 ):32-8.
123. Maestro B, Melero S, Baja S, Davila N, Calle C. Transcriptional activation of the human insulin receptor gene by 1,25-dihydroxyvitamin 0(3). Cell Biochem Funct 2002;20(3):227-32.
124. Manna P, Jain SK. Vitamin D up-regulates glucose transporter 4 (GLUT4) translocation and glucose utilization mediated by cystathionine-y-lyase (CSE) activation and H2S formation in 3T3L 1 adipocytes. J Biol Chem 2012;287(50):42324-32.
125. Nagpal J, Pande JN, Bhartia a. A double-blind, randomized, placebocontrolled trial of the short-term effect of vitamin 03 supplementation on insulin sensitivity in apparently healthy, middle-aged, centrally obese men. Diabet Med 2009;26(1):19-27.
126. Lefebvre d'Hellencourt C, Montero-Menei CN, Bernard R, Couez D. Vitamin 03 inhibits proinflammatory cytokines and nitric oxide production by the EOC13 microglial cell line. J Neurosci Res 2003;71 (4):575-82.
127. Shab-bidar S, Neyestani T, Djazayery, Eshraghian M, Houshiarrad A, Kalayi, Shariatzadeh N, Khalaji N, and Gharavi A. Improvement of vitamin D status resulted in amelioration of biomarkers of systemic inflammation in the subjects with type 2_diabetes. Diabetes Metab Res Rev 2012;28(11):424-30.
128. Gradinaru D, Borsa C, lanescu C, Margina D, Prada, G; and Jansen E. Viamin D status and oxidative stress markers in the elderly with impaired fasting glucose and type 2 diabetes mellitus. Aging Clin Exp Res 2012;24(6).
129. Hurskainen A, Voutilainen S. Association of serum 25-hydroxyvitamin D with type 2 diabetes and markers of insulin resistance in a general older population in Finland 2012:418-23.
130. Husemoen L, Thuesen B, Fenger M, Jorgensen T, Glumer C, Svensson J, et al. Serum 25(0H)D and type 2 diabates association in a general population. Diabetes Care 2012;35(1695-1700).
101
131. Maki KC, Rubin MR, Wong LG, McManus JF, Jensen CD, Marshall JW, et al. Serum 25-hydroxyvitamin D is independently associated with highdensity lipoprotein cholesterol and the metabolic syndrome in men and women. J Clin Lipidol 2009;3(4):289-96.
132. Ashraf AP, Alvarez JA, Gower BA, Saenz KH, McCormick KL. Associations of serum 25-hydroxyvitamin D and components of the metabolic syndrome in obese adolescent females. Obesity 2011; 19(11 ):2214-21.
133. Joergensen C, Gall M, Schemedes A, Tarnow L, Parving Hand RP. Vitamin D levels and mortality in type 2 diabetes. Diabetes Care · 2010;33(10).
134. Lim S, Kim MJ, Choi SH, Shin CS, Park KS, Jang HC, et al. Association of vitamin D deficiency with incidence of type 2 diabetes in high-risk Asian subjects. Am J Clin Nutr 2013;97:524-30.
135. Buijsse B, Boeing H, Hirche F, Weikert C, Schulze MB, Gottschald M, et al. Plasma 25-hydroxyvitamin D and its genetic determinants in relation to incident type 2 diabetes: a prospective case-cohort study. Eur J Epidemiol 2013;28(9):7 43-52.
136. Forouhi N, Luan J, Cooper A, Boucher B, and Wareham N,. Baseline serum 25-hydroxy vitamin D is predictive of Future glycemic status and insulin· resistance. Diabetes 2008;57:2619-25.
137. Kayaniyil S, Retnakaran R, Harris SB, Vieth R, Knight JA, Gerstein HC, et al. Prospective associations of vitamin D with ~-cell function and glycemia: the Prospective Metabolism and Islet cell Evaluation (PROMISE) cohort study. Diabetes 2011 ;60(11):2947-53.
138. Gagnon C, Lu ZX, Magliano DJ, Dunstan OW, Shaw JE, Zimmet PZ, et al. Low serum 25-hydroxyvitamin Dis associated with increased risk of the development of the metabolic syndrome at five years: Results from a national, population-based prospective Study (The Australian Diabetes, Obesity and Lifestyle Study: Aus Diab). J Clin Endocrinol Metab 2012;97(6):1953-61.
139. Pittas AG, Nelson J, Mitri J, Hillmann W, Garganta C, Nathan OM, et al. Plasma 25-hydroxyvitamin D and progression to diabetes in patients at
102
risk for diabetes: an ancillary analysis in the Diabetes Prevention Program. Diabetes Care 2012;35(3):565-73.
140. Forouhi NG, Ye Z, Rickard a P, Khaw KT, Luben R, Langenberg C, et al. Circulating 25-hydroxyvitamin D concentration and the risk of type 2 diabetes: results from the European Prospective Investigation into Cancer (EPIC)-Norfolk cohort and updated meta-analysis of prospective studies. Diabetologia 2012;55(8):2173-82.
141. Deleskog A, Hilding A, Brismar K, Hamsten A, Efendic S, Ostenson CG. Low serum 25-hydroxyvitamin D level predicts progression to type 2 diabetes in individuals with prediabetes but not with normal glucose tolerance. Diabetologia 2012;55(6): 1668-78.
142. Grimnes G, Emaus N, Joakimsen RM, Figenschau Y, Jenssen T, Nj0lstad I, et al. Baseline serum 25-hydroxyvitamin D concentrations in the Troms0 Study 1994-95 and risk of developing type 2 diabetes mellitus during 11 years of follow-up. Diabet Med 2010;27(10): 1107-15.
143. Robinson JG, Manson JE, Larson J, Liu S, Song Y, Howard 8 V, et al. Lack of association between 25(0H)D levels and incident type 2 diabetes in older women. Diabetes Care 2011 ;34(3):628-34.
144. Belenchia AM, Tosh AK, Hillman LS, Peterson CA. Correcting vitamin D insufficiency improves insulin sensitivity in obese adolescents : a randomized controlled trial. 2013;25(2): 1-8.
145. Major GC, Alarie F, Dore J, Phouttama S, Tremblay A. Supplementation with calcium + vitamin D enhances the beneficial effect of weight loss on plasma lipid and lipoprotein concentrations. Am J Clin Nutr 2007;85(1 ):54-9.
146. Al-Daghri NM, Alkharfy KM, Al-Othman A, El-Kholie E, Moharram 0, Alokail MS, et al. Vitamin D supplementation as an adjuvant therapy for patients with T2DM: an 18-month prospective interventional study. Cardiovasc Diabetol 2012; 11 (1 ):85.
147. Pittas AG, Harris S, Stark P D-HB. The effects of calcium and vitamin D supplementation on blood glucose and markers of inflammation in nondiabetic. Diabetese Care 2007;30:980-6.
103
148. Harris SS, Pittas AG, Palermo NJ. A randomized, placebo-controlled tr.ial of vitamin D supplementation to improve glycemia in overweight and obese African Americans. Diabetese Obes Metab 2012;1-6.
149. Mitri J, Dawson-hughes B, Hu FB, Pittas AG. Effects of vitamin D and calcium supplementation on pancreatic b cell function , insulin sensitivity , and glycemia in adults at high risk of diabetes : the Calcium and Vitamin D for Diabetes Mellitus ( CaDDM ) randomized controlled trial. Am J Clin Nutr 2011 ;(4):486-94.
150. Norman AW, Frankel JB,Heldt AM GG. Vitamin D Deficiency Inhibits Pancreatic Secretion of Insulin. Science1980;209(4458):823-5.
151. Meerza D, Naseem I, Ahmed J. Effect of 1, 25(0H)2 vitamin D3 on glucose homeostasis and DNA damage in type 2 diabetic niice. J Diabetes Complications 2012;26(5):363-8.
152. Hamden KH, Arreau SC, Amoussi KJ, lladi SM, Ajmi SL, Loulou DA, et al. 1 a, 25 Dihydroxyvitamin D3 : Therapeutic and preventive effects against oxidative stress ,hepatic ,pancreatic and renal injury in alloxan-induced diabetes in rats. J Nutr Sci Vitaminol 2009;215-22.
153. Moreira TS, Hamadeh MJ. The role of vitamin D deficiency in the pathogenesis of type 2 diabetes mellitus. ESpen Eur J Clin Nutr Metab 201 0; 5( 4): e 155-e 165.
154. Abu khaled M, Mccutcheon M, Reddy S, Pearman P, Hunter G, Weinsier R. Electrical impedance in assessing human body composition: the BIA method. Am J Clin Nutr 1988; 47:789~92
155. Sonora E, Targher G, Alberiche M, Bonadonna R, Saggiani F, Zenere M, et al. Closely Mirrors the Glucose Clamp. Diabetes Care 2000;23(1 ).
156. Statiscs Canada. Vitamin D intake. Nutrition 2004;3(Cv):2004.
158. Breslavsky a., Frand J, Boaz M, Barnea Z, .Shargorodsky M. Effect of high doses of vitamin D on arterial properties, adiponectin, leptin and glucose homeostasis in type 2 diabetic patients. Clin Nutr 2013; 1-6.
104
159. Carrillo AE, Flynn MG, Pinkston C, Markofski MM, Jiang Y, Donkin SS, et al. Impact of vitamin D supplementation during a resistance training intervention on body composition, muscle function, and glucose tolerance in overweight and obese adults. Clin Nutr 2012 Aug 31 ;8-14.
160. Ceglia L, Niramitmahapanya S, Morais MOS, Rivas D a, Harris SS, Bischoff-Ferrari H, et al. A randomized study on the effect of vitamin 03 supplementation on skeletal muscle morphology and vitamin D receptor concentration in older women. J Clin Endocrinol Metab 2013;(C):1-9.
161. Reinehr T,. De Sousa G, Alexy U, Kersting M, Andler W. Vitamin D status and parathyroid hormone in obese children before and after weight loss. Eur J Endocrinol 2007;157(2):225-32.
162. Sahota 0, Mundey MK, San P, Godber IM, Lawson N, Hosking DJ. The relationship between vitamin D and parathyroid hormone: calcium homeostasis, bone turnover, and bone mineral density in postmenopausal women with established osteoporosis. Bone 2004;35(1):312-9.
163. Zemel MB. Role of calcium and dairy products in energy partitioning and weight management. Am J Clin Nutr 2004;79(5):907S-912S.
164. Shi H, Norman AW, Okamura WH, Sen A. 1a,25-Dihydroxyvitamin 0 3 modulates human adipocyte metabolism via nongenomic action 1. 2001 ;2751-3.
165. Cheng S, Massaro JM, Fox CS, Larson MG, Keyes MJ, Mccabe EL, et al. Adiposity, Cardiometabolic Risk, and Vitamin D Status: The Framingham Heart Study. 2010;59.
166. Simonson DC. Etiology and prevalence of hypertension in diabetic patients. Diabetes Care. 1988;11(10):821-7.
167. Li YC, Kong J, Wei M, Chen Z, Liu SQ, Cao L. 1,25-Dihydroxyvitamin D 3 is a negative endocrine regulator of the renin-angiotensin system. 2002; 110(2):229-38.
168. Lind L, Hanni A, Lithell H, Hvarfner A, Sorensen O.H and LS. Vitamin D is related to blood pressure and other cardiovascular risk factors in middleaged men. Am J Hyperteension. 1995;8:894-901.
105
169. Margolis KL, Ray RM, Van Horn L, Manson JE, Allison MA, Black HR, et al. Effect of calcium and vitamin D supplementation on blood pressure: the Women's Health Initiative Randomized Trial. Hypertension. · 2008;52(5):847-55.171.
170. Yiu YF, Yiu KH, Siu CW, Chan YH, Li SW, Wong LY. Randomized controlled trial of vitamin D supplement on endothelial function in patients with type 2 diabetes. Atheroscelrosis 2013;227(1):140-6
171. Wong RG, Norman AW, Reddy.CR, Coburn JW. Biologic effects of 1,25-dihydroxycholecalcipherol (a· highly active vitamin D metabolite) in acutely uremic rats. J Clin Invest 1972;51(5):1287-91
172. Dirks-Naylor AJ, Lennon-Edwards S. The eHects of-vitamin D on skeletal muscle function and cellular signaling. J Steroid Biochem Mal Biol · 2011.;125(3-5): 159-68.
173. Teegarden D, Donkin SS. Vitamin D: emerging new roles in insulin sensitivity. Nutr Res Rev 2009;22(1 ):82-92.
174. Kostoglou-Athanassiou I, Athanassiou P, Gkountouvas A, Kaldrymides P. Vitamin D and glycemic control in diabetes mellitus type 2. Ther Adv Endocrinol Metab 2013;4(4):122-8.
175. Chonchol M, Scragg R. 25-Hydroxyvitamin D, insulin resistance, and kidney function in the Third National Health and Nutrition Examination Survey. Kidney Int 2007;71(2):134-9.
176. Pacifico L, Anania C, Osborn JF, Ferraro F, Bonci E, Olivero E, et al. Low 25(0H)D3 levels are associated with total adiposity,. metabolic syndrome, and hypertension in Caucasian children and adolescents. Eur J Endocrinol 2011 ;165(4):603-11. .
177. Levin A, Bakris GL, Molitch M, Smulders M, Tian J, Williams LA, et al. Prevalence of abnormal serum vitamin D, PTH, calcium, and phosphorus in patients with chronic kidney disease: results of the study to evaluate early kidney disease. Kidney Int 2007;71(1):31-8.
178. DeBoer I, Tinker L, Connelly·S, Curb J, Howard B, K~stenbaum B, LArson J, Manson J, Margolis K, Siscovick D, and Weiss !'J. Calcium plus vitamin D supplementation and the risk of incident diabetes in the Women's Health Initiative. Diabetes Care 2008;31 (4).
106
179. DeFronzo RA, Eldor R, and Abdul-Ghani M. Pathophsyiologic approach to therapy in patients with newly diagnosed type 2 diabates. Diabetes Care 2013;36.
180. Eartmann CP, Beckman LM, Masodkar K, Sibley SD. The link between obesity and low circulating 25-hydroxyvitamin D concentrations: considerations and implications.Intern J Obesity 2012;36:387-396.
107
Appendix A
Presentation of data as means ± SD with parametric tests.
108
Table 17: Baseline characteristics presented as means± SD following perprotocol assignment, for T2DM subjects (n = 11 ).
BMI; body mass index; WC, w~ist circumference; HC, hip circumference; WHR, waist-to-hip ratio; SBP, systolic blood pressure; DBP, diastolic blood pressure; PTH, parathyroid hormone; FSG, fasting serum glucose; HbA1C, glycated hemoglobin A1c; HOMA-IR, homeostatic model assessment of insulin resistance; HOMA-8, homeostatic model assessment of ~-cell function; LDL-C, low-density lipoprotein cholesterol; HDL-C, high-density lipoprotein cholesterol; TC, total cholesterol, TC/HDL-C, total cholesterol and high-density lipoprotein cholesterol ratio; TG; triglycerides; AST, aspartate transaminase; ALT, alanine transaminase; and eGFR, estimated glomerular filtration rate.
113
Table 21: Comparison of outcome measures, presented as means ± SD, in participants within-group, following retrospective assignment, for T2DM subjects (n = 11 ). · ·
Data presented as means ± SD. BMI; body mass index; WC, waist circumference; HC, hip circumference; WHR, waist-to-hip ratio; SBP, systolic blood pressure; DBP, diastolic blood pressure; PTH, parathyroid hormone; FSG, fasting serum glucose; HbA1C, glycated hemoglobin A1c; HOMA-IR, homeostatic model assessment of insulin resistance; HOMA-8, homeostatic model assessment of ~-cell function; TC, total cholesterol; LDL-C, low-density lipoprotein cholesterol; HDL-C, high-density lipoprotein cholesterol; TC/HDL-C, total cholesterol and highdensity lipoprotein cholesterol ratio; TG; triglycerides; AST, aspartate transaminase; ALT, alanine transaminase; a(ld eGFR, estimated glomerular filtration rate. Within group, a paired t-test was performed to determine if there were significant differences between values at 3 years vs. baseline. P is significant =::;; 0.10.
115
0.048
0.032
0.221
0.265
0.102
0.502
0.031
0.212
Table 22: Comparison of outcome measures, presented as means ± SD, in participants between groups at 3 years, following retrospective assignment, for T2DM subjects (n = 11 ).
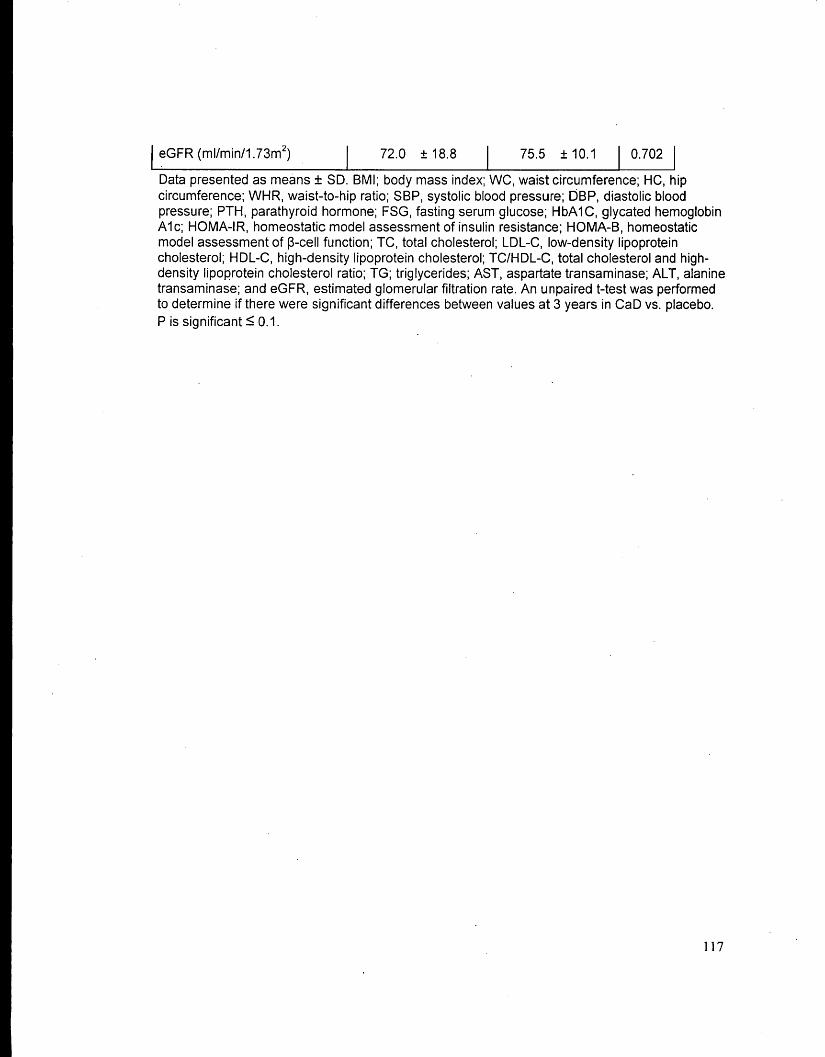
j eGFR (ml/min/1. 73m2) 72.0 ± 18.8 75.5 ± 10.1 I o.702 I
Data presented as means ± SD. BMI; body mass index; WC, waist circumference; HC, hip circumference; WHR, waist-to-hip ratio; SBP, systolic blood pressure; DBP, diastolic blood pressure; PTH, parathyroid hormone; FSG, fasting serum glucose; HbA1C, glycated hemoglobin A1c; HOMA-IR, homeostatic model assessment of insulin resistance; HOMA-B, homeostatic model assessment of ~-cell function; TC, total cholesterol; LDL-C, low-density lipoprotein cholesterol; HDL-C, high-density lipoprotein cholesterol; TC/HDL-C, total cholesterol and highdensity lipoprotein cholesterol ratio; TG; triglycerides; AST, aspartate transaminase; ALT, alanine transaminase; and eGFR, estimated glomerular filtration rate. An unpaired t-test was performed to determine if there were significant differences between values at 3 years in CaD vs. placebo. Pis significant S 0.1.