86
The School Snapshot Survey: Winter 2018 Research report July 2019 IFF Research

The School Snapshot Survey: Winter 2018
Research report
July 2019
IFF Research

2
Contents
List of figures 3
Executive Summary 6
School Snapshot Survey: Winter 2018 findings infographic 16
Background 19
1. Curriculum 21
1.1 Advanced Maths Premium 21
1.2 GCSE Reform 23
1.3 Modern Foreign Languages 24
1.4 Curriculum implementation 25
1.5 English Baccalaureate (EBacc) 28
1.6 On-entry-assessment 33
1.7 Phonics 33
2. Resources, teacher workload and careers 36
2.1 Resources in the classroom 36
2.2 Teacher workload 47
2.3 Careers advice for pupils 54
2.4 Continuing Professional Development 58
2.5 Mobile phones 62
3. Support for pupils 63
3.1 Educate Against Hate 64
3.2 Extra-curricular activity 67
3.3 Mental health 71
3.4 Wellbeing 73
3.5 PSHE 74
3.6 Special Educational Needs and Disability (SEND) 79
3.7 Free School Meals 81
3
List of figures
Figure 1. Actions used (if any) to increase participation in post-16 maths ....................... 22
Figure 2. Confidence in teaching reformed English and maths GCSEs ........................... 23
Figure 3. The frequency and purpose of using educational technology in MFL ............... 24
Figure 4. The proportion of schools that have participated in DfE funded programmes .. 26
Figure 5. Proportion of schools that have participated in Maths and Music Education
Hubs, by phase (primary, secondary) and year ............................................................... 27
Figure 6. Estimated % of KS4 pupils likely to be entered into EBacc across 3 academic
years ................................................................................................................................ 29
Figure 7. Estimated % of KS4 pupils likely to be entered into EBacc in 2019/20 by
academy status ................................................................................................................ 30
Figure 8. Estimated % of KS4 pupils likely to be entered into EBacc in 2019/20 by
proportions of Free School Meals .................................................................................... 31
Figure 9. Estimated change of KS4 pupils likely to be entered into EBacc in 2020/21 by
proportions entered in 2019/20 ........................................................................................ 32
Figure 10. How often primary teachers read to their class on average ............................ 34
Figure 11. Types of resources used in the classroom ..................................................... 37
Figure 12. Types of resources used in the classroom for Secondary English teachers ... 38
Figure 13. Types of resources used in the classroom for Secondary Maths teachers ..... 39
Figure 14. Type of resources created or accessed by Secondary Science teachers ....... 39
Figure 15. Resources accessed by primary teachers ...................................................... 41
Figure 16. Resources accessed by secondary teachers ................................................. 42
Figure 17. Main reasons for not using online and physical resources more often ........... 43
Figure 18. Use of resources types in science class by primary teachers ......................... 44
Figure 19. Use of resource types in humanities ............................................................... 45
Figure 20. The frequency with which secondary teachers used resources in the last year
......................................................................................................................................... 46

4
Figure 21. Actions taken by schools to reduce unnecessary workload – responses from
school leaders .................................................................................................................. 48
Figure 22. Impact on manageability of workload – responses from school leaders ......... 50
Figure 23 Action taken by schools to reduce unnecessary workload – responses from
teachers ........................................................................................................................... 51
Figure 24 Teachers' awareness of action taken by their school to reduce unnecessary
workload (comparing Winter 2018 and Summer 2018 results) ........................................ 52
Figure 25. Impact on manageability of workload – responses from teachers .................. 53
Figure 26. Whether school had organised a visit from the following providers of technical
education to support pupils considering technical qualifications ...................................... 55
Figure 27. Proportion of leaders aware of the new requirement to allow
apprenticeship/technical education providers access to pupils and whether they plan to
publish provider access policy statement on school’s website ......................................... 56
Figure 28. Whether school integrates material in the following subjects/ways to promote
pupil interest in STEM ...................................................................................................... 57
Figure 29. Types of CPD accessed in the last 12 months by primary and secondary
leaders and teachers ....................................................................................................... 59
Figure 30. Types of CPD accessed in the last 12 months by school leaders and teachers
......................................................................................................................................... 60
Figure 31. School policy on use of mobile phones by school phase ................................ 62
Figure 32. Number of times leaders and teachers visited ‘Educate Against Hate’ website
......................................................................................................................................... 64
Figure 33. Ways leaders and teachers first heard about the ‘Educate Against Hate’
website ............................................................................................................................. 65
Figure 34. Ways leaders and teachers think the 'Educate Against Hate' website has
helped .............................................................................................................................. 66
Figure 35. Extra-curricular activities offered at school ..................................................... 67
Figure 36. Hours of extra-curricular activity provided per week ....................................... 68
Figure 37. Changes to the opportunities for pupils to do physical activities as part of the
curriculum and as part of extra-curricular activities .......................................................... 70

5
Figure 38. School has a designated lead for pupils' mental health .................................. 71
Figure 39. Reasons for not having a designated mental health lead ............................... 72
Figure 40. Actions taken by schools to monitor pupil wellbeing ....................................... 73
Figure 41. Frequency of teaching PSHE and teachers’ confidence in teaching PSHE .... 74
Figure 42. Modes of delivery for PSHE ............................................................................ 75
Figure 43. Proportion of primary and secondary teachers that teach about relationships
and sex education. ........................................................................................................... 76
Figure 44. Confidence of primary and secondary teachers that teach relationships and
sex education teachers .................................................................................................... 77
Figure 45. Modes of delivery for relationships and sex education ................................... 78
Figure 46. Undertaken review of SEND provision in last 12 months ................................ 79
Figure 47. Method of the SEND Provision review used in primary and secondary schools
in Winter 2018 .................................................................................................................. 80
Figure 48. Extent primary and secondary schools understands how to implement the new
FSM criteria under Universal Credit? ............................................................................... 81
Figure 49. Ways primary schools use pupil premium to support disadvantaged pupils by
proportion of FSM pupils at their school .......................................................................... 84
Figure 50. Ways secondary schools use pupil premium to support disadvantaged pupils
by proportion of FSM pupils at their school ...................................................................... 85

6
Executive Summary
This report covers the Winter 2018 findings from the third wave of the School Snapshot
Survey. A total of 836 surveys were conducted with school leaders and 1,010 surveys
with teachers. In this report leaders includes staff that are headteachers, deputy
headteachers, assistant headteachers and acting headteachers. The term teachers
refers to classroom teachers only. Where results are analysed by both groups this is
noted by reference to leaders and teachers. The survey covers a range of educational
topics.
Curriculum
Leaders and teachers were asked to provide their perspective on a range of policy areas
relating to the curriculum, including the advanced maths premium, reformed GCSEs,
hiring Modern Foreign Languages (MFL) teachers and the use of educational technology
in MFL, curriculum implementation, the English Baccalaureate (EBacc), on-entry
assessment and phonics.
Advanced Maths Premium
The advanced maths premium was introduced by the DfE to support secondary schools
and colleges in raising participation in advanced post-16 maths. The Education and Skills
Funding Agency (ESFA) are providing funding to schools from academic year 2019/2020
to academic year 2021/2022. The funding will help schools build capacity in teaching
maths and in promoting the value of maths to pupils. Eighty percent of schools planned
to undertake at least one action using the premium (on average they planned to
undertake 3 actions). Schools were planning to use the advanced maths premium
funding to support a range of activities including:
Promotional activities to raise participation (60%);
Increasing resources (51% were planning to secure additional teaching
resource/equipment and 32% were planning additional teachers);
Widening the offer (47% were planning additional classes and 39% were looking to
increase the number of Level 3 qualifications on offer).
GSCE reform
The Government has recently reformed GCSEs. The new English literature, English
language and mathematics GCSEs formed the first wave of changes, introduced for
teaching from September 2015. The first results for these new GCSEs were awarded in
August 2017. Further waves of reformed GCSEs were first taught in 2016, 2017 and
2018.

7
English and maths teachers were asked how confident they felt in teaching the reformed
GCSEs; 85% of maths teachers felt ‘very’ or ‘quite’ confident, but one in ten (10%) stated
that they were ‘not very’ or ‘not at all’ confident. A similar proportion of English teachers
said the same about English literature and language: 77% were confident and 11% were
not.
Modern foreign languages
Secondary MFL teachers were asked how often they use educational technology in
teaching MFL. Here, ‘educational technology’ included interactive or static resources,
such as websites, apps, Powerpoint presentations or printed online resources.
The vast majority (84%) of teachers said they used educational technology in ‘most’, if
not ‘every’, lesson. Only 3% said educational technology was ‘hardly’ or ‘never’ used.
Secondary schools were asked if they planned to increase the number of MFL teachers
employed at their school in the next five years. One third (32%) planned to increase
teacher numbers, but 61% had no plans for an increase.
Curriculum implementation
As in the Winter 2017 survey, schools were asked whether they had participated in, or
accessed support from a set of national support programmes within the last 12 months.
Of the 4 programmes asked about, schools had most commonly participated in Maths
hubs (62%), followed by The Lessons from Auschwitz Project (45%), Music Education
hubs (34%) and finally Science Learning Partnerships (23%).
Significantly more schools in Winter 2018 said they had participated in Math Hubs
compared to a year ago (62% vs 56%). There were no significant differences between
the years for the other three programmes.
Compared with secondary schools, primary schools remained significantly more likely to
use Maths Hubs (65% primary vs. 53% secondary) and Music Education Hubs (36%
primary vs. 27% secondary) in the Winter 2018 survey. However, the gap between
primary and secondary school use of the hubs has narrowed since the Winter 2017
survey.
EBacc
The EBacc entry measure is the proportion of Key Stage 4 (KS4) pupils entering GCSEs
in a set of EBacc eligible subjects that are English language and literature, mathematics,
history or geography, the sciences (including computer science) and a language.
Schools estimated that in the academic year 2018/19 46% of their KS4 pupils would be
entered into the EBacc and that this figure would be 48% in 2019/20.

8
Looking forward to 2020/21, seven in ten (69%) schools thought the proportion entered
into the EBacc would remain about the same, two in ten (23%) schools said there would
be an increase and one in ten (8%) thought there would be a decrease. When comparing
school leader estimates of EBacc entry rates between different survey waves,
estimations from school leaders have remained fairly consistent over time.
On-entry assessment
On-entry assessment provides a snapshot of pupils’ ability when they first start school in
reception. Overall, nine in ten primary schools (91%) reported conducting on-entry
assessments for their reception pupils.
Phonics
Fully decodable books contain only words that are decodable through sounding out and
blending the letter combinations that pupils have previously learned. In other words, they
do not contain ‘sight’ or ‘tricky’ words that pupils cannot decode using their phonic
knowledge. A fully decodable book is therefore one that pupils can independently read to
build confidence in their early stages of learning to read.
Primary schools were asked if pupils read from decodable books in the early stages of
learning to read. The vast majority (95%) reported that decodable books were being used
by pupils.
Primary teachers were asked how often they read to their class on average. Just over
two-thirds (68%) stated that they read to their class at least once a day (increasing to
87% of those teaching Early Years).

9
Resources, teacher workload and careers
In the survey, leaders and teachers were asked for their views and experiences in a
number of areas relating to resources, workload and career development. This included:
the types of resources used by teachers; actions undertaken by schools to reduce
unnecessary workload and their impact; careers development and opportunities;
awareness of the provider access policy statement; promotion of STEM careers;
Continuing Professional Development (CPD); and policies on mobile phones.
Primary teachers were asked which resource types they used in science and humanities
lessons to explore potential differences in the use of resources across the curriculum.
Resources in the classroom
Resource types used by the majority of teachers in ‘at least some of their lessons’
included those that were:
‘developed themselves from scratch’ (used by 96% of teachers in at least some
lessons);
‘developed within their school from scratch’ (72%);
‘accessed online at no cost’ (71%);
‘accessed via a subscription service’ (65%).
Teachers less commonly used resources that were ‘accessed via a one-off payment’ and
those ‘developed and shared by another school’ (27% and 29% respectively).
The frequency of use of different resource types varied between primary and secondary
teachers. Secondary teachers were significantly more likely than primary teachers to use
resources ‘developed themselves from scratch’ (71% vs. 59%) and resources ‘developed
within their school from scratch’ (42% vs. 21%) in most or every lesson. By contrast,
primary teachers were more than twice as likely to use resources ‘accessed via a
subscription service’ as secondary teachers (31% vs. 14%).
All primary teachers were asked about the types of resources they use in their science
and humanities classes. When teaching science, close to two-thirds (63%) of primary
teachers used static digital resources in most or every lesson which is significantly more
than those that used interactive educational technology (27%), physical textbooks (1%)
and e-books (1%). When teaching science, close to three quarters (71%) of primary
school teachers stated that they never used physical textbooks and more than half (57%)
never used e-books.
A similar pattern occurs when considering resources used by primary teachers when
teaching humanities. The most commonly used resource is static digital resources, with
87% of primary teachers using static digital resources in most or every lesson. Textbooks
were the second most commonly used resource and were used in most or all lessons by
10
around one in five teachers (18%). A similar proportion used interactive educational
technology (14% in most/all lessons) and e-books were least commonly used resource
(6%).
All teachers in secondary schools were asked how often in the last 12 months they had
used the same types of resources.
Static digital resources were the most commonly used resource by far, with 87% of
secondary teachers using them for the majority, if not all, of their lessons. In comparison,
textbooks were the second most commonly used resource and were used in most or all
lessons by around one in five secondary teachers (18%). A similar proportion used
interactive educational technology (14% in most/all lessons) and e-books were least
commonly used (6%).
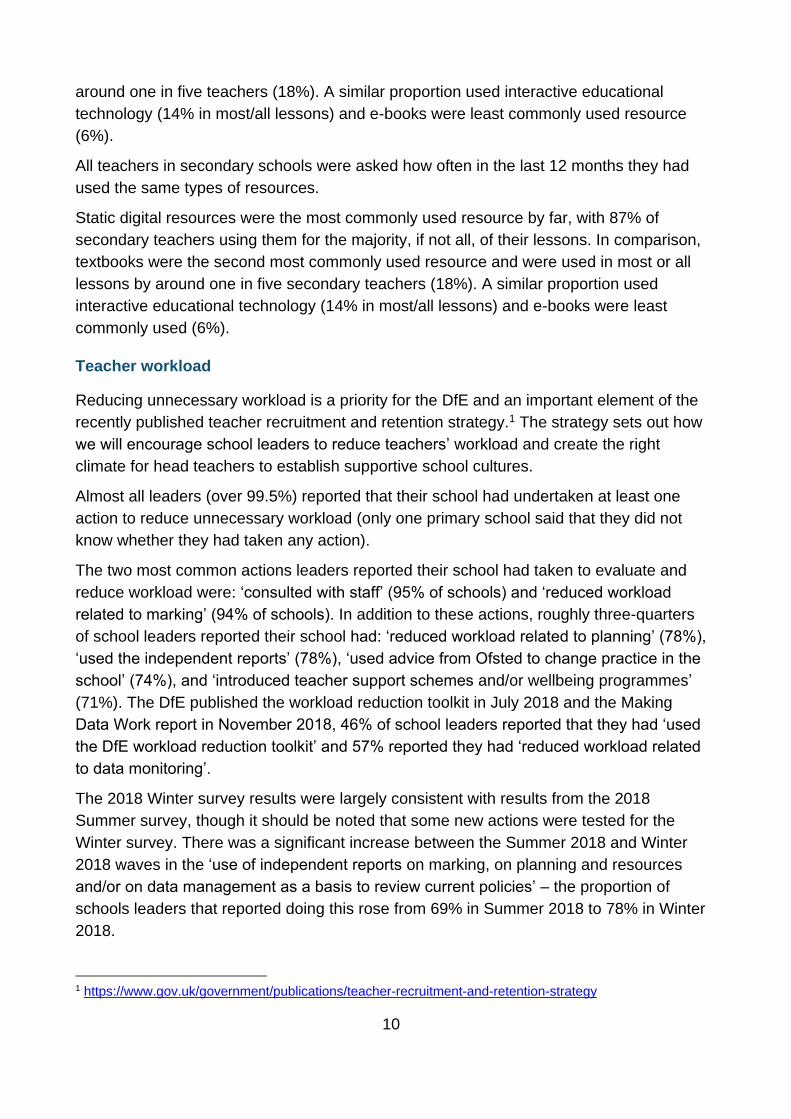
Teacher workload
Reducing unnecessary workload is a priority for the DfE and an important element of the
recently published teacher recruitment and retention strategy.1 The strategy sets out how
we will encourage school leaders to reduce teachers’ workload and create the right
climate for head teachers to establish supportive school cultures.
Almost all leaders (over 99.5%) reported that their school had undertaken at least one
action to reduce unnecessary workload (only one primary school said that they did not
know whether they had taken any action).
The two most common actions leaders reported their school had taken to evaluate and
reduce workload were: ‘consulted with staff’ (95% of schools) and ‘reduced workload
related to marking’ (94% of schools). In addition to these actions, roughly three-quarters
of school leaders reported their school had: ‘reduced workload related to planning’ (78%),
‘used the independent reports’ (78%), ‘used advice from Ofsted to change practice in the
school’ (74%), and ‘introduced teacher support schemes and/or wellbeing programmes’
(71%). The DfE published the workload reduction toolkit in July 2018 and the Making
Data Work report in November 2018, 46% of school leaders reported that they had ‘used
the DfE workload reduction toolkit’ and 57% reported they had ‘reduced workload related
to data monitoring’.
The 2018 Winter survey results were largely consistent with results from the 2018
Summer survey, though it should be noted that some new actions were tested for the
Winter survey. There was a significant increase between the Summer 2018 and Winter
2018 waves in the ‘use of independent reports on marking, on planning and resources
and/or on data management as a basis to review current policies’ – the proportion of
schools leaders that reported doing this rose from 69% in Summer 2018 to 78% in Winter
2018.
1 https://www.gov.uk/government/publications/teacher-recruitment-and-retention-strategy

11
Careers advice for pupils
Every school in England is required to offer independent careers guidance on the full
range of education and training options, including apprenticeships, to their pupils.
According to the updated October 2018 statutory guidance for governing bodies, schools
must, amongst other obligations, do the following:2
Ensure there are opportunities for a range of education and training
providers to access all pupils in year 8 to year 13 to inform them about
approved technical education qualifications and apprenticeships.
Publish a policy statement outlining their arrangements for provider access
and ensure that it is followed.3
Adopt the Gatsby Benchmarks to improve careers provision. This includes
linking curriculum learning with careers; particularly in STEM subjects.
All secondary schools were asked whether visits had been arranged in the last 12
months from the following technical education providers: a studio school, a University
Technical College (UTC), an apprenticeship provider or a Further Education college.
The majority of secondary schools (95%) had arranged a visit from at least one technical
education provider during the past 12 months, with only a small proportion of schools
(5%) having not arranged a visit from any provider. Secondary schools had most
commonly arranged a visit from apprenticeship providers (90%) followed by a visit from
an FE college (81%).
Close to three quarters (73%) of secondary schools had published a provider access
statement on their website or were planning to.
Subjects in which STEM careers are most commonly promoted are the ‘science
curriculum’ (99% of secondary schools), maths (94%) and design & technology (93%).
The most common ways of promoting STEM careers outside of the curriculum were
through ‘STEM clubs, societies and weeks’ (24%) and through ‘links with employers
(talks, visits, work experience etc.) at 23%.
Continuing professional development
A range of CPD types were presented to school leaders and teachers, and both groups
were asked whether they had accessed these in the last 12 months. It is worth noting
that they were only asked about the types of CPD that they had accessed and not about
the number of occasions on which they had accessed CPD (and some may have
classified one incidence of CPD as more than one ‘type’).
2 https://assets.publishing.service.gov.uk/government/uploads/system/uploads/attachment_data/file/748474/181008_schools_statutory_guidance_final.pdf 3 http://researchbriefings.files.parliament.uk/documents/CBP-7236/CBP-7236.pdf

12
Almost all school leaders (over 99.5%) and teachers (99%) had accessed at least one
type of CPD. School leaders were significantly more likely than teachers to have
accessed all types of CPD, but the types of CPD that were most commonly accessed in
the last 12 months were largely the same for leaders and teachers.
The two CPD types accessed by the majority of leaders and teachers were ‘CPD
delivered by their own school’ (93%) and ‘non-accredited course delivered by an external
provider or consultant’ (71%).
Just under half of leaders and teachers had accessed ‘coaching/mentoring’ and ‘CPD
provided by wider Multi-Academy Trust/Teaching School Alliance’ (46% and 45%
respectively). A quarter of leaders (25%) had received formally accredited CPD, yet only
18% of teachers had. Only around one in five leaders and teachers had accessed
‘system leader support’ (19%) and ‘formally accredited CPD’ (19%) opportunities during
the last 12 months.
Mobile phones
Schools were also asked about their policies around pupil use of mobile phones on
school premises.
The most common mobile phone policy among primary schools was to allow phones but
insist that they are left in a particular place during the school day (65%). In comparison
the most common policy among secondary schools was to allow pupils to carry phones
but not to use them at all during the school day (46%).
Primary schools were also significantly more likely than secondary schools to ban
phones on school premises altogether (28% vs. 8%), while secondary schools were
significantly more likely than primary schools to allow pupils to carry phones with them
and to use them at specified points during the school day (29% vs. 1%).

13
Support for pupils
Educate Against Hate
In 2016, the Department launched the ‘Educate Against Hate’ website, which aims to
provide practical advice, support and resources to teachers and school leaders to
safeguard pupils from extremism and radicalisation.
Overall, a similar proportion of around two fifths of leaders and teachers (43%) were
aware of the ‘Educate Against Hate’ website in the Winter 2018 Survey as they were the
Winter 2017 Survey (43%). However, in Winter 2018, leaders and teachers were
significantly more likely to have visited the website once (30% in Winter 2017 vs. 38% in
Winter 2018). Those using the website felt it had a number of uses. Eighty-five percent
of leaders and teachers thought it helped them to understand how to raise a concern.
82% also thought it helped them to spot the signs of radicalisation in children, and 79%
thought it helped them to promote fundamental British values like respect and tolerance
of those with different faiths.
Extra-curricular activity
Almost all schools offered some form of sports extra-curricular activity (100% of primary
schools and 99% of secondary schools) and almost all offered some form of
arts/drama/dance activity (94% of primary schools and 97% of secondary schools).
Nearly all secondary schools offered music (96%), academic clubs (94%) and
technology/digital related extra-curricular activities (91%); however, these were a little
less common at primary schools (85% offered music, 67% academic related clubs and
61% technology/digital related activities). Three-quarters (74%) of secondary schools
offered volunteering and debating (compared to only one in five primary schools (23%)).
In terms of hours of provision delivered per week, schools provided:
Sports activities (just over 11 hours in secondary schools and 5½ hours in primary
schools)
Arts/drama/dance (just over 6 hours in secondary schools and almost 3 hours in
primary schools)
Music (around 5 hours in secondary schools and 2 hours in primary schools)
Academic clubs (around 8½ hours in secondary schools and 2 hours in primary
schools)
Mental health
In recent years the Government has made significant steps to improve mental health
support in schools. The Government’s December 2017 green paper (Transforming

14
Children and Young People’s Mental Health Provision)4 outlined proposals to improve
mental health support, with a commitment to incentivising every school and college to
identify a Designated Senior Lead for Mental Health to oversee the approach to mental
health and wellbeing.
In Winter 2017, seven in ten (70%) schools had a designated lead for mental health. By
Winter 2018 this had increased significantly to more than eight in ten schools (82%). This
overall increase is largely a result of the significant increase in the proportion of primary
schools that have a mental health lead between Winter 2017 and Winter 2018 (67% vs.
81% respectively).
Wellbeing
Schools were asked about the actions they take to monitor pupil wellbeing. All schools
indicated that they monitor wellbeing through one to one discussions with pupils (100%)
and parents (100%). The vast majority also use observation (98% primary and 93%
secondary), insights from pastoral or specialist staff (e.g. mentors or counsellors) (94%
primary and 99% secondary), feedback from pupils (e.g. through a student council) (94%
primary and 97% secondary) and surveys of pupils (86% primary and 92% secondary).
PSHE
Two-thirds (63%) of teachers teaching Key Stages 1 to 5 taught PSHE. Almost nine in
ten of these teachers (89%) said they felt fairly confident (58%) or very confident (31%)
teaching PSHE.
Schools leaders were asked how their school currently delivers PSHE. The most
common mode of delivery was through assemblies and form periods (99% for primary
schools and 98% for secondary schools). Primary schools were significantly more likely
than secondary schools to deliver PSHE through the core curriculum within classroom
time (99% vs. 87%). Secondary schools were significantly more likely to use drop down
days (66% vs. 59%) and extra-curricular activities to deliver PSHE (68% vs. 46%).
Relationships and sex education
All primary and secondary teachers were asked whether they teach relationships and/or
sex education. More than half (56%) of primary teachers deliver one or both of these
subjects, much higher than the third of secondary teachers (39%) that teach relationships
or sex education.
Those that taught about relationships were slightly but significantly more confident in
doing so than those that taught sex education (87% vs. 80%). Primary school teachers
4 https://www.gov.uk/government/consultations/transforming-children-and-young-peoples-mental-health-provision-a-green-paper

15
were more confident in teaching about either relationships or sex than secondary
teachers.
Special Educational Needs and Disability (SEND)
A SEND review considers how a school is providing for its pupils with special educational
needs and/or disabilities. The purpose of a SEND review is to improve SEND provision
and strategy to ensure pupils with SEND are effectively supported and able to achieve
good outcomes5.
Significantly more schools had reviewed their SEND provision in the last 12 months in
the Winter 2018 Survey than was the case in the Winter 2017 Survey (81% in 2017 vs.
85% in 2018). This growth is largely the result of the significant increase in secondary
schools that reviewed their SEND provision in this time period (75% vs. 83%).
Free School Meals
The vast majority of primary (88%) and secondary (80%) schools said they understood
how to implement the new free school meals eligibility criteria under Universal Credit very
or fairly well. Primary schools were significantly more likely to believe that they know how
to do this ‘very well’ (47% primary vs. 30% secondary).
Pupil premium
Schools were asked how they used their pupil premium to support disadvantaged pupils.
Subsiding school trips or other enrichment/developmental activities, including extra-
curricular clubs such as swimming or music was the most common way to support
disadvantaged pupils in both primary (98%) and secondary (98%) schools. Secondary
schools were significantly more likely to use nearly all approaches to assisting
disadvantaged pupils, apart from employing additional teaching assistants, which primary
schools were significantly more likely to do (90% primary, 73% secondary).
5 This is the definition provided in the survey if respondents needed it.

16
School Snapshot Survey: Winter 2018 findings infographic
1. Curriculum
60%Promotional
activities
51%Resources/equipment
Additional classes
47%
Secondary schools planned to use the advanced maths premium in a variety of ways:
85%
Confidence in teaching reformed GCSEs felt among teachers of those subjects
Maths
77%English lit. &
language
84% Of secondary MFL teachers
used educational technology in MFL lessons
89% in whole class activities
75% for homework
72% lessonplanning
32% of secondary schools said they would increase
MFL teacher numbers in the next 5 years. This increase will take place:
Current
academic
year
In 1-2
academic
years
In 3-5
academic
years
16% 80% 59%
1. Curriculum cont.
45%
Schools said they had participated in a range of DfE funded-programmes:
62%
48% of pupils entering Key Stage 4 in September
2019/20 are estimated to be eligible for the Ebacc entry measure.
Maths Hubs Lessons from
Auschwitz
23%Science Learning
Partnerships
34%Music Education
Hubs
The majority of schools thought the proportion entering EBacc would stay the same for 2020/21.
23% 8%69%Increase Stay the
same
Decrease
91% of schools reported using on-
entry assessments for their reception pupils.
95% of primary schools use decodable
books in the early stages of learning to read.
68% of primary school teachers said they read to
their class at least once a day.
24% of primary school teachers said they read to
their class at least every other day.
7% of primary school teachers said they read to
their class less than 3 times a week.

17
2. Resources, teacher workload & careers
Resources that are ‘developed themselves from
scratch’ were used by:
96% of all classroom teachers in at least some lessons.
82% of English teachers in most/all of their lessons.
49% of Maths teachers in most/all of their lessons.
Resources that are ‘accessed via a subscription
service’ were used by:
29% of Maths teachers in most/all of their lessons.
22% of Science teachers in most/all of their lessons.
4% of English teachers in most/all of their lessons.
95% of secondary schools had
arranged a visit from at least one
technical education provider in the
past 12 months.
88% of secondary schools that
said they were aware of the new
requirement to allow apprenticeship
and technical education providers
access to students.
73% of secondary schools have
put a provider access statement on
their website or are planning to
2. Resources, teacher workload & careers cont.CPD types accessed by most teachers include:
CPD delivered by
own school
Non-accredited
course delivered by
an external provider
or consultant
93% 71%
Primary and secondary schools adopt different policies
for dealing with mobile phones.
Allow phones but insist they are left in a particular place during the school day
65% 16%
Allow pupils to carry phones but not to use them at all during the school day1% 46%
Primary Secondary
Most common actions school leaders reported their
school had taken to evaluate and reduce workload
were:
Consulted with staff:
Reduced workload
related to marking:
95%
94%
33% of
leaders said
actions taken had
made their own
weekly workload more manageable
61% of
classroom teachers
said actions taken
had made their own
weekly workload more manageable
Of those aware that their school had taken action to
reduce unnecessary workload:

18
3. Support for students
Awareness of the ‘Educate against
Hate’ website increased among leaders,
from 40% in 2017 to 60% in 2018.
For both primary and secondary schools, the three most
commonly offered extra-curricular activities were:
P: 100%S: 99%
Sports
P: 95%S: 97%
Arts, drama, dance
P: 85%S: 95%
Music
The average number of hours of extra-curricular sport
provided was:
Primary
5 hours 35 mins
Seconday
11 hours 20 mins
The proportion of state-funded schools with
a designated mental health lead increased
from 70% in 2017 to 82% in 2018.
All schools monitor pupil wellbeing
through one-to-one discussions with
pupils 100% and parents 100%.
Awareness of the website differed among leaders
and teachers:
Leaders:
59%
Teachers:
40%
Key: P = Primary schools; S = Secondary schools
3.Support for students cont.
63% of teachers of Key Stage 1 to 5
pupils teach PSHE
89% said they were confident doing so
Primary school teachers were significantly more likely
to teach relationships and sex education:
P: 56% S: 33%
It was most common to deliver relationships and
sex education through the core curriculum within
classroom time.
Primary
schools
Secondary
schools
98% 91%
The proportion of schools that reviewed
their SEND provision in the last 12
months increased from:
81% in 2017 to 85% in 2018.
Most schools felt they understand how to implement
the new Free School Meals eligibility criteria, under
Universal Credit.
88% of primary schools
80% of secondary schools
The most common way to use pupil premium to
support disadvantaged students was by subsidising
school trips or other enrichment/developmental
activities e.g. swimming or music.
P: 98% S: 98%

19
Background
This report covers the Winter 2018 findings of the third wave of the School Snapshot
Survey. Since Winter 2017, this survey been conducted bi-annually to better understand
the opinions of leaders and teachers in primary and secondary schools on a range of
educational topics.
Methodology
A sample of 1,600 schools was drawn from the Department’s database of schools, ‘Get
Information about Schools’ and these schools were invited to take part in both the school
and teacher components of the School Snapshot Survey. A further 300 schools were
selected just to take part in the teacher component.
At each school, one leader was surveyed (predominantly via a telephone methodology)
and up to three teachers were surveyed (using a combination of online and telephone
interviewing). A total of 836 surveys were conducted with school leaders and 1,010
surveys with teachers. This was split by primary and secondary schools as shown in
Table 1. Of the leaders, most were headteachers (69%) and just less than one in five
were deputy headteachers (19%) (see the appendices for more detail).
Table 1. Completed surveys by teacher level and school type
Leaders Teachers
Primary Secondary Primary Secondary
Completed surveys 426 410 533 477
Fieldwork took place between 29 October – 21 December 2018.
Interpreting the findings
Data presented in this report are from a sample of teachers and senior leaders rather
than the total populations of teachers and leaders. Although the leader sample and the
teacher sample have been weighted to be nationally representative (by school and by
teacher demographics), the data is still subject to sampling error. Differences between
sub-groups and previous waves are only commented on in the text if they are statistically
significant at the 95 percent confidence level, unless otherwise stated. This means there
is no more than a 5 per cent chance that any reported differences are a consequence of
sampling error.

20
Depending on the question, responses from school leaders have been weighted to
represent the school view or to represent their individual view as a senior teacher (see
the Technical Report for more details on the weighting). The report attempts to make this
distinction clear by referring to responses from schools when the school-based weighting
has been applied, and referring to leader responses when the teacher-based weighting
(which utilises individual demographic details) has been applied.
Free School Meal (FSM) entitlement is used as a proxy for deprivation levels at the
school. All schools were put into a list of ascending order of the proportion of pupils that
they have that are entitled to FSM. This ordered list was then split into five equal groups
(or quintiles). Quintile 1, which is referred to as the ‘lowest proportion’ throughout the
report represents the fifth of schools with the lowest proportion of pupils entitled to FSM.
The proportion of pupils entitled to FSM increases progressively as the quintiles increase.
Schools in the ‘highest proportion’ quintile (quintile 5), represent the fifth of schools with
the highest proportion of pupils entitled to FSM. Significant differences tend to be tested
between schools with the lowest proportion of FSM pupils and schools with the highest
proportion of FSM pupils.
Due to rounding to the nearest whole number, percentages may not total to exactly 100%
or precisely reflect statistics provided in the data tables. For further information on the
overall study methodology and weighting approach, please see the Technical Report.
The Department is looking to track changes in leaders and teachers’ opinions of various
topics over time and consequently some of the questions included in the School
Snapshot Survey repeat those asked in the Teacher Voice Omnibus.6 Participants for the
Teacher Voice Omnibus were contacted from the NFER Teacher Voice Panel of
practising leaders and teachers, whereas the School Snapshot Survey utilises a random
sampling approach to selecting schools. This difference in sampling methodology means
that caution should be taken if comparing results from questions that appear across the
two surveys – there are no direct comparisons made in this report, but previous Teacher
Voice Omnibus reports can be found alongside School Snapshot Survey reports on the
gov.uk website.7 As the Winter 2018 Survey is the third wave of the School Snapshot
Survey, for some questions we have been able to compare the current results with
responses collected from the Winter 2017 or Summer 2018 waves of the School
Snapshot Survey8. These ‘within School Snapshot’ comparisons can be done with
relative confidence as the same random sampling methodology has been used for
selecting schools.
6 https://www.gov.uk/government/publications/teacher-voice-omnibus-march-2018-survey 7 https://www.gov.uk/government/collections/nfer-teacher-voice-omnibus 8 https://www.gov.uk/government/collections/nfer-teacher-voice-omnibus
21
1. Curriculum
This chapter explores schools’ and teachers’ perspectives on a range of policy areas
relating to the curriculum, including the advanced maths premium, the reformed GCSEs,
hiring Modern Foreign Languages (MFL) teachers and the use of educational technology
in MFL, curriculum implementation, English Baccalaureate (EBacc), on-entry assessment
and phonics.
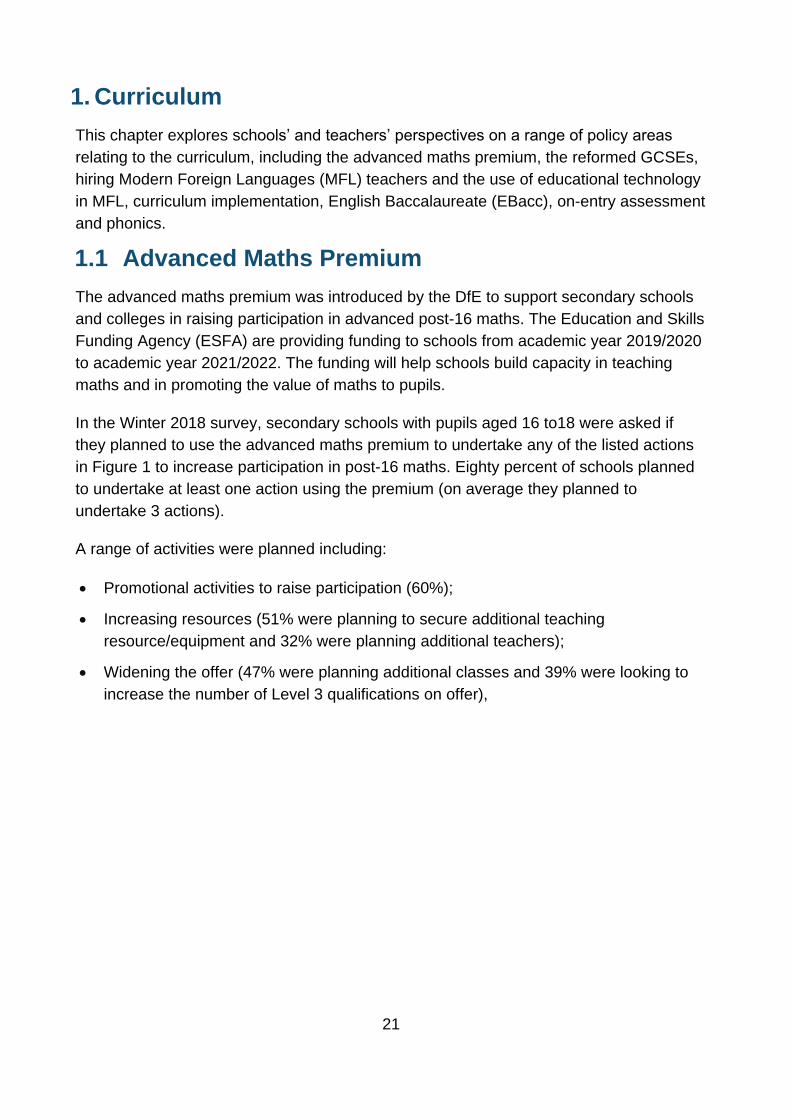
1.1 Advanced Maths Premium
The advanced maths premium was introduced by the DfE to support secondary schools
and colleges in raising participation in advanced post-16 maths. The Education and Skills
Funding Agency (ESFA) are providing funding to schools from academic year 2019/2020
to academic year 2021/2022. The funding will help schools build capacity in teaching
maths and in promoting the value of maths to pupils.
In the Winter 2018 survey, secondary schools with pupils aged 16 to18 were asked if
they planned to use the advanced maths premium to undertake any of the listed actions
in Figure 1 to increase participation in post-16 maths. Eighty percent of schools planned
to undertake at least one action using the premium (on average they planned to
undertake 3 actions).
A range of activities were planned including:
Promotional activities to raise participation (60%);
Increasing resources (51% were planning to secure additional teaching
resource/equipment and 32% were planning additional teachers);
Widening the offer (47% were planning additional classes and 39% were looking to
increase the number of Level 3 qualifications on offer),

22
Figure 1. Actions used (if any) to increase participation in post-16 maths
Question: F1. Do you plan to use the advanced maths premium to take any of the following actions to increase participation in post-16 maths?
Base: All secondary schools with students aged 16-18 years (n=225).
60%
51%
47%
39%
32%
9%
16%
5%
Promotional activities to raiseparticipation
Securing extra teachingresources/equipment
Providing additional classes
Widening the no. of L3qualifications on offer
Providing additional teachers
Other
Do not plan to use it to increaseparticipation in post-16 maths
Don't know

23
1.2 GCSE Reform
The Government has been introducing reformed GCSEs since September 2015, in a
series of waves. The new English literature, English language and mathematics GCSEs
formed the first wave. The first results for these new GCSEs were awarded in August
2017.
English and maths teachers were asked how confident they felt in teaching the reformed
GCSEs. As Figure 2 below shows, 85% of maths teachers felt ‘very’ or ‘quite’ confident,
but one in ten (10%) stated that they were ‘not very’ or ‘not at all’ confident. A similar
proportion of English teachers said the same about English literature and language: 77%
were confident and 11% were not.
Figure 2. Confidence in teaching reformed English and maths GCSEs
Small base sizes prevent subgroup analysis and may be the reason why no significant
differences in teachers’ confidence were found between the two subjects.
49%
60%
29%
25%
5%
4%
6%
6%
5%
4%
7%
1%
Englishlang. & lit.
Maths
Very Quite Neither/nor Not very Not at all Don't know
85% Confident 10% Not confident
77% Confident 11% Not confident
Question: F3. How confident do you feel in teaching the reformed GCSEs in English language and literature taught from 2015?
Base: All secondary teachers who teach English (n=61).
Question: F4. How confident do you feel in teaching the reformed GCSEs in maths taught from 2015?
Base: All secondary teachers who teach Maths (n=71).

24
1.3 Modern Foreign Languages
Educational technology in Modern Foreign Languages
With the recent reforms, a greater focus is being placed on the improvement in teaching
Modern Foreign Languages (MFL). Educational technology has the potential to form a
key role in this as it offers the opportunity to engage pupils, tailor learning, and bring the
subjects to life in school.
Secondary MFL teachers were asked how often they use educational technology in
teaching MFL. Here, ‘educational technology’ included interactive or static resources,
such as websites, apps, Powerpoint presentations or printed online resources.
The vast majority (84%) of MFL teachers said they used educational technology in ‘most’,
if not ‘every’, lesson. Only 3% said educational technology was ‘hardly’ or ‘never’ used.
Nine in ten MFL teachers that used this technology (who did not state that they never
used it), reported that it was used for whole class activities. Around three-quarters
reported using it for homework activities or lesson planning (75% or 72% respectively).
Figure 3 shows the full breakdown of how MFL teachers use educational technology.
Figure 3. The frequency and purpose of using educational technology in MFL
1% 3% 10% 29% 55%
Never Hardly at all Some lessons Most lessons Every lesson
84% Most/every3% Never/hardly
Question: F5. How often do you use educational technology in teaching Modern Foreign Languages (MFL)?
Base: All secondary teachers who teach MFL (n=143). Don’t know responses not displayed (3%)
Question: F6. If you do use educational technology, which of the following categories describe the purpose you use them for?
Base: All secondary MFL teachers who use educational technology (n=139).
Frequency of using educational technology in MFL
Purpose of using educational technology
Whole class
activities
Homework
activities
Lesson
planning
Individual
activities
Marking Other
89% 75% 72% 63% 26% 5%

25
Hiring teachers in Modern Foreign Languages
Secondary schools were asked if they planned to increase the number of MFL teachers
employed at their school in the next five years. One third (32%) planned to increase
teacher numbers, but 61% had no plans for an increase. Seven percent were unsure of
whether they will increase numbers of MFL teachers.
The schools with the highest proportion of pupils on Free School Meals were significantly
more likely to be planning an increase in MFL teachers than those with lowest proportion
(40% vs 22% respectively).
Of those schools that were planning an increase in MFL teachers, four-fifths stated that
numbers would increase in the next 1-2 academic years (80%), three-fifths in the next 3-
5 years (59%) and just under one fifth (16%) during the current academic year. Two
percent did not know when the increase would happen.
1.4 Curriculum implementation
There are a range of national support programmes that have been funded by the
Department for Education. Some of these programmes include:
‘The Maths Hubs programme, which brings together mathematics
education professionals in a collaborative national network of 35 hubs, each
locally led by a lead school or college, to develop and spread excellent
practice, for the benefit of all pupils and pupils.9
Music Education Hubs, which are groups of organisations such as local
authorities, schools, art organisations, community or voluntary
organisations. They work together to create joined-up music education
provision, respond to local need and fulfil the objectives of the hub.10
Science Learning Partnerships, which combine local expertise in teaching
and learning in science, facilitating CPD, and providing school-to-school
support. They are led by local teaching school alliances, schools and
colleges with excellence in science, higher education institutions, and other
local partners with cutting-edge expertise in science.11
The Lessons From Auschwitz Project which is run by the Holocaust
Educational Trust and aims to increase knowledge and understanding of
the Holocaust for A Level pupils and to clearly highlight what can happen if
9 http://www.mathshubs.org.uk/ 10 http://www.artscouncil.org.uk/music-education/music-education-hubs 11 https://www.stem.org.uk/science-learning-partnerships

26
prejudice and racism become acceptable. It is run with secondary schools
only. 12
As in the Winter 2017 survey13, schools were asked whether they had participated in, or
accessed support from any of the four national support programmes mentioned above
within the last 12 months. Maths hubs remain the most commonly used (62%), followed
by The Lessons from Auschwitz Project (45%), Music Education hubs (34%) and finally
Science Learning Partnerships (23%). Over the same time period, there was also a
significant increase in the proportion of schools that had participated in Math Hubs, with
participation rising by 6 percentage points between Winter 2017 and Winter 2018 (56%
vs 62%). As Figure 4 shows, there were no significant differences between years for the
other three programmes.
Figure 4. The proportion of schools that have participated in DfE funded programmes
As shown in Figure 5, in the Winter 2017 survey, there was a difference in response
depending on school level: primary schools were significantly more likely to have
participated in Maths Hubs (59%) and Music Education Hubs (33%) compared to
secondary schools (45% and 20% respectively). In the Winter 2018 survey, there were
still significant differences in use of Maths Hubs and Music Education Hubs by phase but
the gap between primary and secondary schools had narrowed. A significantly higher
12 https://www.het.org.uk/lessons-from-auschwitz-programme 13 The Winter 2017 School Snapshot report describes the responses of leaders and teachers. This has been rebased at this wave to describe the school-wide view.
20%
31%
42%
56%
23%
34%
45%
62%*
1
2
3
4
Winter 2018
Winter 2017
Question: 2017: D1, 2018: F7. In the last twelve months, has your school participated in, or accessed support from,
any of the following national support programmes funded by the DfE?
Base: 2017, 2018: All schools (n=800, n=836). Lessons from Auschwitz based on secondary schools only.
*Indicates statistically significant differences between level and school type subgroups within the Winter 2018 survey.
Maths hubs
Science
Learning Partnerships
Lessons
from Auschwitz
Music
Education hubs

27
proportion of secondary schools participated in Maths Hubs (53%) and Music Education
Hubs (27%) compared to the year before.
Figure 5. Proportion of schools that have participated in Maths and Music Education Hubs, by
phase (primary, secondary) and year
In Winter 2018, a significantly larger proportion of secondary schools reported
participation in Science Learning Partnerships (38%), compared to primary schools
(20%). There were no significant differences between these 2018 responses and those in
Winter 2017 (33% secondary and 17% primary).
With the exception of The Lessons From Auschwitz project (for which there were low
base sizes), there was some variance in participation in the programmes by region:
Maths Hubs: Schools from the East Midlands showed the greatest level of
participation (77%), significantly greater than several other regions. The lowest
participation was recorded in the East of England (42%) and London (52%).
Music Education Hubs: Schools from the South West showed the greatest level of
participation (52%), again this was significantly greater than several other regions.
In comparison, only a fifth of schools in Yorkshire and the Humber (19%) and the
West Midlands (20%) had participated.
64%*59%*
36%*33%*
53%
45%
27%
20%
Winter 2018
Winter 2017
SecondaryPrimary SecondaryPrimary SecondaryPrimary SecondaryPrimary
Question: 2017: D1, 2018: F7. In the last twelve months, has your school participated in, or accessed support from,
any of the following national support programmes funded by the DfE?
Base: 2017, 2018: All schools (n=800, n=836), primary (n=491, n=426), secondary (n=309, n=410).
*Indicates statistically significant differences between level and school type subgroups within the Winter 2018 survey.
Indicates statistically significant differences by percentage points between Winter 2018 and Winter 2017.
Maths
Hubs
Music Education
Hubs
+11p.p.+14p.p.
+9p.p.+13p.p.

28
Science Learning Partnerships: Schools from London showed by far the greatest
level of participation (42%), significantly more-so than every other region. The
lowest level of participation was recorded in the South East (12%).
1.5 English Baccalaureate (EBacc)
The EBacc entry measure is the proportion of Key Stage 4 (KS4) pupils entering GCSEs
in a set of EBacc eligible subjects which are English language and literature,
mathematics, history or geography, the sciences (including computer science) and a
language.
In the Winter 2017 survey, secondary school leaders were asked how many of their
pupils will be completing KS4 in the 2017/2018 academic year. Following that, they were
asked to give the number of those pupils they expected to enter the full range of subjects
required for the EBacc entry measure. In the Winter 2018 survey, the same questions
were asked of the 2018/2019 and 2019/2020 academic years, building a picture of these
three consecutive academic years.
Overview over time
Estimates across the two Winter surveys indicated that, across the c.3,400 secondary
schools in England, 239,000, 238,000 and 263,000 pupils would be entered into EBacc
across the three respective years. Considering the volumes of pupils anticipated to
complete their KS4 in each year, similar proportions (with no significant differences) were
estimated to be eligible for EBacc across the three academic years, equating to 46% of
2017/18 pupils, 46% of 2018/19 pupils and 48% of 2019/20 pupils.14 Figure 6 below
outlines the estimated numbers involved.
Excluding schools that gave a ‘don’t know’ response makes the estimated proportions of
pupils entering EBacc equal to 46%, 47% and 50% respectively. Again, this increase is
not statistically significant.
14 To calculate the proportion entering EBacc: the total number of pupils being entered into EBacc (so the sum of the
numbers given by each school) was divided by the total number of pupils completing their key stage 4 in the relevant academic year (the sum of the numbers given by each school). Figures were then grossed up to the schools population. Schools were excluded from the calculation if they did not know how many pupils were being entered to the EBacc subjects (18 schools in the Winter 2018 survey and 9 in Winter 2017). In Winter 2017 only, responses that were unable to give an exact percentage of pupils being entered into EBacc were able to select a range instead e.g. 10% or less, 11-20%, 21-30%, etc. The mid-point of the range was then included in the estimates.

29
Figure 6. Estimated % of KS4 pupils likely to be entered into EBacc across 3 academic years
341,000 517,000553,000
239,000 238,000263,000
0
100,000
200,000
300,000
400,000
500,000
600,000
2017/18 2018/19 2019/2020
Total pupils completing KS4 Total entered into EBacc subjects
46%
No
. e
nte
rin
g E
Ba
cc
48%
Question: 2017: A0a/A1/A2, 2018: F8/9/10/11: Of those completing Key Stage 4 in 2018/2019/2020, what percentage do you plan
to enter into the full range of subjects required for the EBacc?
Figures are volume calculations based on responses provided, rounded to the nearest 1,000.
Base: All secondary schools (Winter 2017, n=309; Winter 2018, n=410).
46%
Winter 2017 Winter 2018 Winter 2018Survey
Academic year
% entering
EBacc

30
Academic year 2019/20
Looking at the 2019/20 academic year, the estimated proportion of pupils entered into
EBacc by academies and non-academies were slightly different, but not at the level of
statistical significance. Figure 7 shows the anticipated figures for these.
Figure 7. Estimated % of KS4 pupils likely to be entered into EBacc in 2019/20 by academy status
412,000
142,000
200000
63,000
0
50,000
100,000
150,000
200,000
250,000
300,000
350,000
400,000
450,000
Academies Non-academies
Total pupils completing KS4
Total entered into EBaccsubjects
44%
Question: F10/F11: Of those completing Key Stage 4 in 2020, what percentage do you plan to enter into the full range of
subjects required for the EBacc?
Figures are volume calculations based on responses provided, rounded to the nearest 1,000.
Base: All secondary academies (n=304) and non-academies (n=106).
49%% entering
EBacc
No
.ente
ring E
Bacc in 2
01
9/2
0

31
As shown in Figure 8, there is no significant difference in the proportion of pupils that
secondary schools intend on entering into the EBacc by the proportion of pupils entitled
to FSM at that school.
Figure 8. Estimated % of KS4 pupils likely to be entered into EBacc in 2019/20 by proportions of
Free School Meals
98,000
112,000118,000
123,000
75,000
52,000 53,00061,000
52,000
34,000
0
20,000
40,000
60,000
80,000
100,000
120,000
140,000
Lowestproportion
2 3 4 Highestproportion
Total pupilscompleting KS4
Total entered intoEBacc subjects
54%
No.
en
teri
ng
EB
acc in
20
19
/20
47% 52% 42% 45%
Question: F10/F11: Of those completing Key Stage 4 in 2020, what percentage do you plan to enter into the full range of
subjects required for the EBacc?
Figures are volume calculations based on responses provided, rounded to the nearest 1,000.
Base: All secondary schools with lowest proportion of FSM (n=68), 2 (n=78), 3 (n=86), 4 (n=92) and the highest proportion
of FSM (n=64).
% entering
EBacc

32
Academic year 2020/21
In the Winter 2018 survey, secondary schools reported whether they anticipated a
change in the proportion of pupils entering EBacc in academic year 2020/21 compared to
the previous year.
Overall, seven in ten (69%) schools thought the proportion would remain about the same,
two in ten (23%) schools said there would be an increase and one in ten (8%) thought
there would be a decrease in the proportion of pupils entering EBacc at their school.
Those with the highest proportion of FSM pupils were significantly more likely to
anticipate an increase of pupils entering EBacc (37%) in 2020/21 compared to those with
the lowest level of FSM pupils (12%).
Figure 9 shows how secondary schools expected the proportion of KS4 pupils studying
the full range of subjects required for the EBacc to change in the 2020/2021 academic
year split by their anticipated entry rate for 2019/20. While there was some indication that
schools anticipating having fewer than 75% of KS4 pupils entered for the EBacc in
2019/20 were more likely to anticipate an increase for 2020/21, most schools expected
that their entry rate would stay the same regardless of their entry rate in 2019/2020.
Figure 9. Estimated change of KS4 pupils likely to be entered into EBacc in 2020/21 by proportions
entered in 2019/20
37%
27%
15%
16%
3%
9%
10%
12%
60%
65%
75%
73%
0%-24%
25%-49%
50%-74%
75%-100%
Increase Decrease Stay the same
c, d
c
a
a
Question: F11: Of those completing Key Stage 4 in 2020, what percentage do you plan to enter into the full range of subjects
required for the EBacc?
F12: Compared to 2020, for pupils in your school completing Key Stage 4 in 2021 (i.e. those currently in year 9) do you
anticipate that the proportion of pupils studying the full range of subjects required for the EBacc will...?
A-d Indicates statistically significant differences between the corresponding % entering Ebacc in 2019/20.
Base: All secondary schools: 0-24% (n=68), 25-49% (n=114), 50%-74% (n=93), 75%-100% (n=93).
% e
nte
rin
g E
Bacc in
2019/2
0
a)
b)
c)
d)

33
1.6 On-entry-assessment
Primary and infant schools use on-entry assessment to provide a snapshot of pupils’
ability when they first start school in reception. They are used to inform teaching and
learning throughout a child’s time at primary school, by taking into account individual
needs.
Overall, nine in ten primary school leaders (91%) reported conducting on-entry
assessments for their reception pupils.15 Eight percent said they do not conduct on-entry
assessments and 2% responded that on-entry assessments were not applicable to their
school.
Smaller schools were significantly more likely to use on-entry assessments than larger
schools: 97% of those with 51 to 200 pupils said they conducted assessments compared
to only 90% of schools with more than 200 pupils.16
Non-academies were significantly more likely to conduct on-entry assessments than
academies (93% vs 86%), as were schools with the lowest proportion of FSM pupils
(94% vs 82% compared with schools with the highest proportion of FSM pupils).
1.7 Phonics
Fully decodable books contain only words that are decodable through sounding out and
blending the letter combinations that pupils have previously learned. In other words, they
do not contain ‘sight’ or ‘tricky’ words that pupils cannot decode using their phonic
knowledge. A fully decodable book is therefore one that pupils can independently read to
build confidence in their early stages of learning to read.
Primary schools17 were asked if pupils read from decodable books in the early stages of
learning to read. The vast majority (95%) reported that decodable books were being used
by pupils. Non-academies were significantly more likely to use decodable books than
academies (97% vs 91%). Only a small number of schools were not using decodable
books or did not know what a decodable book was (3% and 2% respectively).
Primary teachers were asked how often they read to their class on average. Other than
giving instructions (or similar), this included reading from a book of any kind (fact or
fiction), both inside or outside of English. As shown in Figure 10, just over two-thirds of
teachers reported reading to their class at least once a day.
15 All primary schools except junior schools were asked this question 16 Schools with 1 to 50 pupils have been excluded from this analysis due to low base sizes (n=14) 17 All primary schools except junior schools were asked this question

34
Figure 10. How often primary teachers read to their class on average
Reading to pupils was particularly prevalent among teachers at schools with high
proportions of FSM pupils (70% read to their class at least once a day, significantly
higher than the 57% of schools with low proportions of FSM pupils).
Teachers of younger pupils read to their classes more frequently. Eighty-seven percent
of early years foundation stage teachers read to their class at least once a day, a
significantly higher proportion than key stage 1 teachers (75%) and key stage 2 teachers
(55%). The table below outlines the full breakdown of responses.
Question: F14: On average, how often do you read to your class?
Base: All primary teachers (n=539). Don’t know responses not displayed (1%).
68%
24%
7%1
2
3At least once a day
At least every other
day
Less than 3 times a
week

35
Table 2. How often primary teachers read to their class on average by key stage
Early years Key stage 1 Key stage 2
Base 157 184 302
At least once every other day 87% 75% 55%
At least every other day 10% 17% 33%
Less than 3 times a week 3% 7% 11%
Don’t know 1% 1% 1%
In part reflecting the different demographics of teachers by key stage, female teachers
were significantly more likely to read at least once a day compared to male teachers
(69% vs 55%).
Further, younger teachers, aged 18-34, were significantly more likely to report reading to
their class than teachers aged 45 or older; with 12%of older teachers but only 5% of
younger teachers reporting to read to their class less than three times a week.

36
2. Resources, teacher workload and careers
This chapter details the types of resources used in the classroom for primary and
secondary teachers, actions undertaken by schools to reduce unnecessary workload and
its impact, careers development and opportunities, awareness of the provider access
policy statement, promotion of STEM careers, Continuing Professional Development and
policies on mobile phones.
2.1 Resources in the classroom
The Department plans to build on the principles set out in the Independent Planning and
Resources Review Group Report (2016) to improve curriculum planning while reducing
unnecessary workload.18 The principles include the importance of planning a sequence of
lessons rather than focusing on individual lesson plans, making use of existing high-
quality resources such as textbooks, and that fully-resourced schemes of work should be
in place for all teachers.
The Department is therefore interested in the resources that teachers use in their
lessons, any barriers they face, and whether more can be done to support teachers in
accessing the resources they need to teach.
Primary teachers were asked which resource types they used in science and humanities
lessons to explore potential differences in the use of resources across the curriculum.
Resources created or accessed by teachers and their frequency of use
As Figure 11 illustrates, the frequency that teachers used different resources varied
substantially by how these resources were developed or accessed. The resources used
by the majority of teachers in ‘at least some of their lessons’ included those that were:
‘developed themselves from scratch’ (used by 96% of teachers in at least some
lessons);
‘developed within their school from scratch’ (72%);
‘accessed online at no cost’ (71%);
‘accessed via a subscription service’ (65%).
Teachers less commonly used resources that were ‘accessed via a one-off payment’ and
those ‘developed and shared by another school’ (27% and 29% respectively).
18 https://www.gov.uk/government/publications/reducing-teacher-workload-planning-and-resources-group-report

37
Figure 11. Types of resources used in the classroom
The frequency of use of different resource types varied between primary and secondary
teachers. Secondary teachers were significantly more likely than primary teachers to use
resources ‘developed themselves from scratch’ (71% vs. 59%) and resources ‘developed
within their school from scratch’ (42% vs. 21%) in most or every lesson. By contrast,
primary teachers were more than twice as likely to use resources ‘accessed via a
subscription service’ as secondary teachers (31% vs. 14%).
4%
28%
27%
34%
70%
72%
31%
56%
40%
42%
27%
23%
48%
14%
24%
21%
2%
4%
17%
1%
8%
2%
Never / hardly at all Some lessons Most lessons Every lesson
Question E2: On average in the last 12 months, how often (if at all) do you use resources in your lessons that were created or accessed
in the following ways?
Base: All teachers (n=1010). Don’t know responses are not shown.
Developed myself from
scratch
Developed within your
school from scratch
Accessed online with
no cost
Accessed via a
subscription service
Accessed via a one-off
payment
Developed and shared
by another school

38
Types of resources used in the classroom by English, Maths and Science teachers in secondary schools
Amongst secondary teachers, responses also varied by subject taught. English teachers
used resources developed themselves from scratch more often than teachers in other
subject areas. Maths and Science teachers made more use of resources accessed
online (either paid or at no cost). Over eight in ten (82%) English teachers used
resources ‘developed themselves from scratch’ in most or all of their lessons, whereas
only about half (49%) of Maths teachers did. In comparison, Maths teachers (29%) and
Science teachers (22%) were significantly more likely than English teachers (4%) to use
resources ‘accessed via a subscription service’ in most or all of their lessons. See below
for a breakdown of responses across Secondary English, Maths and Science teachers.
Figure 12. Types of resources used in the classroom for Secondary English teachers
1%
38%
14%
77%
66%
82%
16%
55%
29%
19%
31%
18%
61%
7%
40%
3%
3%
21%
15%
1%
Never/ hardly at all Some lessons Most lessons Every lesson
Question E2: On average in the last 12 months, how often (if at all) do you use resources in your lessons that were created or accessed
in the following ways?
Base: Secondary English teachers (n=61). Don’t know responses are not shown.
Developed myself from
scratch
Developed within your
school from scratch
Accessed online with
no cost
Accessed via a
subscription service
Accessed via a one-off
payment
Developed and shared
by another school

39
Figure 13. Types of resources used in the classroom for Secondary Maths teachers
Figure 14. Type of resources created or accessed by Secondary Science teachers
9%
19%
28%
39%
59%
87%
42%
50%
48%
33%
34%
9%
32%
26%
20%
24%
6%
4%
17%
6%
4%
4%
1%
Never / hardly at all Some lessons Most lessons Every lesson
Question E2: On average in the last 12 months, how often (if at all) do you use resources in your lessons that were created or accessed
in the following ways?
Base: Secondary Maths teachers (n=71). Don’t know responses are not shown.
Developed myself from
scratch
Developed within your
school from scratch
Accessed online with
no cost
Accessed via a
subscription service
Accessed via a one-off
payment
Developed and shared
by another school
4%
25%
20%
55%
61%
28%
28%
54%
28%
24%
32%
34%
51%
18%
38%
22%
5%
7%
16%
2%
13%
2%
Never/hardly at all Some lessons Most lessons Every lesson
Question E2: On average in the last 12 months, how often (if at all) do you use resources in your lessons that were created or accessed
in the following ways?
Base: Secondary Science teachers (n=71). Don’t know responses are not shown.
Developed myself from
scratch
Developed within your
school from scratch
Accessed online with
no cost
Accessed via a
subscription service
Accessed via a one-off
payment
Developed and shared
by another school

40
Specific resources used by teachers
After establishing how often resources created or accessed in particular ways were used
in the classroom, teachers were asked to specify which resources they use which were
accessed: online at no cost; via a subscription service or via a one-off payment.19
Primary teachers
Among primary teachers using resources accessed online at no cost, exactly half (50%)
used ‘TES’ (formerly the Times Educational Supplement) in this way. TES was used by
considerably more primary teachers than other resource types. The next most commonly
used resources, used by almost one-fifth of all primary teachers, were ‘resources to
support Maths lessons (e.g. Nrich, NCETM, Snappy Maths, Maths Bot)’ (19%), and a
similar proportion used 'online lesson planning tools (Topmarks, Twinkl, Active Learn)’
(18%).
Across paid-for resources (those accessed either via a subscription service or via a one-
off payment), the most common resources used were ‘online lesson planning tools
(Topmarks, Twinkl, Active Learn)’ with 71% of all primary teachers accessing these
resources via a subscription service. In comparison, only one quarter (24%) of primary
teachers accessed resources specific to the design of early years and primary lessons
(including Teachers Pet, Primary Resources, Plan Bee).
As Figure 15 shows, teachers were significantly less likely to access resources via a one-
off payment, but roughly one in twenty used either ‘TES’ (6%), ‘online lesson planning
tools (Topmarks, Twinkl, Active Learn)’ (6%) and ‘resources for early years or primary
lessons’ (5%) in this capacity.
19 Participants were able to spontaneously list whichever resources they accessed via the three listed methods, and their responses were entered into a free text box. During the analysis stage of the data the different responses given were grouped into appropriate, broad response categories. The composition of each response category is provided as an Annex in this report.
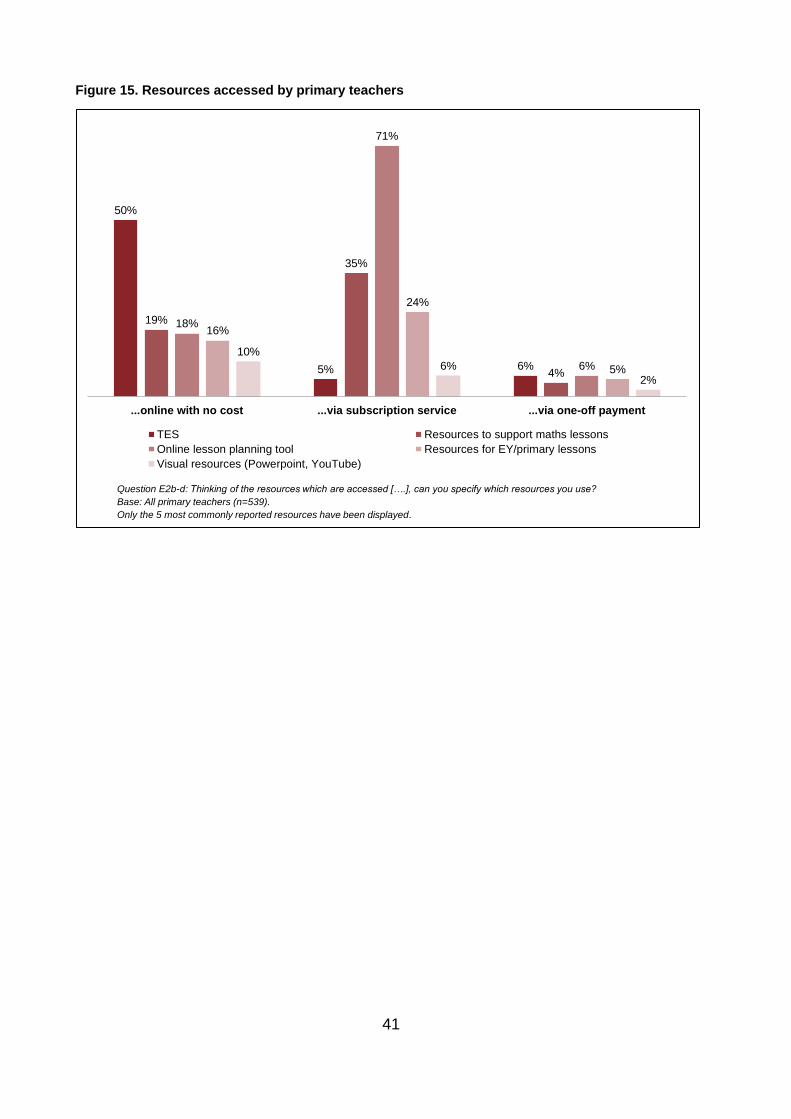
41
Figure 15. Resources accessed by primary teachers
www.iffresearch.com
Question E2b-d: Thinking of the resources which are accessed [….], can you specify which resources you use?
Base: All primary teachers (n=539).
Only the 5 most commonly reported resources have been displayed.
50%
5% 6%
19%
35%
4%
18%
71%
6%
16%
24%
5%
10%
6%
2%
...online with no cost ...via subscription service ...via one-off payment
TES Resources to support maths lessons
Online lesson planning tool Resources for EY/primary lessons
Visual resources (Powerpoint, YouTube)

42
Secondary teachers
As shown in Figure 16 the trends across secondary teachers were broadly comparable to
primary teachers. ‘TES’ was the most popular resource of those accessed online at no
cost (43% of all secondary teachers used TES in this capacity). Similarly, ‘online lesson
planning tools’ were the resources most commonly used by secondary teachers via a
subscription service (15% of all secondary teachers used this resource in this way).
Whereas there was a relatively even split of primary teachers that used each of the 5
resources via a one-off payment, secondary teachers were significantly more likely to use
‘TES’ than other resources. Over one in ten (13%) secondary teachers used ‘TES’ in
comparison to less than one in twenty (4%) that used ‘online lesson planning tools’.
Figure 16. Resources accessed by secondary teachers
Secondary Maths (19%) and Science (24%) teachers were significantly more likely to use
‘online lesson planning tools’ than English (7%) teachers.
www.iffresearch.com
Question E2b-d: Thinking of the resources which are accessed [….], can you specify which resources you use?
Base: All secondary teachers (n=471).
Only the 5 most commonly reported resources have been displayed.
43%
3%
13%
7%9%
1%2%
15%
4%6%
1% 2%
6%
0% 0%
...online with no cost ...via subscription service ...via one-off payment
TES Resources to support maths lessons
Online lesson planning tool Visual resources (Powerpoint, YouTube)
Social media

43
Barriers facing teachers from accessing resources
Teachers that did not use one or more of the online resources in at least some of their
lessons were asked to identify the three most prominent barriers preventing them from
accessing these resources more often.20
As Figure 17 shows, there were two key barriers for teachers that wanted to access
resources more often, these were: ‘time needed to adapt the resource (51%) and ‘cost of
resource’ (47%).
Figure 17. Main reasons for not using online and physical resources more often
Secondary teachers were significantly more likely to state that ‘cost’ was a barrier to
accessing resources more often than primary teachers (54% vs. 41%). Conversely, 41%
of primary teachers cited ‘resource being unsuitable for pupil needs’ as one of three main
barriers compared to just 31% of secondary teachers.
Generally, amongst secondary teachers, barriers cited did not differ significantly by
subject taught. However, English teachers were more likely than Science teachers to
report that ‘resources being low quality’ was a main barrier to accessing the listed
resources more often (34% of English teachers said this vs. 13% of Science teachers).
20 Only 1 teacher used all the resources in at least some of their lessons.
www.iffresearch.com
Question E3. What are the three main barriers preventing you from using these more often?
Base: All teachers who don’t use one or more of the resource types very often (n = 1009).
* Indicates a significant difference between primary and secondary teachers.
51%
47%
37%
36%
27%
25%
23%
14%
11%
50%
41%
41%*
41%*
27%
25%
21%
14%
9%
52%
54%*
31%
31%
28%
25%
25%
13%
14%*
Time needed to adapt resource
Cost
Time needed to find resource
Resource unsuitable for pupil needs
Personal preference
Time needed to evaluate resource
Resource being low quality
Resource being out-of-date
Resource not being quality assured
All
Primary
Secondary
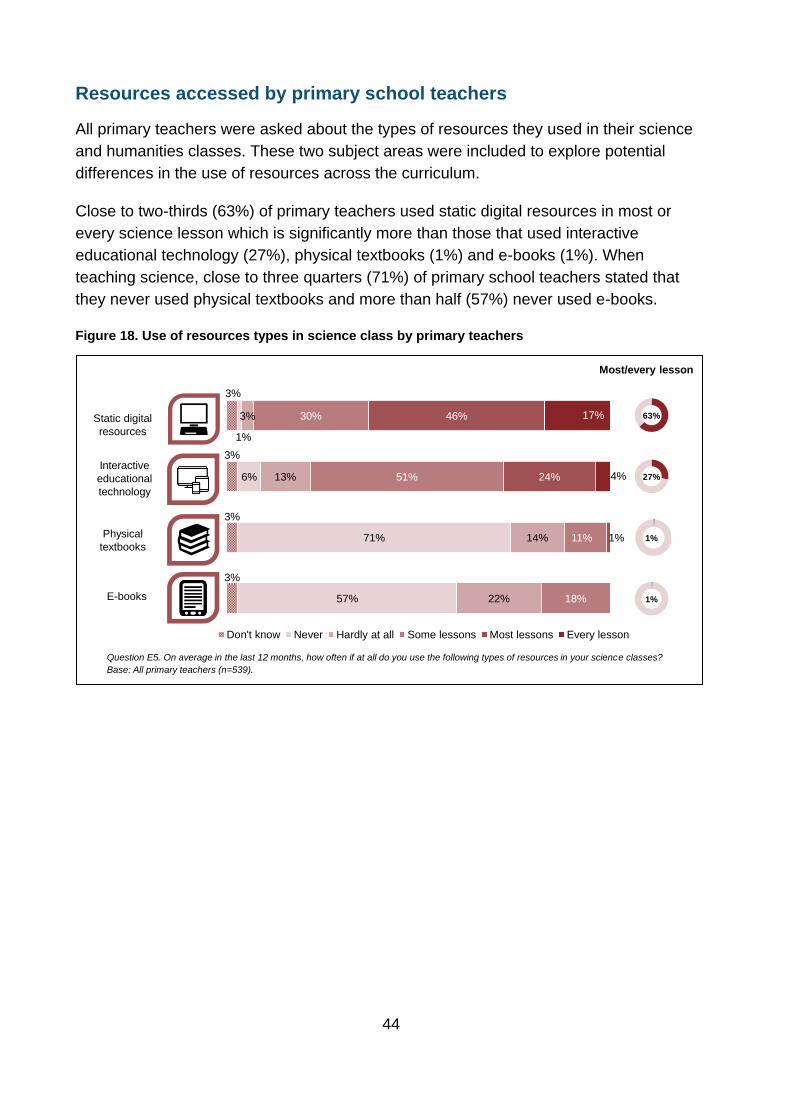
44
Resources accessed by primary school teachers
All primary teachers were asked about the types of resources they used in their science
and humanities classes. These two subject areas were included to explore potential
differences in the use of resources across the curriculum.
Close to two-thirds (63%) of primary teachers used static digital resources in most or
every science lesson which is significantly more than those that used interactive
educational technology (27%), physical textbooks (1%) and e-books (1%). When
teaching science, close to three quarters (71%) of primary school teachers stated that
they never used physical textbooks and more than half (57%) never used e-books.
Figure 18. Use of resources types in science class by primary teachers
www.iffresearch.com
Question E5. On average in the last 12 months, how often if at all do you use the following types of resources in your science classes?
Base: All primary teachers (n=539).
Physical
textbooks
Static digital
resources
Interactive
educational
technology
E-books
3%
3%
3%
3%
1%
6%
71%
57%
3%
13%
14%
22%
30%
51%
11%
18%
46%
24%
1%
17%
4%
Don't know Never Hardly at all Some lessons Most lessons Every lesson
Most/every lesson
63%
27%
1%
1%

45
A similar pattern emerged when primary school teachers were asked about the types of
resources they use in their humanities classes. Again, the most commonly used
resources were static digital resources, with 59% of teachers using these in most lessons
or every lesson. Physical text books and e-books were the resources least likely to be
used by primary school teachers when teaching humanities – with more than half of
teachers stating they never used physical textbooks (58%) or e-books (54%).
Figure 19. Use of resource types in humanities
Question E6. On average in the last 12 months, how often if at all do you use the following types of resources in your humani ties classes?
Base: All primary teachers (n=539).
Physical
textbooks
Static digital
resources
Interactive
educational technology
E-books
3%
4%
3%
3%
3%
7%
58%
54%
4%
13%
18%
21%
31%
45%
19%
21%
45%
27%
2%
1%
14%
4%
Don't know Never Hardly at all Some lessons Most lessons Every lesson
Most/every lesson
59%
31%
2%
1%

46
Resources accessed by secondary teachers
In the Winter 2018 survey, teachers in secondary schools were asked how often in the
last 12 months they had used different types of resources.
Static digital resources were the most commonly used resource by far, with 87% of
secondary teachers using them for the majority, if not all, of their lessons. In comparison
textbooks were the second most commonly used resource and were used in most or all
lessons by around one in five teachers (18%). A similar proportion used interactive
educational technology (14% in most/all lessons) and e-books were least commonly used
(6%).
Figure 20 below breaks down the frequency of use for each resource type.
Figure 20. The frequency with which secondary teachers used resources in the last year
Teachers at schools with the lowest levels of pupils eligible for FSMs were significantly
more likely to have used textbooks for most or every lesson (27%) compared to those at
schools with the highest levels of FSM pupils (14%). On the other hand, teachers at
schools with the lowest proportion of FSM pupils were significantly less likely to use static
digital resources in most or every lesson (77%) compared to those with the highest levels
of FSM (91%).
www.iffresearch.com
Question E4. On average in the last 12 months, how often if at all do you use the following types of resources in your classes?
Base: All secondary classroom teachers (n=471).
Physical
textbooks
Static digital
resources
Interactive
educational
technology
E-books
1%
24%
15%
59%
2%
30%
29%
20%
10%
28%
42%
15%
34%
14%
10%
4%
52%
4%
4%
2%
Never Hardly at all Some lessons Most lessons Every lesson
Most/every lesson
87%
18%
14%
6%

47
2.2 Teacher workload
This chapter considers the activities schools have undertaken to reduce unnecessary
workload and whether, ultimately, this had made a difference to the individual workloads
of school leaders and teachers. Data for leaders and teachers are presented
independently.
Reducing unnecessary workload is a priority for the DfE and an important element of the
recently published teacher recruitment and retention strategy.21 The strategy sets out
how we will encourage school leaders to reduce teachers’ workload and create the right
climate for head teachers to establish supportive school cultures.
Since the Workload Challenge in 201422, the DfE has taken a number of steps to
evaluate and address teacher workload, including:
the Making Data Work report and government response, published in November
2018, which includes recommendations to remove unnecessary data and
evidence collections in schools23;
the publication of a workload reduction toolkit for schools in July 201824 (updated
content was added in March 2019);
publishing the 2016 Teacher Workload Survey report25;
delivering an action plan for reducing teacher workload26; and
and setting up three independent teacher workload review groups which published
reports on increasing efficiencies in marking, planning and data management in
2016.
21 https://www.gov.uk/government/publications/teacher-recruitment-and-retention-strategy 22 https://www.gov.uk/government/publications/workload-challenge-for-schools-government-response 23 https://www.gov.uk/government/publications/teacher-workload-advisory-group-report-and-government-response 24 https://www.gov.uk/guidance/reducing-workload-in-your-school 25 https://www.gov.uk/government/publications/teacher-workload-survey-2016 26 https://www.gov.uk/government/publications/reducing-teachers-workload

48
Action taken by schools to reduce unnecessary workload (school leaders)
Almost all leaders (over 99.5%) reported that their school had undertaken at least one
action to evaluate and reduce unnecessary workload. Figure 21 illustrates the most
common responses from leaders across the 2017 Winter, 2018 Summer and 2018
Winter surveys. The question has undergone subtle changes between waves27 and some
of the response categories have been updated, so direct comparison must be treated
with caution. However, the central intention of the question has not changed; the
question asks schools to report actions they have undertaken to address workload. It is
not an opinion-based question that would be more influenced by alterations to the
question text.
Figure 21. Actions taken by schools to reduce unnecessary workload – responses from school
leaders
27 From “Which of the following has your school done to evaluate and reduce unnecessary workload…?” in the 2017 Winter wave, to “What has your school done to evaluate and reduce unnecessary workload?” in the 2018 Summer wave, to “What has your school done to reduce unnecessary workload?” in the most recent 2018 Winter iteration.
Question D1. What has your school done to reduce unnecessary workload? Base Winter 2017, Summer 2018, Winter 2018: All leaders (n=800, n=758, n=836).
Please note: the wording of some answer codes changed between the Summer and Winter 2018 waves (Winter 2018 iterations are displayed), but the only code
that was statistically significant between waves (‘used independent reports’) did not. The ‘DfE workload reduction toolkit’ and ‘data monitoring’ codes were not
present in the Summer 2018 and Winter 2017 waves and the ‘used advice from Ofsted’ code was not present in the Winter 2017 wave. Other options were
available to respondents, such as ‘other’ and ‘don’t know’.
• Indicates a significant difference between the wave the figure relates to and the previous wave.
** Indicates that code was prompted in Winter 2018 but not in Summer 2018
95%
94%
78%
78%
74%
71%
58%
46%
96%
93%*
78%*
69%*
73%
7%
95%
88%
71%
64%
Consulted with staff
Reduced workload related to marking
Reduced workload related to planning
Used the independent reports on marking, onplanning and resources and/or on data
management as a basis to review current policies
Used advice from Ofsted (e.g. Ofsted handbook or#OfstedMyths) to change practice in the school
Introduced teacher support schemes and/orwellbeing programmes**
Reduced workload related to data monitoring orthe number of 'data drops'
Used resources from the DfE workload reductiontoolkit
Winter 2018
Summer 2018
Winter 2017
Primary, 80%,*
Secondary, 69%
Secondary, 71% *
Primary , 56%
Primary, 76%*
Secondary, 67%
Secondary, 80% *
Primary , 69%

49
The majority of leaders reported that their schools had undertaken at least two of the
actions in the list in order to reduce unnecessary workload. These were: ‘consulted with
staff’ (95% of school leaders) and ‘reduced workload related to marking’ (94% of school
leaders). In addition to these actions, roughly three-quarters of school leaders reported
they had: ‘reduced workload related to planning’ (78%), ‘used the independent reports’
(78%), ‘used advice from Ofsted to change practice in the school’ (74%) and introduced
teacher support schemes and/or wellbeing programmes (71%). The DfE published the
workload reduction toolkit in July 2018 and the Making Data Work report in November
2018, 46% of school leaders reported that they had ‘used the DfE workload reduction
toolkit’ and 57% reported they had ‘reduced workload related to data monitoring’.
The 2018 Winter survey results were largely consistent with results from the 2018
Summer survey. As illustrated in Figure 21, the only action that has seen a significant
increase between the Summer 2018 and Winter 2018 waves was ‘use of independent
reports on marking, on planning and resources and/or on data management as a basis to
review current policies’ – the proportion of school leaders reporting that they had
undertaken this action rose from 69% in Summer 2018 to 78% in Winter 2018.
Differences between the actions undertaken by primary and secondary schools typically
remained consistent between the 2018 Summer survey and the most recent 2018 Winter
survey. In the 2018 Winter survey, primary school leaders were significantly more likely
than secondary school leaders to report having ‘reduced workload related to planning’
(80% and 69% respectively) and ‘used advice from Ofsted’ (76% and 67%). Conversely
(and new to this wave, so no cross-wave comparisons can be made), secondary school
leaders were significantly more likely than primary school leaders to have ‘introduced
teacher support schemes and/or wellbeing programmes’ (80% and 69%) and ‘reduced
workload related to data monitoring’ (71% and 56%).

50
Impact on manageability of workload (school leaders)
School leaders who stated that their school had taken action to reduce unnecessary
workload (all schools in the sample) were asked whether these actions had made their
own workload in an ‘average’ week more manageable. As can be seen in Figure 22,
leaders generally reported that it these actions had made no difference to their own
workload (68%). The remaining third either said that these actions had made their own
workload in an average week a bit more manageable (28%) or a lot more manageable
(4%). These results were not significantly different from those in previous waves of the
survey (see Figure 22 for comparison).
Figure 22. Impact on manageability of workload – responses from school leaders
1%
68%68%
26%28%
5%4%
Summer 2018Winter 2018
Yes, much moremanageable
Yes, a bit moremanageable
No
Don't know
Question D4. Thinking about the actions taken in your school you evaluate and reduce unnecessary workload, would
you say that this has made your own workload in an ‘average’ week more manageable?
Base: Winter 2018, Summer 2018: All leaders (n=836, n=758).
‘Not aware of actions taken’ is not displayed (this represents less than 1% of the Summer 2018 leaders)
‘Don’t know’ was not an available option at Winter 2018.

51
Action taken by schools to reduce unnecessary workload (teachers)
Teachers were also asked about actions that their school had taken to reduce
unnecessary workload. The actions reported by teachers tended to align with those
reported by leaders. The two most common actions reported by teachers were, ‘reduced
workload related to marking’ (56%) and ‘consulted with staff’ (52%), which were also the
two most common reported by leaders (94% and 95% respectively).
The frequency that these actions were reported was much lower for teachers than for
leaders. Just under one in five (17%) teachers were not aware of any action taken by
their school (Figure 23).
Figure 23 Action taken by schools to reduce unnecessary workload – responses from teachers
The proportion of primary and secondary teachers that reported each action varied
markedly. Primary teachers were significantly more likely than secondary teachers to
report that their school had taken action to ‘reduce workload related to marking’ (59% of
primary teachers vs. 52% of secondary) and ‘reduce workload related to planning’ (45%
vs. 27%). Conversely, secondary teachers were significantly more likely than primary
teachers to report that their school had ‘introduced teacher support schemes’ (42% of
secondary teachers vs. 32% of primary) and ‘reduced workload related to data
monitoring’ (37% vs. 23%) to reduce unnecessary workload.
56%
52%
37%
36%
30%
30%
11%
17%
59%*
53%
32%
45%*
32%
23%
13%
16%
52%
51%
42%*
27%
28%
37%*
10%
17%
Reduced workload related to marking
Consulted with staff
Introduced teacher support schemesand/or wellbeing programmes
Reduced workload related to planning
Used advice from Ofsted (e.g. Ofstedhandbook or #OfstedMyths) to change
practice in the school
Reduced workload related to datamonitoring or the number of 'data drops'
Resources from the DfE workloadreduction toolkit
No action taken
All
Primary
Secondary
Question D3. Which of the following has your school used to take action to reduce unnecessary workload? Base: All teachers
(n = 1010), Primary (n=539), Secondary (n=471).
Other options were available to respondents, such as ‘other’ and ‘don’t know’.
* Indicates a significant difference between primary and secondary teachers.
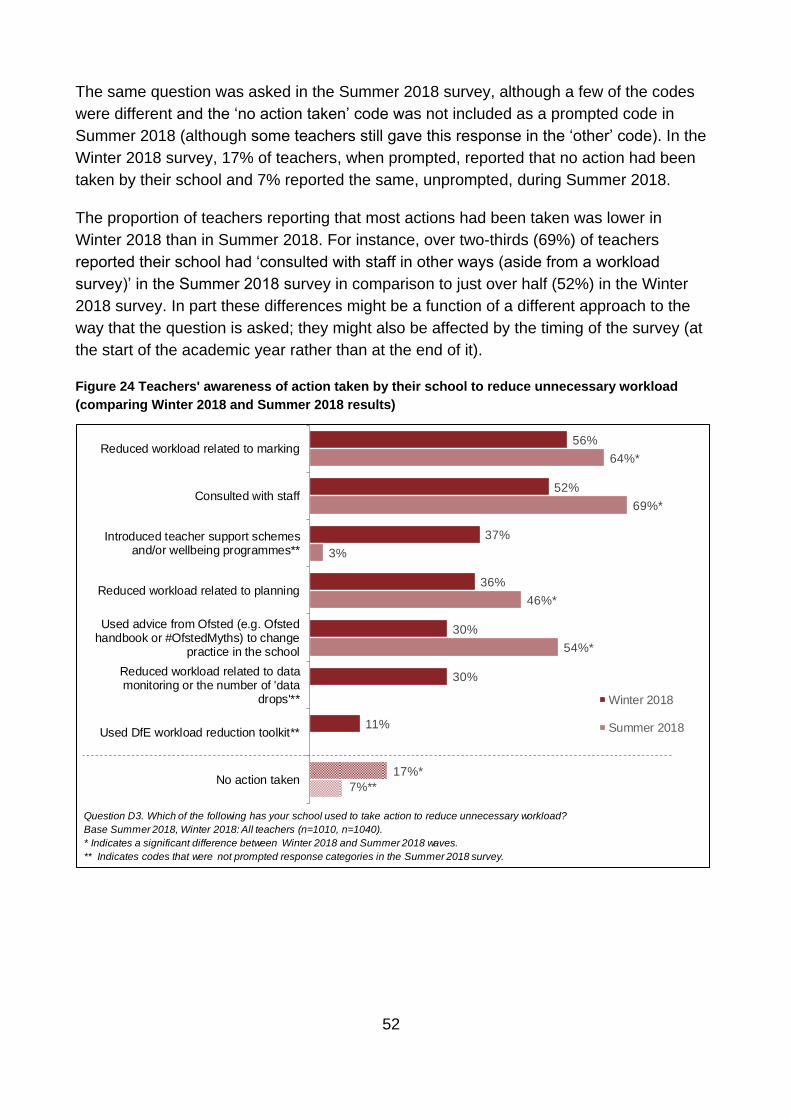
52
The same question was asked in the Summer 2018 survey, although a few of the codes
were different and the ‘no action taken’ code was not included as a prompted code in
Summer 2018 (although some teachers still gave this response in the ‘other’ code). In the
Winter 2018 survey, 17% of teachers, when prompted, reported that no action had been
taken by their school and 7% reported the same, unprompted, during Summer 2018.
The proportion of teachers reporting that most actions had been taken was lower in
Winter 2018 than in Summer 2018. For instance, over two-thirds (69%) of teachers
reported their school had ‘consulted with staff in other ways (aside from a workload
survey)’ in the Summer 2018 survey in comparison to just over half (52%) in the Winter
2018 survey. In part these differences might be a function of a different approach to the
way that the question is asked; they might also be affected by the timing of the survey (at
the start of the academic year rather than at the end of it).
Figure 24 Teachers' awareness of action taken by their school to reduce unnecessary workload
(comparing Winter 2018 and Summer 2018 results)
56%
52%
37%
36%
30%
30%
11%
17%*
64%*
69%*
3%
46%*
54%*
7%**
Reduced workload related to marking
Consulted with staff
Introduced teacher support schemesand/or wellbeing programmes**
Reduced workload related to planning
Used advice from Ofsted (e.g. Ofstedhandbook or #OfstedMyths) to change
practice in the school
Reduced workload related to datamonitoring or the number of 'data
drops'**
Used DfE workload reduction toolkit**
No action taken
Winter 2018
Summer 2018
Question D3. Which of the following has your school used to take action to reduce unnecessary workload?
Base Summer 2018, Winter 2018: All teachers (n=1010, n=1040).
* Indicates a significant difference between Winter 2018 and Summer 2018 waves.
** Indicates codes that were not prompted response categories in the Summer 2018 survey.

53
Impact on manageability of workload (teachers)
Teachers were asked whether the actions taken in their school to evaluate and reduce
unnecessary workload had made their own workload in an ‘average’ week more
manageable.
Among teachers who stated that their school had taken action, 61% reported that these
actions had made their own workload in an ‘average’ week more manageable – 51%
reported a bit more manageable and 10% reported a lot more manageable. Thirty-nine
percent reported that their weekly workload was not more manageable.
Figure 25 compares responses from the 2018 Summer survey and the most recent 2018
Winter survey. Among teachers who reported that their school had taken action to
reduce unnecessary workload, the proportion who stated that the actions had made their
own workload more manageable were higher in Winter 2018 than in Summer 2018 (61%
compared with 49%).
Figure 25. Impact on manageability of workload – responses from teachers
47%*
39%
42%
51%*
7%10%*
Summer 2018Winter 2018
Yes, much moremanageable
Yes, a bit moremanageable
No
Question D4. Thinking about the actions taken in your school you evaluate and reduce unnecessary workload, would
you say that this has made your own workload in an ‘average’ week more manageable?
Base: Winter 2018, Summer 2018: All classroom teachers who stated their school had taken at least one action to
reduce workload (n=965, n=838).
* Indicates a significant differences between Winter 2018 and Summer 2018.
‘Don’t know’ was not an available option at Winter 2018. In Summer 2018 4% gave this response

54
2.3 Careers Advice for Pupils
This section explores opportunities for pupils within secondary schools to access career
advice.
Every school in England is required to offer independent careers guidance on the full
range of education and training options, including apprenticeships, to their pupils.
According to the updated October 2018 statutory guidance for governing bodies, schools
must, amongst other obligations, do the following:28
Ensure there are opportunities for a range of education and training
providers to access all pupils in year 8 to year 13 to inform them about
approved technical education qualifications and apprenticeships.
Publish a policy statement outlining their arrangements for provider access
and ensure that it is followed.29
In addition to these statutory requirements, schools should adopt the eight Gatsby
Charitable Foundation’s Benchmarks30, and meet them in full by the end of 2020. One of
the Benchmarks asks schools to link curriculum learning with careers; particularly that
STEM subject teachers should highlight the relevance of STEM subjects for a wide range
of careers.
The three requirements mentioned above relate to questions in the Winter 2018 School
Snapshot Survey.
Careers opportunities
Under the so-called Baker clause, from January 2018 all local authority-maintained
schools and academies are required to give education and training providers the
opportunity to talk to pupils in years 8 to 13 about approved technical qualifications and
apprenticeships. Schools must have clear arrangements in place to ensure that all pupils
have opportunities to hear from providers of post-14, post-16 and post-18 options at, and
leading up to, important transition points.
All secondary schools were asked which of a series of opportunities had been arranged
for pupils in the last 12 months to help them hear about technical options for Key Stage
4, 5 or post-18 choices. The opportunities they were asked about were visits from the
28 https://assets.publishing.service.gov.uk/government/uploads/system/uploads/attachment_data/file/748474/181008_schools_statutory_guidance_final.pdf 29 http://researchbriefings.files.parliament.uk/documents/CBP-7236/CBP-7236.pdf 30 Gatsby Charitable Foundation (2014) Good Career Guidance. London: Gatsby Charitable Foundation
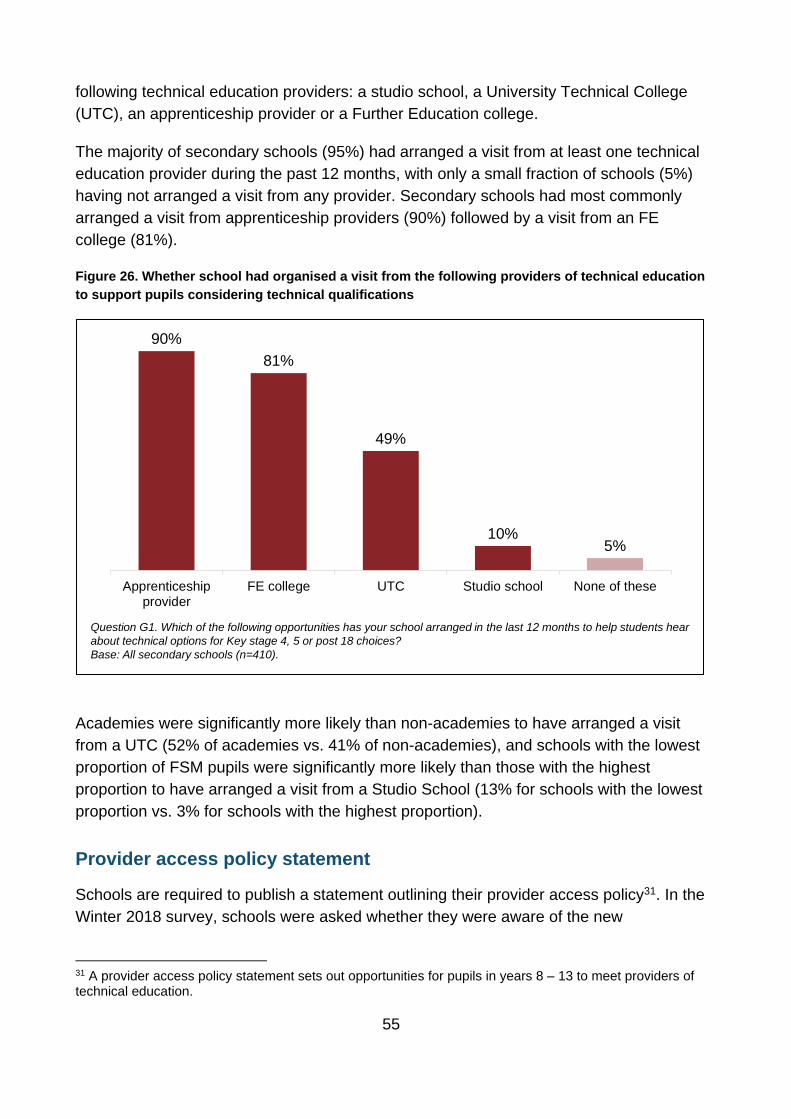
55
following technical education providers: a studio school, a University Technical College
(UTC), an apprenticeship provider or a Further Education college.
The majority of secondary schools (95%) had arranged a visit from at least one technical
education provider during the past 12 months, with only a small fraction of schools (5%)
having not arranged a visit from any provider. Secondary schools had most commonly
arranged a visit from apprenticeship providers (90%) followed by a visit from an FE
college (81%).
Figure 26. Whether school had organised a visit from the following providers of technical education
to support pupils considering technical qualifications
Academies were significantly more likely than non-academies to have arranged a visit
from a UTC (52% of academies vs. 41% of non-academies), and schools with the lowest
proportion of FSM pupils were significantly more likely than those with the highest
proportion to have arranged a visit from a Studio School (13% for schools with the lowest
proportion vs. 3% for schools with the highest proportion).
Provider access policy statement
Schools are required to publish a statement outlining their provider access policy31. In the
Winter 2018 survey, schools were asked whether they were aware of the new
31 A provider access policy statement sets out opportunities for pupils in years 8 – 13 to meet providers of technical education.
www.iffresearch.com
90%
81%
49%
10%5%
Apprenticeshipprovider
FE college UTC Studio school None of these
Question G1. Which of the following opportunities has your school arranged in the last 12 months to help students hear
about technical options for Key stage 4, 5 or post 18 choices?
Base: All secondary schools (n=410).

56
requirement to allow apprenticeship and technical education providers access to pupils;
nearly nine in ten (88%) were aware of the requirement (Figure 27).
Secondary schools were then asked whether they have a provider access statement
published on their website. Close to three quarters (73%) of secondary schools had
either published this statement or were planning to (Figure 27). As the Gatsby
Benchmarks also ask schools to include encounters with higher and further education in
their careers programme, we expect opportunities for young people to meet technical
education and apprenticeship providers to continue to increase.
Figure 27. Proportion of leaders aware of the new requirement to allow apprenticeship/technical
education providers access to pupils and whether they plan to publish provider access policy
statement on school’s website
Academies were significantly more likely than non-academies to have published a
provider access policy statement on their website (43% of academies vs. 32% of non-
academies).
Promotion of STEM careers
Secondary schools have been encouraged to promote the importance of STEM subjects
for a wide range of careers. As part of the Winter 2018 Survey, schools were asked
whether they integrated material to promote pupils’ interest in STEM careers in a range
of subjects and whether they promoted STEM careers by means outside of the
curriculum.
Virtually all schools (98%) reported that they promoted STEM careers in three or more
ways. As Figure 28 illustrates, the subjects in which STEM careers are most commonly
www.iffresearch.com
Question: G2. Are you aware of the new requirement to allow
apprenticeship/technical education providers access to students?
Base: All secondary schools (n=410).
88%
24%
2%
33%
40%
Yes
No but plan topublish
No (don't planto publish)
Don't know
Question: G3. Does your school have a provider access policy
statement published on your school's website?
Base: All secondary schools (n=410).

57
promoted are the ‘science curriculum’ (99%), ‘maths’ (94%) and ‘design & technology’
(93%); each are used to promote STEM careers by more than nine in ten schools.
Secondary schools also promoted interest in STEM through other subject curriculums
including ‘other humanities (history, geography, MFL etc.)’ (10%), ‘arts subjects (music,
photography, dance etc.)’ (9%) and ‘engineering and construction’ (8%).
Figure 28. Whether school integrates material in the following subjects/ways to promote pupil
interest in STEM
Across all schools, the most common ways of promoting STEM outside of the curriculum
was through ‘STEM clubs, societies and weeks’ (24%) and through ‘links with employers
(talks, visits, work experience etc.)’ (23%).
Schools with the lowest proportion of FSM pupils (13%) were significantly more likely
than those with the highest proportion of FSM pupils (2%) to spontaneously mention that
they use ‘talks and visits from other external speakers.
www.iffresearch.com
Question: G5. Does your school integrate material to promote students' interest in STEM careers in the following subjects?
Codes under 12% have not been displayed.
Base: All secondary leaders (n=410).
99%
94%
93%
82%
74%
24%
23%
17%
16%
13%
12%
Science curriculum
Maths
Technology/design technology
Computer science
PSHE
STEM Clubs / societies / weeks
Links with employers
Visits to and from HE/FE inst.
Careers days / fairs
Enrichment days/activities
Visits to STEM conferences
Spontaneous
Prompted
58
2.4 Continuing Professional Development
This section considers the types of Continuing Professional Development (CPD) school
leaders and teachers have accessed in the last 12 months. Interest in this area reflects
recent developments in education policy, emphasising the importance of high-quality
CPD for improving the quality of teaching, school leadership and, subsequently, pupil
outcomes.
This is reflected in the ‘Standard for teachers’ professional development’, published by
the Department in July 201632, and the government’s decision to award contracts to 10
CPD providers as part of the Teaching and Leadership Innovation Fund (TLIF) running
from 2017/18 to 2020.33 Through the TLIF scheme, CPD programmes aim to increase
skills, confidence and knowledge in the following areas:
leadership
managing challenging pupil behaviour
teaching and leadership of phonics and early reading
geography
science, technology, engineering and mathematics (STEM)
early career teacher development.
In 2017, DfE launched a reformed delivery model for National Professional Qualifications
(NPQs) to better prepare leaders for the range of roles in today’s school system. NPQ’s
are currently delivered at four different levels and aim to increase the supply of quality
leaders, particularly in areas of greatest need.
In the third wave of the School Snapshot Survey (Winter 2018), a range of CPD types
were presented to school leaders and teachers, and both groups were asked whether
they had accessed these in the last 12 months. It is worth noting that they were only
asked about the types of CPD that they had accessed and not about the number of
occasions on which they accessed CPD (and some may have classified one incidence of
CPD as more than one ‘type).
Figure 29 shows the full range of CPD accessed by leaders and teachers of primary and
secondary schools in the last 12 months. Responses are separated by those prompted
during the survey and those mentioned spontaneously by respondents.
Over 99% of leaders and teachers had accessed at least one of these types of CPD.
There were distinct ‘tiers’ in participation in different CPD types: those accessed by the
majority; those accessed by just under half; and those accessed by around one-fifth of
32 https://www.gov.uk/government/uploads/system/uploads/attachment_data/file/537030/160712_-_PD_standard.pdf 33 https://www.gov.uk/guidance/teaching-and-leadership-innovation-fund-programmes-for-teachers-and-school-leaders

59
respondents. The two CPD types accessed by the majority of leaders and teachers were
‘CPD delivered by their own school’ (93%) and ‘non-accredited course delivered by an
external provider or consultant’ (71%).
The two types of CPD accessed by just under half of leaders and teachers were
‘coaching/mentoring’ and ‘CPD provided by wider Multi-Academy Trust/Teaching School
Alliance’ that were accessed by 46% and 45% of respectively. By contrast, the CPD
types in the lower tier were accessed by roughly one in five leaders and teachers. These
were: ‘system leader support34’ (19%) and ‘formally accredited CPD’ (19%) opportunities
during the last 12 months.
It is notable that the proportions accessing formally accredited CPD are much lower than
for other informal types of CPD.
Figure 29. Types of CPD accessed in the last 12 months by primary and secondary leaders and
teachers
There were some small differences between primary and secondary teachers in the
types of CPD accessed:
34 System leaders work beyond their own school or setting, and can be senior or middle leaders in schools
or other expert practitioners. Their work might include sharing successful practice with colleagues in other
schools, providing coaching in a specialist area or a formal deployment to support a school in challenging
circumstances
93%
71%
46%
45%
19%
19%
2%
2%
1%
92%
74%*
45%
46%
23%*
16%
3%*
3%*
0%
95%*
67%
46%
44%
15%
22%*
1%
1%
1%
CPD delivered by own school
Non accredited course by external provider
Coaching/mentoring
CPD provided by wider MAT/TSA
System leader support
Formally accredited CPD
Local authority courses
CPD delivered with other schools
Did not access CPD courses
All
Primary
Secondary
Spontaneous
Prompted
Question C1. In the last 12 months, which of the following types of CPD have you accessed…?
Base: All teachers and leaders (n=1,846), primary (n=965), secondary (n=881).
‘Other’ responses have not been displayed (5%).
* Indicates a significant difference between primary and secondary schools.

60
secondary school leaders and teachers (22%) were significantly more likely
than primary teachers and leaders (16%) to have accessed ‘formally
accredited CPD(Masters/NPQs)’
primary school leaders and teachers (74%) were more likely than secondary
schools and teachers (67%) to have accessed non-accredited courses from an
external provider.
primary school leaders and teachers (23%) were more likely to have accessed
‘system leader support’ than their counterparts in secondary schools (15%).
Perhaps unsurprisingly, school leaders and teachers in academies were more likely to
receive CPD provided by a wider MAT/TSA than those who were not academies (56%
compared to 37%).
Further, all these types of CPD were significantly more likely to be accessed by school
leaders than teachers – see Figure 30 below for a breakdown of responses.
Figure 30. Types of CPD accessed in the last 12 months by school leaders and teachers
Almost all school leaders had received CPD delivered by their own school and 93% had
attended non-accredited courses delivered by an external provider. Almost two thirds had
received CPD delivered by the wider MAT/TSA and a similar proportion had received
coaching or mentoring. A third (34%) had received ‘system leader support’ and a quarter
(25%) had received formally accredited CPD.
93%
71%
46%
45%
19%
19%
2%
2%
1%
97%*
93%*
63%*
65%*
34%*
25%*
6%*
5%*
0%
93%
67%
43%
42%
17%
18%
1%
1%
1%
CPD delivered by own school
Non accredited course by external provider
Coaching/mentoring
CPD provided by wider MAT/TSA
System leader support
Formally accredited CPD
Local authority courses
CPD delivered with other schools
Did not access CPD courses
All
Leaders
Classroom teachers
Spontaneous
Prompted
Question C1. In the last 12 months, which of the following types of CPD have you accessed…?
Base: All teachers and leaders (n=1,846), Leaders (n=836), Teachers (n=1,010).
‘Other’ responses have not been displayed (5%).
* Indicates a significant difference between primary and secondary leaders and teachers.

61
Nearly all teachers had received some CPD delivered by their own school but receipt of
other types of CPD was much less common. Two-thirds (67%) had attended non-
accredited courses delivered by an external provider. Two-fifths had received
coaching/mentoring (43%) and a similar proportion had attended CPD provided by the
wider MAT/TSA (42%). Fewer than one in five had received either ‘system leader
support’ or formally accredited CPD.
Examining types of CPD accessed by different subgroups suggests that as a secondary
teacher progresses up the school hierarchy (from classroom teacher, to head of
department, to school leader), they are more likely to access different types of CPD.
Secondary teachers that had head of department (HoD) responsibilities were significantly
more likely than those without HoD responsibilities to have accessed the following types
of CPD:
‘CPD delivered by own school’ (96% for HoD vs. 91% for non-HoD);
‘non-accredited course delivered by an external provider or consultant’ (68% for
HoD vs. 58% for non-HoD),
system leader support’ (15% for HoD vs. 5% for non-HoD).35
School leaders and teachers who had been in the profession for a shorter amount of time
were more likely to receive coaching/mentoring; 57% of those who had been teaching for
3 years or less had received coaching/mentoring in the last 12 months compared with
44% of those with 4 or more years of teaching experience.

62
2.5 Mobile phones
Primary schools and secondary schools adopt different policies for dealing with mobile
phones on school premises, with secondary schools tending to adopt more lenient
policies than primary schools. The most common mobile phone policy among primary
schools was to allow phones but insist that they are left in a particular place during the
school day (65%, compared to significantly lower proportion of 16% of secondary
schools). In comparison the most common policy among secondary schools was to allow
pupils to carry phones but not to use them at all during the school day (46% which is
significantly higher than the 1% of primary schools that use this policy). Primary schools
were also significantly more likely than secondary schools to ban phones on school
premises altogether (28% vs. 8%), while secondary schools were significantly more likely
than primary schools to allow pupils to carry phones with them and to use them at
specified times during the school day (29% vs. 1%).
Figure 31. School policy on use of mobile phones by school phase
Question: N2. Which of the following best describes your schools' policy on the use of mobile phones do you..?
Base: All schools (n=836), Primary (n=426), Secondary (n=410).
Other codes not displayed: ‘Not an issue because children are too young (P=1%, S=0%) and ‘Other’ (P=2%, S=1%).
*Indicates a statistically significant differences between primary leaders and secondary leaders.
Primary Secondary
65%*
28%*
1% 1%
Phones left in particular place Ban phones altogether
Pupils carry phones but cannot use them Pupils carry phones and use them at specified times
16%
8%
46%*
29%*
65% of primary
schools allow phones but make pupils leave them in a particular place
46% of secondary
schools allow pupils to carry phones but not use them
during the school day

63
3. Support for pupils
This chapter reviews the support that pupils receive across a range of issues. It
examines:
teacher and leader awareness and use of the ‘Educate Against Hate’
website
frequency and time spent doing extra-curricular activities
prevalence of designated mental health leads and reasons for not having a
lead
the way schools monitor pupil wellbeing
frequency that teachers teach PSHE as well as relationships and sex
education alongside teachers’ confidence in teaching these subjects
school level data on frequency and method of SEND provision reviews
school level confidence in implementing the new FSM criteria under
Universal Credit as well as the ways schools use their pupil premium to
support disadvantaged pupils.

64
3.1 Educate Against Hate
In 2016, the Department launched the ‘Educate Against Hate’ website, that aims to
provide practical advice, support and resources to school leaders and teachers to assist
them in their role in safeguarding pupils from extremism and radicalisation.
Awareness and usefulness of the ‘Educate against Hate’ website
Overall, a similar proportion of around two fifths of leaders and teachers (43%) were
aware of the ‘Educate Against Hate’ website in the Winter 2018 Survey as they were the
Winter 2017 Survey (43%).
School leaders remained significantly more likely to have heard about the ‘Educate
Against Hate’ website compared to teachers (Winter 2017: leaders 58% vs teachers
37%; Winter 2018: leaders 59% vs teachers 40%) and to have visited the website at least
once (Winter 2017: leaders 56% vs teachers 35%; Winter 2018: leaders 43% vs teachers
29%). 85% of leaders and teachers who used the website thought it helped them to
understand how to raise a concern. 82% also thought it helped them to spot the signs of
radicalisation in children, and 79% thought it helped them to promote fundamental British
values like respect and tolerance of those with different faiths.
Figure 32. Number of times leaders and teachers visited ‘Educate Against Hate’ website
60%
57%
12%
12%
14%
16%
12%
12%
1%
2%*
42%
41%
14%
15%
15%
15%
28%
27%
2%*
2017: G3, 2018: H1. Have you heard of the Government website 'Educate Against Hate’? And 2017: G4, 2018: H2A. How many times have you
visited the website? Base: 2017, 2018: All leaders and teacher (n=1709, 1846); Leaders (n=800 ,836), Teachers (n=909, 1010 ).
* Indicates a statistically significant difference between Winter 2017 and Winter 2018.
64%
60%
14%
12%
10%
16%
14%
10%
1%
3%*
Not heard of / not sure if heard of website Never Once 2+ Can't remember no. times visited
Leaders
Winter 2017
Winter 2017
Winter 2018
Winter 2018
Teachers
Winter 2017
Winter 2018
All

65
As shown in Figure 33, the way teachers and leaders heard about the website varied
widely. Teachers most often heard about it via senior leaders (57%), while leaders
themselves had most often heard about it at a training course (60%). Conferences and
posters were far more likely to be mentioned by leaders than teachers.
Figure 33. Ways leaders and teachers first heard about the ‘Educate Against Hate’ website
Understanding how to raise a concern, spotting signs of radicalisation as well as
promoting mutual respect and tolerance have remained the top three ways the Educate
Against Hate website has helped leaders and teachers.
Question: H2. How did you hear about the website?
Base: All who have heard of ‘Educate against hate (n=900), Leaders (n=494), Teachers (n=406)
*Indicates a statistically significant difference between leaders and teachers.
60%*
36%
31%*
26%*
20%
19%*
17%*
6%*
4%*
5%
1%
47%
57%*
7%
9%
24%
11%
7%
1%
2%
3%*
At a training course
From senior leaders
At a conference
From posters
From other colleagues
Through social media
From an online advert
By email / post
Through the DfE
Other
Don't knowLeaders
Teachers
Prompted
Spontaneous

66
Figure 34. Ways leaders and teachers think the 'Educate Against Hate' website has helped
In the current survey, leaders and teachers differed somewhat as to the ways they
thought the website had been useful. Teachers were significantly more likely to say the
website helped them ‘to understand how to raise a concern’ (87% teachers vs. 77%
leaders) and ‘spot the signs of radicalisation in children’ (84% teachers vs. 74% leaders),
while leaders were significantly more likely to say the website helped with ‘general
awareness raising about the Prevent initiative’ (17% leaders vs. 10% teachers) and
‘helping to train staff in relation to their Prevent duty’ (9% leaders vs. 1% teachers).
There were no significant differences in the ways primary school and secondary school
teachers considered the website to be helpful.
85%
82%
79%
73%
12%
2%
1%
82%
83%
82%
80%*
10%
3%
2%
To understand how to raise a concern
To help you spot the signs of radicalisation in children
To promote mutual respect and tolerance of those with different faiths/rule of law etc
To understand how to effectively teach pupils about issues relating to extremism & terrorism
General awareness raising about the Prevent initiative
Helping to train staff in relation to their Prevent duty
It has helped in other ways
Winter 2018
Winter 2017
2017: G5, 2018: H3. Has the website helped you with any of the following…? Base: 2017, 2018: All who have heard
about and visited the website (n=586, 642); Leaders (n=356, 357), Teachers (n=230, 285).
*Indicates a statistically significant difference between leaders and teachers and between waves.

67
3.2 Extra-curricular activity
For the first time in the School Snapshot Survey series, schools were asked to estimate
how many hours per week their school spent on various extra-curricular activities. With
this question it was possible to measure both the incidence of schools that provide each
activity, and for schools that did provide the activity it was also possible to measure the
time spent providing each activity.
Across both primary and secondary schools, ‘sports’, ‘arts, drama, dance’ and then
‘music’ were three most commonly reported extra-curricular activities that schools spent
time offering. Apart from sports activities, secondary schools were significantly more
likely than primary schools to offer each type of extra-curricular activity.
Figure 35. Extra-curricular activities offered at school
Amongst primary schools, those with the highest proportion of FSM pupils were
significantly more likely than those with the lowest proportion of FSM pupils to offer:
‘arts, drama and dance’ (99% highest proportion vs. 90% lowest proportion);
technology or digital classes (72% highest proportion vs. 50% lowest proportion);
and
cookery (54% highest proportion vs. 36% lowest proportion).
Academy primary schools were significantly more likely than non-academy primary
schools to offer ‘debating, public speaking or citizenship’ (28% academy vs. 18% non-
academy) and cookery (55% academy vs. 40% non-academy).
Question: I1_X. How many hours of extracurricular activity, if any, would you estimate your school offers of the following in an average week?
Base: All Schools (n=836), Primary (n=426), Secondary (n=410).
* Indicates a statistically significant difference between primary and secondary schools.
58%*
71%*74%*
55%*
63%*
91%*94%*96%*97%*99%
13%
21%23%
44%50%
61%67%
85%
94%100%
56%
22%
10%
4%
2%
2%
10%
6%
6%
5%
2%
1%
3%
4%
63%
10%
3%
2%
18%
3%
0%
2%
5%
3%
3%
1%
Multiple staff members lead on mental health
Lack of staff capacity
Staff lack knowledge or access to training
Not sure this role would add value to my…
Mental health is not a problem in my school
Mental health is not a priority for my school
In the process of setting this up
Role is incorporated into other areas of…
Covered by the role of the school SENCO
Currently falls under Safeguarding / Wellbeing
Funding / budget cuts
Covered by the headteacher
Other
Don't know
Primary
Secondary
Sports Arts
Drama
Dance
Music Academic
related
clubs
Tech /
DigitalOutdoor
adventureCookery Volunteering
social action
Debating
Public
Speaking
Citizenship
Business /
Enterprise

68
Amongst secondary schools, those with the highest proportion of FSM pupils were
significantly more likely than those with the lowest proportion of FSM pupils to offer
cookery (63% highest proportion vs. 42% lowest proportion).
All schools were asked to specify if they spent time on any other extra-curricular activities
and 23% of school leaders indicated that they did. Some of the more common alternative
activities included ‘games clubs’ (8%), ‘mindfulness, friendship and wellbeing clubs’ (4%),
‘other outdoor activities like gardening, farming, climbing, orienteering’ (3%), ‘book
reading, library clubs’ (3%) and ‘lego clubs’ (3%).
As shown in Figure 36, secondary schools offered more hours of each extra-curricular
activity than primary schools did, on average.
Figure 36. Hours of extra-curricular activity provided per week
Among primary schools offering extra-curricular activities, academy primary schools
offered significantly more hours per week than non-academy primary schools for:
Sports (6 hours 35 minutes academy vs. 5 hours 5 minutes non-academy)
Academic subject related clubs (2 hours 55 minutes academy vs. 2 hours 5
minutes non-academy)
Outdoor adventure (2 hours 30 minutes academy vs. 1 hour 40 minutes non-
academy)
Cookery (1 hour 40 minutes academy vs. 1 hour 10 minutes non-academy).
Question: I1_X. How many hours of extracurricular activity, if any, would you estimate your school offers of the following in an average week?
Base: All school leaders (n=836), Primary (n=426), Secondary (n=410).
* Indicates a statistically significant difference between primary and secondary schools.
5hrs
35
11hrs
20*
2:4
0
6hrs
20*
2:2
0
5hrs
5*
2:2
0
8hrs
30*
1:2
5
2hrs
55
*
2hrs
3hrs
*
1:2
5
1:5
0*
1:2
0
3hrs
25*
1:1
0
1:4
0*
1:0
5
2hrs
*
56%
22%
10%
4%
2%
2%
10%
6%
6%
5%
2%
1%
3%
4%
63%
10%
3%
2%
18%
3%
0%
2%
5%
3%
3%
1%
Multiple staff members lead on mental health
Lack of staff capacity
Staff lack knowledge or access to training
Not sure this role would add value to my…
Mental health is not a problem in my school
Mental health is not a priority for my school
In the process of setting this up
Role is incorporated into other areas of…
Covered by the role of the school SENCO
Currently falls under Safeguarding / Wellbeing
Funding / budget cuts
Covered by the headteacher
Other
Don't know
Primary
Secondary
Sports Arts
Drama
Dance
Music Academic
related
clubs
Tech /
DigitalOutdoor
adventureCookery Volunteering
social action
Debating
Public
Speaking
Citizenship
Business /
Enterprise

69
Of the secondary schools offering each type of activity, on average secondary schools
with the lowest proportion of FSM pupils provided significantly more time per week on the
following extra-curricular activities compared to secondary schools with the highest
proportion of FSM pupils:
Sports (13 hours lowest proportion vs. 8 hours 10 minutes highest proportion)
Arts, drama and dance (6 hours 35 minutes lowest proportion vs. 4 hours 35
minutes highest proportion)
Music (7 hours 40 minutes lowest proportion vs. 3 hours 25 minutes highest
proportion)
Technology and digital classes (3 hours 5 minutes lowest proportion vs. 2 hours
20 minutes highest proportion)
Outdoor adventure (3 hours 35 minutes lowest proportion vs. 2 hours 20 minutes
highest proportion).
Schools were asked to reflect on how opportunities for all pupils to do physical activities
or sport as either part of the curriculum or as an extra-curricular activity had changed
over the previous 12 months. Amongst primary schools, about two thirds thought that
opportunities to do physical activity as part of extra-curricular activities (64% of primary
schools) and within curriculum time (66% of primary schools) had increased over the
previous 12 months. In contrast, the majority of secondary schools thought the
opportunities offered to their pupils had remained broadly the same over the same period
– a minority (38%) of secondary schools thought that their opportunities to do extra-
curricular physical activity had increased, and just 17% of secondary schools thought it
had increased in curriculum time. As shown in Figure 37, very few schools reported any
decrease in opportunities to do physical activities.

70
Figure 37. Changes to the opportunities for pupils to do physical activities as part of the curriculum
and as part of extra-curricular activities
Compared with academy schools (51%), non-academy schools were significantly more
likely to say that opportunities for their pupils to take part in physical activities as part of
the curriculum had increased over the last 12 months (61%). There was very little
difference by academy status in changes in opportunities to extra-curricular activities.
Question: I4/I5. Over the past 12 months, have opportunities for all pupils to do physical activities or sport at your school as
part of the curriculum.../ extra curricular activities?
Base: All schools (n=836). Primary (n=426), Secondary (n=410).
* Indicates a statistically significant difference between primary and secondary schools within curriculum / extra-curricular
activities.
17%
66%*
80%*
34%
3%*Secondary
Primary
Curriculum
Extra-
curricular
activities
38%
64%*
59%*
34%
3%
2%
Secondary
Primary
Increased Stayed broadly the same Decreased
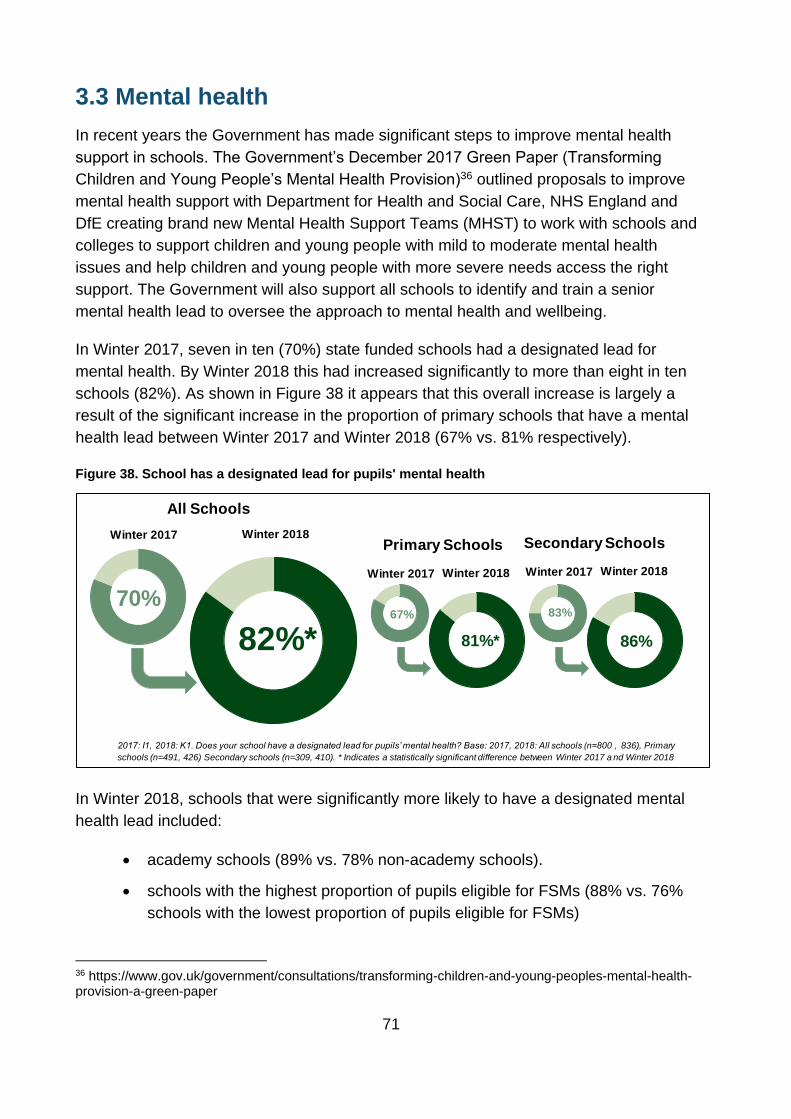
71
3.3 Mental health
In recent years the Government has made significant steps to improve mental health
support in schools. The Government’s December 2017 Green Paper (Transforming
Children and Young People’s Mental Health Provision)36 outlined proposals to improve
mental health support with Department for Health and Social Care, NHS England and
DfE creating brand new Mental Health Support Teams (MHST) to work with schools and
colleges to support children and young people with mild to moderate mental health
issues and help children and young people with more severe needs access the right
support. The Government will also support all schools to identify and train a senior
mental health lead to oversee the approach to mental health and wellbeing.
In Winter 2017, seven in ten (70%) state funded schools had a designated lead for
mental health. By Winter 2018 this had increased significantly to more than eight in ten
schools (82%). As shown in Figure 38 it appears that this overall increase is largely a
result of the significant increase in the proportion of primary schools that have a mental
health lead between Winter 2017 and Winter 2018 (67% vs. 81% respectively).
Figure 38. School has a designated lead for pupils' mental health
In Winter 2018, schools that were significantly more likely to have a designated mental
health lead included:
academy schools (89% vs. 78% non-academy schools).
schools with the highest proportion of pupils eligible for FSMs (88% vs. 76%
schools with the lowest proportion of pupils eligible for FSMs)
36 https://www.gov.uk/government/consultations/transforming-children-and-young-peoples-mental-health-provision-a-green-paper
2017: I1, 2018: K1. Does your school have a designated lead for pupils’ mental health? Base: 2017, 2018: All schools (n=800 , 836), Primary
schools (n=491, 426) Secondary schools (n=309, 410). * Indicates a statistically significant difference between Winter 2017 a nd Winter 2018
70%
82%*
Winter 2017 Winter 2018Primary Schools Secondary Schools
All Schools
Winter 2018Winter 2017
67%
81%*
Winter 2018Winter 2017
83%
86%

72
schools in the South West (90%) compared with schools in other areas
including London (79%), the North East (72%), the South East (79%) and the
West Midlands (80%).
When asked why schools did not have a designated mental health lead, by far the most
common reason mentioned by over half of primary (56%) and secondary (63%) schools
was that they had multiple staff members that lead on mental health at their school. It
was also quite common that schools were in the process of setting up a designated
mental health lead (10% of primary and 18% of secondary schools). The two most
common barriers to have a designated mental health lead were lack of staff capacity
(22% of primary and 10% of secondary schools) and also staff lacking knowledge or
access to training (10% of primary and 3% of secondary schools). Results shown in
Figure 39 have low base sizes and partly because of this there are no significant
differences between primary and secondary schools.
Figure 39. Reasons for not having a designated mental health lead
Question: K2: Why does your school not have a designated lead for pupils’ mental health?
Base: Schools that said their school does not have a designated mental health lead, Primary (n=84), Secondary (n=58 ).
SENCO refers to a Special Educational Needs Coordinator
56%
22%
10%
4%
2%
2%
10%
6%
6%
5%
2%
1%
3%
4%
63%
10%
3%
2%
18%
3%
0%
2%
5%
3%
3%
1%
Multiple staff members lead on mental health
Lack of staff capacity
Staff lack knowledge or access to training
Not sure this role would add value to my school
Mental health is not a problem in my school
Mental health is not a priority for my school
In the process of setting this up
Role is incorporated into other areas of responsibility
Covered by the role of the school SENCO
Currently falls under Safeguarding / Wellbeing
Funding / budget cuts
Covered by the headteacher
Other
Don't know
Primary
Secondary
Prompted
Spontaneous

73
3.4 Wellbeing
Schools were asked about the actions they take to monitor pupil wellbeing. All schools
indicated that they monitor wellbeing through one to one discussions with pupils (100%)
and parents (100%). As shown in Figure 40, the vast majority also use observation,
insights from pastoral or specialist staff (e.g. mentors or counsellors), feedback from
pupils (e.g. through a pupil council) and surveys of pupils. A significantly higher
proportion of primary schools use observation (98%, compared to 93% of secondary
schools), whereas a significantly higher proportion of secondary schools use insights
from pastoral or specialist staff (99%, compared to 94% of primary schools), feedback
from pupils (97% vs. 94%) and surveys of pupils (92% vs. 86%).
Figure 40. Actions taken by schools to monitor pupil wellbeing
In general, academies and non-academies used similar methods to monitor pupil
wellbeing. However, academies were significantly more likely to say they used insights
from pastoral or specialist staff than non-academies (97% vs. 93%).
Schools across different regions tended to take similar actions. However, compared to all
other regions apart from the East of England, schools in the South West were
significantly more likely to spontaneously mention that they employ or use information,
advice or guidance from external professionals (31%).
Question: K3: What does your school do to monitor pupil wellbeing?
Base: All schools (n=836). *Indicates a statistically significant difference between primary and secondary schools.
100%
100%
98%*
94%
94%
86%
15%
5%
5%*
2%
1%
5%
100%
99%
93%
99%*
97%*
92%*
17%
6%
2%
3%
3%
6%
One to one discussions with pupils
One to one discussions with parents
Observation
Insights from pastoral or specialist staff
Feedback from pupils
Survey of pupils
Advice from external professionals
Feedback from staff/parents
Wellbeing programmes
Training for pupils, parents and teachers
Buddy / mentoring system
Other
Primary
Secondary
Prompted
Spontaneous

74
3.5 PSHE
Frequency of teaching PSHE and confidence in teaching PSHE
Two-thirds (63%) of teachers that taught Key Stages 1 to 5 taught PSHE. Almost nine in
ten of these teachers (89%) said they felt fairly confident (58%) or very confident (31%)
teaching PSHE.
Figure 41. Frequency of teaching PSHE and teachers’ confidence in teaching PSHE
Primary teachers were significantly more likely than secondary teachers to be confident
in delivering PSHE (93%, compared to 81% of secondary school teachers).
Similarly, teachers at non-academy schools were significantly more confident teaching
PSHE than teachers at academy schools (91% vs. 85%). One in ten academy teachers
felt they were not confident in teaching PSHE (10%) compared with 3% of non-academy
teachers that were not confident.
Delivery of PSHE
Schools leaders were asked how their school currently delivered PSHE. Figure 42 shows
that the most common mode of delivery was through assemblies and form periods (99%
for primary schools and 98% for secondary schools). Primary schools were significantly
more likely than secondary schools to deliver PSHE through the core curriculum within
0%
5%
5%
58%
31%
Very confident
Fairly confident
Neither
Not very confident
Not at allconfident
89%
63%
Question J1. Do you teach PSHE?
Base: All teachers who don’t teach Early Foundation Stages
(n=905).
Teach PSHE Confidence in teaching PSHE
Question: J2. How confident are you in delivering PSHE?
Base: Teachers who teach PSHE (n=579). *Indicates a statistically
significant difference between academies and non-academies.
P = Primary school, S= Secondary School
A = Academy school, NA = Non-Academy school
A, 85%
NA, 91%*
P, 93%*
S, 85%

75
classroom time (99% vs. 87%). Secondary schools were significantly more likely to use
drop down days (66% vs. 59%) and extra-curricular activities to deliver PSHE (68% vs.
46%).
Figure 42. Modes of delivery for PSHE
In general, academies and non-academies delivered PSHE in similar ways. However, a
significantly higher proportion of non-academies delivered PSHE through the core
curriculum within classroom time (98%, compared to 95% of academies), whereas a
significantly higher proportion of academies delivered it through extra-curricular activities
(56%, compared to 47% of non-academies) and spontaneously mentioned that it was
delivered through external visitors or workshops (6%, compared to 3% of non-
academies).
Relationships and sex education
Primary and secondary teachers were asked whether they taught relationships and/or
sex education. As shown in Figure 43, more than half (56%) of primary teachers taught
one or both of these subjects, much higher than the third of secondary teachers (33%)
that taught relationships or sex education. Of those primary and secondary school
teachers who teach about sex or relationships, it was most common to teach about both
relationships and sex education (37% of primary teachers and 26% of secondary
teachers) rather than only teaching about relationships (18% of primary teachers and 5%
of secondary teachers) or only teaching about sex (1% of primary teachers and 2% of
secondary teachers).
Winter 2018: Question J3. How do you currently deliver PSHE? Base: All schools (n=836), Primary (n=426), Secondary (n=410).
* Indicates a statistically significant difference between primary and secondary schools.
99%
99%*
59%
46%
6%*
4%
11%*
98%
87%
66%*
69%*
1%
5%
2%
Assemblies and form periods
Through core curriculum within classroom time
Drop down days
Extra-curricular activities
Themed weeks/days (e.g. rights, anti-bullying)
Workshops / talks from external visitors
Other
Primary
Secondary
Prompted
Spontaneous
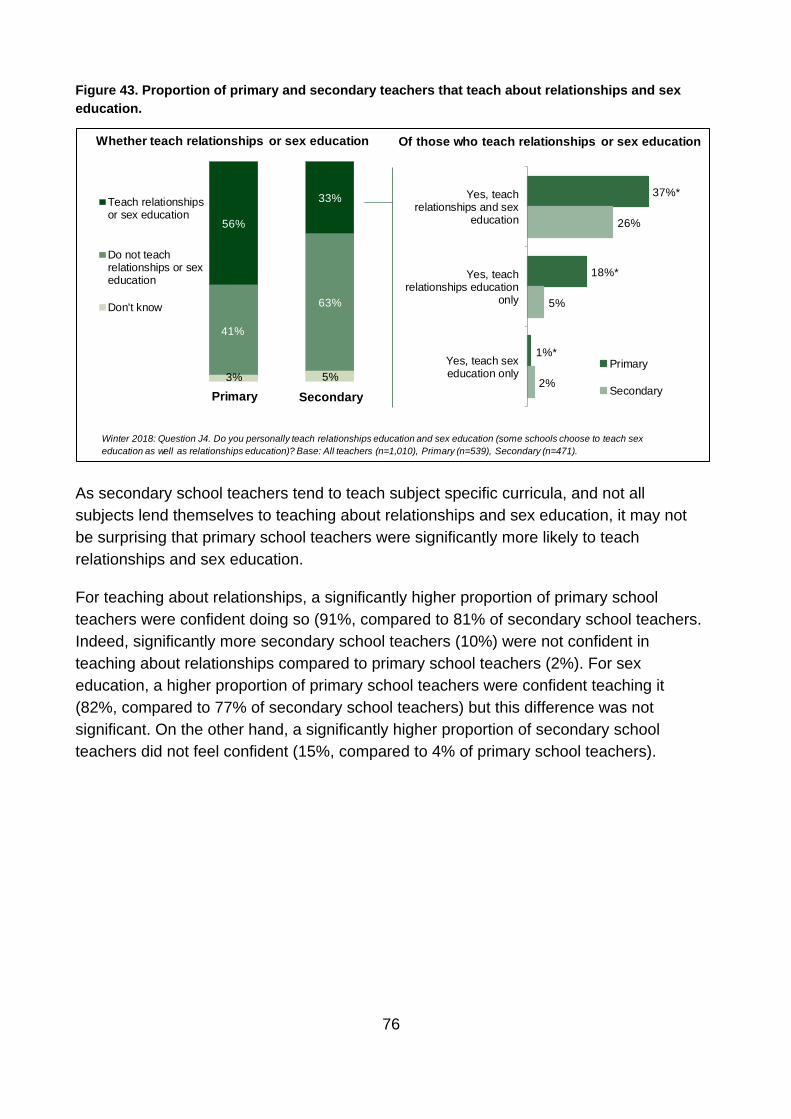
76
Figure 43. Proportion of primary and secondary teachers that teach about relationships and sex
education.
As secondary school teachers tend to teach subject specific curricula, and not all
subjects lend themselves to teaching about relationships and sex education, it may not
be surprising that primary school teachers were significantly more likely to teach
relationships and sex education.
For teaching about relationships, a significantly higher proportion of primary school
teachers were confident doing so (91%, compared to 81% of secondary school teachers.
Indeed, significantly more secondary school teachers (10%) were not confident in
teaching about relationships compared to primary school teachers (2%). For sex
education, a higher proportion of primary school teachers were confident teaching it
(82%, compared to 77% of secondary school teachers) but this difference was not
significant. On the other hand, a significantly higher proportion of secondary school
teachers did not feel confident (15%, compared to 4% of primary school teachers).
Winter 2018: Question J4. Do you personally teach relationships education and sex education (some schools choose to teach sex
education as well as relationships education)? Base: All teachers (n=1,010), Primary (n=539), Secondary (n=471).
5%3%
63%
41%
33%
56%
Teach relationshipsor sex education
Do not teachrelationships or sexeducation
Don't know
Of those who teach relationships or sex education
Primary Secondary
37%*
18%*
1%*
26%
5%
2%
Yes, teachrelationships and sex
education
Yes, teachrelationships education
only
Yes, teach sexeducation only
Primary
Secondary
Whether teach relationships or sex education

77
Figure 44. Confidence of primary and secondary teachers that teach relationships and sex
education teachers
Non-academy teachers were more confident in teaching relationships and sex education
than academy teachers. For relationships education, 91% of non-academy teachers were
confident (compared with significantly fewer academy teachers, 81%) and 8% of
academy teachers said they did not feel confident (compared with significantly fewer non-
academy teachers, 3%). For sex education, 83% of non-academy teachers were
confident compared to 76% of academy teachers, but this difference was not significant.
However, 14% of academy teachers said they did not feel confident (compared with
significantly fewer non-academy teachers, 5%).
Delivery of relationships and sex education
Schools were asked how they currently deliver relationships and sex education. Figure
45 shows that the most common mode of delivery is through core curriculum within
classroom time. This is significantly more common in primary schools (98%) than
secondary schools (91%). On the other hand, secondary schools were significantly more
likely to use assemblies and form periods (81% secondary vs. 70% primary) and drop-
down days (55% secondary vs. 28% primary). Around a fifth of all schools delivered
relationships and sex education through extra-curricular activities (22% of secondary
schools and 17% of primary schools).
34%
27%
46%
64%*
10%
7%
7%*
2%
3%*Secondary
Primary
39%*
23%
38%
59%*
9%
13%
11%
2%
4%
2%
Secondary
Primary
Very confident Fairly confident Neither confident nor not confident Not very confident Not confident at all
Winter 2018: Question J5a. How confident are you in delivering sex education? / J5. How confident are you in delivering relationships education? Base:
Teachers who teach relationships education (n=433); Teachers who teach sex education (n=325). (Due to rounding confidence in relationships does not
equal 87%).
Relationships
Sex
education

78
Figure 45. Modes of delivery for relationships and sex education
Secondary schools that were significantly more likely to deliver relationships and sex
education through the core curriculum included:
- non-academy secondary schools (97% vs. 89% of secondary academy schools
- secondary schools with the lowest proportion of FSM pupils (95% vs. 84% of
schools with the highest proportion of FSM pupils).
Winter 2018: Question J6. How do you currently deliver relationships [and sex] education? Base: All schools (n=836), Primary (n=426),
Secondary (n=410). * Indicates a statistically significant difference between primary and secondary schools.
98%*
70%
28%
17%
4%
1%
7%
91%
81%*
55%*
22%
5%
1%
6%
Through core curriculum within classroom time
Assemblies and form periods
Drop down days
Extra-curricular activities
Workshops / talks from external visitors(Spontaneous)
Themed weeks/days (e.g. rights, anti-bullying)(Spontaneous)
Other
Primary
Secondary
Prompted
Spontaneous

79
3.6 Special Educational Needs and Disability (SEND)
A Special Educational Needs and Disability (SEND) review considers how a school is
providing for its pupils with special educational needs and/or disabilities. The purpose of
a SEND review is to improve SEND provision and strategy to ensure pupils with SEND
are effectively supported and able to achieve good outcomes37.
Significantly more schools had reviewed their SEND provision in the last 12 months when
compared to the previous 12 months, with 81% reporting to have done so in Winter 2017
and 85% in the Winter 2018 Survey. This growth is largely the result of the significant
increase in secondary schools reporting that they had reviewed their SEND provision
between Winter 2017 and Winter 2018 (75% vs. 83%). This increase in secondary
schools reviewing their provision has reduced what used to be a significant gap in SEND
provision reviews between primary and secondary schools in Winter 2017 (83% vs 75%
respectively). In Winter 2018, there was no significant difference between the proportion
of primary (86%) and secondary schools (83%) that have undertaken a review of their
SEND provision in the last 12 months.
Figure 46. Undertaken review of SEND provision in last 12 months
As in Winter 2017, non-academies remained significantly more likely to have reviewed
their SEND provision than academies (non-academy 88% vs. 82% academy).
Among schools that had undertaken a review of their SEND provision in the last 12
months, the vast majority stated that the review process was conducted internally by the
Special Educational Needs Coordinator (SENCO) (93%), or by a member of the Senior
Management Team (89%).
37 This is the definition provided in the survey if respondents needed it.
81%
85%*
Winter 2017: Question K1, Winter 2018: Question M1. In the last 12 months, has your school undertaken a review of its SEND provision?
Base: 2017, 2018: All schools (n=800, 836). Primary schools (491, 426). Secondary schools (309, 410).
* Indicates statistically significant differences between Winter 2017 and Winter 2018.
Winter 2017 Winter 2018Primary Schools Secondary Schools
All Schools
Winter 2018Winter 2017
83%
86%
Winter 2018Winter 2017
75%
83%*

80
As can be seen in Figure 47, primary schools and secondary schools differed slightly in
which methods they used to conduct a review of their SEND provision. There were no
significant differences in methods used by primary and secondary schools between
Winter 2017 and Winter 2018. In Winter 2018, primary schools were significantly more
likely to conduct the review ‘internally by the SENCO’, ‘internally by the management
team’ or by a ‘Governor’ while secondary schools have remained significantly more likely
to conduct the review through ‘an external organisation’.
Figure 47. Method of the SEND Provision review used in primary and secondary schools in Winter
2018
London based schools (50%) were also significantly more likely to use ‘an external
organisation’ than schools in all other areas apart from the North East (46%).
Schools with the lowest proportion of pupils eligible for FSM were significantly more likely
than schools with the highest proportion of pupils eligible for FSM to:
conduct reviews internally by SENCO (96% low proportion vs. 90% high
proportion)
use a governor (14% low proportion vs. 6% high proportion).
There were some differences by academy status, where academy schools were
significantly:
more likely to use another school as part of a peer-to-peer review compared to
non-academies (43% academy vs. 24% non-academy)
95%*
89%*
29%
31%
12%*
6%
3%
1%
4%
82%
83%
44%*
33%
7%
5%
7%*
1%
2%
Internally by the SENCO
Internally by the senior management team
An external organisation
Another school as part of peer to peer review
Governors
Local Authority
The Multi Academy Trust
Ofsted
Other
Primary Secondary
Winter 2018: Question M2. Was this undertaken by any of the following…? Base: 2018: All schools (n=710). Primary schools (342).
Secondary schools (342). * Indicates a statistically significant difference between primary and secondary schools.
Note there were no statistically significant differences between Winter 2017 and Winter 2018
Spontaneous
Prompted

81
less likely to review internally by the SENCO (90% academy vs. 95% non-
academy) and use a Local Authority (4% academy vs. 7% non-academy).
3.7 Free School Meals
The vast majority of primary (88%) and secondary (80%) schools felt they understood
how to implement the new free school meals eligibility criteria under Universal Credit very
or fairly well. Primary schools were significantly more likely to feel that they knew how to
do this ‘very well’ (47% primary vs 30% secondary).
Figure 48. Extent primary and secondary schools understands how to implement the new FSM
criteria under Universal Credit?
Interestingly there were no significant differences in the self-reported understanding of
how to implement the new FSM criteria under Universal Credit by the proportion of FSM
pupils at their school.
47%*
30%
42%
50%*
5%
8%
2%
3%
5%
8%*
Very well Fairly well Not well Not well at all Don't know
80%
Question: L1: To what extent does your school understand how to implement the new free school meals eligibility criteria under Universal
Credit? Base: All schools(n=836, Primary (n=426), Secondary (n=410).
Primary
Secondary
88%*

82
Pupil premium
Schools were asked if they used their pupil premium to support disadvantaged pupils
in the range of ways listed in the prompted section of Table 3. Respondents could give
more than one reason and could also give other spontaneous reasons. The ways that
schools used their pupil premium to assist disadvantaged pupils varied considerably
depending on whether the school was a primary or secondary school and the
proportion of pupils that they had at their school that were eligible for free school
meals.
Subsiding school trips or other enrichment/developmental activities, including extra-
curricular clubs such as swimming or music was the most common way to support
disadvantaged pupils in both primary (98%) and secondary (98%) schools. Secondary
schools were significantly more likely to report nearly all of the listed and
spontaneously suggested ways of assisting disadvantaged pupils, apart from
employing additional teaching assistants, which primary schools were significantly
more likely to do (90% primary, 73% secondary).

83
Table 3. Ways schools use pupil premium to support disadvantaged pupils
Method Primary Secondary
Prompted
Subsidise school trips / developmental activities 98% 98%
Employ additional teaching assistants 90%* 73%
Subsidise pupils' uniforms, books etc 86% 97%*
Pay for pastoral support 82% 87%*
CPD for teachers or teaching assistants 81% 77%
Introduce programmes to raise pupils' aspiration 77% 92%*
Employ additional teachers 62% 81%*
Invest in digital technology 51% 67%*
Spontaneously mentioned
Pay higher salaries to attract high-quality teachers 8% 15%*
Tutoring / mentoring sessions or programmes 4% 11%*
Travel costs (to and from school and/or external events) 2% 5%*
Bespoke tailored curriculum for disadvantaged pupils 3%*
Other 6% 3%
Question: L2: Does your school use its pupil premium in any of the following ways to support disadvantaged pupils? Base: All schools
(n=836). Primary (n=426), Secondary (n=410).
* Indicates primary or secondary schools are statistically significantly more likely to use the premium.
There were also some key differences in the ways that primary and secondary schools
spent their pupil premium depending on the proportion of pupils they had at their school
that were eligible for FSM.
Figure 49 shows how primary schools with the highest proportion of FSM pupils were
significantly more likely than schools with the lowest proportion of FSM pupils to use
their pupil premium to pay for pastoral support (76% low proportion vs. 90% high
proportion), introduce programmes aimed at raising pupils aspirations or confidence
(69% low proportion vs. 87% high proportion) and employ additional teachers (53% low
proportion vs. 84% high proportion).

84
Figure 49. Ways primary schools use pupil premium to support disadvantaged pupils by proportion
of FSM pupils at their school
Similar to primary schools, secondary schools with the highest proportion of FSM pupils
were significantly more likely to use the pupil premium to pay for pastoral support (73%
low proportion vs. 92% high proportion) and employ additional teachers (70% low
proportion vs. 87% high proportion). In contrast to primary schools, secondary schools
with the highest proportion of FSM pupils were also significantly more likely to use the
pupil premium to pay higher salaries to attract high-quality teachers or pay for high
performance (3% low proportion vs. 24% high proportion). They were as likely to use it to
introduce programmes aimed at raising pupils’ aspirations or confidence (86% low
proportion vs. 93% high proportion).
Question: L2: Does your school use its pupil premium in any of the following ways to support disadvantaged pupils? Base: Pri mary
schools (n=426). L, 2 or 3 Indicates primary schools with highest proportion of students eligible for FSM are significantly more likely to
use pupil premium in this way than schools with the (L) lowest proportion of students entitled to FSM or those in the (2) sec ond or (3)
quintile of schools who have increasing proportions of students who are entitled to FSMs.
76%79% 80%
83%90%L
69%70%
76%
82%87%L,2
53%48%
59%
74%84%L,2,3
Lowestproportion
2 3 4 Highestproportion
Schools in ascending order by the proportion of students entitled to FSM at their school
Pay for pastoral support
Introduce programmesaimed at raising pupils'aspiration or confidence
Employ additionalteachers

85
Figure 50. Ways secondary schools use pupil premium to support disadvantaged pupils by
proportion of FSM pupils at their school
Question: L2: Does your school use its pupil premium in any of the following ways to support disadvantaged pupils?
Base: Secondary schools (n=410).L, 2 or 3 Indicates primary schools with highest proportion of students eligible for
FSM are significantly more likely to use pupil premium in this way than schools with the (L) lowest proportion of
students entitled to FSM or those in the (2) second or (3) quintile of schools who have increasing proportions of
students who are entitled to FSMs.
73%
89%L86%L
89%L 92%L
70%
78%77%
90%L,2,3
87%L
3%
14%L 13%L
20%L24%L
Lowestproportion
2 3 4 Highestproportion
Schools in ascending order by the proportion of students entitled to FSM at their school
Pay for pastoral support
Employ additionalteachers
Pay higher salaries toattract high-qualityteachers, or pay for highperformance

86
© IFF Research 2018
Reference: DFE-RR941
ISBN: 978-1-83870-045-4
The views expressed in this report are the authors’ and do not necessarily reflect those of
the Department for Education.
Any enquiries regarding this publication should be sent to us at:
[email protected] or www.education.gov.uk/contactus
This document is available for download at www.gov.uk/government/publications


