Advancing interdisciplinary studies of earth surface processes Chris Duffy, PI Sue Brantley Rudy Slingerland David Eissenstat Henry Lin Ken Davis Kamini Singha Laura Toran Pat Reed Karen Salvage Eric Kirby Tim White Doug Miller Brian Bills Beth Boyer Colin Duffy Lorne Leonard Jennifer Williams The Shale Hills/Susquehanna Zone Critical Observatory: Earth-System Testbed for Process and Prediction Ray Fletcher Michelle Tuttle Paul Bierman Peter Lichtner Carl Steefel Rich April Ryan Mather David Harbor Larry McKay Teferi Tsegaye HernanSantos
Transcript
Advancing interdisciplinary studies of
earth surface processes
Chris Duffy, PI Sue Brantley Rudy Slingerland David Eissenstat Henry Lin Ken Davis Kamini Singha Laura Toran Pat Reed Karen Salvage Eric Kirby Tim White Doug Miller Brian Bills Beth Boyer Colin Duffy Lorne Leonard Jennifer Williams
The Shale Hills/Susquehanna Zone Critical Observatory:
Earth-System Testbed for Process and Prediction
Ray Fletcher Michelle Tuttle Paul Bierman Peter Lichtner Carl Steefel Rich April Ryan Mather David Harbor Larry McKay Teferi Tsegaye HernanSantos
Prediction of Pathways and Time Scales using Environmental Tracers at the Shale Hills CZO
Page 1 of 5http:/ / www.nsf.gov/ news/ special_reports/ science_nation/ followthewater.jsp
NSF Web Site
October 24, 2011
Lifecycle of water in the SusquehannaRiver Basin may reveal answers fordrought prone areas
Water is a precious resource many takefor granted until there is too little or toomuch. Scientists and engineers havepositioned instruments at theSusquehanna Shale Hills Observatory at
Pennsylvania State University to learnmuch more about the water cycle there.It is one of six Critical Zone
Want to UnderstandDrought? Follow theWater!
Download video
Enlarge image
Researchers wanted toknow if trees closer to thewetland used more water
than ones that were furtheraway. To figure this out,they picked 150 trees and,by putting sensors into the
Shale Hills Critical Zone Observatory Stable Isotope Network
Instrumentation for Iso.Net
>5000 Stable Isotope Samples 2008-20012
A Transport Model for Age Distribution
Rotenberg 1972, J, of Theoretical Biology, 37, 291-305
L(c) ÞQi
V(ci - c)
or
DM (t,t )1
V=
¶M
¶t+¶M
¶t
æ
èçö
ø÷1
V
V
Transport Model in Terms of Moments
Source terms
Transport operator Coupling Moment
Age =m1
m0
60
110
160
210
260
310
360
-730 -365 0 365 730 1095
Ag
e (
Da
ys)
Time (days)
Predicted Watershed Age at Shale Hills
Simulated Input Observed Record Simulated Input 2009
Spatial Mean Watershed Age = 210.9 days
JAN – MAR
Critical Zone “Age Spots”
APR – JUN
Spatial Mean Watershed Age = 188.7 days
JUL – SEP
Spatial Mean Watershed Age = 161.6 days
OCT – DEC
Spatial Mean Watershed Age = 180.1 days
Spatial Mean Watershed Age = 210.9 days
…
JAN – MAR
14
SH-CZO Isotope-Age Team
Chris Duffy– Professor, Civil-Environmental Eng George Holmes– MS Student, Civil-Environmental Gopal Bhatt– PhD Student, Civil-Environmental Eng Evan Thomas– MS Student, Civil-Environmental Lixin Jin- Post Doc, Geoscience Beth Boyer- Assoc Professor, Forestry Ken Davis– Professor, Atmospheric Sciences Danielle Andrews – PhD Student, Soil Science Katie Gaines - PhD Student, Ecology Dave Eissenstat, professor, Ecology
Where do trees get their water at Shale Hills?
Are some trees different?
How are these relationship measured & modeled?
CZO Hi-Res Data Products
NCALM Lidar-> model grid Lin and NRCS-> GPR bedrock Eissenstat->tree survey
Tree transpiration (sap flux) and soil moisture
Sap flux (black bars) and soil water potential at 15 cm (red lines) for :
Chestnut oak (Quercus prinus), ring porous
Sugar maple (Acer saccharum), diffuse porous
Virginia pine (Pinus virginiana) trachied
1. Several dry spells over growing season where soil water potentials became low
2. Note drought-tolerant species Q. prinus has appreciable sap flux even during low surface soil water potential.
3. Note by Sept., rehydration of soil only marginally increased sap flux in A. saccharum and P. virginiana. In contrast, Q. prinus fully recovered ability to transpire.
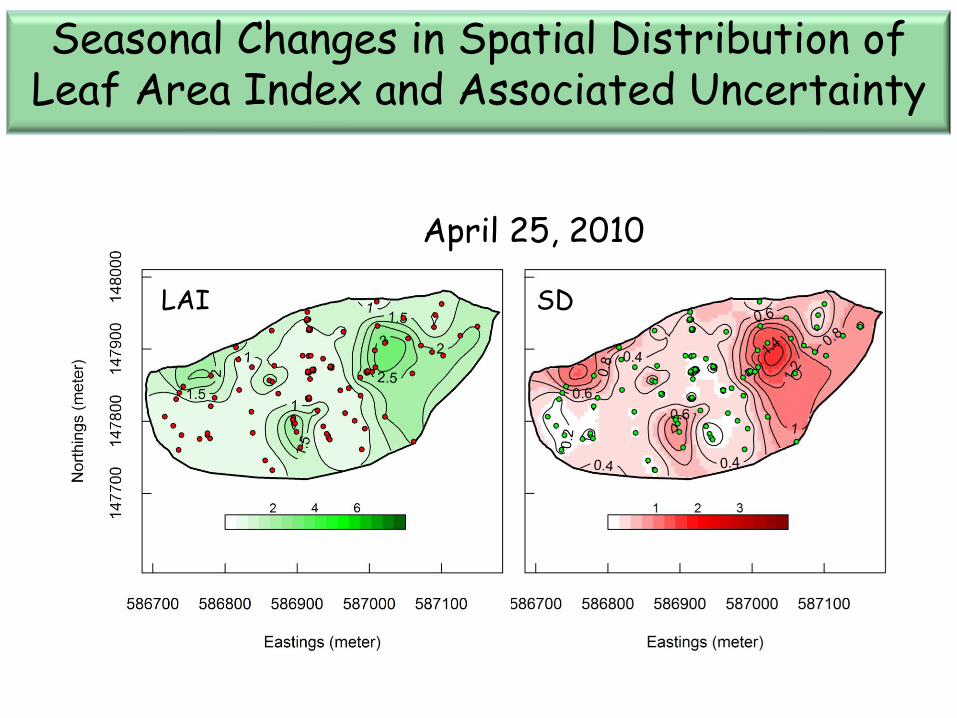
Seasonal Changes in Spatial Distribution of Leaf Area Index and Associated Uncertainty
April 25, 2010
SD LAI
Seasonal Changes in Spatial Distribution of Leaf Area Index and Associated Uncertainty
May 10, 2010
SD LAI
June 03, 2010
Seasonal Changes in Spatial Distribution of Leaf Area Index and Associated Uncertainty
SD LAI
July 19, 2010
Seasonal Changes in Spatial Distribution of Leaf Area Index and Associated
Uncertainty
SD LAI
July 29, 2010
Seasonal Changes in Spatial Distribution of Leaf Area Index and Associated
Uncertainty
SD LAI
September 06, 2010
Seasonal Changes in Spatial Distribution of Leaf Area Index and Associated
Uncertainty
SD LAI
October 31, 2010
Seasonal Changes in Spatial Distribution of Leaf Area Index and Associated
Uncertainty
LAI and soil moisture display inverse relationship
during growing season
Soil moisture decreases from leaf onset to leaf maturity
and then increases from maturity to leaf senescence.
Soils-Ecology Group Conclusions
Leaf area index and soil moisture show high spatial dependence.
There is a tight coupling between
vegetation phenology and hydrology. Soil moisture decreases from leaf onset to leaf maturity and then increases from
maturity to leaf senescence.
SH-CZO Ecology-Soils Team
David Eissenstat – Professor, Horticulture & Ecology Kusum Naithani – Postdoc, Geography and Ecology Katie Gaines – PhD Student, Horticulture and Henry Lin – Professor, Crop and Soil Sciences Doug Baldwin – MS Student, Crop and Soil Sciences