The snow storm of 8 March 2010 in Catalonia (Spain):a paradigmatic wet-snow event with a high societal impact
M. C. Llasat1, M. Turco2, P. Quintana-Seguí3, and M. Llasat-Botija1
1Department of Astronomy and Meteorology, University of Barcelona, Barcelona, Spain2CMCC (Euro-Mediterranean Centre on Climate Change), Lecce, Italy3Observatori de l’Ebre, Universitat Ramon Llull – CSIC, Roquetes, Spain
Received: 29 October 2012 – Published in Nat. Hazards Earth Syst. Sci. Discuss.: –Revised: 18 October 2013 – Accepted: 30 October 2013 – Published: 28 February 2014
Abstract. A heavy precipitation event swept over Catalonia(NE Spain) on 8 March 2010, with a total amount that ex-ceeded 100 mm locally and snowfall of more than 60 cm nearthe coast. Unusual for this region and at this time of the year,this snowfall event affected mainly the coastal region andwas accompanied by thunderstorms and strong wind gustsin some areas. Most of the damage was due to “wet snow”, akind of snow that favours accretion on power lines and causesline-breaking and subsequent interruption of the electricitysupply. This paper conducts an interdisciplinary analysis ofthe event to show its great societal impact and the role playedby the recently developed social networks (it has been calledthe first “Snowfall 2.0”), as well to analyse the meteorologi-cal factors associated with the major damage, and to proposean indicator that could summarise them. With this aim, thepaper introduces the event and its societal impact and com-pares it with other important snowfalls that have affected theCatalan coast, using the PRESSGAMA database. The sec-ond part of the paper shows the event’s main meteorologicalfeatures and analyses the near-surface atmospheric variablesresponsible for the major damage through the application ofthe SAFRAN (Système d’analyse fournissant des renseigne-ments atmosphériques à la neige) mesoscale analysis, which,together with the proposed “wind, wet-snow index” (WWSI),allows to estimate the severity of the event. This snow stormprovides further evidence of our vulnerability to natural haz-ards and highlights the importance of a multidisciplinary ap-proach in analysing societal impact and the meteorologicalfactors responsible for this kind of event.
1 Introduction
On 8 March 2010, a heavy snowfall swept over a large pro-portion of Catalonia (NE Iberian Peninsula). It was an un-usually severe weather event, characterized by high-intensitysnowfalls that reached down to sea level, wind gusts thatexceeded 90 kmh−1 in some areas, and thunderstorms. Theevent occurred mainly on the northern coast, where snowdepth was generally between 20 and 30 cm, although localdepths reached 60 cm. As a consequence of the weight of the“wet snow” (Deneau and Guillot, 1984) and the strength ofthe wind, hundreds of trees were destroyed and, in some ar-eas, the electricity networks collapsed. Its comparison withother events and the fact that this event was the first in Spainwith a major echo in social networks allowed us to classify itas the first “Snowfall 2.0”.
Snowfalls in Catalonia usually affect the mountain areas,mainly the Pyrenees region, and are generally associatedwith stratiform precipitation. Intense precipitation events arefrequent in Catalonia and usually associated with convectiveprecipitation (Llasat, 2001; Rigo and Llasat, 2004), produc-ing frequent flash floods on the coast (Llasat et al., 2003;Llasat, 2009). They are mainly recorded in summer (localevents) or autumn (more organized events), favoured by thewarm sea water and strong instability. Generally, the pres-ence of a near pressure low (Milelli et al., 2006; Rigo andLlasat, 2007; Campins et al., 2011) organizes the warm andmoist flow at low levels or triggers the convection. The8 March snowfall event would be a paradigmatic exampleof the combination of snowfall and thunderstorms in a lowaltitude Mediterranean region.
Published by Copernicus Publications on behalf of the European Geosciences Union.
428 M. C. Llasat et al.: The snow storm of 8 March 2010 in Catalonia (Spain)
However the case analysed here is also a good exam-ple of a “wet-snow” event. Wet snow occurs when surfacetemperatures are around 0◦C, humidity is high and windsare moderate, thus producing ice formations on structuresand power lines. The density of these icing formations usu-ally ranges from 0.3 to 0.8 kgdm−3. Generally, in Mediter-ranean regions, the values range from 0.3 to 0.5 kgdm−3. Al-though this phenomenon is frequent in other countries, suchas France, it is quite unusual in Spain (Deneau and Guil-lot, 1984; Admirat et al., 1988; Bonelli and Lacavalla, 2009;Wakahama, 1979; Farzaneh, 2008).
The main objective of this paper is to analyse the reasonsfor the high societal impact of the snowfall of 8 March 2010.To do so, the paper starts by analysing the societal impactof the event and the role played by social networks, whichwere becoming mainstream at that time. Its main meteoro-logical features are then described and a comparison withother snow events affecting the same area since 1960 is made,in order to show whether or not it was exceptional. To under-take this analysis, information from the press since 1960 wascollected and analyzed following the methodology shown in(Llasat et al., 2009). Furthermore, to analyse the surface fea-tures favouring the production of wet snow and their hourlyevolution, spatial data of screen level, temperature, humid-ity and wind speed are necessary. For this reason we usedthe SAFRAN (Système d’analyse fournissant des renseigne-ments atmosphériques à la neige) meteorological analysissystem (Durand et al., 1993; Quintana-Seguí et al., 2008) re-cently applied to this region (Quintana-Seguí et al., 2012). Fi-nally, in order to summarise the severe surface weather con-ditions in an indicator that could be easily related to dam-ages, an index to estimate the severity of the event at mu-nicipal scale has been introduced, by the application of GIS(geographical information system) tools, following examplesof literature on societal impact (e.g.Amaro et al., 2010a;Petrucci and Pasqua, 2008; Dao and Peduzzi, 2004). The pa-per ends with the main conclusions.
2 Main precipitation features
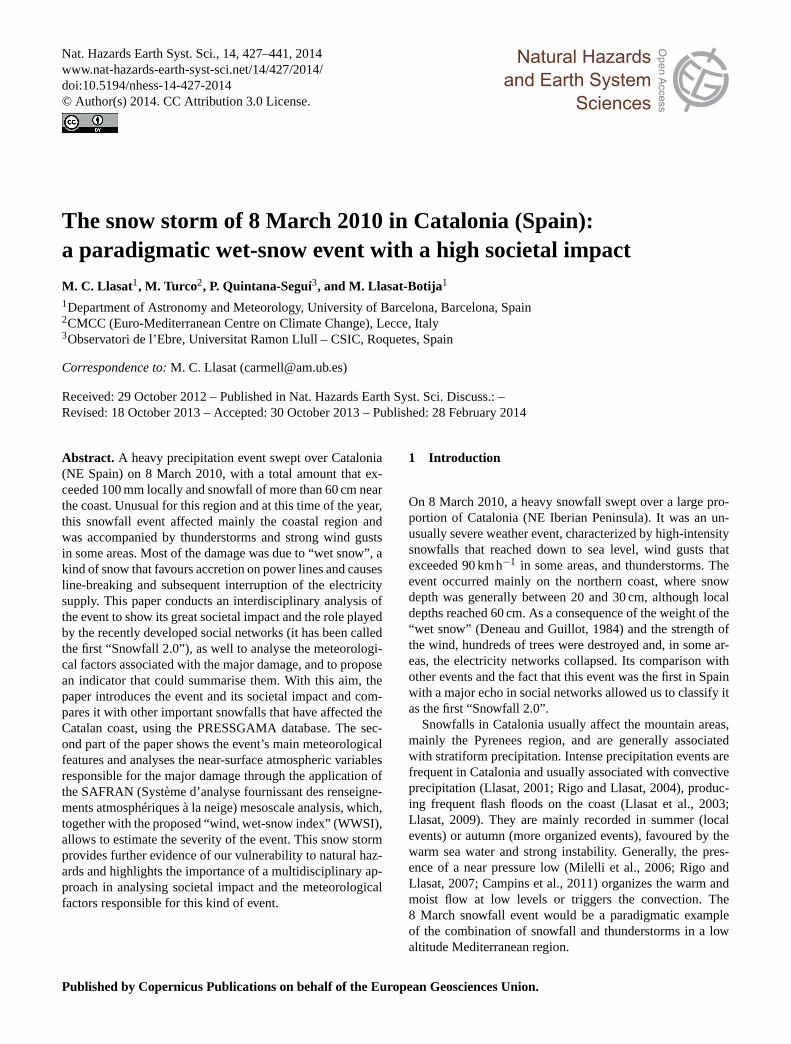
Figure1 shows the snow coverage the day after the event,over an area that includes parts of Catalonia, Spain, andthe Midi-Pyrénées and Languedoc Roussillon, France. Weakprecipitation started on the evening of 7 March in the south-ern part of the region, and near midnight snow coverage ex-tended over most of the region. During that day the snow lev-els progressively decreased from 1000 to 700 m, and even to400 m in some areas. The next morning, precipitation inten-sified in the northern part of the region, associated with thun-derstorm activity. In the afternoon, the snow level reachedsea level. The official precipitation data was provided by therain gauge network of the Meteorological Service of Catalo-nia (SMC,Prohom and Herrero, 2008). Possible systematicunderestimation of the amount of solid precipitation should
Fig. 1. Satellite image (natural colour RGB, channels NIR1.6;VIS0.8; VIS0.6) from the EUMETSAT Second Generation for9 March 2010 at 12:00 UTC. Source:http://www.eumetrain.org/.The area of study is located within the yellow box.
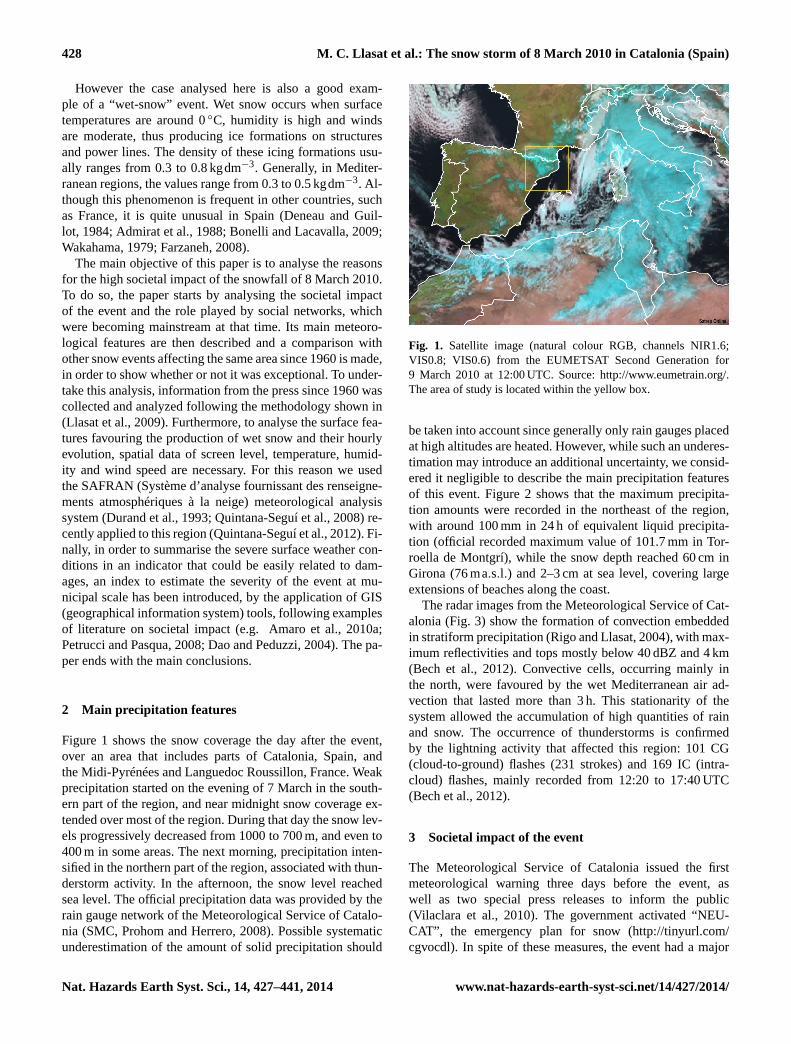
be taken into account since generally only rain gauges placedat high altitudes are heated. However, while such an underes-timation may introduce an additional uncertainty, we consid-ered it negligible to describe the main precipitation featuresof this event. Figure2 shows that the maximum precipita-tion amounts were recorded in the northeast of the region,with around 100 mm in 24 h of equivalent liquid precipita-tion (official recorded maximum value of 101.7 mm in Tor-roella de Montgrí), while the snow depth reached 60 cm inGirona (76 ma.s.l.) and 2–3 cm at sea level, covering largeextensions of beaches along the coast.
The radar images from the Meteorological Service of Cat-alonia (Fig.3) show the formation of convection embeddedin stratiform precipitation (Rigo and Llasat, 2004), with max-imum reflectivities and tops mostly below 40 dBZ and 4 km(Bech et al., 2012). Convective cells, occurring mainly inthe north, were favoured by the wet Mediterranean air ad-vection that lasted more than 3 h. This stationarity of thesystem allowed the accumulation of high quantities of rainand snow. The occurrence of thunderstorms is confirmedby the lightning activity that affected this region: 101 CG(cloud-to-ground) flashes (231 strokes) and 169 IC (intra-cloud) flashes, mainly recorded from 12:20 to 17:40 UTC(Bech et al., 2012).
3 Societal impact of the event
The Meteorological Service of Catalonia issued the firstmeteorological warning three days before the event, aswell as two special press releases to inform the public(Vilaclara et al., 2010). The government activated “NEU-CAT”, the emergency plan for snow (http://tinyurl.com/cgvocdl). In spite of these measures, the event had a major
M. C. Llasat et al.: The snow storm of 8 March 2010 in Catalonia (Spain) 429
Fig. 2. Accumulated precipitation between 7 (00:00 UTC) and10 March (00:00 UTC) 2010. Source:www.meteo.cat.
societal impact in Catalonia. This was mainly due to its ex-ceptionality: the large amount of wet snow and precipitationand wind, as well as the fact that it affected the most denselypopulated city in Catalonia, Barcelona (nearly five millioninhabitants in the metropolitan area) with 3 cm of snow nearthe sea and 20 cm at the Fabra Observatory (415 ma.s.l.).
This event surpassed the threshold for consideration asa heavy rainfall event of 60 mm/24 h set by the MEDEX(Mediterranean Experiment) project (Homar et al., 2007),thus allowing application of the methodology developed inAmaro et al.(2010a) to analyse requests received by theSMC for information and certificates. Nearly one hundred re-quests were received, 70 % asking for snow information and30 % for data about the rainfall event, a far higher numberthan the average number of requests (fewer than twenty) re-ceived by the SMC in the month of March (Amaro et al.,2010b). The main interests were to justify absence fromwork, to calculate the overload on infrastructures due to thesnow, and to evaluate and justify damage.
Besides this information, the impact of the event was an-alyzed with information from newspapers and reports (Ta-ble 1). A total of 36 high-voltage power-transmission tow-ers were damaged by snow and wind (Fig.4a). As a con-sequence, more than 450 000 customers were affected bypower outages over the following days and the electric-ity company spent EUR 60 million on repairs. The damageto forests was substantial, affecting 150 000 ha (Fig.4b),while fallen branches and trees affected infrastructure such
Table 1. Main damages as a consequence of the snow event of8 March 2010 in Catalonia (M: million).
Deaths 2High-voltage power-transmissiontowers affected 36Customers affected bypower outages 450 000Cost of recovery works ofelectric company EUR 60 MForest area affected 150 000 haLosses in agriculture and forestry EUR 35.68 MForest cleanup operations EUR 23.5 MRoads and highways 180 affected, 34 closedStudents without classes 215 623Hours of work estimated as lost 5 MEstimation of total damages EUR 90 M
as roads and made access to residential areas more diffi-cult. Losses in agriculture and forestry were estimated atEUR 35.68 million. The main problems after the event layin clearing these forests, fallen trees and wood in order toopen pathways, restore gardens and houses affected by thedamage and also to prevent an increase of wildfire risk, sincedead wood is a key factor in wildfire severity (Turco et al.,2012). The Catalan Regional Government approved funds ofEUR 23.5 million to mitigate the damage caused by this event(mainly for forest clearing operations). The Decree 43/2010of 23 March of the Government of Catalonia (DOGC, 2010)approved the adoption of urgent measures to alleviate thedamage and reduce the risks to the environment as a resultof the snowstorm of March 2010. As Fig.5 shows, the majordamage in forestry municipalities occurred near the coast, inthe littoral range, which has maximum altitudes of less than700 m, as a consequence of a combination of snow accre-tion and strong winds. Following this decree (no informationfrom insurance companies is available), Fig.6 shows the mu-nicipalities in which more than 25 % of the population wasaffected by power cuts for more than 24 h; it refers only tothe aid received by the council, with a maximum value of70 073.75 in Girona (the capital of the northern Catalan re-gion). Figure6 was built using a geographical informationsystem (GIS) software in order to calculate simple correla-tions with variables like the number of inhabitants, informa-tion given by IDESCAT (Institut d’Estadística de Catalunya(Statistical Institute of Catalonia), 2010). It has been foundthat the distribution of subsidies was mainly proportional tothe number of inhabitants in the municipality (correlation,r = 0.94), more than to the estimated total public and privatedamage. This fact shows the great importance of the pop-ulation density as an indicator of the potential cost for theadministration.
430 M. C. Llasat et al.: The snow storm of 8 March 2010 in Catalonia (Spain)
Fig. 3.Composite radar imagery over Catalonia showing the first CAPPI, from 12:00 to 17:00 UTC, 8 March 2010. Source:www.meteo.cat.
Fig. 4. (a) High-voltage power-transmission tower destroyed near France (Port-Bou) by wind and the weight of the wet snow. Source:www.elperiodico.com. (b) Fallen trees due to the effect of snowfall and wind (Les Gavarres, Girona). Source:www.elperiodico.com.
Previous work on the estimation of societal impact and theperception of natural hazards in Catalonia through the press(PRESSGAMA database) for the period 1982–2007 (9428newspapers) showed that snow events have the highest num-ber of news items per event, probably due to their low fre-quency in the region (Llasat, 2009). So for floods (the mainnatural hazard in Catalonia), the average number of head-lines per event is 5.5, while for snow events it is 6. Thesefigures may change over the years, depending on the pres-ence of such high impact events. In 1985, five snow eventsmade 102 headlines, although 96 concerned the snowfall of5 January (Table2). In the case of March 2010, consideringthe period 8 March–23 April 2010, 210 news items were pub-lished in the newspaper taken as a reference (La Vanguardia),
194 of them in March. The news in the press about this issuedisappeared abruptly after the eruption of the Eyjafjalla Vol-cano.
Besides the PRESSGAMA database built after system-atic research in each newspaper (Llasat, 2009), informationon snow events affecting the coastal region since 1960 wassought in specific newspapers. According to this information,the March 2010 snow event had the most press reports in thehistory of that newspaper, followed by the 1962 event, whichalso affected the city of Barcelona, with more than 50 cm ofsnow and the unusual sight of people skiing in the city cen-tre. Table2 shows the events that recorded more than 40 cmof snow in the province of Girona. Looking at the evolutionof the more severely affected economic sectors in these 50 yr,
M. C. Llasat et al.: The snow storm of 8 March 2010 in Catalonia (Spain) 431
Fig. 5. Map showing the municipalities within the priority forestryprotection perimeters established by Decree 43/2010 of 23 March(DOGC, 2010).
while in the first decades the main damage was in agriculture,with the most recent events, the service sector came first inthe ranking. The supply of electricity was, however, damagedin all cases. In terms of comparison, although the event of2001 also had a substantial societal impact and damage wasvery high due to roads and highways being blocked, therewas considerably less damage (for more information on thisevent, seePascual et al., 2003). However, as a consequenceof the 2001 event and the evident difficulties in emergencymanagement, the Government launched the “NEUCAT” pro-gram, which was operative during the 2010 snowfall eventand prevented greater damage. A final observation on newscoverage shows a change in sociopolitical reaction: while theevents in the sixties saw newspapers praising the authori-ties and emergency management, in recent decades, report-ing has, in the main, been severely critical.
This snowfall event could be classified as the first “Snow-fall 2.0”. Between 9 March and 23 April 2010, a search withthe Spanish term “nevadas marzo 2010” (snowfalls March2010) led to 81 600 results on Google, 132 on Facebook and750 amateur videos on YouTube. Most results related to per-sonal experiences during the event and included text and pic-tures. Twenty-four hours after the event started, the num-ber of fans, friends or likes of Facebook members, groupsor pages about the snow event had reached 72 000. On theone hand, Facebook and YouTube were used as venues toshare experiences related to the snowfall, and there were evencompetitions to find the best photographs. On the other hand,Twitter acted as a warning channel during the event and thefollowing days, although we found no posts discussing what
Fig. 6. Municipalities that received special grants for payment ofcosts occasioned because of snowfall (Decree 43/2010 of 23 March,DOGC, 2010).
could be done better to prepare for this kind of event or im-prove resilience capabilities.
4 Meteorological analysis
Looking at Table2, the 8 March event was the last snow-fall event of the year (they are usually recorded in Decemberand January). It was characterized by the presence of a deepcold low (COL) at high levels, mainly over Catalonia, with awet advection from the south (Fig.7), while at low and mid-dle levels there was a northeasterly–easterly wet advectiondue to the presence of a mesoscale low over the Catalan-Balearic Sea (Fig.8a). This low was a consequence of theupper level cold trough which favoured a rapid cyclogenesisover the Mediterranean. The position of the COL, embeddedin a deep trough that crossed France, allowed the entrance ofvery cold (−30◦C) and dry continental air at 500 hPa, and thedevelopment of instability in middle and high levels. A keyfactor was the advection of very wet air at 700 and 850 hPafrom the east, which affected the Girona area and favouredthe feed of humid air at middle levels (Fig.8b), and, conse-quently, the development of wet snow. The westward move-ment of this low marked the end of the precipitation event thenext day over Catalonia, although the low temperatures stillremained, freezing the snow that had fallen the day before.
The surface mesoscale low organized the flow at low lev-els over the Catalonian coast, and its location and role weresimilar to those of other heavy rainfall events (e.g. the floodsof June 2000,Milelli et al., 2006). It favoured the advectionof moist and relatively warmer air from the Mediterranean,
432 M. C. Llasat et al.: The snow storm of 8 March 2010 in Catalonia (Spain)
Table 2. Number of news items published byLa Vanguardianewspaper about the worst snow events that have affected Girona and thesurrounding area (in brackets the number of news items published during the first 10 days is shown) and the main material damage andhuman injury in Catalonia (in brackets the inflation-adjusted losses to 2011 Euro values; ESP: Spanish peseta). All the events recorded morethan 40 cm of snow in this province (exception: the 1964 event that is included due to having occurred in March).
Event Snow depth News items in Material damages Deaths(cm) La Vanguardia (M: million)
(min–max)
25 Dec 1962 10–88 (115) > ESP 320 M (64.3) 21 Feb 1963 12–100 (14) > ESP 236 M (43.3) 07 Mar 1964 2–25 (9) Not known 05 Jan 1985 13–40 96 (61) > ESP 4000 M (64.7) 38
30 Jan 1986 6–40 46 (42) > ESP 4000 M (59) 223 Jan 1992 2–68 (12) Not known 01 Mar 1993 3–30 25 (23) Not known 0
14 Dec 2001 20–40 89 (70) > EUR 3.5 M (4.5) 98 Mar 2010 25–59 210 (194) EUR 90 M (92.8) 2
Fig. 7.Temperature and geopotential analysis at 500 hPa at 12:00 UTC, 8 March 2010. ECWMF Model. Source:http://www.eumetrain.org/.
the convergence of water vapour, and the flow from theeast that impinged nearly perpendicularly to the electricitynetwork (favouring a major momentum) extending near thecoast from southwest to northeast. Both the low and the lit-toral mountains triggered convective instability and the de-velopment of thunderstorms. Indeed, radio-sounding analy-sis over Barcelona showed high values of precipitable watermass (9.31 mm) and TT index (total index, 49), indicatinga high probability of thunderstorms (Fig.9). Instability in-dexes such as CAPE (convective available potential energy)and LI (lifted index), however, showed no particular feature.This was one of the main differences in comparison with theusual heavy rainfall events occurring in Catalonia in sum-
mer or autumn, when potential instability is concentrated atthe lowest levels due to the advection of very warm and wetair and a strong gradient of equivalent potential temperature(Llasat, 2009).
The comparison of the main synoptic features that charac-terized the snow events included in Table2, shows a similarsurface pattern for all the events, with low pressures over theIberian Peninsula and the entrance of cold air from easternEurope (as an example, only the reanalysis of the most rep-resentative events is shown, Fig.10). At 500 hPa, the pres-ence of cold air from the northwest over Catalonia is alsocommon, although a cut-off low has been identified onlyon a few occasions (Fig.11). Within this synoptic pattern
M. C. Llasat et al.: The snow storm of 8 March 2010 in Catalonia (Spain) 433
Pressure [Pa] Relative Humidity [%]
Pressure [Pa] Relative Humidity [%]
Fig. 8. (a)Sea level pressure analysis, at 12:00 UTC, 8 March 2010.(b) Analysis of moisture at 700 hPa, at 12:00 UTC 8 March 2010.(NCEP model. Source:http://nomad2.ncep.noaa.gov).
characterized by the entrance of cold, continental air fromthe northeast, the main synoptic differences can be found inthe humidity field at 700 hPa, which on some occasions doesnot reach 60 % (i.e. March 1964, January 1985), and whichappeared to be a determinant factor in the March 2010 event(Fig. 12).
5 Surface analysis
As discussed in the introduction, the formation of wet snowrequires temperatures close to 0◦C, high humidity values andmoderate winds. In order to obtain a regional analysis of thehourly evolution of these variables, we used the SAFRANanalysis (Durand et al., 1993; Quintana-Seguí et al., 2008).SAFRAN is a mesoscale atmospheric analysis system forscreen-level variables. By means of optimal interpolation, itproduces a meteorological hourly analysis of temperature,precipitation, wind speed, relative humidity and cloudinessusing all available ground data observations and the out-puts of a meteorological model. One of its main features
Fig. 9. Radio-sounding analysis over Barcelona at 12:00 UTC,8 March 2010. Source:www.meteo.cat.
is that it is based on climatically homogeneous zones (ar-eas where spatial gradients of meteorological variables arenot very relevant) and is able to reliably take vertical vari-ations into account. SAFRAN is currently operational atMétéo-France and has been widely used in different con-texts, for example, to force land surface and hydrologicalmodels (Habets et al., 2008; Quintana Seguí et al., 2009) oras an observational database for climate downscaling studies(Quintana Seguí et al., 2010; Vidal et al., 2010; Quintana-Seguí et al., 2011). Currently, the SAFRAN analysis sys-tem is being implemented in the northeast of the IberianPeninsula (SAFRAN/NEIP), in collaboration with AEMET(Agencia Estatal de Meteorología, the Spanish MeteorologyAgency), which provides data from their synoptic and cli-matological networks and the outputs of the HIRLAM HNRmeteorological model, to be used as a first guess (Quintana-Seguí et al., 2012). We used the same grid as HIRLAM (5 kmof resolution). The first prototype of the system was imple-mented for the hydrological year September 2009–August2010, and it was thus possible to apply it to the case of8 March 2010. Over Catalonia (defined by the box within0 and 3.4◦ E and 40.5◦ N and 42.9◦ N), the analysis includesdata from 217 precipitation stations and 29 stations whichmeasure the rest of the variables (mainly pressure, tempera-ture, relative humidity and wind). SAFRAN reads and anal-yses the observed data every 6 h (0, 6, 12, and 18:00 UTC),except for precipitation, which is provided daily. These anal-yses are interpolated onto the hourly time step. In the case ofprecipitation, relative humidity is used to establish the hourlydistribution of precipitation (Quintana-Seguí et al., 2008).
The added value of the application of SAFRAN tothis event is to provide mesoscale analysis of near-surface
434 M. C. Llasat et al.: The snow storm of 8 March 2010 in Catalonia (Spain)
a) b)
c) d)
a) b)
c) d)
Fig. 10.Reanalysis showing the mean surface air temperature:(a) 25 December 1962;(b) 5 January 1985;(c) 14 December 2001;(d) 8 March2010. Source: 20th Century Reanalysis, NOAA/ESRL.
a) b)
c) d)
a) b)
c) d)
Fig. 11.Reanalysis showing the mean geopotential at 500 hPa:(a)25 December 1962;(b) 5 January 1985;(c)14 December 2001;(d) 8 March2010. Source: 20th Century Reanalysis, NOAA/ESRL.
M. C. Llasat et al.: The snow storm of 8 March 2010 in Catalonia (Spain) 435
a) b)
c) d)
a) b)
c) d)
Fig. 12. Reanalysis showing the mean relative humidity at 700 hPa:(a) 25 December 1962;(b) 5 January 1985;(c) 14 December 2001;(d) 8 March 2010. Source: 20th Century Reanalysis, NOAA/ESRL.
atmospheric variables in which the observations are checkedfor their quality and that the variables are consistent witheach other, in order to show the main factors responsiblefor the wet snow. Figures13 and 14 show the evolutionof the mean hourly values of relative humidity, tempera-ture and wind at the surface over Catalonia from 12:00 UTC7 March to 18:00 UTC 8 March. These variables are the mostclosely related to the production of wet snow and the asso-ciated damage. At 12:00 UTC on 7 March, the surface hu-midity field did not exceed the value of 60 %, with somepeaks around 70 % over the south of the region and at somepoints of the Pyrenees, where some precipitation occurredin the evening. However, by 18:00 UTC, humidity valueswere higher than 60 % over the entire region and higher than90 % at 00:00 UTC on 8 March. At 06:00 UTC on 8 March,the maximum values moved towards the northeast and awide region registered values near 100 % from 10:00 until19:00 UTC. On the following day, maximum values of rela-tive humidity were recorded inside the region.
Surface temperature was very low the days before thesnow event, and the 0◦C level reached the south of Catalo-nia. However, during the morning of 7 March, warm air wasadvected over the country, displacing the icing level back tothe Pyrenees, with temperatures on the Girona coast above12◦C. As a consequence of the arrival of a cold front, temper-atures decreased markedly on 8 March: the northwest part of
the region and Pyrenees dropped below−6◦C, and the coastrecorded values ranging between 0 and 2◦C. These low tem-peratures persisted in the north of the region until 10 March.
A weak wind field dominated the entire region on 7 March,with hourly velocities of less than 1 ms−1. However, at22:00 UTC, the situation changed completely, and easterlywinds with average hourly values above 3 ms−1 started toaffect the entire coast, with maxima above 7 ms−1 in someareas. On the afternoon of 8 March, the presence of a regionwith weaker hourly winds gave way to a discontinuous dis-tribution, broken on the Girona coast, where values were lessthan 2 ms−1. This discontinuity disappeared some hours laterwhen the strongest winds affected the entire coast. Weak pre-cipitation started on the night of 7–8 March, and relativelyheavy precipitation was recorded at 07:00 UTC 8 March,with hourly intensities near 8 mmh−1 on the Girona coast.
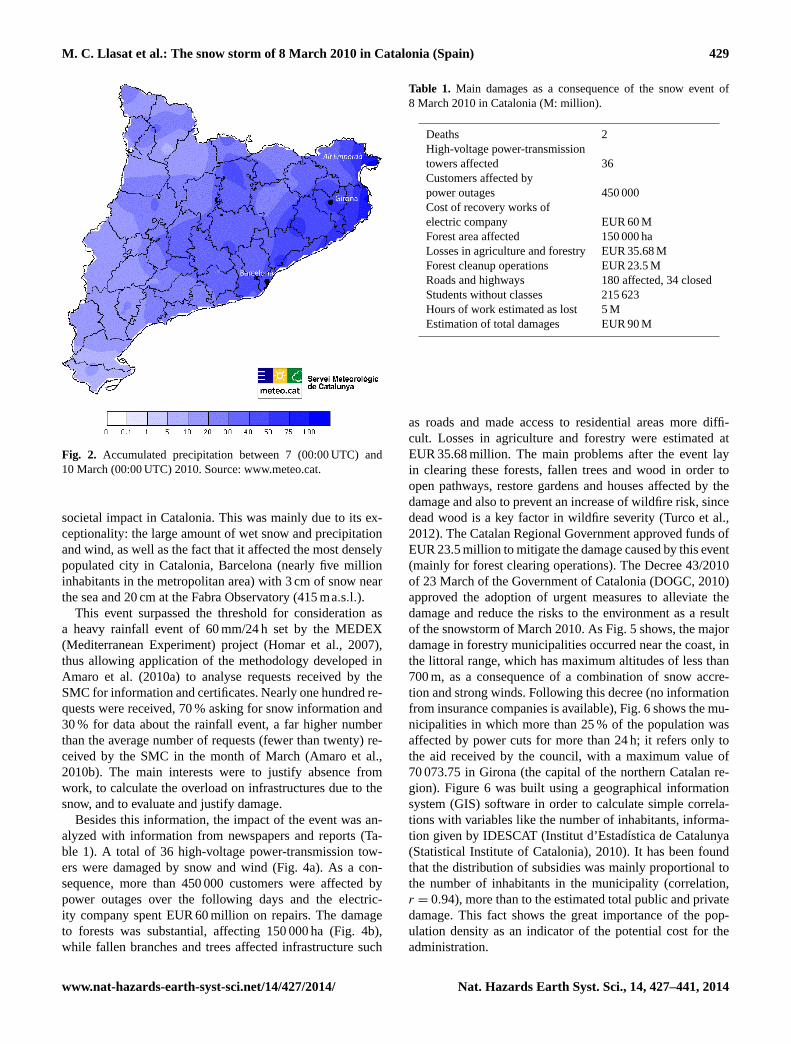
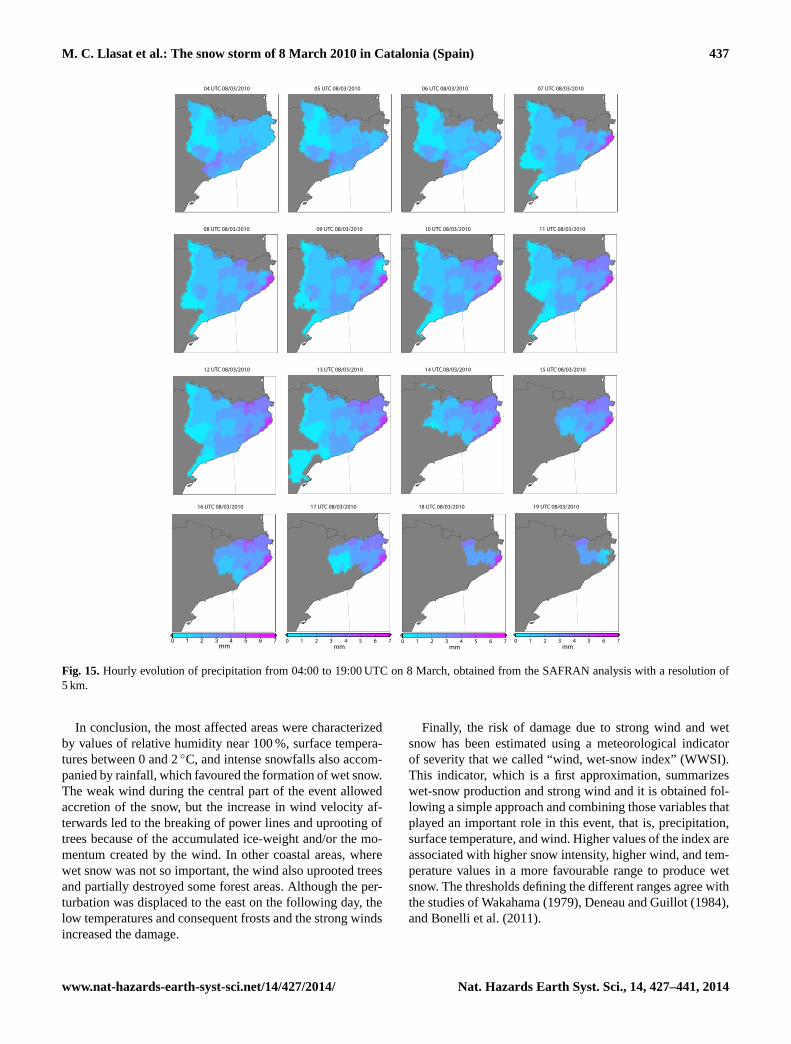
The configuration of the total precipitation field did notchange until 16:00 UTC (Fig.15), and then the hourly max-imum values moved to the central part of the region. Thefirst snowfalls started inland on the night of 7 March, andby 06:00 UTC they had already reached the sea south ofBarcelona. From 10:00 until 16:00 UTC, maximum snowfallintensity was recorded over the Girona coast (Fig.16), and,locally, liquid precipitation was also recorded. This combina-tion facilitated the heavy density of the snow and the damageit caused to the electricity network and trees.
436 M. C. Llasat et al.: The snow storm of 8 March 2010 in Catalonia (Spain)
12 U
TC 0
7/03
/201
018
UTC
07/
03/2
010
00 U
TC 0
8/03
/201
0
Temperature Rel. Humidity Wind
−12−10−8 −6 −4 −2 0 2 4 6 8 10 12°C
20 30 40 50 60 70 80 90 100% 0 3 6 9 12 15
m/s
Fig. 13. Evolution of mean hourly values of temperature, relative humidity and wind at the surface over Catalonia from 12:00 UTC on7 March to 00:00 UTC on 8 March. The analysis has been obtained from the SAFRAN analysis with a resolution of 5 km.
−12−10−8 −6 −4 −2 0 2 4 6 8 10 12°C
06 U
TC 0
8/03
/201
012
UTC
08/
03/2
010
18 U
TC 0
8/03
/201
0
20 30 40 50 60 70 80 90 100%
0 3 6 9 12 15m/s
Temperature Rel. Humidity Wind
Fig. 14.Evolution of mean hourly values of temperature, relative humidity and wind at the surface over Catalonia from 06:00 to 18:00 UTC8 March. The analysis has been obtained from the SAFRAN analysis with a resolution of 5 km.
M. C. Llasat et al.: The snow storm of 8 March 2010 in Catalonia (Spain) 437
04 UTC 08/03/2010 05 UTC 08/03/2010 06 UTC 08/03/2010 07 UTC 08/03/2010
08 UTC 08/03/2010 09 UTC 08/03/2010 10 UTC 08/03/2010 11 UTC 08/03/2010
12 UTC 08/03/2010 13 UTC 08/03/2010 14 UTC 08/03/2010 15 UTC 08/03/2010
16 UTC 08/03/2010 17 UTC 08/03/2010 18 UTC 08/03/2010 19 UTC 08/03/2010
0 1 2 3 4 5 6 7mm
0 1 2 3 4 5 6 7mm
0 1 2 3 4 5 6 7mm
0 1 2 3 4 5 6 7mm
Fig. 15.Hourly evolution of precipitation from 04:00 to 19:00 UTC on 8 March, obtained from the SAFRAN analysis with a resolution of5 km.
In conclusion, the most affected areas were characterizedby values of relative humidity near 100 %, surface tempera-tures between 0 and 2◦C, and intense snowfalls also accom-panied by rainfall, which favoured the formation of wet snow.The weak wind during the central part of the event allowedaccretion of the snow, but the increase in wind velocity af-terwards led to the breaking of power lines and uprooting oftrees because of the accumulated ice-weight and/or the mo-mentum created by the wind. In other coastal areas, wherewet snow was not so important, the wind also uprooted treesand partially destroyed some forest areas. Although the per-turbation was displaced to the east on the following day, thelow temperatures and consequent frosts and the strong windsincreased the damage.
Finally, the risk of damage due to strong wind and wetsnow has been estimated using a meteorological indicatorof severity that we called “wind, wet-snow index” (WWSI).This indicator, which is a first approximation, summarizeswet-snow production and strong wind and it is obtained fol-lowing a simple approach and combining those variables thatplayed an important role in this event, that is, precipitation,surface temperature, and wind. Higher values of the index areassociated with higher snow intensity, higher wind, and tem-perature values in a more favourable range to produce wetsnow. The thresholds defining the different ranges agree withthe studies ofWakahama(1979), Deneau and Guillot(1984),andBonelli et al.(2011).
438 M. C. Llasat et al.: The snow storm of 8 March 2010 in Catalonia (Spain)
0 5 10 15 20 25 30 35 40 45 50
mm
Fig. 16. Total snow recorded between 10:00 and 16:00 UTC on8 March, obtained from the SAFRAN analysis with a resolutionof 5 km.
First an hourly index (WWSIh) is calculated as follows:
WWSIh = SNOW· TEMP· WIND, (1)
where
− SNOW= 1 (if snow intensity≥ 0.1cmh−1),
2 (if snow≥ 0.2cmh−1),
3 (if snow ≥ 0.4cmh−1),
4 (if snow>= 0.6cmh−1);
− TEMP = 0 (if T < −4 or > 4◦C),
1 (−4 ≤ T < −1 or 2< T ≤ 4),
2 (if − 1 ≤ T < 2);
− WIND = 1 (if W < 15kmh−1),
2 (if 15 ≤ W < 30),
3 (if W ≥ 30kmh−1).
Then, a daily (WWSI) index is calculated as follows:
WWSI = 100·
∑i=1,24
WWSIhi
576, (2)
where 576 is the maximum daily possible score (24× 24).Thus, the scale of the WWSI index goes from 0 to 100.
Fig. 17.Distribution of the wind, wet-snow index (WWSI) for Cat-alonia on 8 March 2010, calculated from SAFRAN analysis fields.
Figure17 shows the WWSI index for 8 March 2010. Thisindicator tells us which were the areas with wet snow andstrong wind, which gives us a good approximation of theprobability of suffering damage as a consequence of the haz-ard and therefore allows us to estimate its geographical distri-bution (see Figs. 5 and 6). However, it cannot be directly cor-related with the governmental subsidies at a local level, dueto the complexity of the factors involved – not only in termsof vulnerability and exposure – but also because of sociopo-litical decisions, as we commented previously. In addition,the impossibility of having complete information about theevaluation of total damage prevents finding any quantitativemetric or spatial similarity.
This approach is an example of a simple application thathighlights the importance of having mesoscale reanalysisfields, such as those provided by SAFRAN, to calculate anaggregated index that summarizes important aspects relatedto the atmospheric events.
6 Conclusions
The snowfall and heavy precipitation event of 8 March 2010in Catalonia (NE Spain) was analyzed. It could be consid-ered an exceptional severe snowfall event. Its exceptionalitywas due to four factors: (i) it was unusual for the time ofthe year; (ii) it affected mainly the coastal region, the mostpopulated area; (iii) it was accompanied by thunderstorms;and (iv) it produced wet snow and strong winds that causedsubstantial damage.
M. C. Llasat et al.: The snow storm of 8 March 2010 in Catalonia (Spain) 439
Since it affected the most populated region in Cataloniathrough the breakage of power lines (as a consequence of thewet snow and the wind), the event caused damage exceed-ing EUR 90 million (the highest cost of a snow event in thelast 50 yr), high numbers of injured people and two deaths.It was the snow event with the highest number of press re-ports (210 news items), and the first recorded in Spain af-ter the emergence of Web2.0 (it was called “Snowfall 2.0”).There was a consequent strong impact on social networks andthe Internet, with more than 81 600 inputs (in Spanish) onGoogle, 132 groups and pages on Facebook and 750 amateurvideos on YouTube. However, these were mainly devotedto sharing amusing experiences, to damage-related claims(mainly due to power cuts) and to showing eye-catchingpictures. Unfortunately, the population showed little interestin improving its role in prevention and resilience for futureevents.
This event was unusual from a meteorological point ofview as well. A mesoscale low over the Catalan-BalearicSea and humid and warm advection at low levels is typi-cal of heavy precipitation events in Catalonia. The presenceof a trough at high levels, associated with a very cold low,with cold air advection over northern Catalonia, is typical ofsnowfall events. The singularity of this event lies in the com-bination of these factors. Indeed, there was a moist advec-tion in the middle and lower troposphere (below 500 hPa),which fed the convection and produced intense precipita-tion. Due to low temperatures, this precipitation was solid(snow), with a high water content, which is very unusual.The mesoscale low was responsible for organizing the flowand triggering convection. Its position caused heavier precip-itation in Girona. Thunderstorms were produced by convec-tion embedded in stratiform rainfall, with cloud tops of 8 km.The stationarity of the thunderstorms allowed the accumula-tion of high quantities of rainfall and snow.
The application of the SAFRAN analysis, which in thiscase provided hourly data with around 5 km of resolution,made it possible to follow the evolution of the event at thesurface and search for the meteorological causes of the maindamage. The most affected areas were characterized by val-ues of relative humidity near 100 %, surface temperatures be-tween 0 and 2◦C, and intense snowfalls also accompanied byrainfall, which favoured the formation of wet snow. The weakwind velocity during the central part of the event allowed theaccretion of wet snowflakes on power lines, although the in-crease in wind velocity afterwards favoured the interruptionof electricity networks and the uprooting of trees.
In this paper we discuss a meteorological indicator ofseverity that combines wet-snow production and strong wind,due to their important role in this event. This indicator, whichwe called the wind, wet-snow index (WWSI), is a first ap-proximation. It is obtained following a simple approach, con-sidering higher values of the index associated with highersnow intensity, higher wind, and temperature values in amore favourable range to produce wet snow (according to
Wakahama, 1979; Deneau and Guillot, 1984; Bonelli et al.,2011). Given the limitations of the data available (SAFRANis available in the NE of Spain, only for the hydrologicalyear 2009–2010), it is not possible to carry out an extensivevalidation of this index, thus making it just qualitative. Fur-ther investigation is needed to understand the applicability ofthis index to other cases and regions. For example, it wouldbe interesting to assess statistically, using linear multiregres-sion, the significance of different meteorological variables,like snow intensity, temperature or wind speed, related to theestimated damage/impact of wet snow. In that case it could bepossible to find a hierarchy amongst the parameters, assess-ing which are the most important with respect to the others,instead than deciding subjectively the weight of meteorolog-ical variables. Besides this, future work points to the defini-tion of a risk, wind and wet-snow index, that also considersaspects related with vulnerability and exposure, like popu-lation density, concentration of vulnerable structures and soon.
Acknowledgements.This work was supported by the DRIHM(Distributed Research Infrastructure for Hydro-Meteorology)Project no. 283568 UE Framework Programme 7, and partiallyfunded by the Project of Interest “NextData” of the Italian Ministryfor Education, University and Research. We are most grateful tothe Spanish Meteorology Agency AEMET and the MeteorologicalService of Catalonia (SMC) for their support with data and maps.Our thanks to Joan Gilabert for his collaboration in applying theGIS and looking for some information. We would like to thank thecareful work made by the editor and the referees’ comments andsuggestions in helping to improve this paper.
Edited by: S. DavolioReviewed by: three anonymous referees
References
Admirat, P., Lapeyre, J. L., Maccagnan, M., and De Goncourt, B.:The mapping of wet snow sticking on power lines over a periodof 35 years, in: Proc. 4th International Workshop on AtmosphericIcing of Structures, Paris, IWAIS, 1988.
Amaro, J., Gayà, M., Aran, M., and Llasat, M. C.: Pre-liminary results of the Social Impact Research Group ofMEDEX: the request database (2000–2002) of two Meteoro-logical Services, Nat. Hazards Earth Syst. Sci., 10, 2643–2652,doi:10.5194/nhess-10-2643-2010, 2010a.
Amaro, J., Llasat, M. C., and Aran, M.: The social impact of thesnowfall of 8 March 2010 in Catalonia, in: 12th Plinius Confer-ence on Mediterranean Storms, Corfu Island, Greece, 2010b.
Bech, J., Pineda, N., Rigo, T., and Aran, M.: Remote sens-ing analysis of a Mediterranean thundersnow and low-altitude heavy snowfall event, Atmos. Res., 123, 305–322,doi:10.1016/j.atmosres.2012.06.021, 2012.
440 M. C. Llasat et al.: The snow storm of 8 March 2010 in Catalonia (Spain)
Bonelli, P. and Lacavalla, M.: Trends in snow deposition on over-head electric lines: using synoptic data to investigate the relation-ship black-out risk/climate change, in: Management of Weatherand Climate Risk in the Energy Industry, edited by: Troccoli A.,Springer, 3–12, 2009.
Bonelli, P., Lacavalla, M., Marcacci, P., Mariani, G., and Stella, G.:Wet snow hazard for power lines: a forecast and alert systemapplied in Italy, Nat. Hazards Earth Syst. Sci., 11, 2419–2431,doi:10.5194/nhess-11-2419-2011, 2011.
Campins, J., Genovés, A., Picornell, M. A., and Jansà, A.: Climatol-ogy of Mediterranean cyclones using the ERA-40 dataset, Int. J.Climatol., 31, 1596–1614, 2011.
Dao, H. and Peduzzi, P.: Global evaluation of human risk and vul-nerability to natural hazards, Enviroinfo 2004, Sh@ring, Editionsdu Tricorne, Geneve, I, 435–446, 2004.
Deneau, V. and Guillot, P.: Wet-snow accretion on power lines, Car-tographic examination of risks throughout France, La HouilleBlanche, 6–7, 465–474, 1984.
DOGC – Diario Oficial de la Generalitat de Catalunya: DECRET43/2010, de 23 de març, pel qual s’aproven mesures urgents perpal˙liar els danys ocasionats i reduir els riscos al medi naturalamb motiu del temporal de neu de març de 2010, 2010 (in Cata-lan).
Durand, Y., Brun, E., Merindol, L., Guyomarc’h, G., Lesaffre, B.,and Martin, E.: A meteorological estimation of relevant parame-ters for snow models, Ann. Glaciol., 18, 65–71, 1993.
EUMeTrain, EUMETSAT, available at:http://www.eumetrain.org/,last access: 10 October 2013.
Farzaneh, M.: Atmospheric Icing of Power Networks, Springer,2008.
Habets, F., Boone, A., Champeaux, J. L., Etchevers, P., Fran-chistéguy, L., Leblois, E., Ledoux, E., Le Moigne, P., Martin, E.,Morel, S., Noilhan, J., Quintana Seguí, P., Rousset-Regimbeau,F., and Viennot, P.: The SAFRAN-ISBA-MODCOU hydrome-teorological model applied over France, J. Geophys. Res., 113,D06113, doi:10.1029/2007JD008548, 2008.
Homar, V., Jansà, A., Campins, J., Genovès, A., and Ramis, C.: To-wards a systematic climatology of sensitivities of Mediterraneanhigh impact weather: a contribution based on intense cyclones,Nat. Hazards Earth Syst. Sci., 7, 445–454, doi:10.5194/nhess-7-445-2007, 2007.
Institut d’Estadística de Catalunya (Statistical Institute of Catalo-nia): Anuari estadístic de Catalunya (Statistical Yearbook of Cat-alonia), available at:http://www.idescat.cat/, last access: 10 Oc-tober 2013, 2010 (in Spanish).
Llasat, M. C.: An objective classification of rainfall events on thebasis of their convective features: application to rainfall intensityin the northeast of Spain, Int. J. Climatol., 21, 1385–1400, 2001.
Llasat, M. C.: High magnitude storms and floods, in: The Physi-cal Geography of the Mediterranean, edited by: Woodward, J.,Oxford University Press, Oxford, New York, 513–540, 2009.
Llasat, M. C., Rigo, T., and Barriendos, M.: The “Montserrat-2000”flash-flood event: a comparison with the floods that have oc-curred in the northeastern Iberian Peninsula since the 14th cen-tury, Int. J. Climatol., 23, 453–469, 2003.
Llasat, M. C., Llasat-Botija, M., and López, L.: A press databaseon natural risks and its application in the study of floods inNortheastern Spain, Nat. Hazards Earth Syst. Sci., 9, 2049–2061,doi:10.5194/nhess-9-2049-2009, 2009.
Meteorological Service of Catalonia, SMC, available at:http://www.meteo.cat, last access: 10 October 2013.
Milelli, M., Llasat, M. C., and Ducrocq, V.: The cases of June2000, November 2002 and September 2002 as examples ofMediterranean floods, Nat. Hazards Earth Syst. Sci., 6, 271–284,doi:10.5194/nhess-6-271-2006, 2006.
National Centers for Environmental Prediction (NCEP), NOAA:available at: http://www.nomad2.ncep.noaa.gov, last access:10 October 2013.
Periódico, El: available at:http://www.elperiodico.com, last access:10 October 2013.
Pascual, R., Callado, A., and Berenguer, M.: Analysis of a strongsnowstorm in Catalonia on December 2001, in: Preprints of the31st Conference on Radar Meteorology, Seattle (EEUU), 882–884, 2003.
Petrucci, O. and Pasqua, A. A.: The study of past damaging hy-drogeological events for damage susceptibility zonation, Nat.Hazards Earth Syst. Sci., 8, 881–892, doi:10.5194/nhess-8-881-2008, 2008.
Prohom, M. and Herrero, M.: Towards the creation of a climaticdatabase for Catalonia (18th to 21st centuries), Tethys, 5, 3–11,doi:10.3369/tethys.2008.5.01, 2008.
Quintana-Seguí, P., Le Moigne, P., Durand, Y., Martin, E., Habets,F., Baillon, M., Canellas, C., Franchisteguy, L., and Morel, S.:Analysis of Near-Surface Atmospheric Variables: Validation ofthe SAFRAN Analysis over France, J. Appl. Meteorol. Clim.,47, 92–107, 2008.
Quintana Seguí, P., Martin, E., Habets, F., and Noilhan, J.: Im-provement, calibration and validation of a distributed hydrolog-ical model over France, Hydrol. Earth Syst. Sci., 13, 163—181,doi:10.5194/hess-13-163-2009, 2009.
Quintana Seguí, P., Ribes, A., Martin, E., Habets, F., and Boé, J.:Comparison of three downscaling methods in simulating the im-pact of climate change on the hydrology of Mediterranean basins,J. Hydrol., 383, 111–124, 2010.
Quintana-Seguí, P., Habets, F., and Martin, E.: Comparison of pastand future Mediterranean high and low extremes of precipita-tion and river flow projected using different statistical down-scaling methods, Nat. Hazards Earth Syst. Sci., 11, 1411–1432,doi:10.5194/nhess-11-1411-2011, 2011.
Quintana-Seguí, P., Pérez, J., Peral, C., Turco, M., Llasat, M., andMartin, E.: Validation of the SAFRAN meteorological analysissystem in the Northeast of Spain, Geophysical Research Ab-stracts, EGU General Assembly, Vienna, Austria, 22–27 April2012, EGU2012-8137, 2012.
Rigo, T. and Llasat, M. C.: A methodology for the classifica-tion of convective structures using meteorological radar: Appli-cation to heavy rainfall events on the Mediterranean coast ofthe Iberian Peninsula, Nat. Hazards Earth Syst. Sci., 4, 59–68,doi:10.5194/nhess-4-59-2004, 2004.
Rigo, T. and Llasat, M. C.: Analysis of mesoscale convective sys-tems in Catalonia using meteorological radar for the period1996–2000, Atmos. Res., 83, 458–472, 2007.
Turco, M., Llasat, M., von Hardenberg, J., and Provenzale, A.: Im-pact of climate variability on summer fires in a Mediterraneanenvironment (northeastern Iberian Peninsula), Climatic Change,1–14, 2012.
Vidal, J.-P., Martin, E., Franchistéguy, L., Habets, F., Soubeyroux,J.-M., Blanchard, M., and Baillon, M.: Multilevel and multiscale
M. C. Llasat et al.: The snow storm of 8 March 2010 in Catalonia (Spain) 441
drought reanalysis over France with the Safran-Isba-Modcou hy-drometeorological suite, Hydrol. Earth Syst. Sci., 14, 459–478,doi:10.5194/hess-14-459-2010, 2010.
Vilaclara, E., Segalà, S., Andrés, A., and Aran, M.: Operationalwarnings issued by the SMC in the 8th March snow event inCatalonia, in: 12th Plinius Conference on Mediterranean Storms,Corfu Island, Greece, 2010.
Wakahama, G.: Experimental studies of wet snow accretion on elec-trical lines developed in a strong wind, Journal of Natural Disas-ter Science, 1, 21–33, 1979.