The Social Bases of Abortion Attitudes Elizabeth Addell Cook Ted G. Jelen Clyde Wilcox Most of this book will offer explanations for differences in abortion attitudes in the mass public. In this chapter, we describe social group differences in abortion attitudes. How do members of various social groups differ in their attitudes toward abortion? Do young people have different attitudes than their parents and grandparents? Do men think differently than do women? Do blacks and whites have different attitudes? Do the rich and poor think differently, or southerners and those who live in the northeast? What are the group bases of abortion attitudes? Social characteristics are often useful predictors of attitudes. Might members of various social groups hold different political attitudes? First, members of social groups have different objective interests. Impoverished Americans are more likely to favor spending on social programs, at least in part because they are more likely to benefit from them. Wealthy Americans are more likely to favor cuts in the capital gains tax rate because such an action would decrease their tax bill, but it would have little direct effect on the tax payments of the working poor. Parents of small children favor more spending for schools because their children will benefit, whereas retired Americans are less supportive of spending on education because they will not benefit directly. Of course, self-interest is not the only explanation for social group differ- ences. Various social groups have different life experiences and may be socialized into different roles in society. Affluent blacks may be more supportive of govern- ment spending on social programs than affluent whites because they encounter friends and relatives who benefit from these programs. Men may be less willing than women to support programs for the disadvantaged because they are less likely to be encouraged to show sympathy toward others. Those with a college education have experienced an entirely different type of socialization than those who did not finish high school. This socialization can lead those with college degrees to be more tolerant of those with whom they disagree and to be more sup- portive of gender and racial equality. Of course, many social group (or demographic) differences in attitudes are attributable to other factors. For example, southerners are more likely to hold orthodox religious beliefs, and older citizens are more likely to approve of distinct and unequal sex roles. When we find that southerners are less supportive of legal abortion than northerners, therefore, this may be due to greater religiosity among southerners. In the next two chapters we will focus on the attitudinal and religious Reprinted from “The Social Bases of Abortion Attitudes,” Chapter 2 in Between Two Absolutes: Public Opinion and the Politics of Abortion, Elizabeth Addell Cook, Ted G. Jelen, and Clyde Wilcox, 1992. Used by permission. E-Appendix H: Readings 9
Transcript
The Social Bases of Abortion Attitudes
Elizabeth Addell Cook
Ted G. Jelen
Clyde Wilcox
Most of this book will offer explanations for differences in abortion attitudes inthe mass public. In this chapter, we describe social group differences in abortionattitudes. How do members of various social groups differ in their attitudestoward abortion? Do young people have different attitudes than their parents andgrandparents? Do men think differently than do women? Do blacks and whiteshave different attitudes? Do the rich and poor think differently, or southerners andthose who live in the northeast? What are the group bases of abortion attitudes?
Social characteristics are often useful predictors of attitudes. Might membersof various social groups hold different political attitudes? First, members of socialgroups have different objective interests. Impoverished Americans are more likelyto favor spending on social programs, at least in part because they are more likelyto benefit from them. Wealthy Americans are more likely to favor cuts in thecapital gains tax rate because such an action would decrease their tax bill, but itwould have little direct effect on the tax payments of the working poor. Parents ofsmall children favor more spending for schools because their children willbenefit, whereas retired Americans are less supportive of spending on educationbecause they will not benefit directly.
Of course, self-interest is not the only explanation for social group differ-ences. Various social groups have different life experiences and may be socializedinto different roles in society. Affluent blacks may be more supportive of govern-ment spending on social programs than affluent whites because they encounterfriends and relatives who benefit from these programs. Men may be less willingthan women to support programs for the disadvantaged because they are lesslikely to be encouraged to show sympathy toward others. Those with a collegeeducation have experienced an entirely different type of socialization than thosewho did not finish high school. This socialization can lead those with collegedegrees to be more tolerant of those with whom they disagree and to be more sup-portive of gender and racial equality.
Of course, many social group (or demographic) differences in attitudes areattributable to other factors. For example, southerners are more likely to holdorthodox religious beliefs, and older citizens are more likely to approve of distinctand unequal sex roles. When we find that southerners are less supportive of legalabortion than northerners, therefore, this may be due to greater religiosity amongsoutherners. In the next two chapters we will focus on the attitudinal and religious
Reprinted from “The Social Bases of Abortion Attitudes,” Chapter 2 in Between Two Absolutes:Public Opinion and the Politics of Abortion, Elizabeth Addell Cook, Ted G. Jelen, and ClydeWilcox, 1992. Used by permission.
E-Appendix H: Readings 9
Adventures in Social Research10
basis of these group differences. Similarly, when we find that the oldest citizensare less supportive of legal abortion than those who grew up during or after the1960s, this may be due to the traditional views of the oldest Americans on the roleof women in families. In this chapter, we will first present an overview of abor-tion attitudes in America, then discuss social group differences in support for andopposition to legal abortion.
Attitudes toward Legal Abortion:Methods of Analysis
In almost every year since 1972, the National Opinion Research Center (NORC)at the University of Chicago has conducted a national survey of social and polit-ical attitudes. This General Social Survey (GSS)1 has included a battery of sixquestions measuring support for legal abortion. These items ask respondentswhether they believe that it should be possible for a pregnant woman to obtain alegal abortion:
■ if there is a strong chance of serious defect in the baby
■ if she is married and does not want more children
■ if the woman’s own health is seriously endangered by the pregnancy
■ if the family has a very low income and cannot afford any more children
■ if she became pregnant as a result of rape
■ if she is not married and does not want to marry the man
These six items can be used to measure attitudes toward legal abortion. Bycounting the number of circumstances under which each respondent supportslegal abortion, we have created a scale that runs from 0 (when the respondentapproves of abortion under no circumstances) to 6 (when he or she approves ofabortion in all six circumstances).
Because these questions have been asked for eighteen years, we were able toexamine changes in attitudes toward abortion. Throughout this book, we gener-ally concentrate our analysis on recent attitudes (the GSS surveys from 1987through 1991). When attitudes or relationships have changed over time, however,we report and try to explain those changes. These GSS data constitute the core ofour analysis, but we use other survey data when they are needed to more fullydescribe abortion attitudes.
Statistical analysis reveals that the public sees these six questions as measur-ing two related but distinct attitudes: support for abortion in circumstances ofphysical trauma (where the mother’s health is in danger, where the fetus is seri-ously defective, or when the pregnancy results from rape) and support for abor-tion in social, more “elective” circumstances (poverty, when an unmarried womandoes not want to marry the father, or when a married couple wants no more chil-dren). In this book we refer to these sets of circumstances as traumatic abortionand elective abortion.2
E-Appendix H: Readings 11
Because each set of circumstances contains three separate questions, thescales we have created to measure these attitudes range from 0 (when the respon-dent supports abortion in none of the circumstances) to 3 (when the respondentfavors abortion in all three circumstances). For most purposes, we simply reportrelationships involving the combined abortion scale. We use the traumatic/elec-tive distinction when the pattern of relationships differs for the two componentsof abortion attitudes.
The distinction between traumatic and elective circumstances is an importantone to public attitudes, but most abortions in the United States are done for elec-tive reasons. A very recent survey of abortion patients revealed that only sevenpercent listed one of the three traumatic reasons as their primary reason for gettingan abortion. Most abortion patients indicated financial problems, the desire toavoid raising a child outside of marriage, or their belief that they were not yetmature enough to raise a child as their primary reason for obtaining an abortion.3
In this book, we divide Americans into three groups: pro-life respondents whooppose abortion in all six circumstances, pro-choice citizens who favor legalabortion in each circumstance, and situationalists who think abortion should belegal in some but not all circumstances. We make more precise distinctions amongthe situationalists in Chapter 5.
Abortion Attitudes: An Overview
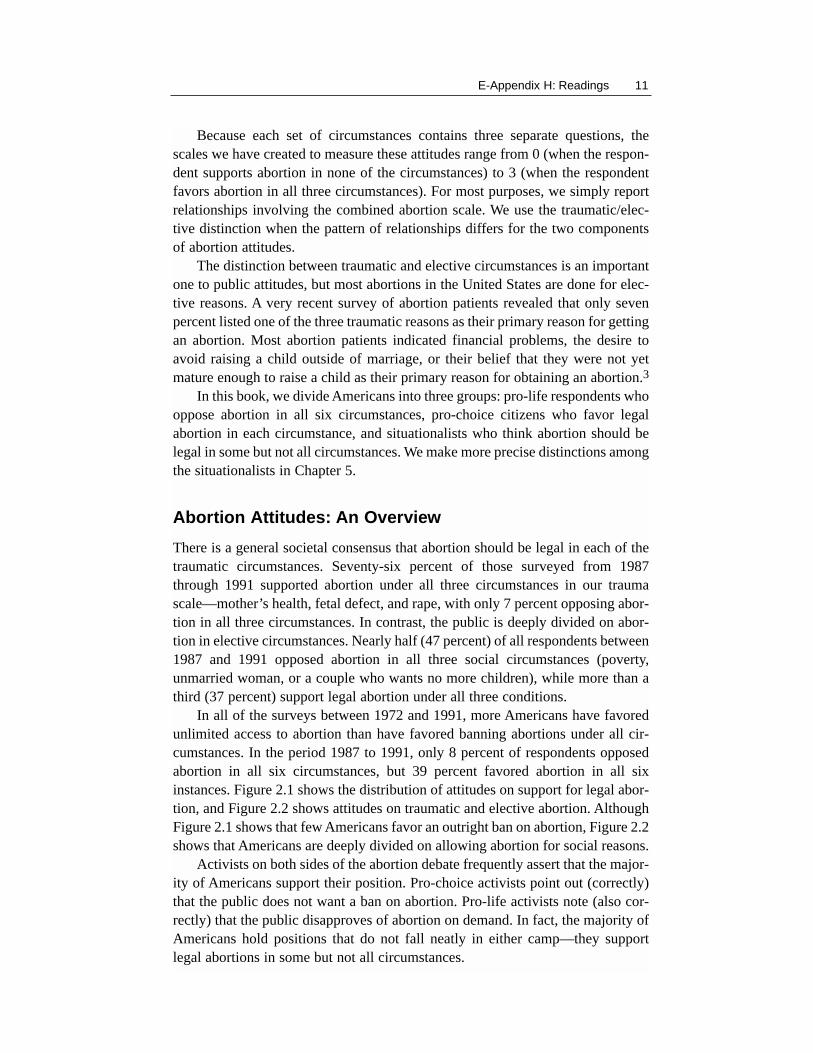
There is a general societal consensus that abortion should be legal in each of thetraumatic circumstances. Seventy-six percent of those surveyed from 1987through 1991 supported abortion under all three circumstances in our traumascale—mother’s health, fetal defect, and rape, with only 7 percent opposing abor-tion in all three circumstances. In contrast, the public is deeply divided on abor-tion in elective circumstances. Nearly half (47 percent) of all respondents between1987 and 1991 opposed abortion in all three social circumstances (poverty,unmarried woman, or a couple who wants no more children), while more than athird (37 percent) support legal abortion under all three conditions.
In all of the surveys between 1972 and 1991, more Americans have favoredunlimited access to abortion than have favored banning abortions under all cir-cumstances. In the period 1987 to 1991, only 8 percent of respondents opposedabortion in all six circumstances, but 39 percent favored abortion in all sixinstances. Figure 2.1 shows the distribution of attitudes on support for legal abor-tion, and Figure 2.2 shows attitudes on traumatic and elective abortion. AlthoughFigure 2.1 shows that few Americans favor an outright ban on abortion, Figure 2.2shows that Americans are deeply divided on allowing abortion for social reasons.
Activists on both sides of the abortion debate frequently assert that the major-ity of Americans support their position. Pro-choice activists point out (correctly)that the public does not want a ban on abortion. Pro-life activists note (also cor-rectly) that the public disapproves of abortion on demand. In fact, the majority ofAmericans hold positions that do not fall neatly in either camp—they supportlegal abortions in some but not all circumstances.
Adventures in Social Research12
The narrow majority of Americans in every survey favored limited legal accessto abortion. Between 1987 and 1991, 53 percent favored some limitations onaccess to abortion without an outright ban. A majority of those who favored limitedaccess to abortion favored allowing it in all three of the traumatic circumstances,but in none of the three elective circumstances. Thus, neither the pro-life nor pro-choice movement has the support of an absolute majority of Americans.4
Percentage of Respondents
40
30
20
10
0None One Two Three Four Five Six
# CIRCUMSTANCES FOR LEGAL ABORTION
Percentage of Respondents
80
60
40
20
0None One Two Three
# CIRCUMSTANCES FOR LEGAL ABORTION
Figure 2.2. Respondents Favoring Abortion in Elective and TraumaticCircumstancesSOURCE: Compiled from the General Social Survey, 1987–1991.
Figure 2.1. Respondents Favoring Abortion in Zero to Six CircumstancesSOURCE: Compiled from the General Social Survey, 1987–1991.
Elective Traumatic
E-Appendix H: Readings 13
Figure 2.3 shows public attitudes toward legal abortion since 1972. The linesare remarkably flat, suggesting that abortion attitudes are generally stable in theaggregate.5 For eighteen years, the “average” position on abortion has hoverednear allowing abortion in four of the six possible circumstances, allowing abor-tions in between two and three traumatic circumstances, approving of abortion inbetween one and two elective circumstances.
Figure 2.3. Mean Level of Support For Legal Abortion under Various ConditionsSOURCE: Compiled from the General Social Survey, 1987–1991.
Elective Abortion . Traumatic Abortion Total Abortion *
Figure 2.4 shows support for legal abortion since 1972 plotted on a narrowerrange that emphasizes the small changes in attitudes over time. A closer lookreveals that support increased in 1973 after the Roe v. Wade decision andremained relatively high until the early 1980s, when support declined. Thisdecline was greatest in support for elective abortion. After 1989, support for legalabortion increased again to levels that nearly matched those of the 1970s.
It may be that the decline in support for legal abortion in the early 1980s wasinfluenced by the strong pro-life position of President Ronald Reagan. Duringthis period, the percentage of those taking a pro-life position did not increase nordid the percentage of pro-choice citizens markedly decrease; instead thoseAmericans who supported abortion in some but not all circumstances reduced thenumber of circumstances under which they favored legal abortion.
An explanation for the recent increase in support is less obvious. Data fromCBS News/New York Times public opinion polls from 1985 through 1989 revealthat support began to gradually build in mid-1987 but jumped sharply betweenJuly 1988 and January 1989. This change occurred before the Webster decision,so that decision could not have led to attitude change.
Some analysts have argued that public support for legal abortion increased inanticipation of a Supreme Court ruling of greater limits on legal abortion.6 We
Mean Abortion Attitude
80 81
Adventures in Social Research14
think this unlikely. It is true that with each new conservative Court nomination(especially Judge Robert Bork), the uncertain future of Roe was prominently dis-cussed in the media. Yet the public did not pay close attention to the policy impli-cations of Supreme Court confirmation debates.
If the increased support for legal abortion in 1989 was due to the anticipationthat Webster would return the abortion issue to state legislatures, attitude changeshould be larger among those who would be most likely to have heard of thepending case. In fact, attitude change was slightly lower among the best educatedrespondents and among those who regularly read a newspaper. Moreover, datafrom a national opinion poll by CBS News/New York Times in autumn 1989revealed that more than 70 percent of the public were not aware of the Websterdecision soon after the opinion was handed down. We interpret these data tosuggest that the public did not increase in support for legal abortion in anticipa-tion of future Court decisions that would restrict Roe, but there is insufficientsurvey data to test this hypothesis fully. It is possible, however, that the increas-ing support for legal abortion since 1989 is in part a response to continued mediaattention to the changing membership of the U.S. Supreme Court and to the likelyoverruling of Roe, and to visible organized activity by pro-choice groups. If Roeis overturned soon, this would suggest further increases in the numbers of pro-choice citizens.
We have seen that the public is generally supportive of legal abortion for cir-cumstances that involve physical trauma, but deeply divided over circumstancesthat are more social in origin. In 1990, ABC News surveyed the general public todetermine their willingness to personally undergo an abortion under a series ofdifferent circumstances. The questionnaire listed seven distinct circumstances,
Figure 2.4. Mean Level of Support for Legal Abortion: A Closer LookSOURCE: Compiled from the General Social Survey, 1987–1991.
Year
E-Appendix H: Readings 15
ranging from a painful disease that would cause the child’s death by age 4 (63percent said they would abort) to abortion for sex selection (3 percent indicatedthat they would abort). In all, 70 percent of the public indicated their willingnessto abort under at least one circumstance, and 30 percent indicated willingness toabort in three or more different situations.
Of course, these questions were hypothetical. Faced with a concrete decision,probably many of those who indicated a willingness to abort would hesitate, andmany who indicated that they would not abort would seriously consider the alter-native. What these data do show is that most Americans not only want to keepabortion legal under situations of physical trauma, but also would consider per-sonally aborting under difficult circumstances.
State Differences in Abortion Attitudes
If the Supreme Court overturns Roe, abortion regulation will return to state gov-ernments. By mid-1991, two states and one territory (Louisiana, Utah, and Guam)had passed stringent restrictions on abortion, and other states had passed legisla-tion calling for parental notification or consent and/or waiting periods. Somestates did not limit access to abortion. Although Governor Robert Martinez ofFlorida called a special session of the legislature to limit abortion, the legislaturerefused to comply. Moreover, the state of Maryland (which is heavily RomanCatholic) recently legislated a guarantee of abortion rights, and in late 1991 theRepublican governor of Massachusetts, William Weld, introduced a similar leg-islative package.
If abortion is to be decided at the state level, interstate differences in abortionattitudes become important. The 1989 CBS News/New York Times national surveydiscussed above was administered along with separate surveys in Florida,California, Illinois, Pennsylvania, Texas, and Ohio. Figure 2.5 shows the percent-age of respondents in each state who took consistently pro-choice or pro-life posi-tions. There are important state differences, with more than 45 percent of resi-dents of California and Florida consistently supporting legal abortion but only 35percent of those in Ohio.
In Table 2.1 we show the percentage of respondents in each state who favorlegal abortion under each circumstance. It is interesting that in all six states (andin the national survey), the public generally orders these seven items in the sameway. Support is highest for abortions when the mother’s health is in danger andlowest for a professional woman who does not want to interrupt her career. Thereare few state differences in support for abortion when the mother’s health is indanger, and there is wide support for legal abortion for all three traumatic cir-cumstances. State differences are far larger on abortion for social reasons. InCalifornia, Florida, and Illinois, there are narrow majorities favoring legal abor-tion in all circumstances except for professional women who would abort to main-tain their careers. In Texas, in contrast, majorities oppose legal abortion for allfour social reasons, including poverty and unmarried women.
Adventures in Social Research16
TABLE 2.1Respondents Supporting Legal Abortion in
Various Circumstances, 1989, by State (in percent)
CA FL IL OH PA TX
Mother’s health 94 94 94 92 92 92
Rape 86 88 86 86 85 84
Fetal defect 79 79 75 73 75 72
Poverty 60 60 57 49 52 47
High schoolstudent 56 56 52 46 50 46
Interrupt career 46 47 42 37 37 35
SOURCE: CBS News/New York Times survey, 1989.
The CBS News/New York Times survey did not include any states that passedstringent abortion restrictions in 1989 or 1990.7 A University of New Orleanssurvey in 1990 revealed that pro-life and pro-choice forces constituted an identi-cal 21 percent of the Louisiana sample, with 53 percent favoring some restric-tions. There had been a slight increase in support for legal abortion since a similarpoll in 1988, but these data show that citizens of Louisiana are much less sup-portive of legal abortion than citizens in the United States in general or in the sixstates in the CBS News/New York Times survey.
Percentage of Respondents
50
40
30
20
10
0
California Florida Illinois Ohio Pennsylvania Texas
Pro-Life Pro-Choice
Figure 2.5. Pro-Life and Pro-Choice Respondents in Selected StatesSOURCE: Compiled from the 1998 CBS News/New York Times Surveys.
E-Appendix H: Readings 17
Group Differences in Abortion Attitudes
In the rest of this chapter, we examine demographic, or social group, differencesin attitudes toward legal abortion. Where we observe differences between socialgroups, we attempt to explain them. Often this explanation consists of a discus-sion of the ways that other demographic characteristics or attitudes influence theattitudes of the social groups in question. When we say that, for example, blacksare less supportive of legal abortion than whites because they have lower levelsof education, are more likely to hold orthodox religious beliefs, and are morelikely to have large families, we suggest that there is nothing inherent in race thatinfluences support for abortion—rather, African-Americans are less supportivebecause of their other social characteristics and attitudes. This means that if wecompare (for example) African-American and white evangelical Christians withhigh school degrees and five children, we will find no significant differences inabortion attitudes.
In the next two chapters, we more fully examine two other sources of abor-tion attitudes. In Chapter 3, we examine the effects of attitudes on related issuessuch as feminism, euthanasia, and ideal family size, while Chapter 4 deals withthe effects of religion. Many of the demographic differences in this chapter areultimately explainable by differences in these related attitudes and behaviors.
Gender and Racial Differences
Spokespersons for both pro-life and pro-choice groups often claim that womenshould be especially supportive of their cause. Some pro-life groups claim that thespecial role of women in procreation makes them less likely than men to supportlegal abortion and that this gender difference should be largest among those withyoung children. Some pro-choice spokespersons argue that because women beara disproportionate share of the costs of unwanted pregnancies, they should bemore supportive of legal abortion.
In fact, there is practically no relationship between gender and attitudestoward legal abortion. Women are slightly less supportive of legal abortion thanmen, but the differences are very small. The gender gap is somewhat larger amongolder Americans, but only among those citizens over 65 are these differences largeenough to be confident that women are significantly less supportive of legal abor-tion. Men are significantly more supportive of legal abortion than homemakers,but among men and women who work outside the home there is no difference indegree of support for legal abortion. Interestingly, among those respondents withsmall children, the gender gap entirely disappears.
Racial differences do exist, however. For all but one of the surveys between1972 and 1991, whites were more supportive of legal abortion than African-Americans. Why do these racial differences occur? Differences between whitesand blacks have been the subject of a good deal of academic study.8 African-American women are twice as likely to have abortions as are white women,although this is primarily because they are more likely to become pregnant.9 Asimilar percentage of white and black pregnancies end in abortion. Nonetheless,
Adventures in Social Research18
abortions are more common among African-Americans, yet blacks are less sup-portive of legal abortion. Between 1987 and 1991, 40 percent of whites supportedabortion under all circumstances, compared with only 30 percent of blacks. Racialdifferences are largest among the oldest Americans, and during much of the 1980sthese differences were larger among those who lived in the South.10
Why are blacks more likely than whites to oppose abortion? Several factorscome into play. First, African-Americans are more likely than whites to have beenraised in rural areas or in the South, and to have lower levels of education. Thesefactors all influence abortion attitudes, as we will see below. Second, African-Americans are much more likely to oppose euthanasia (mercy killing), which isshown in Chapter 3 to be a strong predictor of abortion attitudes. Finally, blacksare more likely to hold orthodox religious beliefs, to attend doctrinally conserva-tive churches, to attend church regularly, and to pray frequently. In Chapter 4, wewill see that religious attitudes and behaviors are the strongest predictors of abor-tion attitudes.
Once we have held constant demographic factors, attitudes toward sexualmorality, and religious affiliations and behaviors, racial differences in abortionattitudes disappear. This means that blacks are less supportive of legal abortionthan whites because of their social characteristics, attitudes toward sexual moral-ity, and religion. Indeed, after we control for attitudes and religion, African-Americans are significantly more supportive of legal abortion than whites.
Over the past several years, racial differences in abortion attitudes havedeclined. Figures 2.6 and 2.7 show that between 1985 and 1991, the racial gap inabortion attitudes narrowed, and in the 1990 survey, blacks were actually moresupportive of legal abortion than whites.11 Indeed, the increase in support forlegal abortion observed above in 1989 and 1990 was largely confined to theAfrican-American community. The African-American respondents to the GSSsurveys in 1989, 1990, and 1991 were more supportive of legal abortion than wereblack respondents in any previous years.
Figure 2.6. Mean on Legal Abortion Scale for Blacks and Whites, 1972–1991SOURCE: Compiled from the General Social Survey, 1972–1991.
90
E-Appendix H: Readings 19
Several factors combined to change black attitudes on legal abortion duringthis period. First, as the oldest generation of African-Americans has died off, ithas been replaced by a younger generation that is far more supportive of legalabortion. This oldest generation of blacks was strongly opposed to legal abortion,but from 1989 to 1991 there were fewer of this generation in the population. Inaddition, the average education level of blacks has climbed steadily during thisperiod, and education is strongly associated with support for legal abortion.Finally, there has been a decline in the religiosity and religious orthodoxy ofblacks (especially outside of the South) during this period, and a subsequentchange in certain social issue attitudes.
Education and Social Class Differences
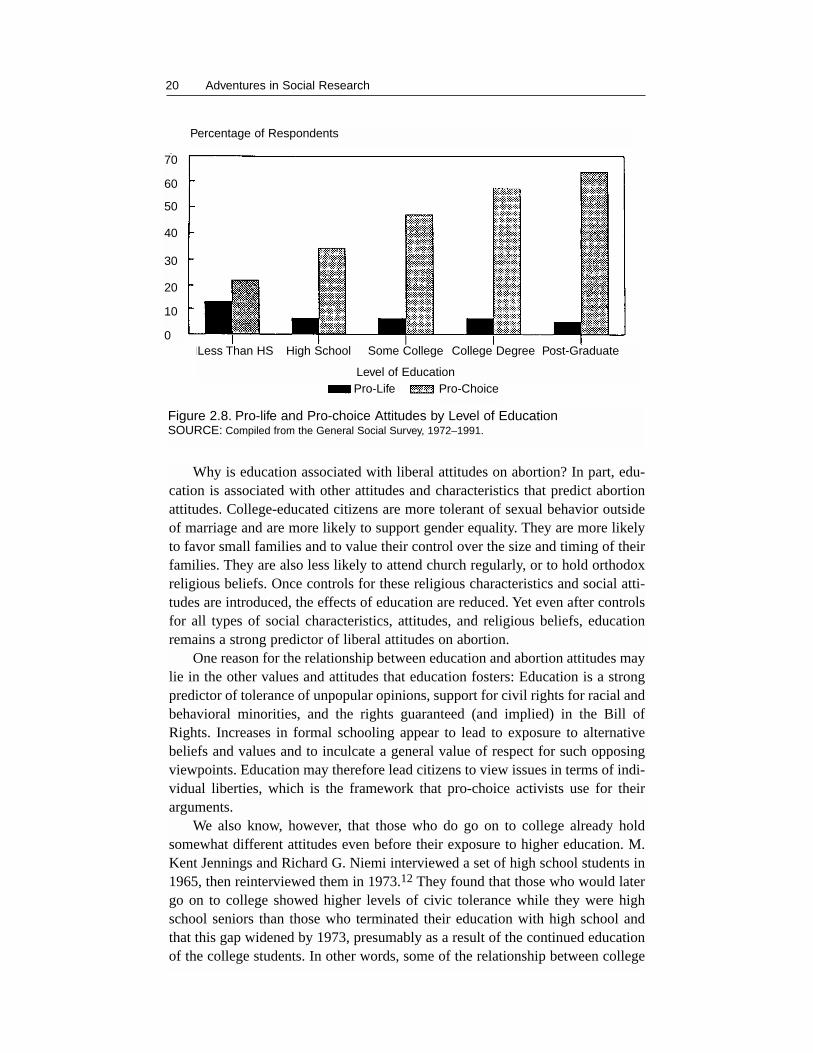
Of all the social characteristics that help us understand abortion attitudes, educa-tion is the strongest predictor. Opposition to legal abortion is highest among thosewho have dropped out of high school and lowest among college graduates. Theeffects of education are generally strong and exist across the entire range of edu-cational attainment, with each increasing year of education leading to more liberalbeliefs about abortion. Between 1987 and 1991, only 21 percent of those whodropped out of school before completing high school supported abortion in all cir-cumstances, but nearly two-thirds of those who had attended graduate school sup-ported unlimited access to abortion. The strength of this relationship is showngraphically in Figure 2.8.
Figure 2.7. Pro-Choice Respondents by Race, 1972–1991SOURCE: Compiled from the General Social Survey, 1972–1991.
Adventures in Social Research20
Why is education associated with liberal attitudes on abortion? In part, edu-cation is associated with other attitudes and characteristics that predict abortionattitudes. College-educated citizens are more tolerant of sexual behavior outsideof marriage and are more likely to support gender equality. They are more likelyto favor small families and to value their control over the size and timing of theirfamilies. They are also less likely to attend church regularly, or to hold orthodoxreligious beliefs. Once controls for these religious characteristics and social atti-tudes are introduced, the effects of education are reduced. Yet even after controlsfor all types of social characteristics, attitudes, and religious beliefs, educationremains a strong predictor of liberal attitudes on abortion.
One reason for the relationship between education and abortion attitudes maylie in the other values and attitudes that education fosters: Education is a strongpredictor of tolerance of unpopular opinions, support for civil rights for racial andbehavioral minorities, and the rights guaranteed (and implied) in the Bill ofRights. Increases in formal schooling appear to lead to exposure to alternativebeliefs and values and to inculcate a general value of respect for such opposingviewpoints. Education may therefore lead citizens to view issues in terms of indi-vidual liberties, which is the framework that pro-choice activists use for theirarguments.
We also know, however, that those who do go on to college already holdsomewhat different attitudes even before their exposure to higher education. M.Kent Jennings and Richard G. Niemi interviewed a set of high school students in1965, then reinterviewed them in 1973.12 They found that those who would latergo on to college showed higher levels of civic tolerance while they were highschool seniors than those who terminated their education with high school andthat this gap widened by 1973, presumably as a result of the continued educationof the college students. In other words, some of the relationship between college
Percentage of Respondents
70
60
50
40
30
20
10
0Less Than HS High School Some College College Degree Post-Graduate
Level of EducationPro-Life Pro-Choice
Figure 2.8. Pro-life and Pro-choice Attitudes by Level of EducationSOURCE: Compiled from the General Social Survey, 1972–1991.
E-Appendix H: Readings 21
education and support for legal abortion is possibly due to self-selection—pro-choice high school students may be more likely to continue their education incollege than their pro-life counterparts. However, an important part of the rela-tionship between high levels of education and liberal attitudes toward legal abor-tion is clearly due to the socializing experiences of education.
Other characteristics of socioeconomic status also predict support for legalabortion. Those citizens in high-prestige jobs and who have high family incomesare also more supportive of legal abortion.
These patterns are partly but not entirely attributable to the relationshipbetween education and social class. High family income often characterizes two-career couples, who generally want to control their fertility, and this accounts forpart of the relationship between income and abortion attitudes. For high-income,two-career families, the opportunity costs of an unexpected pregnancy may bevery high. Even after controls for education and two-income couples, however,occupation and income are weak but significant predictors of support for legalabortion.
Geographic Differences
Where people live influences their attitudes toward legal abortion. More impor-tantly, where they were raised plays an even greater role. Those Americans raisedin the South are less supportive of legal abortion than those raised elsewhere,regardless of where they currently live. Those raised in rural areas are more likelyto oppose legal abortion than those raised in a city, regardless of where they cur-rently live. The data in Table 2.2 on the next page show the differences in attitudes.
In part, the explanation for these geographic patterns lies with other demo-graphic variables. Southerners and those who live in rural regions have lowerlevels of education than other Americans, and blacks disproportionately live inthe rural South. Even more important are the religious characteristics and socialattitudes that are fostered in rural regions and in the South. Rural residents andthose in the South are more likely to hold orthodox religious views and behighly involved in their religion, and it appears that those raised in these areasmaintain at least some of their religious characteristics when they move.Moreover, southerners and rural residents are less likely to support genderequality and are more likely to be conservative on questions of sexual moralityand other issues.
Generational Differences
Abortion is a topic that affects the young somewhat differently than the old.Young men and women are more likely to confront unwanted pregnancies; forpeople over 50, abortion is unlikely to affect their lives directly. It seems likely,then, that abortion attitudes will differ across age groups. Two different processescould produce differences on abortion attitudes among different age groups. First,attitudes can change over the life cycle. Second, different generations of citizensmay hold different sets of beliefs. It is possible that abortion attitudes couldchange during the life cycle. Life-cycle changes may occur as people age andtheir lifestyle changes.
Adventures in Social Research22
TABLE 2.2Demographic Variables and Abortion Attitudes, 1987–1991 (in percent)
Pro-life Situationalist Pro-choice Mean Value
Men 41 53 6 4.08
Women 37 54 9 3.84
Housewives 29 60 11 3.52
Whites 40 52 8 3.99
Blacks 33 58 9 3.71
High school dropout 21 66 13 3.19
High school grad. 34 60 6 3.85
Some college 45 49 6 4.20
College degree 56 38 6 4.45
Post-graduate 63 32 5 4.71
Raised—Live
South—South 28 63 9 3.54
South—North 36 52 12 3.66
North—South 47 45 8 4.22
North—North 43 50 7 4.10
Raised
On farm or in country 28 61 11 3.47
Small or medium city 39 54 7 3.95
Suburbs or big city 51 44 5 4.45
Final column is the mean value (on six-point legal abortion scale) for each group.SOURCE: General Social Survey
At different ages, people have different circumstances and different needs, andthese may lead to different attitudes as well. This life-cycle pattern could belinear—as people get older, they may become more conservative on abortion, orlife-cycle differences could follow a more complex pattern.
Let us consider one hypothetical example of a life-cycle pattern to abortionattitudes. It could be that young, predominantly single people would generallyfavor legal abortion, but that those in their late twenties and early thirties, many ofwhom have young children, might be less supportive. Parents of teenaged children(especially daughters) may be more supportive, since they fear the consequencesto their children of unwanted pregnancies, while grandparents of young childrenmight be less supportive. In this hypothetical life-cycle pattern, those who face thehighest costs of unplanned pregnancies (either for themselves or their offspring)are the most supportive of a legal abortion option, and those with young childrenor grandchildren are less supportive.
E-Appendix H: Readings 23
A second process can produce age-related differences in abortion attitudes:Generational differences may persist throughout the life cycle. Karl Mannheimargues that those who came of age during the same time (called cohorts) and whoalso shared unique political and social experiences could form a political genera-tion.13 This generation would remain distinctive in its attitudes and orientationsas it passed through the life cycle. Generational effects would occur when a par-ticular cohort retains the historical imprint of the social and historical context inwhich its members grew up and came of age.
A variety of studies has shown that the political circumstances existing whenpeople reach adulthood may continue to influence them throughout their lives.These generational differences have been found in a number of areas. Thosepeople who reached adulthood during the Great Depression have been generallymore financially cautious than those who grew up during the booming 1950s.Some scholars have argued that those who grew up during World War II generallyview military force as essential to deter aggression, but those who came of ageduring the Vietnam War are more skeptical of the use of force.14
We can test whether a life-cycle or a generational account of abortion atti-tudes provides a better explanation by comparing the attitudes of various genera-tions over time. Although our data do not allow us to see if specific people changetheir attitudes, if each successive generation becomes more conservative when itreaches the age at which most women begin their families or becomes moreliberal when its children are in their teens, we will have evidence of one type oflife-cycle effect. If each generation remains relatively constant in its attitudes, butis notably different in ways that reflect the circumstances that existed when itsmembers became adults, we will have evidence of generational effects.
In order to examine possible generational differences, we must identifycohorts (people who turned age eighteen during a specified time period) who havehad distinctly different experiences. We have posited six possible generations thatmight differ on abortion attitudes. Five of our generations are adapted from thework of Virginia Sapiro.15 Sapiro defined seven coming-of-age cohorts by histor-ical events affecting women. We define the cohorts according to when respon-dents reached age eighteen, and these parallel many of Sapiro’s cohorts, includ-ing those who came of age during or before the Great Depression (prior to orduring 1933), those who came of age before or during World War II (1934 –1944),a Feminine Mystique cohort from the 1950s (who reached eighteen between 1945and 1960), a sixties cohort (1961–1969), and a women’s liberation cohort thatcame of age during the early years of the women’s movement in the 1970s(1970–1979). Finally, we add a Reagan cohort (not included in Sapiro’s earlierwork) that reached age eighteen after 1979.
Kristin Luker characterizes the period prior to 1960 as the “century ofsilence,” during which there was little organized challenge to the status of abor-tion as regulated primarily by medical doctors. In the 1960s, however, abortion-reform forces began to push for easier access to abortion. The claim that womenhad a “right to control their bodies” was made during this period, when advocatesof legal abortion had the rhetorical field to themselves. The 1960s was also the
Adventures in Social Research24
decade in which the birth control pill became widely available, ensuring womengreater control of their fertility. After the Roe v. Wade decision in 1973, however,pro-life forces organized and began to publicize their position widely. Thus, thosewho came of age during the 1970s experienced both the rise of the women’smovement and that of the pro-life movement. Sapiro’s women’s liberation cohortis also the cohort that was first exposed to the arguments and organizing of pro-life activists.
The 1980s saw the increasing politicization of the abortion issue, with thenational Republican party officially adopting a pro-life position and most nationalDemocrats publicly endorsing legal abortion. Those who came of age in the 1980ssaw a popular conservative president espouse a pro-life position. Thus the 1960s,the women’s liberation, and Reagan cohorts were socialized in eras with differinglaws regulating abortion and different levels of elite debate on abortion. Weexpect smaller differences between those cohorts that came of age prior to 1960,for there were no notable changes in legal abortion during this period.Nonetheless, because part of the abortion debate concerns gender roles and thesecohorts experienced differences in roles available to women, we do expect someslight cohort differences among these older respondents. In addition, we areunable to predict the direction of the responses of those who came of age duringthe 1970s. This cohort was exposed to the efforts of the women’s movement tobuild feminist consciousness and also to those of the pro-life forces to regulateabortion access.
Figure 2.9 shows the percentage of whites and blacks in each generation whoconsistently oppose or support legal abortion. The figure shows that amongblacks, support is highest among the youngest citizens, but for whites, support ishighest for men and women who came of age during the 1960s and 1970s. Thislowered support for legal abortion among the youngest white respondents is not
Percentage of Cohort
50
40
30
20
10
White Support NoneBlack Support None
White SupportAll
Figure 2.9. Support for Legal Abortion under Six Circumstances by CohortSOURCE: Compiled from the General Social Surve, 1985–1988.
Depression World War II Mystique Sixties Women’s Liberation Reagan
Cohort
E-Appendix H: Readings 25
accompanied by an increase in the number who take positions consistently oppos-ing legal abortion. Indeed, the Reagan generation whites are the most supportiveof legal abortion under the three traumatic circumstances. Younger whites are notjoining the pro-life cause, but they approve abortion in fewer circumstances thanthose who came of age during the 1960s.
Instead, younger whites are less likely to approve of elective abortion thanthose who came of age during the 1960s. The data in Table 2.3 show that whiteswho came of age during the Reagan era are less likely than their somewhat oldercounterparts to approve of legal abortion when the mother is unmarried or whena married couple wants no more children. In contrast, young blacks are morelikely than other blacks to approve of abortion in these circumstances.
These generational changes appear to persist through the life cycle. The datain Table 2.4 show that the relative ordering of the different generations hasremained nearly constant since 1972. This constancy implies that abortion atti-tudes are generational, and although adults do change their attitudes, this changeis not related to stages of the life cycle.16
As a further test of the life-cycle theory, we compared young women withchildren and those who have no children. One version of this theory would predictthat those young women with children would be less supportive of legal abortionbecause at that stage of their lives they are less likely to experience unwantedpregnancies and possibly make them more likely to believe that the fetus repre-sents human life.17 Luker has argued that some housewives were fearful that theirstatus as mothers was devalued by the feminist movement and felt they had avested interest in preserving the sanctity of motherhood. Restrictive attitudesabout abortion were seen as an important component of a “pro-family” ideology.
Predictably, young women with children were less supportive of legal abor-tion. However, this difference was entirely accounted for by differences in educa-tion, occupational status, attitudes, and religion. Young mothers are less support-ive of legal abortion than other young women not because their babies make themmore likely to believe that an embryo is a human life, but because their education,occupational status, and religion make them both more likely to have children ata young age and less likely to support legal abortion. In contrast, those womenwho choose to have their children later in life are more likely to value control overtheir childbearing decisions.
These data suggest that abortion attitudes vary across generations but do notchange as individuals move through their life cycle. Why, then, are youngerwhites less supportive of legal abortion than those who came of age during the1960s? Several possible explanations exist. First, it is possible that the pro-lifemovement, which began organizing after the Roe v. Wade decision in the early1970s, has influenced the attitudes of younger whites. The evidence does notsupport this explanation. First, the youngest whites are actually slightly less likelythan older whites to take a consistently pro-life position and more likely tosupport legal abortion under all three traumatic situations. Second, in data fromthe American National Election Study (ANES) in 1988, the youngest whites weresomewhat less favorable toward pro-life activists than older whites.18 Although
Adventures in Social Research26
TABLE 2.3Support for Legal Abortion by Cohort, 1987–1991 (in percent)
Women’s Depression WWII Mystique 1960s Lib Reagan
WHITES ONLY:
Trauma
None 12 10 9 7 5 4
All 74 77 75 79 79 81
Elective
None 56 51 49 44 42 44
All 29 30 37 43 46 57
N 389 637 889 814 1045 688
Health of mother 83 88 88 91 93 94
Rape 80 83 81 83 85 89
Fetal defect 78 81 80 83 83 85
Poverty 40 42 44 50 53 49
Single mother 35 40 42 49 50 43
No more children 34 38 42 49 50 44
BLACKS ONLY:
Trauma
None 20 16 12 9 5 3
All 41 56 65 75 76 76
Elective
None 65 57 56 51 42 43
All 18 24 24 39 34 34
N 47 96 164 138 248 158
Health of mother 82 82 86 90 93 90
Rape 55 65 75 83 83 86
Fetal defect 54 63 69 78 82 80
Poverty 33 35 38 45 47 51
Single mother 22 30 30 42 40 39
No more children 22 34 34 44 49 46
SOURCE: General Social Survey.
E-Appendix H: Readings 27
this evidence is not conclusive, it seems to us that the explanation of this genera-tional pattern must lie elsewhere.
A second possible explanation is that Ronald Reagan influenced youngpeople (especially young Republicans) by his strong opposition to legal abortion.This explanation fits the racial differences in generational patterns, where theyoungest blacks are the most supportive of legal abortion. Young blacks werequite negative toward Reagan, so his persuasive powers are more likely to beeffective on young whites than on blacks.19
Yet once again the data do not support the hypothesis. Although young whitesliked Reagan more than their older counterparts, feelings toward Reagan are notat all related to abortion attitudes among this group. Young whites who were mostpositive toward Reagan in 1984 were no more likely to favor restrictions on abor-tion than those who did not like Reagan. Thus, we can reject the opinion leader-ship of a popular, conservative president as a possible explanation for genera-tional differences in abortion attitudes.
A third potential explanation for the decline of support for legal abortionamong younger whites is that they are more conservative in general than those whocame of age during the 1960s. Again the data do not support this explanation.Younger whites are slightly less supportive of gender equality than the 1960s and1970s cohorts, but these differences are small. They are the most permissive gen-
TABLE 2.4Cohort Differences in Abortion Attitudes: Longitudinal Trends, 1972–1991
1972–76 1977–80 1981–85 1986–91*
WHITES ONLY:Depression 3.99 3.9 3.72 3.57
WWII 4.17 4.18 3.78 3.74
Mystique 4.12 3.97 3.93 3.85
1960s 4.45 4.28 4.19 4.12
Women’s liberation 4.30 4.25 4.19 4.24
Reagan 3.79 4.07
BLACKS ONLY:Depression 2.53 2.33 2.24 2.73
WWII 2.85 2.86 3.00 3.13
Mystique 3.93 3.73 3.22 3.40
1960s 3.88 4.08 3.99 3.95
Women’s liberation 3.78 3.61 3.65 3.99
Reagan 3.61 4.00
Mean values for each cohort on six-point legal-abortion scale. Higher scores indicate greatersupport for legal abortion.*Data in this column for blacks are for 1987 to 1990.SOURCE: General Social Survey.
Adventures in Social Research28
eration on issues of sexual morality and the most likely to call themselves liberals.Of course, this generation is also more Republican than the older generations andmore likely to have supported Reagan. At most, however, the Reagan generationshows evidence of a confused ideology, not a consistently conservative pattern.
We believe that the Reagan generation came of age during a period in which themedia presented a consistent message that abortion was ultimately a woman’schoice but one that should not be taken lightly. We are persuaded by Condit’s evi-dence (discussed in Chapter 1) that the media consensus during the 1980s was crit-ical of abortions that were chosen without a compelling justification. Condit’s claimfits well with these data, for the Reagan cohort of whites is primarily different fromits older counterparts on two abortion items—when a married couple wants no morechildren and when a pregnant, unmarried woman does not want to marry.
In both cases, the Reagan cohort may feel that the need for abortion under thesecircumstances is not compelling. Younger respondents may be less likely to feel thatthere will be a substantial societal stigma for an unmarried mother. Unmarriedmotherhood has become more widespread since the 1960s, and the popular media(especially television) have treated unmarried mothers in a much more positive lightin recent years than previously. During the 1991–1992 television season, populartelevision character Murphy Brown deliberately had a baby out of wedlock, as thefictional character desired a child, but did not wish to be married. Vice PresidentDan Quayle attacked the script as an example of the decline of traditional values.
The Reagan generation may also be more likely to believe that a marriedcouple should have just “been more careful” and not gotten pregnant in the firstplace. Younger Americans may underestimate the chances of contraceptive failure,for they have had less chance to experience it. We noted in Chapter 1 that a marriedcouple who correctly used the most successful contraception available still bore asizable risk of an unwanted pregnancy. Young people have had less time to expe-rience this type of contraceptive failure themselves and are less likely to knowsomeone else who has. A woman of twenty-one who has been consistently contra-cepting for three years using a method 99 percent successful in each year bearsonly a 3 percent chance of becoming pregnant during this period. A similar womanfrom the sixties generation who is now 40 would have experienced a 20 percentchance of pregnancy using this same method, as would her friends of the same age.A woman of the sixties generation is therefore more likely to be aware of the prob-abilistic nature of contraceptive failure than a young woman of the Reagan gener-ation. If the Reagan generation underestimates the chance of contraceptive failure,young whites may believe that such pregnancies should simply have been avoided.Thus the Reagan cohort may disapprove of abortions in these two circumstancesbecause they do not find these situations compelling justifications for abortion.
Demographic Differences in Abortion Attitudes:Multivariate Analyses
How do these demographic variables combine to explain abortion attitudes? Inorder to determine how useful each demographic variable is in explaining abor-
E-Appendix H: Readings 29
tion attitudes, we use a statistical procedure called multiple regression. This tech-nique enables us to determine how much effect a variable (say, education) has onabortion attitudes when other variables have been held constant.
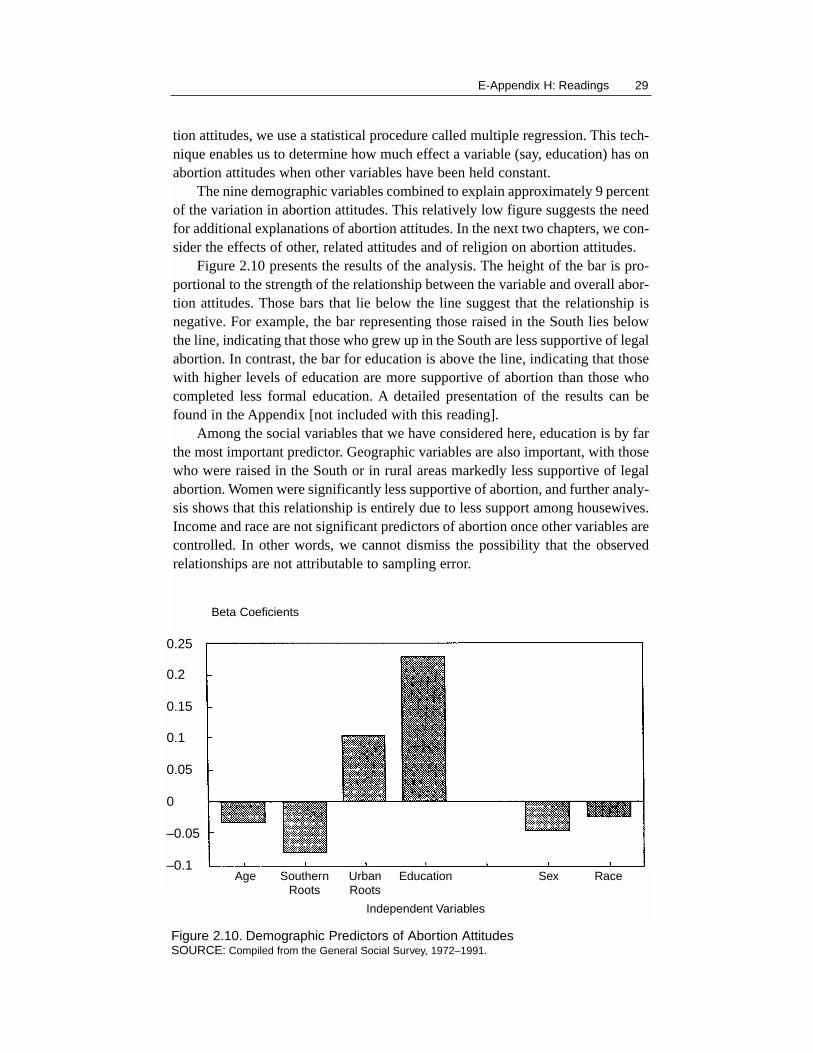
The nine demographic variables combined to explain approximately 9 percentof the variation in abortion attitudes. This relatively low figure suggests the needfor additional explanations of abortion attitudes. In the next two chapters, we con-sider the effects of other, related attitudes and of religion on abortion attitudes.
Figure 2.10 presents the results of the analysis. The height of the bar is pro-portional to the strength of the relationship between the variable and overall abor-tion attitudes. Those bars that lie below the line suggest that the relationship isnegative. For example, the bar representing those raised in the South lies belowthe line, indicating that those who grew up in the South are less supportive of legalabortion. In contrast, the bar for education is above the line, indicating that thosewith higher levels of education are more supportive of abortion than those whocompleted less formal education. A detailed presentation of the results can befound in the Appendix [not included with this reading].
Among the social variables that we have considered here, education is by farthe most important predictor. Geographic variables are also important, with thosewho were raised in the South or in rural areas markedly less supportive of legalabortion. Women were significantly less supportive of abortion, and further analy-sis shows that this relationship is entirely due to less support among housewives.Income and race are not significant predictors of abortion once other variables arecontrolled. In other words, we cannot dismiss the possibility that the observedrelationships are not attributable to sampling error.
Beta Coeficients
0.25
0.2
0.15
0.1
0.05
0
–0.05
–0.1Age Southern Urban Education Sex Race
Roots Roots
Independent Variables
Figure 2.10. Demographic Predictors of Abortion AttitudesSOURCE: Compiled from the General Social Survey, 1972–1991.
Adventures in Social Research30
Conclusions
Memberships in social groups do help us account for differences in attitudestoward legal abortion to some extent. Differences in education, region, and familystructure all help explain some of the variation in abortion attitudes. However, theexplanatory power of such demographic variables is rather weak, and muchremains to be explained after the effects of these variables have been taken intoaccount. What is needed is a more detailed analysis of the reasons people have fortheir abortion attitudes, and it is to this task that we now turn.
Notes
1. These data and others in this book are made available by the Inter-UniversityConsortium for Political and Social Research. We are responsible for all interpretations.James Davis and Tom Smith, General Social Surveys, 1972–1991 [machine readable datafile]. Chicago: National Opinion Research Center (1991).
2. The dimensionality of the abortion items has been widely documented, and we haveconfirmed this with factor analysis. Moreover, we find that this same factor structureholds for the somewhat different items included in the 1989 CBS News/New York Timessurvey in several different states. In using this terminology, we are mindful that all abor-tions are traumatic for the women involved, and that all abortions are in some sense elec-tive. Moreover, extreme poverty is a traumatic circumstance. Some other researchers haveused the terms “hard” and “soft” reasons for abortion, but we believe that elective andtraumatic convey more of the core of the distinction. Note that the distinction betweenthese two sets of items is not our own categorization, rather it emerged from the patternof public response to these questions.
3. Aida Torres and Jacqueline Forrest, “Why Do Women Have Abortions?” FamilyPlanning Perspectives 20 (1988), pp. 169–176.
4. We refer to only those citizens who oppose abortion in all circumstances as pro-life sup-porters. Because some pro-life organizations allow for exemptions when the mother’s lifeis in danger, this may seem an arbitrary decision. We make this choice for two reasons.First, political actors call themselves pro-life or pro-choice for political reasons. AlthoughPresident Bush calls himself pro-life, he has at various points endorsed exemptions for thelife and health of the mother, for rape and incest, and for severe fetal defect. This positionwould be at 3, near the mid-point of our scale. Similarly, some of those who call them-selves pro-choice favor restrictions. It is therefore cleaner to limit our pro-life and pro-choice categories to those positions held by most activists on both sides. Second, note thatthe GSS question refers to the health, not life of the mother. Pro-life activists are quitewary of this exception. Prior to the Roe decision when states were allowed to regulateabortion, several states with exemptions for the mother’s health allowed that clause tobecome quite elastic—for example, allowing doctors to certify that a live birth wouldupset the mother and therefore interfere with her mental health.
5. Abortion attitudes appear to be remarkably stable at the individual level as well. SeePhilip E. Converse and Gregory B. Markus, “Plus ca Change . . . The New CPS ElectionStudy Panel,” American Political Science Review 73 (1979), pp. 32–49.
6. Malcolm L. Goggin and Christopher Wlezien, “Interest Groups and the Socializationof Conflict: The Dynamics of Abortion Politics” (paper presented at the annual meeting ofthe Midwest Political Science Association in Chicago, 1991). Goggin and Wlezien arguethat interest group activity in anticipation of Webster may have influenced public attitudes.
E-Appendix H: Readings 31
7. Pennsylvania passed a package of restrictions including parental consent; spousalnotification; a twenty-four hour waiting period; requirements that doctors inform patientsof the development of their fetuses; health risks from abortion and alternatives to abor-tion; and a requirement that abortion providers supply the state health department withinformation about each procedure, including the basis for determining the gestational ageof the fetus.
8. For a discussion of racial differences in abortion attitudes, see M. Combs and S.Welch, “Blacks, Whites, and Attitudes Toward Abortion,” Public Opinion Quarterly 46(1982), pp. 510–520; E. Hall and M. Ferree, “Race Differences in Abortion Attitudes,”Public Opinion Quarterly 50 (1986), pp. 193–207; P. Secret, “The Impact of Region onRacial Differences in Attitudes Toward Legal Abortion,” Journal of Black Studies 17(1987), pp. 347–369; C. Wilcox, “Race Differences in Abortion Attitudes: SomeAdditional Evidence,” Public Opinion Quarterly 54 (1990), pp. 248–255; C. Wilcox,“Race, Religion, Region, and Abortion Attitudes,” Sociological Analysis (1992), forth-coming.
9. S. Henshaw and J. Silverman, “The Characteristics and Prior Contraceptive Use ofU.S. Abortion Patients,” Family Planning Perspectives 20 (1988), pp. 158–168.
10. P. Secret, “The Impact of Religion on Racial Differences in Attitudes Toward LegalAbortion,” Journal of Black Studies 17 (1989), pp. 347–369. But see also C. Wilcox,“Race, Religion, Region, and Abortion Attitudes,” Sociological Analysis, forthcoming.
11. In the late 1980s, the GSS began asking many of its questions of two-thirds of allrespondents. This allowed NORC to include more questions, but it reduced the alreadysmall number of black respondents to the abortion items. Beginning in 1988, therefore, wehave averaged the respondents in each year with those in the previous year for Figure 2.6.This allows us to smooth trends in black attitudes by reducing sampling error.
12. M. Kent Jennings and Richard G. Niemi, Generations and Politics (Princeton:Princeton University Press, 1981).
13. Karl Mannheim, “The Problem of Generations,” in Philip Altbach and Robert Laufer,eds., The New Pilgrims (New York: David McKay, 1972).
14. See Graham Allison, “Cool It: The Foreign Policy Beliefs of Young America,”Foreign Policy 1 (1971), pp. 150–154; Ole Holsti and James Rosenau, “Does Where YouStand Depend on When You Were Born? The Impact of Generation on Post-VietnamForeign Policy Beliefs,” Public Opinion Quarterly 44 (1980), pp. 1–22; and MichaelRoskin, “From Pearl Harbor to Vietnam: Shifting Generational Paradigms,” PoliticalScience Quarterly 89 (1974), pp. 563–588. Yet other studies show an opposite pattern,with those who came of age during World War II the least supportive of military action inthe Persian Gulf; those who grew up during the Vietnam war were the most supportive.See Clyde Wilcox, Joseph Ferrara, and Dee Allsop, “Before the Rally: Public Attitudes onthe Iraq Crisis” (paper presented at the annual meeting of the American Political ScienceAssociation, Washington, D.C., September 1991).
15. Virginia Sapiro, “News from the Front: Intersex and Intergenerational Conflict overthe Status of Women,” Western Political Quarterly 33 (1980), pp. 260–277.
16. These data show evidence of period effects, with all generations becoming more con-servative during the mid-1980s and more liberal at the end of that decade.
17. Alternatively, pro-choice activists would hypothesize that women who have experi-enced childbirth would be less likely to want other women to go through the experienceunless they chose to.
Adventures in Social Research32
18. For details of this and other tests of explanations for generational differences, seeElizabeth Cook, Ted G. Jelen, and Clyde Wilcox, “Generations and Abortion,” AmericanPolitics Quarterly, forthcoming.
19. A more likely influence on the attitudes of young blacks would be Rev. Jesse Jackson,who took a pro-choice position in his 1984 and 1988 presidential campaigns, despite hisearlier pro-life position.