32
The data you need to understand the 3D Printing world and build your 3D Printing strategy THE STATE OF 3D PRINTING EDITION 2017
The data you need to understand the 3D Printing world and build your 3D Printing strategy
THE STATE OF 3D PRINTING
EDITION 2017
INTRODUCTION2 Foreword3 Survey demographics4 Key takeaways
TABLE OF CONTENTSTHE STATE OF 3D PRINTING
5 The 3D Printing market is maturing6 The connection between 3D Printing and product development7 Plastic remains the most used material8 A special focus on Metal 3D Printing9 A skill growth through technical candidates10 Europe and America: Different uses but same potential11 Verbatims analysis, opportunities are larger than threats
22 Introduction23 Consumer goods25 Industrial goods27 High-tech29 Services
THE STATE OF 3D PRINTING - 2017 1
STRATEGY13 Executing a 3D Printing strategy - Introduction14 Expertise is a key factor to boost performance15 High performers are 3D Printer-Agnostic16 Product development is the main priority17 3D Printing drives competitive advantage
18 Year-Over-Year contrast - Introduction19 3D Printing market: No soften growth for 201720 Top priorities are becoming constant21 Resin’s innovation leads market transformation
TRENDS
STRATEGY
YEAR-OVER-YEAR
SECTORIAL INSIGHTS
This study was conducted by : Marine CORE-BAILLAIS, Hannah BENSOUSSAN,Amandine RICHARDOT and Hilmiyati KUSNADI
Photo Credit: Sculpteo and Carbon
Welcome to the third edition of Sculpteo’s State of 3D Printing 2017.
When we started working on this project, we knew that 3D Printing could be to production and manufacturing what agile methodology is to software: a radical change in mindset. But it was not the case for all users, as our first study demonstrated, except inside the group of aficionados we named the ‘Power Users’.
Three years later, I’m pleased to see that many of the nearly 1,000 respondents to this year’s survey share this philosophy. For them, 3D Printing is not the future, it is a production method like any other. With clearly established benefits but also necessary innovations and improvements.
The majority of respondents are not Sculpteo clients, but professionals who invent, innovate and produce thanks to 3D Printing. They come from all around the world and from all types of businesses: B2C, B2B, from startups to global industrial groups. They provided us with insights about their use cases, challenges, and they have graciously shared their views on the future of additive manufacturing. Some are new to 3D Printing and others started using the technology more than 10 years ago. This third edition has a range of new insights and ideas. In particular, metal additive manufacturing is given special attention and consideration.
I want to personally thank each of these experts who answered and shared their experience with us. We are truly grateful for your time and insights.
If you wish to compare yourself to this prestigious panel, I invite you to look at the sectorial insights at the end of this survey, and I encourage you to participate in our next survey at www.sculpteo.com/en/state-of-3D-printing. The survey will be up and open all year long.
The challenges that come with additive manufacturing are numerous, both in terms of production and in terms of decision making. Meeting these challenges is what drives us here at Sculpteo to continue to create the best software platform for agile manufacturing.
I hope you enjoy this year’s State of 3D Printing and I look forward to your thoughts and comments.
FOREWORDINTRODUCTION
CLÉMENT MOREAUCEO & FOUNDER
THE STATE OF 3D PRINTING - 2017 2
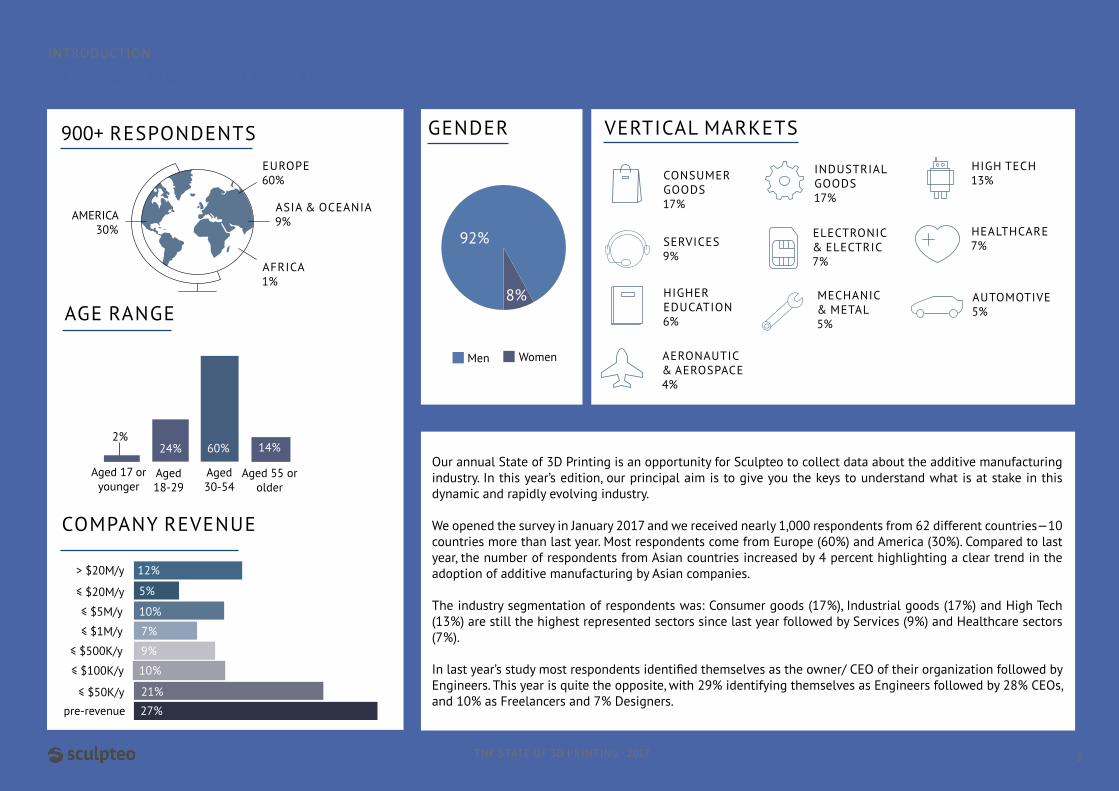
Men Women
8%
92%
AFRICA1%
EUROPE60%
AMERICA30%
ASIA & OCEANIA9%
900+ RESPONDENTS VERTICAL MARKETS
CONSUMERGOODS17%
AUTOMOTIVE5%
INDUSTRIALGOODS17%
> $20M/y
≤ $20M/y
≤ $5M/y
≤ $1M/y
≤ $500K/y
≤ $100K/y
≤ $50K/y
pre-revenue
SURVEY DEMOGRAPHICSINTRODUCTION
COMPANY REVENUE
Our annual State of 3D Printing is an opportunity for Sculpteo to collect data about the additive manufacturing industry. In this year’s edition, our principal aim is to give you the keys to understand what is at stake in this dynamic and rapidly evolving industry.
We opened the survey in January 2017 and we received nearly 1,000 respondents from 62 different countries—10 countries more than last year. Most respondents come from Europe (60%) and America (30%). Compared to last year, the number of respondents from Asian countries increased by 4 percent highlighting a clear trend in the adoption of additive manufacturing by Asian companies.
The industry segmentation of respondents was: Consumer goods (17%), Industrial goods (17%) and High Tech (13%) are still the highest represented sectors since last year followed by Services (9%) and Healthcare sectors (7%).
In last year’s study most respondents identified themselves as the owner/ CEO of their organization followed by Engineers. This year is quite the opposite, with 29% identifying themselves as Engineers followed by 28% CEOs, and 10% as Freelancers and 7% Designers.
THE STATE OF 3D PRINTING - 2017
HIGH TECH13%
SERVICES9%
ELECTRONIC& ELECTRIC7%
HIGHEREDUCATION6%
HEALTHCARE7%
MECHANIC& METAL5%
Aged 17 or younger
2%
Aged 18-29
Aged 30-54
Aged 55 or older
AGE RANGE
GENDER
AERONAUTIC& AEROSPACE4%
3
14%60%24%
21%
9%
7%
10%
12%
5%
10%
27%
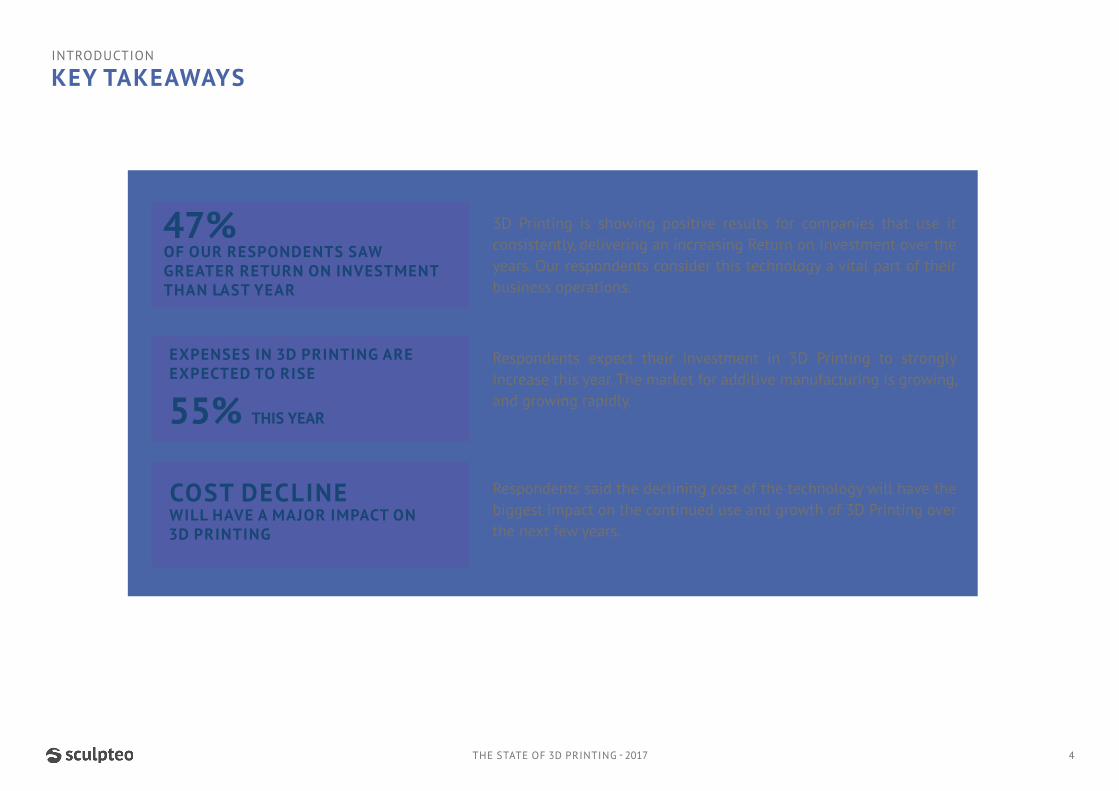
Respondents expect their investment in 3D Printing to strongly increase this year. The market for additive manufacturing is growing, and growing rapidly.
3D Printing is showing positive results for companies that use it consistently, delivering an increasing Return on Investment over the years. Our respondents consider this technology a vital part of their business operations.
Respondents said the declining cost of the technology will have the biggest impact on the continued use and growth of 3D Printing over the next few years.
47%OF OUR RESPONDENTS SAW GREATER RETURN ON INVESTMENT THAN LAST YEAR
INTRODUCTION
KEY TAKEAWAYS
EXPENSES IN 3D PRINTING ARE EXPECTED TO RISE
55% THIS YEAR
COST DECLINE WILL HAVE A MAJOR IMPACT ON 3D PRINTING
THE STATE OF 3D PRINTING - 2017 4

Additive manufacturing is still ramping up. 49% of our respondents increased their expenses in 3D Printing this year. And this trend is here to stay: 72% of them expect their spendings to increase again next year. Last year, almost the same amount of respondents had the same expectation (77%).
Additive manufacturing is showing positive results. Indeed, 47% of the respondents saw
a greater return on investment than last year. Moreover, 90% of them consider 3D Printing as a competitive advantage in their strategy.
These elements show that the respondents are loyal to additive manufacturing and that they consider this technology as a real partner for their activity. As a result, we can say that the market is becoming more stable and mature.
$9,504is the average budget for 2017 compared to $6,132 in 2016
+72%expect their spendings on additive manufacturing to increase for 2018
+90%consider 3D Printing asa competitive advantage in their strategy
+47%saw a greater Return on Investment than last year
THE STATE OF 3D PRINTING - 2017 5
+49%of respondents increased their expenses in 3D Printing this year
TRENDS 2017
3D PRINTING MARKET IS MATURING
PROTOTYPE
PROOF OF CONCEPT
PRODUCTION
EDUCATION
MARKETING SAMPLES
ART
HOBBY
OTHER
ACCELERATINGPRODUCT DEVELOPMENT
OFFERING CUSTOMIZED PRODUCTS AND LIMITED SERIES
ENABLINGCO-CREATION
IMPROVINGSPARE PARTS MANAGEMENT
5%
REDUCINGTOOLING INVESTMENT
OPTIMIZINGDEMO PRODUCT EXPENSES
BUYINGA 3D PRINTER
OTHER
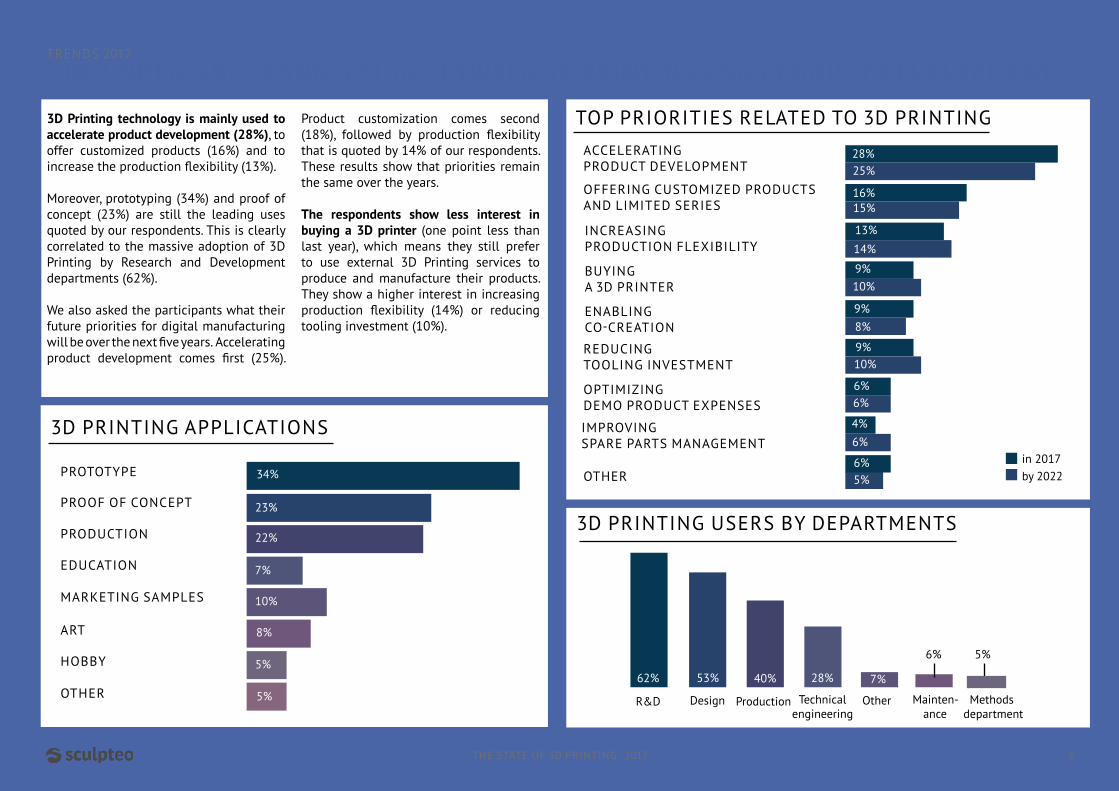
3D Printing technology is mainly used to accelerate product development (28%), to offer customized products (16%) and to increase the production flexibility (13%).
Moreover, prototyping (34%) and proof of concept (23%) are still the leading uses quoted by our respondents. This is clearly correlated to the massive adoption of 3D Printing by Research and Development departments (62%).
We also asked the participants what their future priorities for digital manufacturing will be over the next five years. Accelerating product development comes first (25%).
Product customization comes second (18%), followed by production flexibility that is quoted by 14% of our respondents. These results show that priorities remain the same over the years.
The respondents show less interest in buying a 3D printer (one point less than last year), which means they still prefer to use external 3D Printing services to produce and manufacture their products. They show a higher interest in increasing production flexibility (14%) or reducing tooling investment (10%).
THE UNDENIABLE CONNECTION BETWEEN 3D PRINTING AND PRODUCT DEVELOPMENTTRENDS 2017
in 2017by 2022
THE STATE OF 3D PRINTING - 2017 6
INCREASINGPRODUCTION FLEXIBILITY
TOP PRIORITIES RELATED TO 3D PRINTING
3D PRINTING APPLICATIONS
R&D Design Production Technical engineering
Mainten-ance
Other Methods department
3D PRINTING USERS BY DEPARTMENTS
5%6%
6%4%
6%6%
10%9%
8%9%
10%9%
14%
13%
15%16%
25%28%
7%28%40%53%62%5%
5%
10%
7%
22%
34%
23%
8%
6%

Polishing
Painting
Varnishing
Drilling
Machining
Grinding
Heat Treatment
Milling
3%Turning
Other
5%
5%
5%
7%
8%
9%
19%
33%
6%
MOST USED 3D PRINTING FINISHES
PLASTIC REMAINS THE MOST USED MATERIALTRENDS 2017
Plastic is still the most used 3D Printing material. It is used by 88% of our respondents. Resin material, which is very solid and resistant, is used by 35%. The launching of engineering resins in 2016 is one of the reasons this material comes second, like last year. It is then followed by metal (28%).
What are the reasons of this massive usage of plastic? It is considered the ideal material as it is affordable and offers a wide range of colors. Moreover, it has a large range of properties. But metal has a great potential.
The two 3D Printing finishes that come out as most used are polishing and painting, basic finishes that can be used for all materials. The fact that polishing
is so widely used shows that 3D Printing technologies still face issues in terms of quality of surface. Varnishing comes third. Thus, the three top finishes are aesthetic ones.
Fused Deposition Modeling (FDM) is the most used technology (36%), followed by SLS (33%) and SLA (25%). Last year, the results were different, as you will see in our Year over year section: SLS came first, and FDM second.
As new materials come up, our respondents also use new technologies like Selective Laser Melting (SLM), Continuous Liquid Interface Production (CLIP) and Fusion Jet. The important use of SLA, DLP, Polyjet and the arrival of CLIP also shows that 2016 has been the year of resin.
THE STATE OF 3D PRINTING - 2017 7
Plastics Resins Metals Multicolore/Sandstone
CeramicsWax Other
4%
Dire
ct M
etal
Las
er S
inte
ring
(DM
LS)
l
Elec
tron
Beam
Mel
ting
(EBM
)
2% 1%
MOST USED 3D PRINTING TECHNOLOGIES
MOST USED 3D PRINTING MATERIALS
8%11%15%28%35%88% l4%
7%13%25%33%36% 8%
Sele
ctiv
e La
ser S
inte
ring
(SLS
) Ster
eolit
hogr
aphy
(SLA
) M
ultij
et/P
olyj
et
CLIP
Sele
ctiv
e La
ser M
eltin
gSe
lect
ive
Depo
sitio
n
Lam
inat
ion
(SDL
)
4% 4%l l l
l l l2% 2%
Fuse
d De
posit
ion
Mod
elin
g
(FDM
)
Fusio
n Je
t
Bind
er Je
tting
Digi
tal L
ight
Pro
cess
ing
(DLP
)
Othe
r
Aluminium
Maraging
Stainless Steel
Titanium2%
8%
62%
22%
Inconel
Cobalt
2%4%
Cost reduction
Small batch
Complexity
Impossible Design
Less assembly
Mass reduction
Time reduction
Manufacturing limit
Mass customization
A SPECIAL FOCUS ON METAL 3D PRINTINGTRENDS 2017
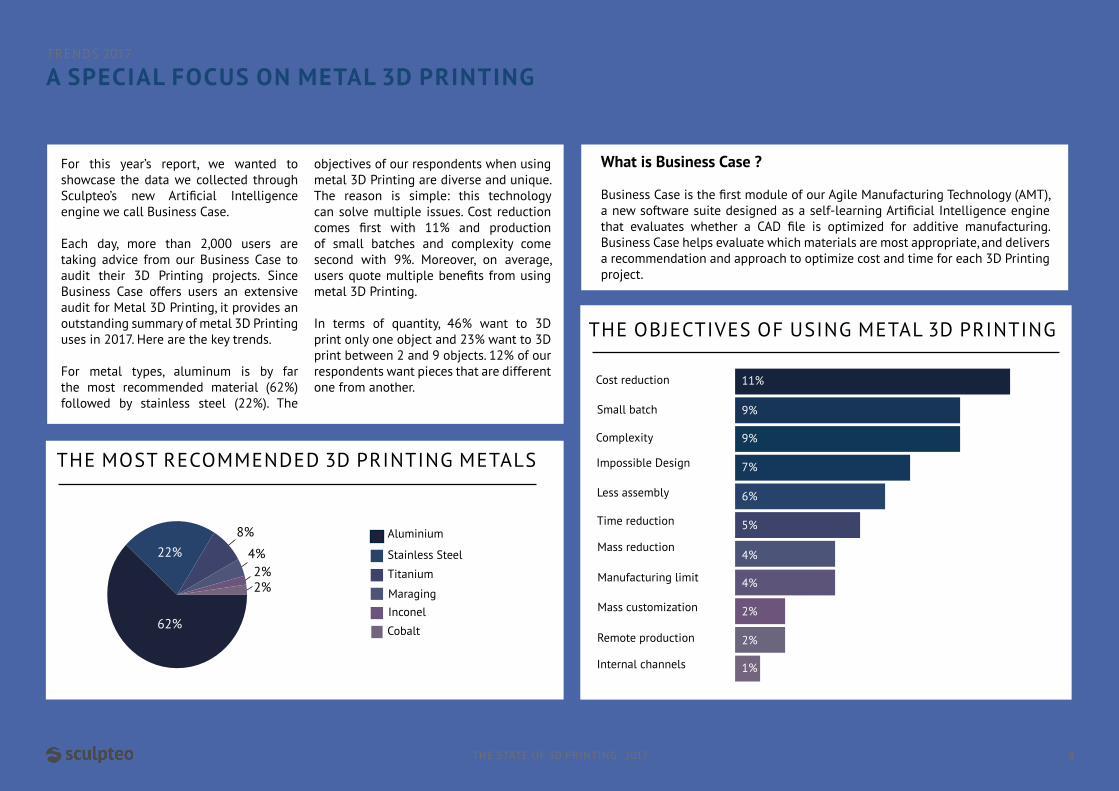
For this year’s report, we wanted to showcase the data we collected through Sculpteo’s new Artificial Intelligence engine we call Business Case.
Each day, more than 2,000 users are taking advice from our Business Case to audit their 3D Printing projects. Since Business Case offers users an extensive audit for Metal 3D Printing, it provides an outstanding summary of metal 3D Printing uses in 2017. Here are the key trends.
For metal types, aluminum is by far the most recommended material (62%) followed by stainless steel (22%). The
objectives of our respondents when using metal 3D Printing are diverse and unique. The reason is simple: this technology can solve multiple issues. Cost reduction comes first with 11% and production of small batches and complexity come second with 9%. Moreover, on average, users quote multiple benefits from using metal 3D Printing.
In terms of quantity, 46% want to 3D print only one object and 23% want to 3D print between 2 and 9 objects. 12% of our respondents want pieces that are different one from another.
THE STATE OF 3D PRINTING - 2017 8
THE OBJECTIVES OF USING METAL 3D PRINTING
Remote production
Internal channels
THE MOST RECOMMENDED 3D PRINTING METALS
11%
9%
9%
7%
6%
5%
4%
4%
2%
2%
1%
What is Business Case ?
Business Case is the first module of our Agile Manufacturing Technology (AMT), a new software suite designed as a self-learning Artificial Intelligence engine that evaluates whether a CAD file is optimized for additive manufacturing. Business Case helps evaluate which materials are most appropriate, and delivers a recommendation and approach to optimize cost and time for each 3D Printing project.
A SKILL GROWTH THROUGH TECHNICAL PROFILESTRENDS 2017
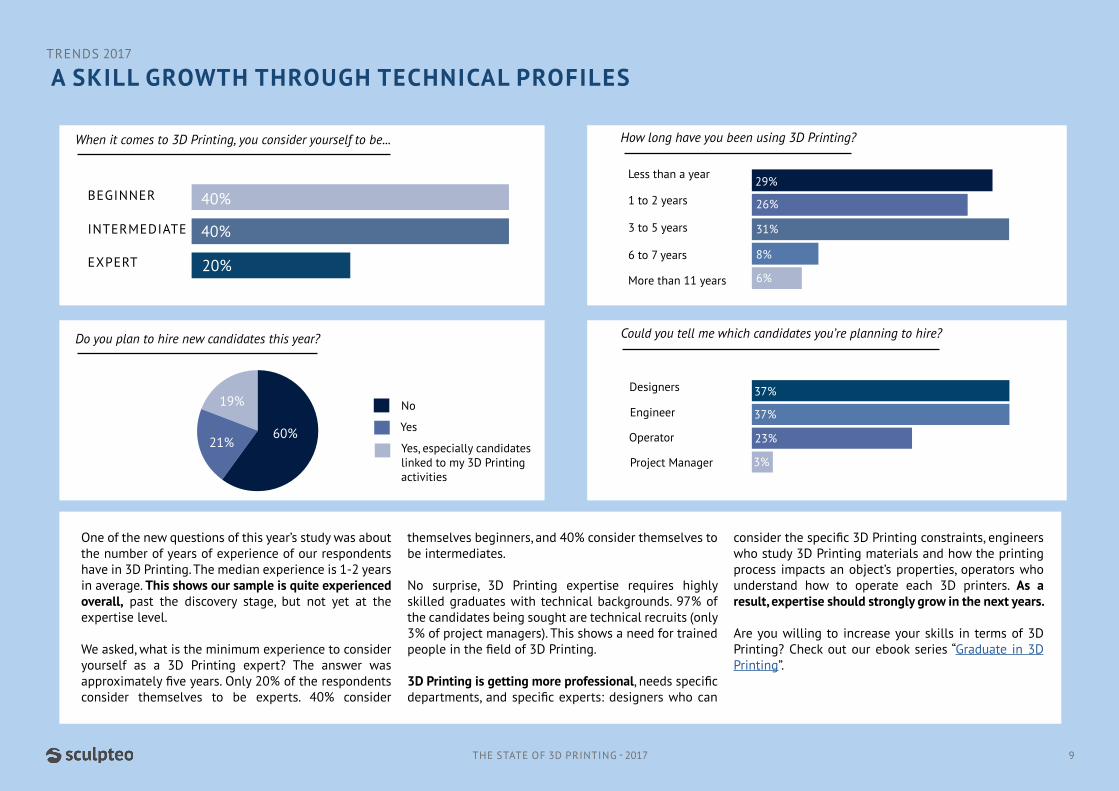
One of the new questions of this year’s study was about the number of years of experience of our respondents have in 3D Printing. The median experience is 1-2 years in average. This shows our sample is quite experienced overall, past the discovery stage, but not yet at the expertise level.
We asked, what is the minimum experience to consider yourself as a 3D Printing expert? The answer was approximately five years. Only 20% of the respondents consider themselves to be experts. 40% consider
themselves beginners, and 40% consider themselves to be intermediates.
No surprise, 3D Printing expertise requires highly skilled graduates with technical backgrounds. 97% of the candidates being sought are technical recruits (only 3% of project managers). This shows a need for trained people in the field of 3D Printing.
3D Printing is getting more professional, needs specific departments, and specific experts: designers who can
consider the specific 3D Printing constraints, engineers who study 3D Printing materials and how the printing process impacts an object’s properties, operators who understand how to operate each 3D printers. As a result, expertise should strongly grow in the next years.
Are you willing to increase your skills in terms of 3D Printing? Check out our ebook series “Graduate in 3D Printing”.
THE STATE OF 3D PRINTING - 2017 9
BEGINNER
INTERMEDIATE
EXPERT
40%
40%
20%
How long have you been using 3D Printing?
Designers
Engineer
Operator
Project Manager
Could you tell me which candidates you’re planning to hire?
Less than a year
1 to 2 years
3 to 5 years
6 to 7 years
More than 11 years 6%
8%
31%
26%
29%
3%
23%
37%
37%
When it comes to 3D Printing, you consider yourself to be...
Do you plan to hire new candidates this year?
Yes, especially candidates linked to my 3D Printing activities
Yes
No19%
21%60%
THE STATE OF 3D PRINTING - 2017
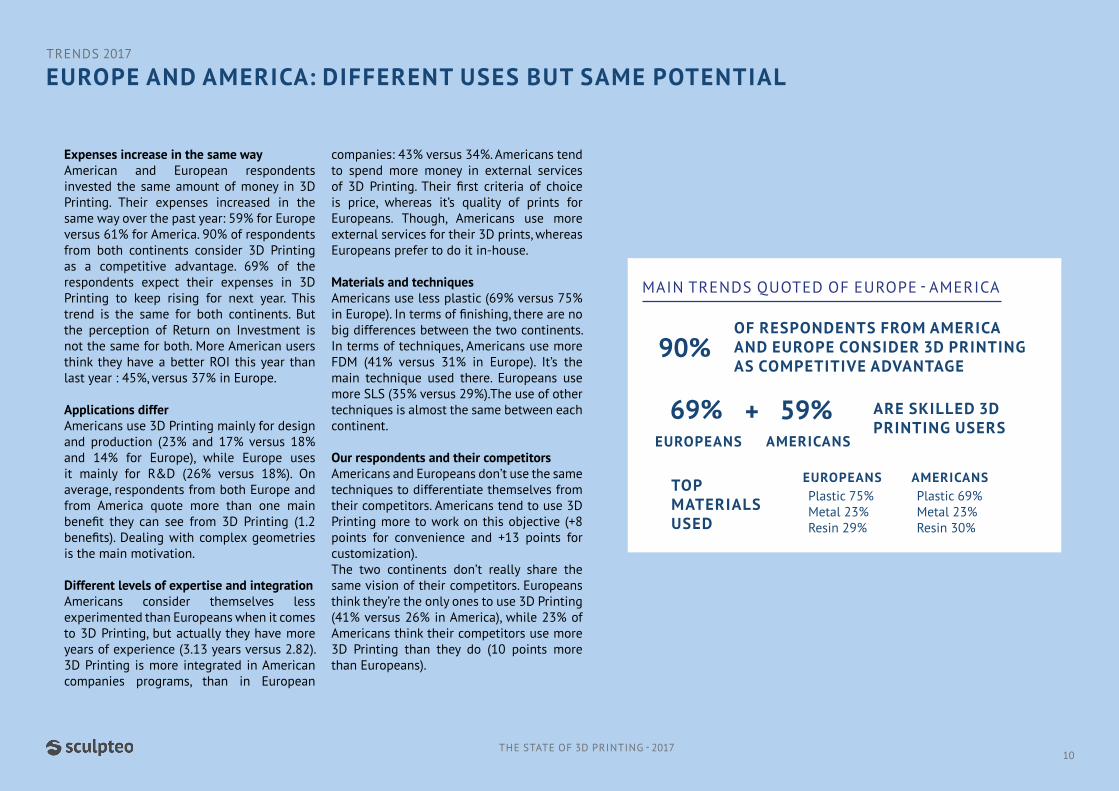
Expenses increase in the same wayAmerican and European respondents invested the same amount of money in 3D Printing. Their expenses increased in the same way over the past year: 59% for Europe versus 61% for America. 90% of respondents from both continents consider 3D Printing as a competitive advantage. 69% of the respondents expect their expenses in 3D Printing to keep rising for next year. This trend is the same for both continents. But the perception of Return on Investment is not the same for both. More American users think they have a better ROI this year than last year : 45%, versus 37% in Europe.
Applications differAmericans use 3D Printing mainly for design and production (23% and 17% versus 18% and 14% for Europe), while Europe uses it mainly for R&D (26% versus 18%). On average, respondents from both Europe and from America quote more than one main benefit they can see from 3D Printing (1.2 benefits). Dealing with complex geometries is the main motivation.
Different levels of expertise and integrationAmericans consider themselves less experimented than Europeans when it comes to 3D Printing, but actually they have more years of experience (3.13 years versus 2.82). 3D Printing is more integrated in American companies programs, than in European
companies: 43% versus 34%. Americans tend to spend more money in external services of 3D Printing. Their first criteria of choice is price, whereas it’s quality of prints for Europeans. Though, Americans use more external services for their 3D prints, whereas Europeans prefer to do it in-house.
Materials and techniquesAmericans use less plastic (69% versus 75% in Europe). In terms of finishing, there are no big differences between the two continents. In terms of techniques, Americans use more FDM (41% versus 31% in Europe). It’s the main technique used there. Europeans use more SLS (35% versus 29%).The use of other techniques is almost the same between each continent.
Our respondents and their competitorsAmericans and Europeans don’t use the same techniques to differentiate themselves from their competitors. Americans tend to use 3D Printing more to work on this objective (+8 points for convenience and +13 points for customization). The two continents don’t really share the same vision of their competitors. Europeans think they’re the only ones to use 3D Printing (41% versus 26% in America), while 23% of Americans think their competitors use more 3D Printing than they do (10 points more than Europeans).
OF RESPONDENTS FROM AMERICA AND EUROPE CONSIDER 3D PRINTING AS COMPETITIVE ADVANTAGE
90%
MAIN TRENDS QUOTED OF EUROPE - AMERICA
ARE SKILLED 3D PRINTING USERS
69% EUROPEANS
59% AMERICANS
TOP MATERIALS USED
Plastic 75%Metal 23%Resin 29%
Plastic 69%Metal 23%Resin 30%
+
EUROPEANS AMERICANS
EUROPE AND AMERICA: DIFFERENT USES BUT SAME POTENTIALTRENDS 2017
10
6%SPEED
4%BETTER QUALITY
5%BETTER EDUCATION
AND AWARENESS
8%PERSONAL USE
17%PRICE DECLINE
10%INNOVATION
3%BETTER SOFTWARE
9%CLIP
6% NEW MATERIALS
10%METAL PRINTING
3%INSTITUTIONAL AND GLOBAL SITUATION
4%SCANNING IMPROVEMENT 4%
CUSTOMIZED AND LIMITED SERIES
THE STATE OF 3D PRINTING - 2017 11
VERBATIMSTRENDS 2017

• New materials• Techniques
3D PRINTINGTECHNOLOGIES45%
Once again this year, we asked our respondents to tell us which trends they think could have a major impact on 3D Printing in the next few years. It’s a good way to get some powerful insights on what the global threats and opportunities are when it comes to 3D Printing.
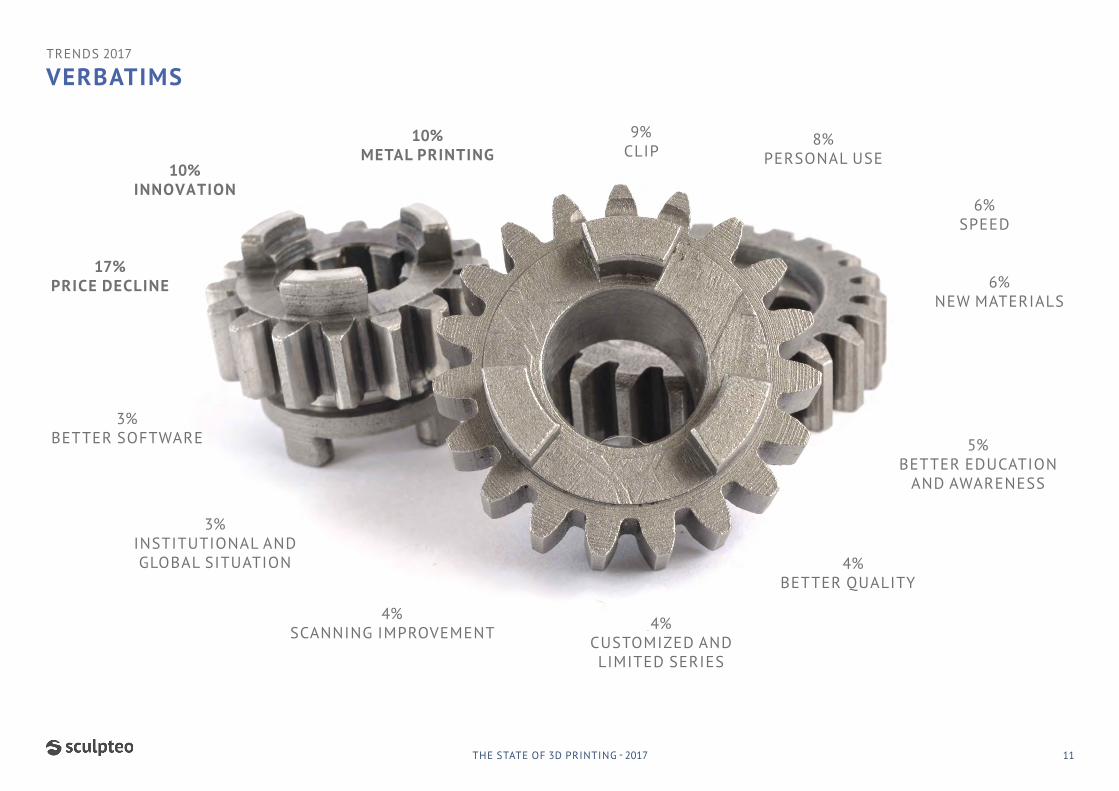
To conduct a proper text analysis, we defined some key words and made a semantic classification. The results are the verbatims showed on the previous page. Among the answers we analyzed, 13 keywords and trends emerged quite clearly. The percentages quoted here represent the share of respondents who quoted this keyword as a trend which could have a major impact. Cost decline (17%), metal printing (10%), and innovation (10%) are the top notions used by the respondents.
InnovationAdditive manufacturing is already a very innovative area. If we trust our respondents, new techniques and materials are still going to change it a lot. 10% said innovation would have a major impact. Which innovations will change the face of 3D Printing according to them? When it comes to materials, Metal 3D Printing is quoted by 10% of our respondents. New materials in general is quoted by 6% of them. New technologies also offer new interesting possibilities for 3D Printing, like CLIP. CLIP was quoted by 9% of our respondents. Efficiency, which was mentioned by 11% of our respondents last year, was not quoted in this study. The number of people quoting speed and quality is also decreasing.
DemocratizationGlobal cost decline is the major trend quoted by our respondents (17%). Thanks to this, it makes the use of this technology easier for many companies. Awareness and education are also increasing (5%), which helps make the market grow significantly every year. Moreover, in a world where customers always wish to get the most personalized experience that they can, companies have to satisfy customers needs. 3D Printing is a real partner for them, especially with the possibilities this technology offers in terms of production of customized products and limited series. This trend was quoted by 4% of our respondents. Cost decline also means that the technology is easier to access for final consumers. That’s why personal use of 3D Printing is still seen as a major opportunity (8%).
What’s next?Even if there are major opportunities for 3D Printing, some threats still exist. First, the global situation in terms of economics and politics, and the risks of regulatory changes for technology create uncertainty (3%). Moreover, a tech giant could enter the market and totally change the current dynamics. To keep being such a promising market, 3D Printing needs to improve on some points. For instance, 3D Printing softwares could improve in order to make the whole process easier (3%). Globally, there’s no issue with education, it’s technology which needs to improve. Thus, this sector can still achieve highest and fastest growth.
OPPORTUNITIES ARE STILL LARGER THAN THREATSTRENDS 2017
12THE STATE OF 3D PRINTING - 2017
MAIN TRENDS QUOTED
EASIER TO USE28%• Cost decline• Speed
THE STATE OF 3D PRINTING - 2017
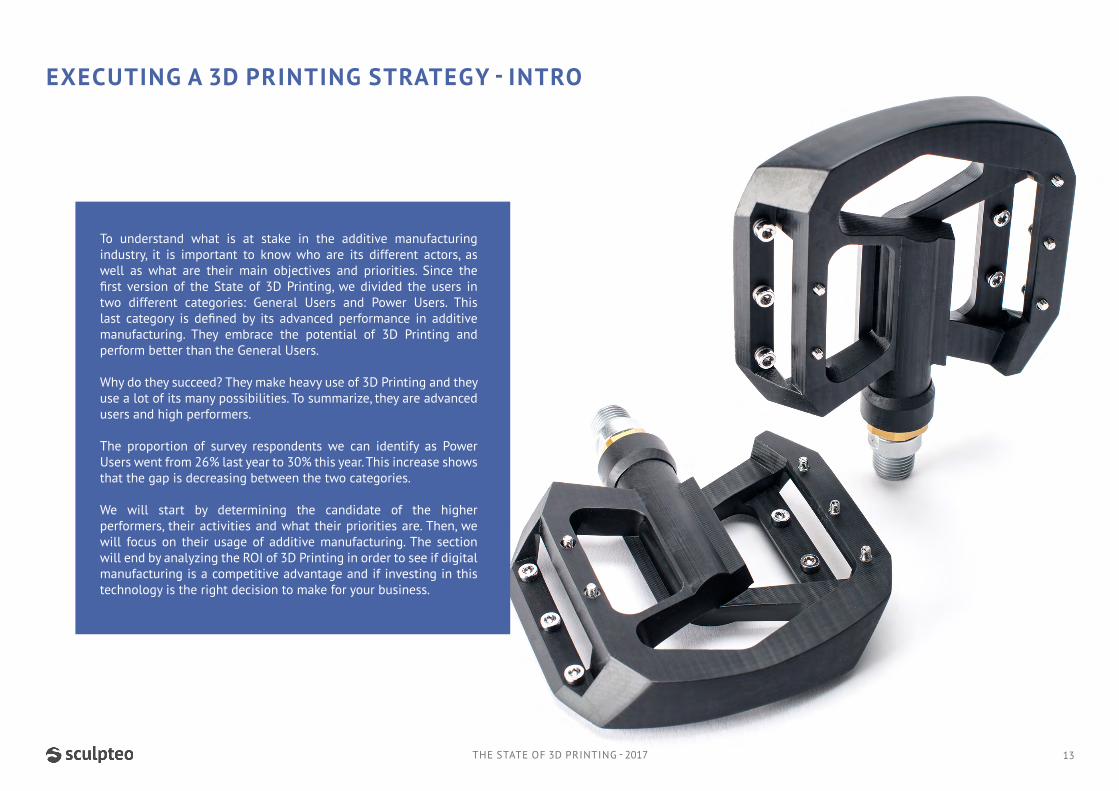
To understand what is at stake in the additive manufacturing industry, it is important to know who are its different actors, as well as what are their main objectives and priorities. Since the first version of the State of 3D Printing, we divided the users in two different categories: General Users and Power Users. This last category is defined by its advanced performance in additive manufacturing. They embrace the potential of 3D Printing and perform better than the General Users.
Why do they succeed? They make heavy use of 3D Printing and they use a lot of its many possibilities. To summarize, they are advanced users and high performers.
The proportion of survey respondents we can identify as Power Users went from 26% last year to 30% this year. This increase shows that the gap is decreasing between the two categories.
We will start by determining the candidate of the higher performers, their activities and what their priorities are. Then, we will focus on their usage of additive manufacturing. The section will end by analyzing the ROI of 3D Printing in order to see if digital manufacturing is a competitive advantage and if investing in this technology is the right decision to make for your business.
EXECUTING A 3D PRINTING STRATEGY - INTRO
13

How long have you been using 3D Printing?
Less than a year
1 to 2 years
3 to 5 years
6 to 7 years
More than 11 years Power Users
Total Users
You consider yourself to be...
Power Users
Are you...?
an expertan intermediatea beginner
Total Users
7%
a hobbyista professional other
Total Users 40% 40% 20%
16% 46%Power Users 38%
47%
44%
9%
EXPERTISE IS A KEY FACTOR TO BOOST PERFORMANCEEXECUTING A 3D PRINTING STRATEGY
14THE STATE OF 3D PRINTING - 2017
93%
9%
23%
44%
16%
9%
29%
26%
31%
8%
3D Printing is much separate
3D Printing permeates some of our programs
3D Printing permeates most of our programs
3D Printing permeates all of our programs
We are a 3D Printing-first company
Total UsersPower Users
To what extent 3D Printing permeates your activity?
3%
11%
Don’t know
7%
30%
6%
9%20%30%
30%
19%
26%9%
15%
21%
When looking at the use of 3D Printing inside the organizations of Power Users, this technology is highly integrated into the companies activities. 21% are 3D Printing-first companies, compared to 15% of the regular sample, and only 11% of the Power Users work in companies where 3D Printing is much separated from the rest of their activities, compared to 20% for the regular sample.
Concerning the years of experience in 3D Printing, it gives a wider picture of the difference of experience between Power Users and the average respondents. Only 9% of Power Users
have less than one year of experience in 3D Printing, compared to 29% of the total respondents. 69% of the Power Users have more than 3 years of experience (among which 25% have more than 6 years of experience), compared to 45% in average (among which 14% have more than 6 years of experience).
The median experience is 1-2 years in average, and 3-5 years for Power Users. This shows our sample is quite experienced overall, past the discovery stage, but not yet at the expertise level.
What should you do? It’s easy to see that Power Users are mainly professionals. Due to this fact, they tend to be better trained to use this technology. Their level of experience is significantly higher than in our regular sample.
Expertise clearly appears to be the key factor that helps you improve performance when it comes to additive manufacturing. We advise you to work with people with experience in the subject, it will help you gain in efficiency and significantly increase your performance.

Selective Laser Sintering (SLS)
Fused Deposition Modeling (FDM)
Stereolithography (SLA)
Multijet/Polyjet
Digital Light Processing (DLP)
Direct Metal Laser Sintering (DMLS)
1%
0.6%2%
Power Users
57%
20%
85%
23%
1%
8%5%
8%10%
I do
There are people in my company to do it
Nobody
Other
Total Users
Power Users
9% 3%
3%
2%
External Service
3%
3%
25%
25%
60%
67%
HIGH PERFORMERS ARE 3D PRINTER-AGNOSTICEXECUTING A 3D PRINTING STRATEGY
It is obvious that high performers use more materials since Power Users take advantage of 3D Printing for different applications. On average, they use 2.4 materials, while respondents of our global sample use 1.9 materials. Plastic is the most used material for Power Users, like for Total Users, followed by Resin, but they tend to test more materials
When looking at how our respondents acquire their 3D models, two interesting trends can be spotted. First, the majority of respondents create the 3D designs themselves. 92% of Power Users have someone inside their company to design their 3D models. This indicates that 3D Printing is settling into companies’ processes, and specific departments for 3D Printing are more and more common.
The second trend is the closing of the gap between Power
Users and the average. 67% of Power Users state that they create their own 3D files, compared to 60% on average. Once again, this is an indication that we are in a phase of education of the market, and the gap is closing between different users of the technology.
Moreover, 57% of Power Users have their own 3D printer (compared to 36% of Total Users). Among them, 35% possess more than one 3D printer (compared to 15% of total users). For half of Power Users, the 3D printer they possess uses the FDM 3D Printing technology (57%). The second main one is SLA (20%). The big difference with Total Users is that in total, FDM is more largely predominant (85%). Power Users have a stronger tendency to invest in more advanced, more expensive 3D printers than FDM ones.
What should you do?Expertise in terms of 3D Printing is not the only key factor of success. To become a high performer, you need to follow up quickly with new techniques. Using new materials, which perfectly fit your needs, can help you increase your performance significantly. You can also decide to use a less common 3D printer.
Learning 3D design, or training a team in your company to work specifically on 3D modeling can also be important to product development. The advantage of having a specific team working on CAD software is increased mastery and knowledge of the technology. As a result, technical knowledge and expertise inside companies is a real competitive advantage.
THE STATE OF 3D PRINTING - 2017
Total Users Power Users
Which material do you use for 3D Printing?
Plastics Resins Metals CeramicsMulticolorSandstone
Other
4% 4%
Wax
Total Users
15
91% 50% 40% 20% 15% 18%88% 28% 15% 10% 11%35%
Who works on 3D modeling in your company? Which 3D printer do you own?

ACCELERATINGPRODUCT DEVELOPMENT
OFFERING CUSTOMIZED PRODUCTS AND LIMITED SERIES
ENABLINGCO-CREATION
INCREASINGPRODUCTION FLEXIBILITY
IMPROVINGSPARE PARTS MANAGEMENT
REDUCINGTOOLING INVESTMENT
BUYINGA 3D PRINTER
OTHER
OPTIMIZING DEMOPRODUCTS EXPENSES
All Users Power Users
1216
One interesting thing about Power Users is that they quote more than one top priority related to 3D Printing. It shows that they fully embrace the potential of this technology, seeing it as a partner to help mitigate challenges. Since there are more early adopters among them, this trend is logical: they had more time to fully understand how 3D Printing can help them.
Like in our previous studies, accelerating product development remains the main priority. But as the technology is improving, 3D Printing is expanding its scope of uses. It now helps with production itself, especially when a company wants to offer customized products and limited series. Moreover, it helps increasing global production flexibility. In the end, it can be used during the whole lifetime of a product, being also really helpful to produce spareparts for sold products.
In the next five years, our respondents assume their priorities will remain the same, but the gap between Power Users and our global sample is increasing. High performers seem to foresee that 3D Printing’s potential is going to improve a lot in the near future.
What should you do?Of course, 3D Printing can help you a lot with product development. But to increase your performance, we advise you to fully embrace the potential of this technology, for every moment of your product’s lifetime. Producing with 3D Printing will especially be helpful if you release short series, or products with complex shapes, or if spare parts management is an important challenge for your activity.
9%
58%
34%
29%
19%
13%
19%
17%
6%
9%
28%
16%
13%
9%
6%
9%
9%
6%
4%
PRODUCT DEVELOPMENT IS THE MAIN PRIORITY EXECUTING A 3D PRINTING STRATEGY
THE STATE OF 3D PRINTING - 2017
What are your top priorities for your organization in 2017?

Do you consider 3D Printing as a competitive advantage in your strategy?
Power Users
In your market, do your competitors also use 3D Printing?
Power Users
81% of Power Users believe that their competitors also use 3D Printing, versus 59% for total respondents. This question can be understood in two different ways: either it means that Power Users work in fields in which 3D Printing is most relevant, and this is how they have acquired their expertise. Or Power Users have a clearer view of their competitors’ practices and are more aware that they use 3D Printing, even if it’s a marginal part of their activity.
Furthermore, we can see that Power Users saw a greater ROI (57%) than last year, while only 47% of
the Total Users saw a greater ROI of 3D Printing. This difference might be due to differences in the usage of this technology. But they have the same will to invest in specialized workforce to boost their performance. 47% of Power Users plan to hire new candidates this year, half of them being candidates specialized in 3D Printing. Either for Power Users and for our global sample, 97% of the candidates seeked are technical (there are only 3% of project managers).
What should you do?Investing in 3D Printing shows great results: Return
on Investment is good for our respondents, and it’s increasing year over year. Using this technology is a good way to differentiate yourself from your competitors and to gain a competitive advantage over other companies.
Since it’s showing good results, the 3D Printing job market is dynamic. Hiring new candidates is essential to remain competitive and innovative. More specifically, hiring technical candidates is a must in the world of 3D Printing.
Compared to 2015, what is the evolution of your turnover in 2016?
Increase by 51% to 100%
No change
Decrease by 1% to 50%
Decrease by 51% to 100%Increase by 1% to 50%
Increase by 101% or more
9% 3%
3%
Total Users
Power Users
10%
What is the ROI of 3D Printingin your activity this year?
Compared to last year :
Greater
LowerAbout the same
5%
8% Yes
No
Total Users
Yes, as much as us
Yes, more than us
I don’t know
Other
Yes, less than us
No
4%
Total Users
Power Users
I have no competition
3%
1%
5%
90% 95%
17%
18%
25%
27%
39%
32%
14%
14%
47%
36%
31%
35%12%
10%
13%
5%
Total Users
45%
47%
38%
57%
3D PRINTING DRIVES COMPETITIVE ADVANTAGEEXECUTING A 3D PRINTING STRATEGY
THE STATE OF 3D PRINTING - 2017 17

YEAR-OVER-YEAR CONTRAST
Return on Investment for 3D Printing was greater than last year for 47% of respondents, while they were only 40% to say in 2016.
3D Printing is a very innovative sector where technologies change fast. Comparing this year’s trends with last year’s results is a good way to understand the changes this industry is going through.
Last year, we started making these comparisons and they helped us get some powerful insights about the evolution of additive manufacturing. This year,
we assume the number of respondents allows us to make some serious conclusions about this topic.
This section is divided in 3 parts, synthesizing the results:
• The growth of the additive manufacturing market doesn’t soften
• Accelerating product development remains the main priority of our respondents
• 3D Printing technologies and their uses evolve over the years
We did our best to provide you with an analysis for each topic, explaining to you what these changes actually mean. Thus, we hope this section will help you get a better understanding of the current dynamics.
THE STATE OF 3D PRINTING - 2017 18
2016 2017
What is the ROI of 3D Printing in your activity this year?
Compared to last year :Greater
LowerAbout the same
8%6%Did you use 3D Printing last year?
2017
Yes
No
2016
54%40%
45%47%
20%
80%
23%
78%
Amount spent on 3D Printing
2016
2017
$1 to $1000
$1001 to $10,000
$10,001 to $50,000
$50,001 to $100,000
More than $100,000
2%
2%
6%
4%
3%
2016
Do you plan to hire new candidates this year?
8%
Yes, especially candidates linked to my 3D Printing activities
YesNo
2017
24%
68%
19%21%
60%
7%
25%
27%
66%
60%
Compared to last year, we see the number of new users of 3D Printing increasing, which shows a certain dynamism of the market. Indeed, 23% of our respondents did not use 3D Printing last year, while they were 20% to say so last year.
3D Printing users seem to be satisfied from their investments in this technology, since they get good results and high Return on Investment. This ROI is even increasing over the years. 47% of the respondents said they saw a greater ROI than last year, while they were only 40% to say so last year.
Since our respondents are satisfied from the results they get, they keep investing more and more in 3D Printing. Thus, their expenses increase. The number of respondents spending less than $1000 per year in 3D Printing dropped from 66% to 60%, while the share of people spending between $1001 and $50 000 went from 31% to 34%, and from 4% to 7% for respondents spending more than $50 000.
On average, our respondents said their budget for 3D Printing in 2017 would be $9504, up from $6132 last year, an average budget increase of 55%. These results contradict the Wholers Report, which jumped to the conclusion that the market was observing a pause, due to a market growth that went from 25.9% in 2015 to 17.4% in 2016. But our growth indicators clearly show that it’s not the case.
Another consequence from this increasing Return on Investment is the impact it has on the job market. The number of companies using 3D Printing that hire is increasing year over year, especially for candidates specialized in 3D Printing.
This year, 40% of our respondents plan to hire new candidates, especially candidates specialized in 3D Printing for 19% of our respondents. Last year, they were only 30% to plan to hire, with 8% planning to hire specialized candidates.
19THE STATE OF 3D PRINTING - 2017
3D PRINTING MARKET: NO SOFTEN GROWTH FOR 2017YEAR-OVER-YEAR

Study of 2016
Study of 2017
2017 2022
ACCELERATINGPRODUCT DEVELOPMENT
OFFERING CUSTOMIZEDPRODUCTS AND LIMITED SERIES
ENABLINGCO-CREATION
INCREASINGPRODUCTION FLEXIBILITY
IMPROVINGSPARE PARTS MANAGEMENT
REDUCINGTOOLING INVESTMENT
BUYINGA 3D PRINTER
OTHER
OPTIMIZING DEMOPRODUCTS EXPENSES
4%
5%
4%
5%
26%
25%28%
25%
10%9%
10% 13%
8%
8%
6%
9%
7%
14%13%
8% 9%
9% 10%
6%
6%
6%
11% 16%
15%
18%18%
16%
8%8%
6% 6%
For this third edition of the State of 3D Printing, there is one trend that becomes more and more striking over the years. Accelerating product development remains the top priority of our respondents for this third year.
Developing better products faster is a great way to deal with competitors and to make a difference. 3D Printing has been since the beginning a great partner of product innovation and there’s no reason for change.
Accelerating product development is quoted by
28% of our respondents, which is 2 points higher than last year, showing that this concerns takes more and more importance. The gap becomes even bigger with other concerns. For instance, product customization dropped from 18% to 16%. Globally, top priorities of our respondents are stable in time, even when they think of their future priorities.
In five years, they assume their concerns will be almost the same. Noticeable fact: buying a 3D printer seems to be more of a priority five years from now.
20THE STATE OF 3D PRINTING - 2017
TOP PRIORITIES ARE BECOMING CONSTANTYEAR-OVER-YEAR
3D PRINTING PRIORITIES

Polyjet/Multijet
Fused Deposition Modeling/FDM
Selective Laser Sintering/SLS
Direct Metal Laser Sintering/DMLS
Digital Light Processing
Selective Deposition Lamination/SDL
4%
2%
3%
1%
Binder Jetting
Electron Beam Melting/EBM
Laminated Object Manufacturing/LOM
Selective Laser Meting/SLM
CLIP
Fusion Jet
2%
2%
2%
4%
2%
Stereolithography/SLA
1% 1%
4%
The use of plastic is growing, from 73% of our respondents last year to 88% this year, even if it’s not the most represented material in the media. Resin material, which is very solid and resistant, is used by 35%, an 8 points increase over last year. It is followed by metal (28%), more used than last year (23%).
What are the reasons of the increasing usage of plastic? It is considered to be an ideal material as it is one of the most affordable and the most versatile. Metal is not growing as fast as one can expect even if it has a great potential.
Fused Deposition Modeling (FDM) is the
most used technology (36%), followed by SLS (33%) and SLA (25%). Last year, SLS was the most used one (38%), followed by FDM and SLA. 3 technologies make their entrance in our study this year: SLM, CLIP and Fusion Jet. All technologies are more used than last year, except SLS.
This shows that our respondents have a better expertise in 3D Printing and embrace the potential of each technology.
In terms of finishes, the use of polishing increased (4 points more than last year). The use of painting and varnishing are quite stable over the years.
21THE STATE OF 3D PRINTING - 2017
RESIN’S INNOVATION LEADS MARKET TRANSFORMATIONYEAR-OVER-YEAR
2016 2017
Plastics Resins Metals CeramicsMulticolorSandstone
Other
4% 4%
Wax
TOP 3D PRINTING MATERIALS
TOP 3D PRINTING TECHNOLOGIES
2016 2017
13%
7%
7%
14%
38%
31% 36%
33%
25%
13%
7%
8%
88% 35% 28% 15% 10% 10%73% 26% 23% 13% 8% 8%

SECTORIAL INSIGHTS
THE STATE OF 3D PRINTING - 2017 22
Since our first edition of the ‘State of 3D Printing’, we want this survey to be a real decision-making tool for you. That’s why we provide you a global overview of the main trends, strategy orientations, powerful insights and the maximum amount of accurate data that we can.
To help you make even better decisions, we go even deeper in our research. In this last part,
you will find a detailed sector analysis. Our goal is to give you an overall idea of how each sector changes and deals with 3D Printing, so that you can make clarified decisions.
Our respondents are mainly coming from four sectors: consumer goods, industrial goods, high technologies and services. For each sector, you will find a point-by-point comparison between the sector
and the total of our respondents, showing you what are the main significant differences.
We wish that this survey will help you benchmark your activity to other companies, either in your own sector or in other ones.
7% 5%4% 5%
EXPENSES
Consumer Goods
3%
3%
6%
APPLICATIONS MATERIALS
Consumer Goods All Users
4%
Lower than the previous year
About the same as the previous year
Greater than the previous year
All Users
49%
RETURN ON INVESTMENT OF 3D PRINTING
47% 45% 8%45% 6%
Proof ofConcept
Prototype Production Education Marketing Samples
Other Plastics Resins Metals CeramicsMulticolorSandstone
Other
4% 4%
WaxArt Hobby
2017
All Users
4%
6%
2016
IncreaseNo changeDecrease
Consumer Goods
6%4%
Consumer Goods All Users
Expected Expenses in 2017
69%
61%
27%
33%
88% 35% 28% 15% 9% 11%80% 24% 36% 19% 13% 13%23% 34% 22% 10% 8%21% 33% 22% 11% 11%
CONSUMER GOODSSECTORIAL INSIGHTS
23THE STATE OF 3D PRINTING - 2017
62%
49%
32%
47%
78%
72%
19%
25%

CONSUMER GOODS
Consumer Goods
INTEGRATIONTOP PRIORITIES
EXPERTISE
3D Printing is quite separate
3D Printing permeates some of our programs
3D Printing permeates most of our programs
3D Printing permeates all of our programs
We are a 3D Printingfirst company
All Users
ExpertsIntermediatesBeginners
All Users 40%
36% 24% 40%
40%
Consumer Goods
Don’t know
4%
4%
6%
ACCELERATING PRODUCTDEVELOPMENT
OFFERING CUSTOMIZED PRODUCT AND LIMITED SERIES
ENABLING CO-CREATION
INCREASING PRODUCTION FLEXIBILITY
IMPROVING SPARE PARTS MANAGE-MENT
REDUCING TOOLING INVESTMENT
BUYING A 3D PRINTER
OTHER
OPTIMIZING DEMO PRODUCTS EXPENSES
Consumer Goods All users
6%6%
3%
4%
20%
Do you consider 3D Printing as a competitive advantage in your strategy?
Consumer Goods
10%6% Yes
No
All users
90%94%
15%
20%
21%
30%
24%
19%
10%
7%
27%
15% 9%
28%
16%
9%
13%
9%
9%
29%
20%
9%
7%
7%
14%
SECTORIAL INSIGHTS
24THE STATE OF 3D PRINTING - 2017
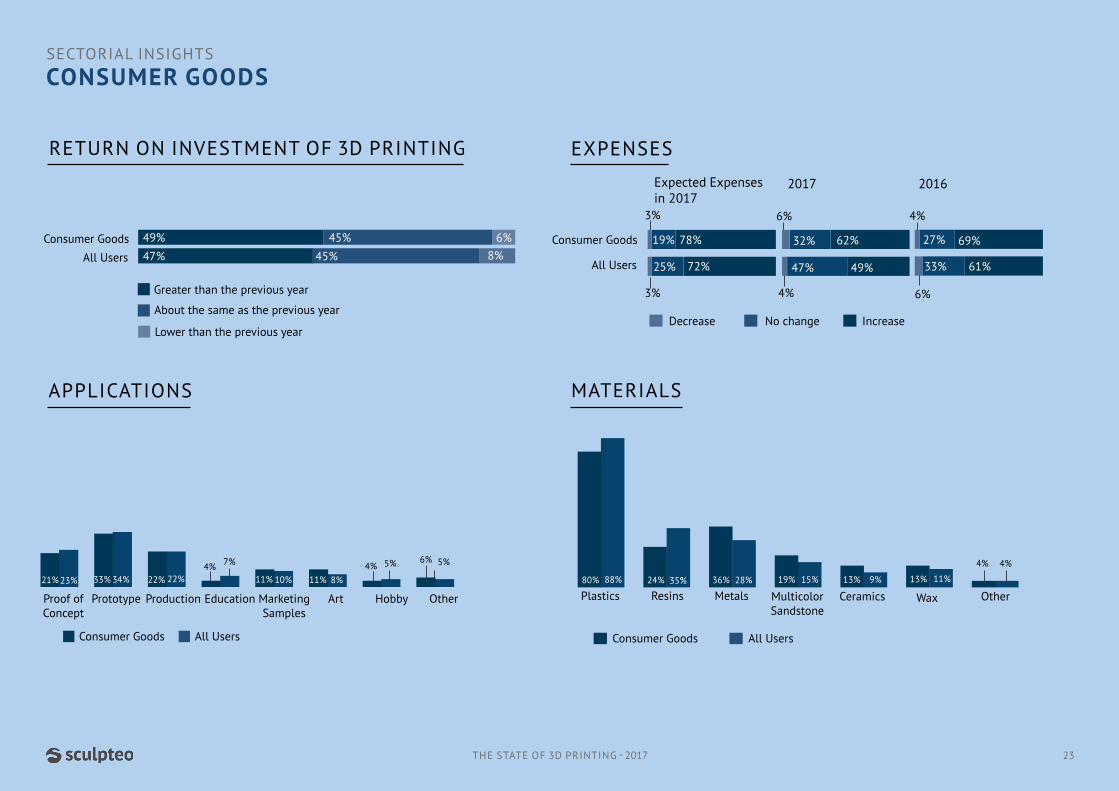
Consumer Goods is a very dynamic sector for 3D Printing. This year, expenses in 3D Printing increased significantly more in this industry than average (62% versus 49%), and 78% of the respondents expect it to increase again in 2017.
Return on Investment is strongly growing: 49% of our respondents said they saw a greater ROI than last year, compared to 40% for our previous study. 3D Printing is definitely seen as a competitive advantage (95%).
The main priority for this sector is to accelerate product development (29%). 3D Printing is a real
partner for these companies to achieve those goals. It is mainly used for prototyping (33%) and for production (22%).
Even though plastics are still the most used materials for 3D Printing in the Consumer Goods sector, the use of metals is strongly increasing.
Last year, they were only used by 31% of our respondents from this industry. This year, this number goes up to 36%. Multicolor sandstone is also gaining new users: its usage in this sector saw an increase of 4 points in one year.
78%
72%
18%
25%
70%
49%
28%
47%
68%
61%
28%
33%
Industrial Goods
4%
Industrial Goods
EXPENSES
APPLICATIONS MATERIALS
2%
Lower than the previous year
About the same as the previous year
Greater than the previous year
All Users50%
RETURN ON INVESTMENT OF 3D PRINTING
47% 45% 8%46%
Proof ofConcept
Prototype Production Education Marketing Other
29%
Art Hobby
2017
All Users
4%
2016
IncreaseNo changeDecrease
Industrial Goods
23% 45% 34% 33% 22% 10%11% 14% 8%
5% 9%
Plastics Resins Metals Ceramics
73% 88% 27% 35% 29% 28%
MulticolorSandstone
9% 15%
Other
3% 4%
12% 11%
Wax
4%
All UsersIndustrial Goods All Users
7% 4% 5% 9%
5%
4%3% 6%
Expected Expenses in 2017
INDUSTRIAL GOODSSECTORIAL INSIGHTS
25THE STATE OF 3D PRINTING - 2017
INTEGRATIONTOP PRIORITIES
Industrial Goods
EXPERTISE
ExpertsIntermediatesBeginners
All Users 40%
50% 24% 26%
40% 20%
8%
4%
37%28%
14%16%
19%13%
9%
7%9%
6%
ACCELERATING PRODUCTDEVELOPMENT
OFFERING CUSTOMIZED PRODUCT AND LIMITED SERIES
ENABLING CO-CREATION
INCREASING PRODUCTION FLEXIBILITY
IMPROVING SPARE PARTS MANAGE-MENT
REDUCING TOOLING INVESTMENT
BUYING A 3D PRINTER
OTHER
OPTIMIZING DEMO PRODUCTS EXPENSES
15%
Industrial Goods All users
9%
6%
8%
6%
6%
Industrial Goods
3D Printing is quite separate
3D Printing permeates some of our programs
3D Printing permeates most of our programs
3D Printing permeates all of our programs
We are a 3D Printingfirst company
All Users
31% 22% 26%
15% 30% 20% 19% 7%
12%
Don’t know
15% 9%
8%
2%
Do you consider 3D Printing as a competitive advantage in your strategy?
Industrial Goods
10% Yes
No
All Users
9%
91% 90%
INDUSTRIAL GOODSSECTORIAL INSIGHTS
26THE STATE OF 3D PRINTING - 2017
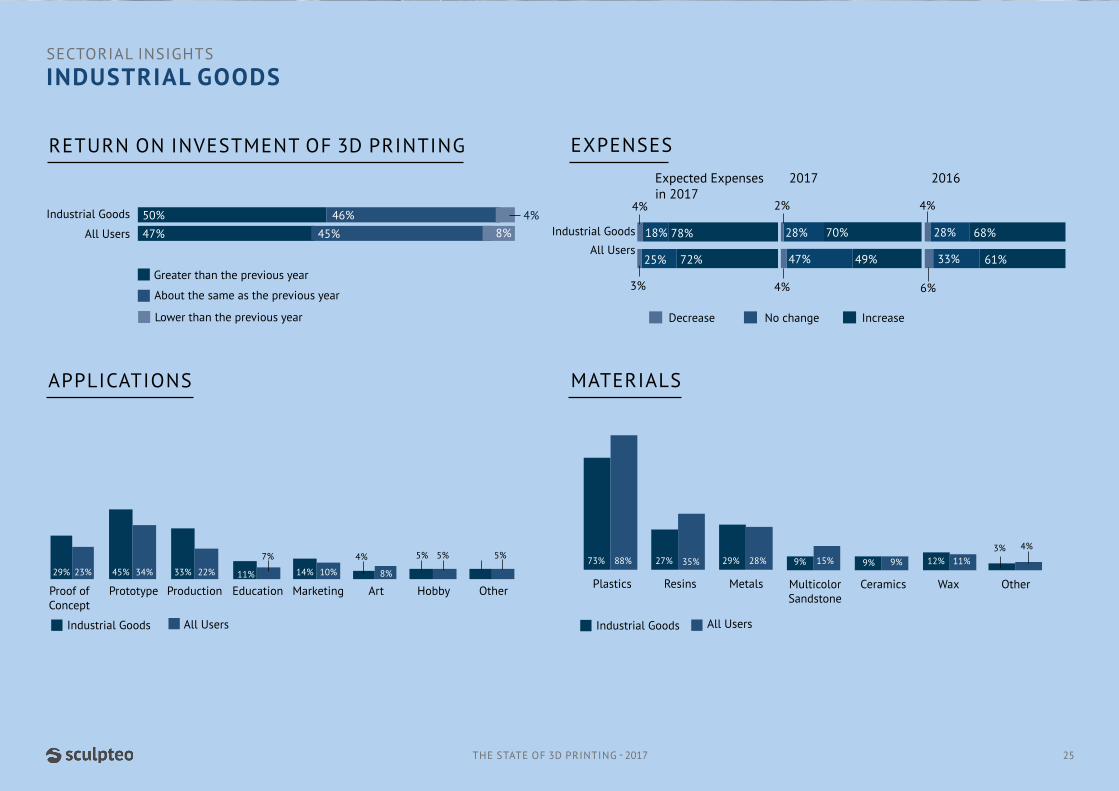
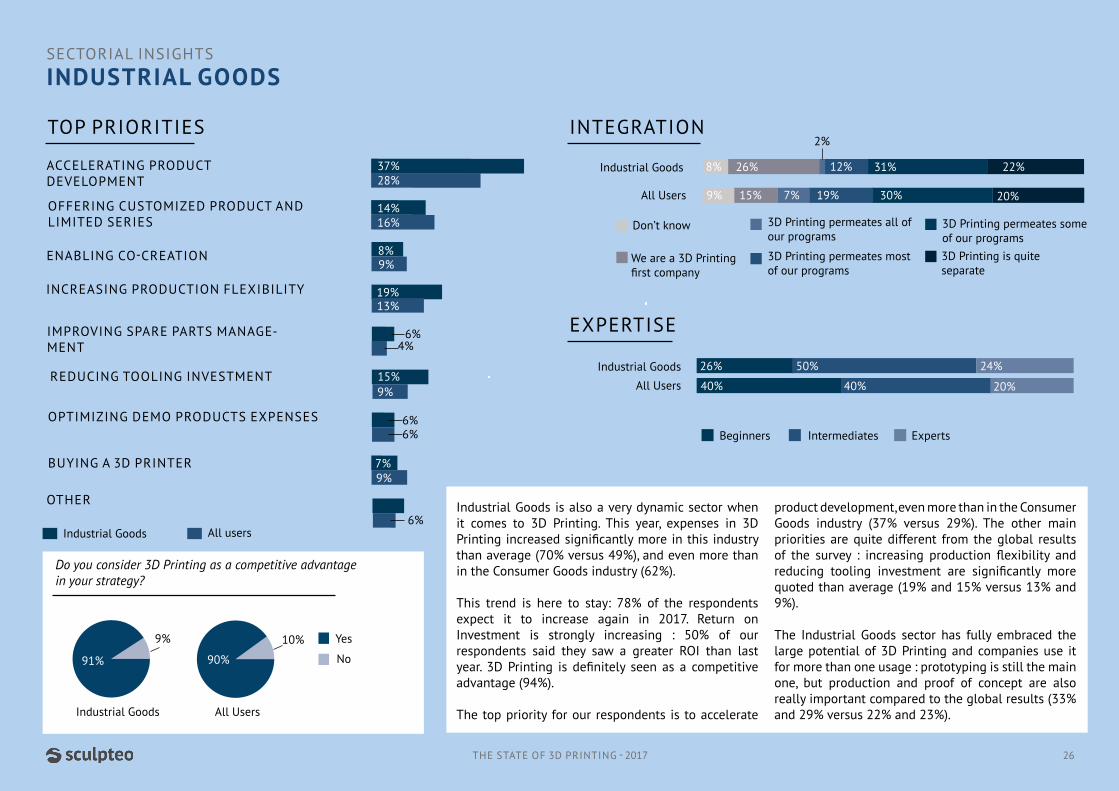
Industrial Goods is also a very dynamic sector when it comes to 3D Printing. This year, expenses in 3D Printing increased significantly more in this industry than average (70% versus 49%), and even more than in the Consumer Goods industry (62%).
This trend is here to stay: 78% of the respondents expect it to increase again in 2017. Return on Investment is strongly increasing : 50% of our respondents said they saw a greater ROI than last year. 3D Printing is definitely seen as a competitive advantage (94%).
The top priority for our respondents is to accelerate
product development, even more than in the Consumer Goods industry (37% versus 29%). The other main priorities are quite different from the global results of the survey : increasing production flexibility and reducing tooling investment are significantly more quoted than average (19% and 15% versus 13% and 9%).
The Industrial Goods sector has fully embraced the large potential of 3D Printing and companies use it for more than one usage : prototyping is still the main one, but production and proof of concept are also really important compared to the global results (33% and 29% versus 22% and 23%).

72%
83%
25%
17% 56%
49%
36%
47%
56%
61%
39%
33%
High Tech
8%
EXPENSES
2017
Lower than the previous year
About the same as the previous year
Greater than the previous year
All Users54%
RETURN ON INVESTMENT OF 3D PRINTING
47% 45% 8%42% 4%
5%
2016
IncreaseNo changeDecrease
High Tech
All Users
4%3% 6%
High Tech
APPLICATIONS MATERIALS
Proof ofConcept
Prototype Production Education Marketing Other
27%
Art Hobby
23% 29% 34% 18% 22% 10%9% 8%
5% 9%
Plastics Resins Metals Ceramics
70% 88% 35% 35% 23% 28%
MulticolorSandstone
11% 15%
Other
4%
11% 11%
Wax
All usersHigh Tech All users
7% 6% 4% 6%5%4%6%
HIGH TECHSECTORIAL INSIGHTS
27THE STATE OF 3D PRINTING - 2017
Expected Expenses in 2017

INTEGRATIONTOP PRIORITIES
EXPERTISE
ExpertsIntermediatesBeginners
All Users 40%
50% 21% 29%
40% 20%
High Tech
High Tech
3D Printing is quite separate
3D Printing permeates some of our programs
3D Printing permeates most of our programs
3D Printing permeates all of our programs
We are a 3D Printingfirst company
All Users
33% 15% 11%
15% 30% 20% 19% 7%
19%
Don’t know
15% 9%
11%
8%
4%
28%28%
15%16%
18%13%
9%
8%9%
6%
ACCELERATING PRODUCTDEVELOPMENT
OFFERING CUSTOMIZED PRODUCT AND LIMITED SERIES
ENABLING CO-CREATION
INCREASING PRODUCTION FLEXIBILITY
IMPROVING SPARE PARTS MANAGEMENT
REDUCING TOOLING INVESTMENT
BUYING A 3D PRINTER
OTHER
OPTIMIZING DEMO PRODUCTS EXPENSES
8%
High Tech All users
9%
6%
7%
3%
11%
3%
8%
Do you consider 3D Printing as a competitive advantage in your strategy?
High Tech
10%8% Yes
No
All Users
HIGH TECHSECTORIAL INSIGHTS
28THE STATE OF 3D PRINTING - 2017
High Tech is a sector with high potential for 3D Printing. The respondents tend to see greater Return on Investment than in other sectors. 54% said they saw a greater ROI than last year, while 47% of our global respondents said so. And this dynamic is here to stay: 83% expect their expenses to grow in 3D Printing for next year, while only 72% of our total respondents said so.
People seem to have more expertise when it comes to 3D Printing in the High Tech sector. 71% consider themselves either intermediate or expert, while they’re only 60% to say so in the global survey.
3D Printing is mostly used before products are launched. It helps companies to accelerate their product development, but it’s not the only usecase quoted.
People working in High Tech companies tend to use 3D Printing in order to increase production flexibility (18% versus 13% for the global sample). Thus, they use it mainly for prototyping, but also for proof of concept which is a particular trend of this industry. 27% of our respondents use 3D Printing for this, while they are only 23% in our global sample.
92% 90%

Services
25% 72%34% 59%
Services
22% 78%
EXPENSES
APPLICATIONS MATERIALS
6%
47% 49%
Lower than the previous year
About the same as the previous year
Greater than the previous year
All Users71%
RETURN ON INVESTMENT OF 3D PRINTING
47% 45% 8%27%
Proof ofConcept
Prototype Production Education Marketing Samples
OtherArt Hobby
2017
All Users28%
33%
68%
61%
4%
2016
IncreaseNo changeDecrease
Services
5%
Plastics Resins Metals CeramicsMulticolorSandstone
Other
3% 4%
Wax
3%
All usersServices All users
7% 6% 6%5%
4%3% 6%
Expected Expenses in 2017
88% 35% 28% 15% 9% 11%70% 32% 18% 20% 12%
7%
23% 34% 22% 10% 8%16% 24% 20% 8% 8% 16%
SERVICESSECTORIAL INSIGHTS
29THE STATE OF 3D PRINTING - 2017

2% 3%
TOP PRIORITIES
8%
4%
22%28%
34%16%
7%13%
9%
9%
6%
ACCELERATING PRODUCTDEVELOPMENT
OFFERING CUSTOMIZED PRODUCT AND LIMITED SERIES
ENABLING CO-CREATION
INCREASING PRODUCTION FLEXIBILITY
IMPROVING SPARE PARTS MANAGEMENT
REDUCING TOOLING INVESTMENT
BUYING A 3D PRINTER
OTHER
OPTIMIZING DEMO PRODUCTS EXPENSES
Services All Users
9%
6%
12%
5%
2%
7%
INTEGRATION
EXPERTISE
ExpertsIntermediatesBeginners
All Users 40%
36% 19% 45%
40% 20%
Services
Services
3D Printing is quite separate
3D Printing permeates some of our programs
3D Printing permeates most of our programs
3D Printing permeates all of our programs
We are a 3D Printingfirst company
All Users
25% 39%
15% 30% 20% 19% 7%
17%
Don’t know
15% 9%
14%
5%
5%
SERVICESSECTORIAL INSIGHTS
30THE STATE OF 3D PRINTING - 2017
Services is a very promising market, quite different from other industries when it comes to 3D Printing. 71% of our respondents from this sector said they saw a greater ROI than last year on 3D Printing, while only 47% of our global respondents said so.
Integration of 3D Printing inside companies is quite special: either companies said they are 3D Printing first companies (39% versus 15% for the global sample), either they said 3D Printing is much separate (25%). 45% said they are beginners in 3D Printing.
Priorities also differ quite a lot from the general survey. 34% want to offer customized products and limited series, while they are only 16% when we take into account all the different sectors. Enabling co-creation is also a main priority.
Do you consider 3D Printing as a competitive advantage in your strategy?
Services
10%11% Yes
No
All Users
90%89%
FRANCE10 Rue Auguste Perret94800 Villejuif - France
+33 1 83 64 11 22
U.S169 11th street
San Francisco, CA 94103+1-800-814-1270
www.sculpteo.com
![The 3D printing ‘revolution’ · 3D printing ‘Bigger than internet’ FT 21.6.12 3D printing: ‘The PC all over again?’ Economist 1.12.12 ‘3D printing [..] has the potential](https://static.documents.pub/doc/80x56/5f08eac77e708231d42459a8/the-3d-printing-arevolutiona-3d-printing-abigger-than-interneta-ft-21612.jpg)


