16
The State of Our Downtown
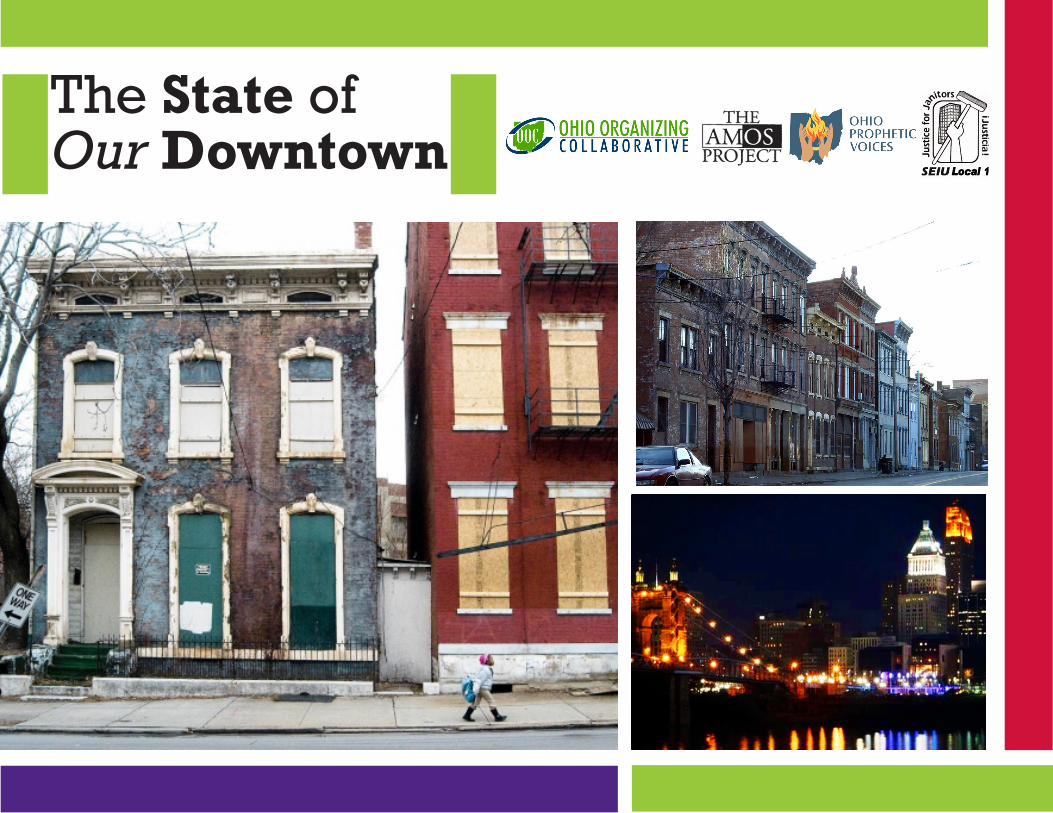
The State of Our Downtown
2
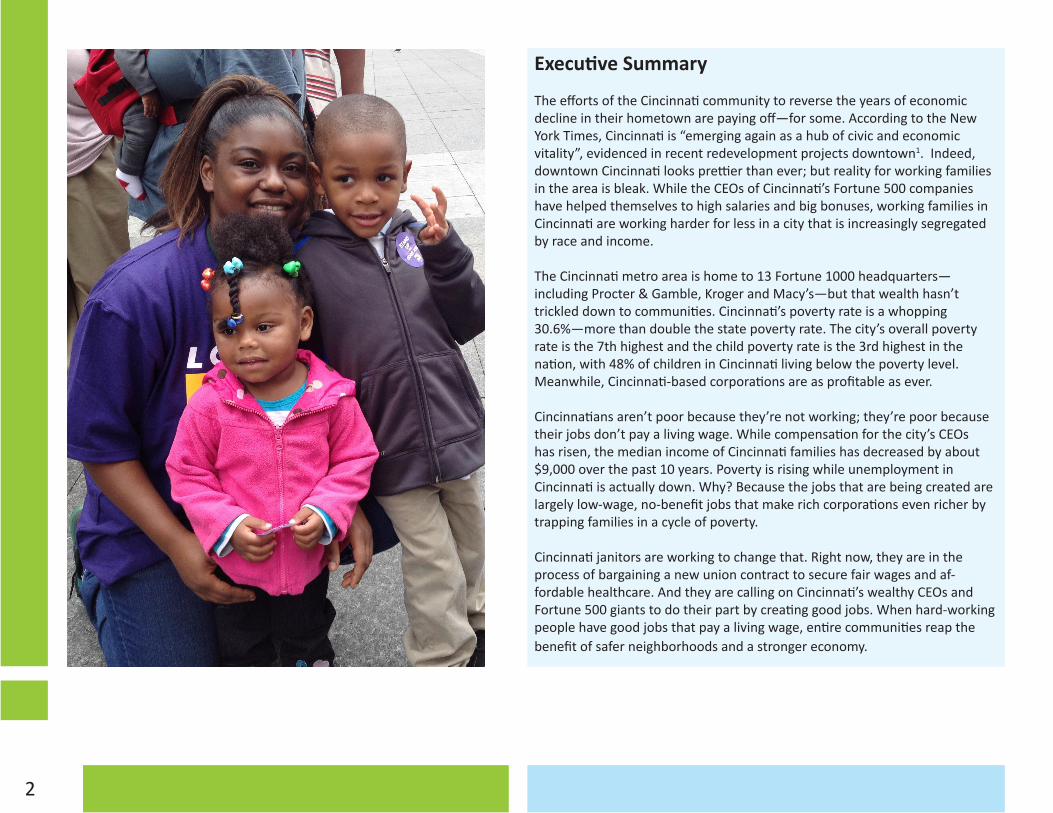
Executive Summary
The efforts of the Cincinnati community to reverse the years of economic decline in their hometown are paying off—for some. According to the New York Times, Cincinnati is “emerging again as a hub of civic and economic vitality”, evidenced in recent redevelopment projects downtown1. Indeed, downtown Cincinnati looks prettier than ever; but reality for working families in the area is bleak. While the CEOs of Cincinnati’s Fortune 500 companies have helped themselves to high salaries and big bonuses, working families in Cincinnati are working harder for less in a city that is increasingly segregated by race and income.
The Cincinnati metro area is home to 13 Fortune 1000 headquarters—including Procter & Gamble, Kroger and Macy’s—but that wealth hasn’t trickled down to communities. Cincinnati’s poverty rate is a whopping 30.6%—more than double the state poverty rate. The city’s overall poverty rate is the 7th highest and the child poverty rate is the 3rd highest in the nation, with 48% of children in Cincinnati living below the poverty level. Meanwhile, Cincinnati-based corporations are as profitable as ever.
Cincinnatians aren’t poor because they’re not working; they’re poor because their jobs don’t pay a living wage. While compensation for the city’s CEOs has risen, the median income of Cincinnati families has decreased by about $9,000 over the past 10 years. Poverty is rising while unemployment in Cincinnati is actually down. Why? Because the jobs that are being created are largely low-wage, no-benefit jobs that make rich corporations even richer by trapping families in a cycle of poverty.
Cincinnati janitors are working to change that. Right now, they are in the process of bargaining a new union contract to secure fair wages and af-fordable healthcare. And they are calling on Cincinnati’s wealthy CEOs and Fortune 500 giants to do their part by creating good jobs. When hard-working people have good jobs that pay a living wage, entire communities reap the benefit of safer neighborhoods and a stronger economy.
3
Work
Table of Contents
Executive Summary 2 Not a Shared Prosperity
Work 4 Prosperity for the Few 6 Hard, Dangerous Work
Live 7 Making Ends Meet in the Low-Wage Workforce 10 Hunger 11 Housing 12 Racial and Economic Segregation in Cincinnati
Uniting for the Future of Cincinnati’s Communities 14 What Kind of City will Cincinnati Be?
15 Endnotes

Work
4
Prosperity for the Few
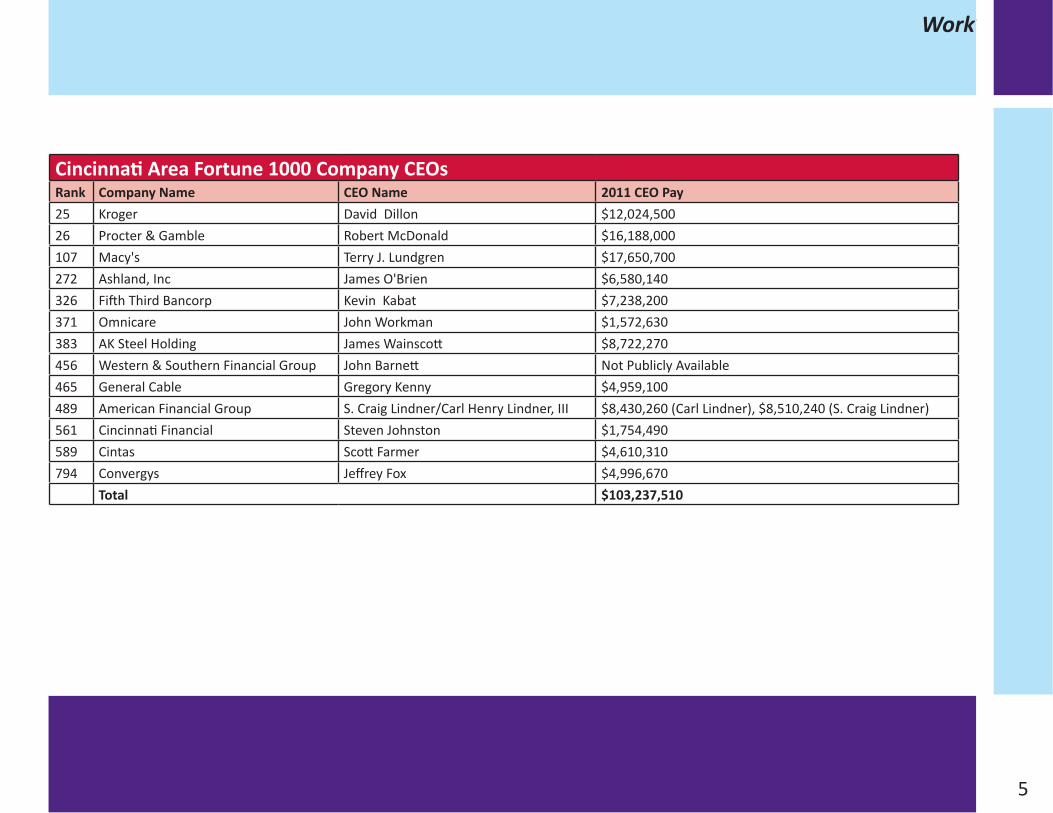
The Fortune 1000 Companies headquartered in the Cincinnati MSA earned almost $17 billion in profits in 2011, while their CEOs took home over $103 million in compensation.
All over Cincinnati, one can see evidence of this prosperity – from new headquarter buildings springing up downtown to renovations of manufacturing sites. But corporate Cincinnati didn’t get here on ingenuity alone. Millions of tax dollars helped them prosper; and in return, the city was promised good jobs.
Many of Cincinnati’s largest and most profitable companies are the recipients of millions worth of state and local tax breaks in just the past few years: including Omnicare2, Procter & Gamble3, and Convergys Corporation4, just to name a few.
A recent Cincinnati Enquirer analysis of the region’s 40 largest tax-incentive deals over the past decade found that only half created the number of jobs they promised—yet all claimed tens of millions in tax breaks and grants5.
For instance, in 2003 Convergys Corp was awarded a $52.2 million tax incentive from the City of Cincinnati for renovations to their corporate headquarters. The company was later forced to repay part of the incentive because they did not meet job creation promises in the initial agreement6.
Cincinnati Area Fortune 1000 Profits Company Name Headquarters 2011 ProfitKroger Cincinnati $602,000,000 Procter & Gamble Cincinnati $11,797,000,000 Macy's Cincinnati $1,256,000,000 Ashland, Inc Covington, KY $414,000,000 Fifth Third Bancorp Cincinnati $1,297,000,000 Omnicare Cincinnati $86,920,000 AK Steel Holding West Chester Not profitableWestern & Southern Financial Group Cincinnati $280,598,000 General Cable Highland Heights, KY $84,100,000 American Financial Group Cincinnati, OH $343,000,000 Cincinnati Financial Cincinnati, OH $166,000,000 Cintas Cincinnati, OH $297,640,000 Convergys Cincinnati, OH $334,800,000 Total $16,959,058,000
Work
5
Cincinnati Area Fortune 1000 Company CEOsRank Company Name CEO Name 2011 CEO Pay25 Kroger David Dillon $12,024,500 26 Procter & Gamble Robert McDonald $16,188,000 107 Macy's Terry J. Lundgren $17,650,700 272 Ashland, Inc James O'Brien $6,580,140 326 Fifth Third Bancorp Kevin Kabat $7,238,200 371 Omnicare John Workman $1,572,630383 AK Steel Holding James Wainscott $8,722,270 456 Western & Southern Financial Group John Barnett Not Publicly Available465 General Cable Gregory Kenny $4,959,100 489 American Financial Group S. Craig Lindner/Carl Henry Lindner, III $8,430,260 (Carl Lindner), $8,510,240 (S. Craig Lindner) 561 Cincinnati Financial Steven Johnston $1,754,490 589 Cintas Scott Farmer $4,610,310794 Convergys Jeffrey Fox $4,996,670
Total $103,237,510
Work
Work
6
Hard, Dangerous Work
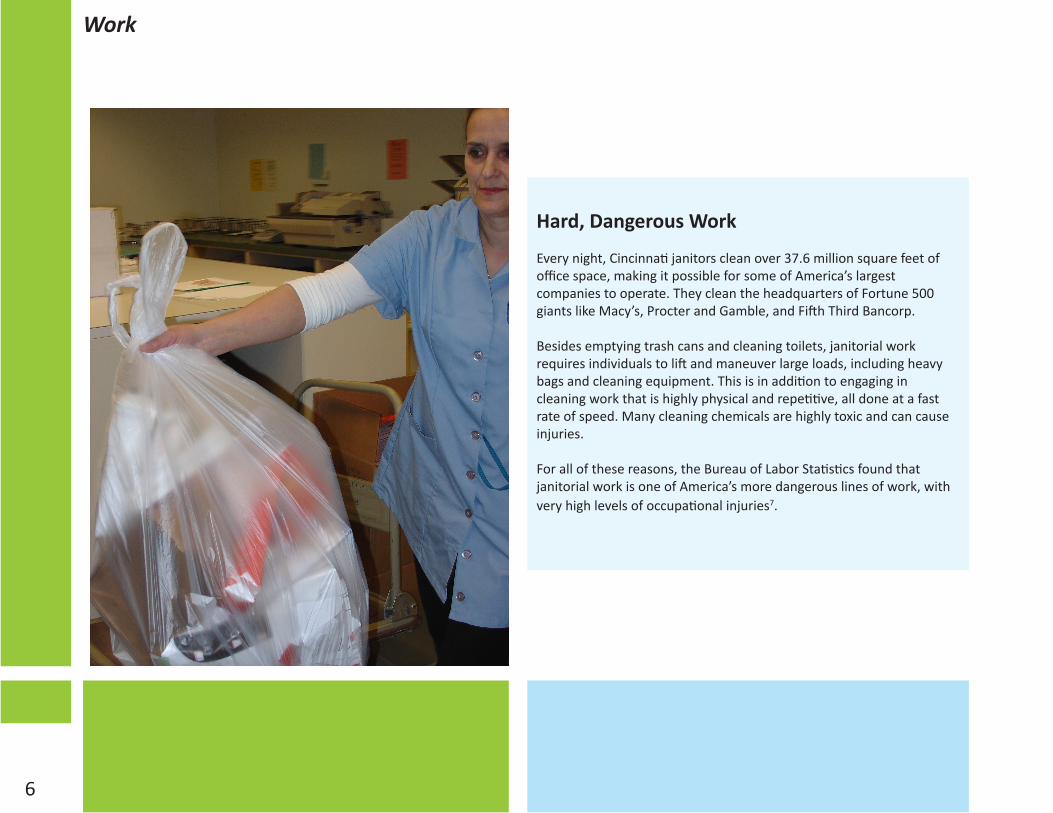
Every night, Cincinnati janitors clean over 37.6 million square feet of office space, making it possible for some of America’s largest companies to operate. They clean the headquarters of Fortune 500 giants like Macy’s, Procter and Gamble, and Fifth Third Bancorp.
Besides emptying trash cans and cleaning toilets, janitorial work requires individuals to lift and maneuver large loads, including heavy bags and cleaning equipment. This is in addition to engaging in cleaning work that is highly physical and repetitive, all done at a fast rate of speed. Many cleaning chemicals are highly toxic and can cause injuries.
For all of these reasons, the Bureau of Labor Statistics found that janitorial work is one of America’s more dangerous lines of work, with very high levels of occupational injuries7.
Making Ends Meet in the Low Wage Workforce
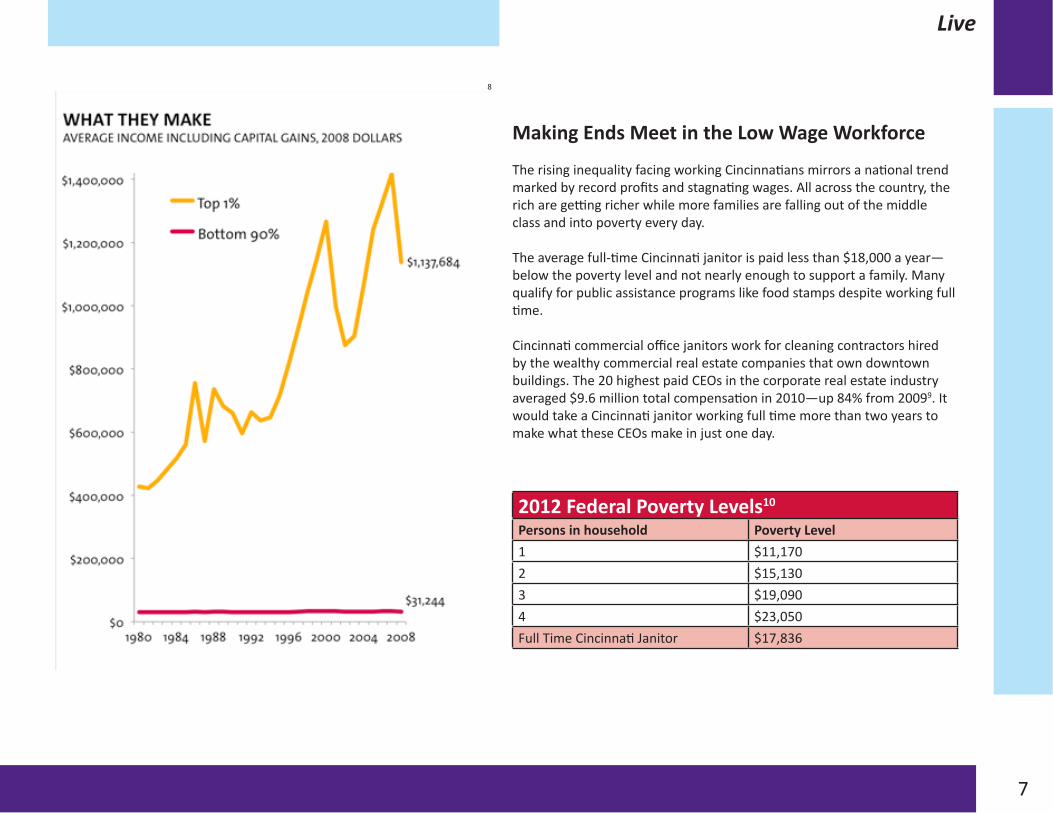
The rising inequality facing working Cincinnatians mirrors a national trend marked by record profits and stagnating wages. All across the country, the rich are getting richer while more families are falling out of the middle class and into poverty every day.
The average full-time Cincinnati janitor is paid less than $18,000 a year—below the poverty level and not nearly enough to support a family. Many qualify for public assistance programs like food stamps despite working full time.
Cincinnati commercial office janitors work for cleaning contractors hired by the wealthy commercial real estate companies that own downtown buildings. The 20 highest paid CEOs in the corporate real estate industry averaged $9.6 million total compensation in 2010—up 84% from 20099. It would take a Cincinnati janitor working full time more than two years to make what these CEOs make in just one day.
7
Live
2012 Federal Poverty Levels10
Persons in household Poverty Level1 $11,1702 $15,1303 $19,0904 $23,050Full Time Cincinnati Janitor $17,836
8
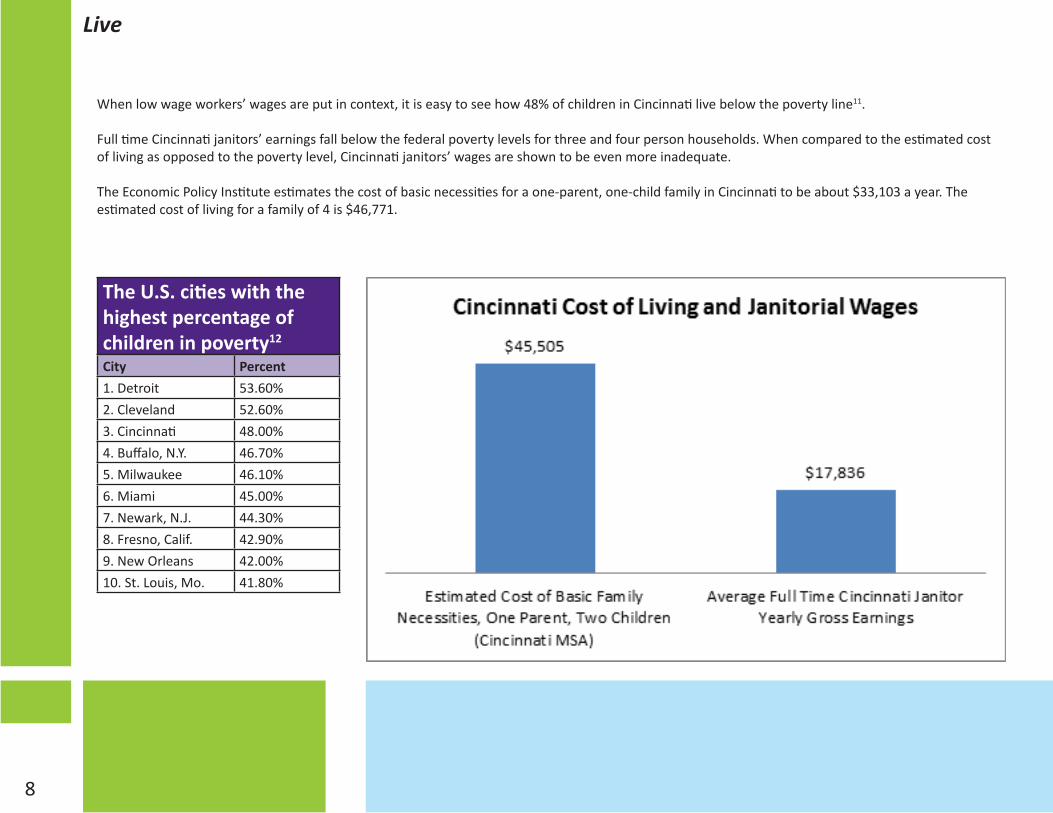
When low wage workers’ wages are put in context, it is easy to see how 48% of children in Cincinnati live below the poverty line11.
Full time Cincinnati janitors’ earnings fall below the federal poverty levels for three and four person households. When compared to the estimated cost of living as opposed to the poverty level, Cincinnati janitors’ wages are shown to be even more inadequate.
The Economic Policy Institute estimates the cost of basic necessities for a one-parent, one-child family in Cincinnati to be about $33,103 a year. The estimated cost of living for a family of 4 is $46,771.
The U.S. cities with the highest percentage of children in poverty12
City Percent1. Detroit 53.60%2. Cleveland 52.60%3. Cincinnati 48.00%4. Buffalo, N.Y. 46.70%5. Milwaukee 46.10%6. Miami 45.00%7. Newark, N.J. 44.30%8. Fresno, Calif. 42.90%9. New Orleans 42.00%10. St. Louis, Mo. 41.80%
8
Live
9
Live
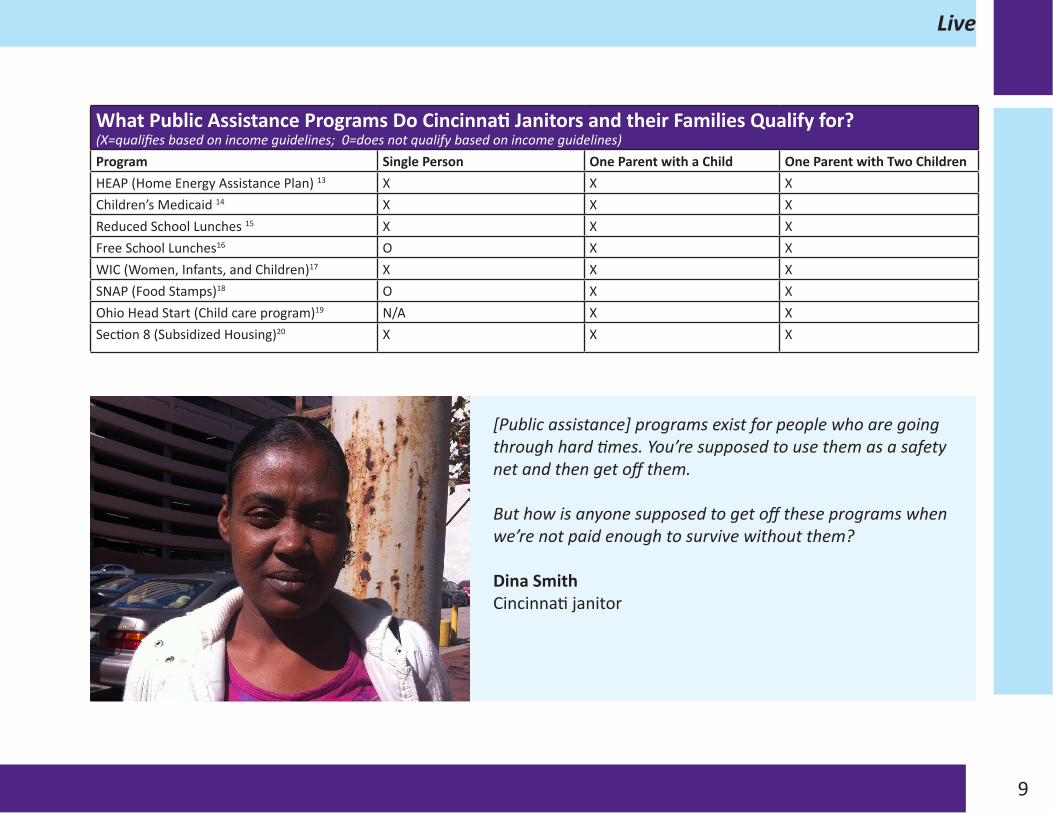
What Public Assistance Programs Do Cincinnati Janitors and their Families Qualify for? (X=qualifies based on income guidelines; 0=does not qualify based on income guidelines)Program Single Person One Parent with a Child One Parent with Two ChildrenHEAP (Home Energy Assistance Plan) 13 X X XChildren’s Medicaid 14 X X XReduced School Lunches 15 X X XFree School Lunches16 O X XWIC (Women, Infants, and Children)17 X X XSNAP (Food Stamps)18 O X XOhio Head Start (Child care program)19 N/A X XSection 8 (Subsidized Housing)20 X X X
[Public assistance] programs exist for people who are going through hard times. You’re supposed to use them as a safety net and then get off them.
But how is anyone supposed to get off these programs when we’re not paid enough to survive without them?
Dina SmithCincinnati janitor

10
HungerIn Ohio, the average monthly SNAP (food stamp benefit) participation rate has increased 65.2% since 200721, and more than 1 in 5 (22.3%) children in the Cincinnati metro area are at risk of missing their next meal, according to a Feeding America analysis of the Freestore Foodbank’s service area22.
A full time Cincinnati janitor with one or more children likely qualifies for SNAP benefits23. Additionally, the children of a full time Cincinnati janitor would also likely qualify to receive free meals at school due to low family income24.
Live
11
Live
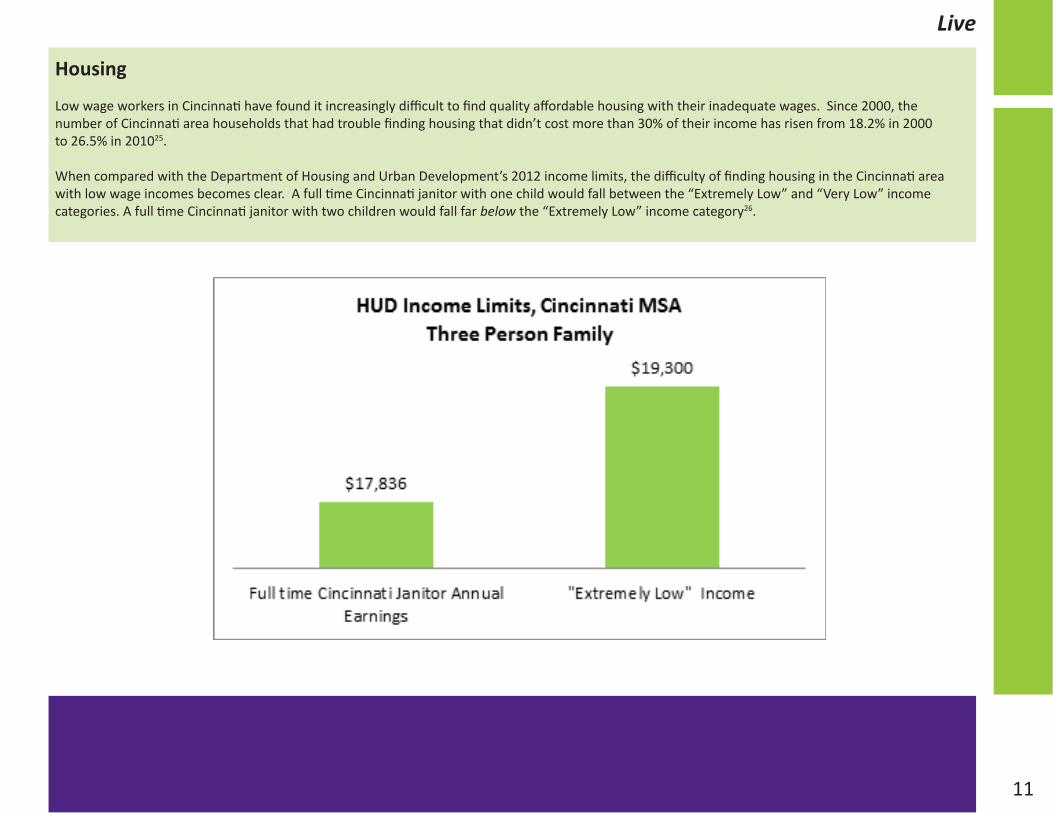
Housing
Low wage workers in Cincinnati have found it increasingly difficult to find quality affordable housing with their inadequate wages. Since 2000, the number of Cincinnati area households that had trouble finding housing that didn’t cost more than 30% of their income has risen from 18.2% in 2000 to 26.5% in 201025.
When compared with the Department of Housing and Urban Development’s 2012 income limits, the difficulty of finding housing in the Cincinnati area with low wage incomes becomes clear. A full time Cincinnati janitor with one child would fall between the “Extremely Low” and “Very Low” income categories. A full time Cincinnati janitor with two children would fall far below the “Extremely Low” income category26.
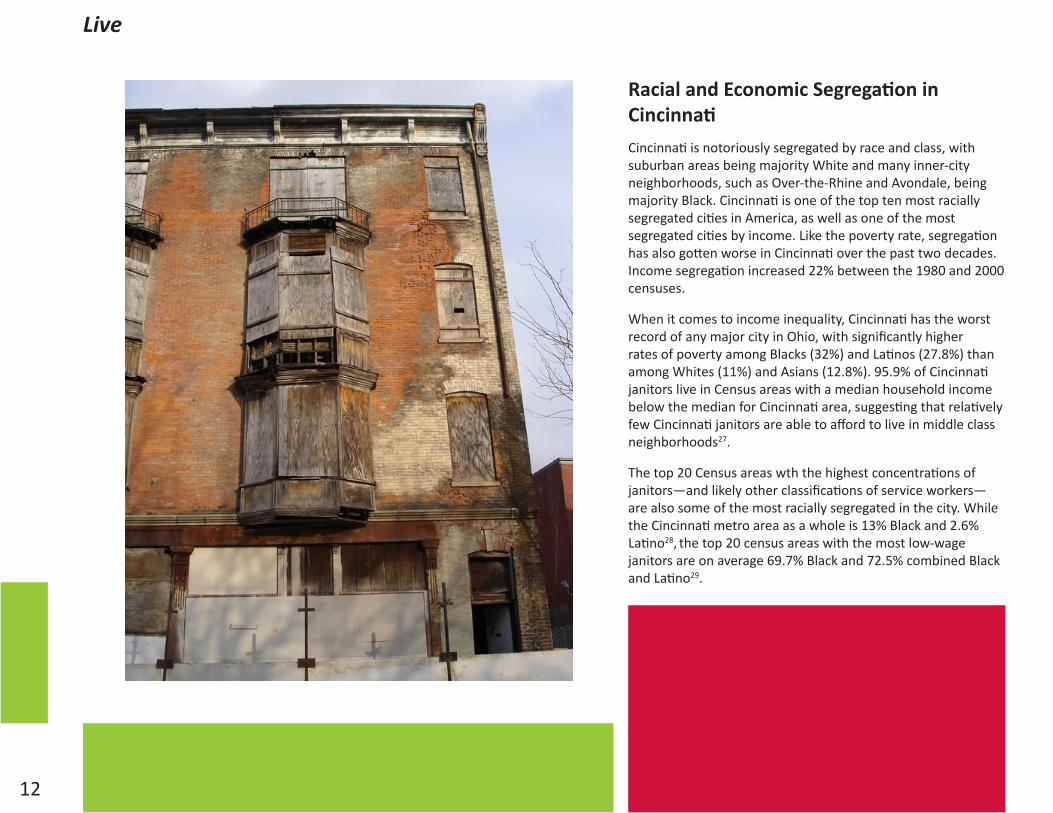
Racial and Economic Segregation in CincinnatiCincinnati is notoriously segregated by race and class, with suburban areas being majority White and many inner-city neighborhoods, such as Over-the-Rhine and Avondale, being majority Black. Cincinnati is one of the top ten most racially segregated cities in America, as well as one of the most segregated cities by income. Like the poverty rate, segregation has also gotten worse in Cincinnati over the past two decades. Income segregation increased 22% between the 1980 and 2000 censuses.
When it comes to income inequality, Cincinnati has the worst record of any major city in Ohio, with significantly higher rates of poverty among Blacks (32%) and Latinos (27.8%) than among Whites (11%) and Asians (12.8%). 95.9% of Cincinnati janitors live in Census areas with a median household income below the median for Cincinnati area, suggesting that relatively few Cincinnati janitors are able to afford to live in middle class neighborhoods27.
The top 20 Census areas wth the highest concentrations of janitors—and likely other classifications of service workers—are also some of the most racially segregated in the city. While the Cincinnati metro area as a whole is 13% Black and 2.6% Latino28, the top 20 census areas with the most low-wage janitors are on average 69.7% Black and 72.5% combined Black and Latino29.
12
Live
13
Live
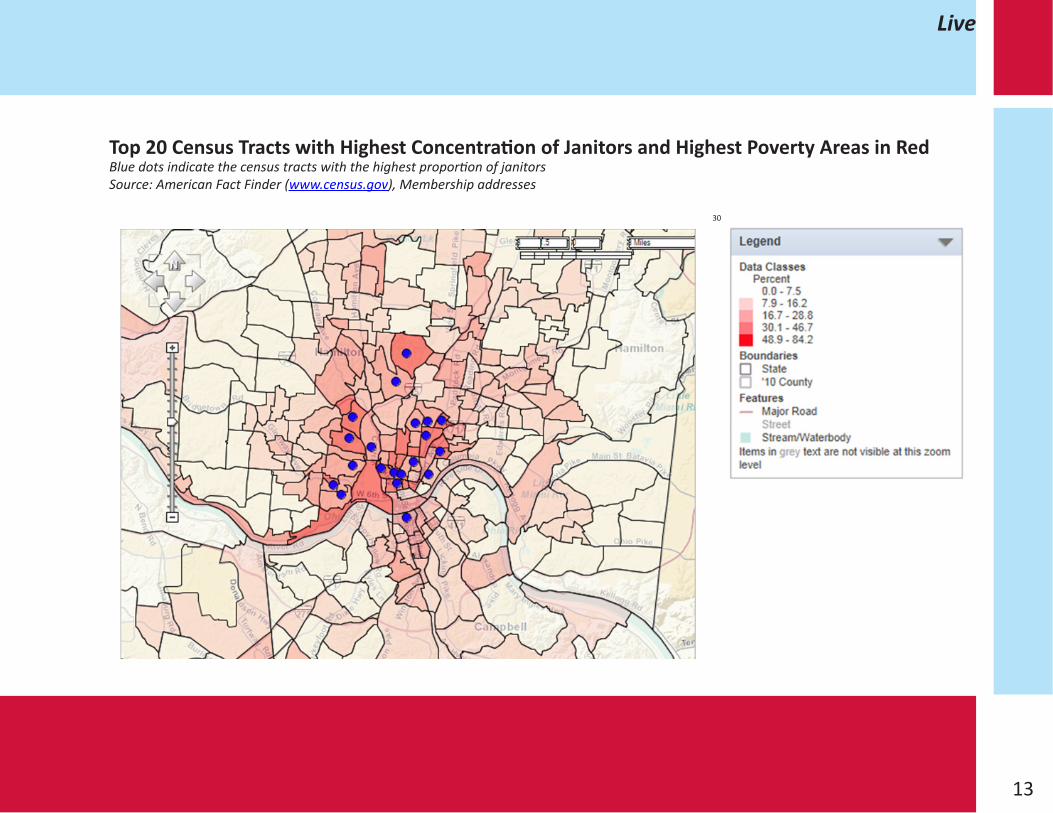
Top 20 Census Tracts with Highest Concentration of Janitors and Highest Poverty Areas in RedBlue dots indicate the census tracts with the highest proportion of janitorsSource: American Fact Finder (www.census.gov), Membership addresses
30
14
Work
What Kind of City will Cincinnati Be?
Despite the high concentration of wealth and profit in downtown Cincinnati, the city maintains a notoriously high rate of violent crime and its neighborhoods are largely segregated by race.
If Cincinnati continues down the current path, it will truly become 2 cities—one where corporations profit at the expense of all else, and one where the children of working people go to bed hungry and without hope for a better future.
Cincinnati can do better. Janitors and low wage workers across the city are uniting to turn things around. When working people are able to support themselves on one good job, families are able to stay in their homes and spend their paychecks at local businesses. That’s what will make Cincinnati’s economy stronger, its neighborhoods safer, and its communities healthier.
Cincinnati janitors are uniting to restore balance to their city, revive their neighborhoods, and build an economy that works for everyone.And they’re calling on big corporations to do their part by creating good jobs and paying workers fair, family sustaining wages.
Together, workers and businesses can make Cincinnati a city where PEOPLE prosper—not just corporations.
14
Uniting for the Future of Cincinnati’s Communities
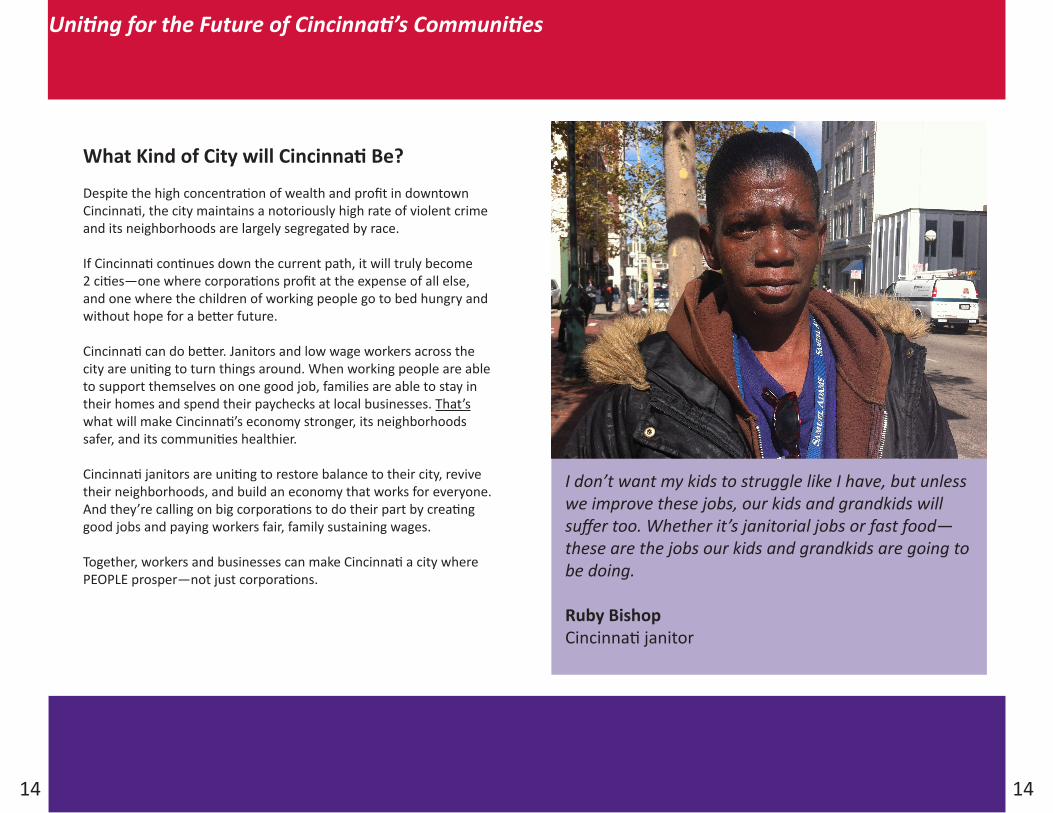
I don’t want my kids to struggle like I have, but unless we improve these jobs, our kids and grandkids will suffer too. Whether it’s janitorial jobs or fast food—these are the jobs our kids and grandkids are going to be doing.
Ruby BishopCincinnati janitor
15
Endnotes1) Schneider, Keith. “An Ohio River City Comes Back to Its Shoreline.” The New York Times. The New York Times, 06 June 2012. Web. <http://www.nytimes.com/2012/06/06/realestate/
commercial/cincinnati-comes-back-to-its-ohio-river-shoreline.html?pagewanted=1>.2) Brownfield, Andy. “Omnicare Moving Its Headquarters to Cincinnati.” Businessweek.com. Businessweek, 9 Sept. 2011. Web. <http://www.businessweek.com/ap/financialnews/
D9PRRL3G2.htm>.3) “Procter & Gamble, Six Local Firms Win Ohio Tax Credits.” Business Courier. Business Courier of Cincinanti, 26 Apr. 2010. Web. <http://www.bizjournals.com/cincinnati/
stories/2010/04/26/daily10.html?surround=lfn>.4) Monk, Dan, and Tom Demeropolis. “Convergys Offering Space at Atrium One; Some Cry Foul as Firm Got Tax Breaks with Atrium One Move.” Business Courier of Cincinnati [Cincinnati]
16 Sept. 2011.5) Holthaus, David. “Tax Breaks for Jobs: Half Fall Short.” Cincinnati.com. Cincinnati Enquirer, 14 Jan. 2012. Web. <http://news.cincinnati.com/article/20120113/BIZ/301130131/Tax-
breaks-jobs-Half-fall-short?odyssey=tab|topnews|text|Business>.6) “Convergys to Pay $1M to Cincinnati.” Business Courier. Business Courier of Cincinnati, 14 May 2011. Web. <http://www.bizjournals.com/cincinnati/news/2011/05/04/convergys-to-
pay-1m-to-cincinnati.html?page=all>.7) United States Department of Labor. Bureau of Labor Statistics. Nonfatal Occupational Injuries and Illnesses Requiring Days Away From Work, 2010. United States of America, 9 Nov.
2011. Web. <http://www.bls.gov/news.release/osh2.nr0.htm>.8) Gibson, David. “It’s the Inequality, Stupid.” Mother Jones. Mother Jones Magazine, Apr.-May 2011. Web. <http://www.motherjones.com/politics/2011/02/income-inequality-in-
america-chart-graph>.9) “100 Highest-Paid CEOs.” AFL-CIO. American Federation of Labor-Congress of Industrial Organizations, n.d. Web. <http://www.aflcio.org/Corporate-Watch/CEO-Pay-and-the-99/100-
Highest-Paid-CEOs>.10) United States of America. Department of Health and Human Services. 2012 HHS Poverty Guidelines. N.p., 9 Feb. 2012. Web. <http://aspe.hhs.gov/poverty/12poverty.shtml>.11) National Center for Children in Poverty. Columbia University. RESEARCHERS: DETROIT, CLEVELAND, CINCINNATI, BUFFALO, MILWAUKEE LEAD NATION IN CHILD POVERTY. N.p., 31 Oct.
2011. Web. <http://www.nccp.org/media/releases/release_136.html>.12) National Center for Children in Poverty. Columbia University. RESEARCHERS: DETROIT, CLEVELAND, CINCINNATI, BUFFALO, MILWAUKEE LEAD NATION IN CHILD POVERTY. N.p., 31 Oct.
2011. Web. <http://www.nccp.org/media/releases/release_136.html>.13) United States of America. Office of the Ohio Consumers’ Council. N.p., 2012. Web. <http://pickocc.org/publications/assistance_programs/HEAP_Guidelines.pdf>.14) United States of America. State of Ohio. Department of Jobs and Family Services. N.p., 9 Apr. 2008. Web. <http://jfs.ohio.gov/ohp/consumers/docs/FPLs_general.pdf>.15) United States of America. Department of Agriculture. Food and Nutrition Service. N.p., 23 Mar. 2012. Web. <http://www.gpo.gov/fdsys/pkg/FR-2012-03-23/pdf/2012-7036.pdf>.16) United States of America. Department of Agriculture. Food and Nutrition Service. N.p., 23 Mar. 2012. Web. <http://www.gpo.gov/fdsys/pkg/FR-2012-03-23/pdf/2012-7036.pdf>.17) United States of America. Department of Agriculture. Food and Nutrition Service. N.p., 13 July 2012. Web. <http://www.fns.usda.gov/wic/howtoapply/incomeguidelines.htm>.18) United States of America. Department of Agriculture. Food and Nutrition Service. N.p., 4 Oct. 2012. Web. <http://www.fns.usda.gov/snap/applicant_recipients/eligibility.
htm#income>.19) United States of America. State of Ohio. Ohio Early Childhood Education. Benefits.gov. N.p., n.d. Web. <http://www.benefits.gov/benefits/benefit-details/1932>.20) United States of America. United States Department of Housing and Urban Development. OHIO MSA Income Limits. Housing and Urban Development, n.d. Web. <http://www.
huduser.org/portal/datasets/il/il12/oh.pdf>.21) United States of America. US Department of Agriculture. Food and Nutrition Service. SUPPLEMENTAL NUTRITION ASSISTANCE PROGRAM: AVERAGE MONTHLY PARTICIPATION
(PERSONS). N.p., 28 Sept. 2012. Web. <http://www.fns.usda.gov/pd/15SNAPpartPP.htm>.22) Curnutte, Mark. “City’s Childhood Poverty Third Worst in Nation.” Cincinnati.com. Cincinnati Enquirer, 3 Nov. 2011. Web. <http://news.cincinnati.com/article/20111102/
NEWS01/111030342/City-s-childhood-poverty-third-worst-nation>.23) United States of America. Department of Agriculture. Food and Nutrition Service. N.p., 4 Oct. 2012. Web. <http://www.fns.usda.gov/snap/applicant_recipients/eligibility.
htm#income>.24) United States of America. United States Department of Agriculture. N.p., 19 Mar. 2012. Web. <http://www.gpo.gov/fdsys/pkg/FR-2012-03-23/pdf/2012-7036.pdf>.25) “2011 Housing Report.” Affordable Housing Advocates of Cincinnati. N.p., 2012. Web. <http://ahacincy.org/AHAHousingReport2011.pdf>.26) United States of America. Department of Housing and Urban Development. FY 2012 Income Limits. N.p., 13 Dec. 2011. Web. <http://www.huduser.org/portal/datasets/il/
il2012/2012summary.odn>.27) Analysis based on US Census Bureau Data for Cincinnati Metropolitan Area. Median household income $53,65128) US Census Bureau 2010 American Community Survey 1 year Estimates29) Analysis of US Census Bureau ACS Demographic and Housing Estimates 2006-2010 American Community Survey 5 year Estimates30) US Census Bureau: Poverty Status in the Past 12 Months. 2006-2010 American Community Survey 5-Year Estimates