STEP Green Book Technology Summary Page 1 of 42 Date printed May 24, 2000 The Strategic Envirotechnology Partnership Green Book Technology Summary Fertilizer Manufacturing Through Enhanced Autothermal Thermophilic Aerobic Digestion (ATAD) Bio-Dynamics LLC 48 Junction Square Drive West Concord, MA 978 371-0700 Prepared by: Thomas Flanagan, Ph.D., MBA UMass Boston, EBTC 100 Morrissey Boulevard, Boston MA 02125-3393 617 287-7726 This standardized reporting format is consistent with the Department of Energy’s Green Book Technology Summary reports and is also adapted from the Environmental Protection Agency – Region 1’s Pollution Prevention Application Analysis Template, developed by Stone & Webster Environmental Technology & Services. <Friday, May 12, 2000>
Transcript
STEP Green Book Technology Summary Page 1 of 42 Date printed May 24, 2000
The Strategic Envirotechnology PartnershipGreen Book Technology Summary
Fertilizer Manufacturing Through Enhanced AutothermalThermophilic Aerobic Digestion (ATAD)
Bio-Dynamics LLC48 Junction Square Drive
West Concord, MA978 371-0700
Prepared by:Thomas Flanagan, Ph.D., MBAUMass Boston, EBTC100 Morrissey Boulevard, Boston MA 02125-3393617 287-7726
This standardized reporting format is consistent with the Department of Energy’s Green BookTechnology Summary reports and is also adapted from the Environmental Protection Agency – Region1’s Pollution Prevention Application Analysis Template, developed by Stone & Webster Environmental
Technology & Services.
<Friday, May 12, 2000>
TABLE OF CONTENTS
STEP Green Book Technology Summary Page 2 of 42 Date printed May 24, 2000
TITLE PAGE .......................................................................................................................................... 1TABLE OF CONTENTS ......................................................................................................................... 2DISCLAIMER......................................................................................................................................... 4INTRODUCTION ................................................................................................................................... 5TECHNOLOGY SUMMARY................................................................................................................... 7
Overall Process Schematic ................................................................................................................. 7Process Overview............................................................................................................................... 8Constraints on System Design............................................................................................................ 8
TECHNOLOGY DESCRIPTION........................................................................................................... 10Overview of Collection and Transport System................................................................................... 10Overview of Receiving and Processing System ................................................................................ 10Detailed Description of Receiving and Processing System ............................................................... 12Flow Diagram for Material and Energy Transfer................................................................................ 12Overview of Odor Control and Product Stabilization.......................................................................... 14Details of Odor Control Systems....................................................................................................... 15
Primary Odor Control System: Biofilter Odor Capture ................................................................... 16Secondary Odor Control System: Essential Oil Odor Capture ...................................................... 17Other Odor Control: Best Management Practices ......................................................................... 19
TECHNOLOGY APPLICABILITY ......................................................................................................... 20Applicability to Industry/User............................................................................................................. 20Development/Application History ...................................................................................................... 21Lessons Learned During Technology Development .......................................................................... 21Benchmarking ATAD Systems.......................................................................................................... 22Representative Recent Patents ........................................................................................................ 23Technology Application/Use.............................................................................................................. 24General Setting................................................................................................................................. 24Technology Implementation at a Manufacturing Plant Site................................................................ 24
Labor Related ................................................................................................................................ 38Management Related .................................................................................................................... 38Implementation Related ................................................................................................................. 39Product Related............................................................................................................................. 39Management Related .................................................................................................................... 39
BENEFITS DERIVED FROM APPLICATION....................................................................................... 39LIMITATIONS IN APPLICATION.......................................................................................................... 40PUBLISHED REFERENCES ............................................................................................................... 41APPENDIX A: LETTER FOR TECHNOLOGY PROPONENTS ........................................................... 42+
DISCLAIMER
STEP Green Book Technology Summary Page 4 of 42 Date printed May 24, 2000
This document is designed to assist the user in analyzing the application of technologies.While it provides a template for the general types of questions that you should ask whenevaluating a technology, it may not include all of the questions that are relevant to yourbusiness, or which your business is legally required to ask.
This document is intended to assist envirotechnology users, developers, and investors to makeinformed decisions about the commercial potential of specific products or prospective productsunder development. This document is not intended to communicate the full market scope orcompetitive position of any of the underlying technologies embodied by the product, but ratherto illustrate the comparative effectiveness, or potential effectiveness, of that technology in theform of one or more specific products.
NOTE: This design review document is not complete unless accompanied with an appendix (page 42)containing a signed letter from the technology proponents asserting that, to the best of their knowledge,the design issues reflected in this document are complete and accurate. In the course of preparing thisdocument, no direct audit of system performance has been conducted by STEP.
INTRODUCTION
STEP Green Book Technology Summary Page 5 of 42 Date printed May 24, 2000
The Environmental Problem: Non-point source watershed pollution has become a central focus ofenvironmental control activity. Within this context, the public perception of parklands, greenways, andfarmland homesteads is shifting from a traditional view of these enterprises as “close to nature” to anew view of these enterprises as industrial activities that are likely to have enduring adverse impactupon water quality. The factors which underlie these changing views include concerns about currentuses of fertilizers, insecticides, herbicides, and fungicides, and concerns about current practices formanaging wastes, waste water, and rain water runoff.
A significant indicator of the changing view toward agricultural practice is represented by areclassification of dairy farms (of specified scale) as commercial operations subject to rules forindustrial environmental compliance. The mystique of the wholesomeness of the American farm isgiving way to a get-tough-on-agriculture trend. However, a parallel trend exists to rally support forinnovations that will foster sustainable agricultural practices. American agriculture, particularly inurbanized regions of the nation, is under considerable economic pressure, and has been in anaccelerated decline for the past several decades. In this context, innovations which promote faster,more efficient, and less costly crop production while concurrently reducing nutrient runoff and soilerosion are poised to make significant contributions to emerging practices of sustainable farming.
There is little doubt that there exists considerable opportunity to generate fertilizer for large scale usefrom organic wastes through composting and other innovative treatment methods, such as the onereviewed in this report . A significant level of the municipal waste stream consists of organic matterappropriate for composting, and these same waste streams are commanding increasing tipping feesboth because land fill space is in continuing decline and because organic wastes pose specific wastehandling challenges. “Organic materials make up the bulk of America’s discarded municipal solidwaste. In 1996, organic materials accounted for 141 million tons (67 percent) of the waste stream.Some organic materials, such as newspaper, office paper, and corrugated, have a high recovery rate.Other organic materials (e.g., yard trimmings, food scraps, and certain grades of paper), however, stilltend to be landfilled and represent an area with high growth potential for recovery (75 million tons).Depending on the type of waste and method of composting selected, average national savings overconventional disposal vary from $9 to $37 per ton for 62 million tons of the MSW stream” (EPA 530-R-99-016, July 1999). In land fill settings, organic waste generates odors, attracts vermin, raises healthconcerns, and impedes manual sorting of recyclable waste. For all of these reasons, municipalitiesfavor options for specifically removing organic materials from the municipal waste stream. Composting,in any of its many contemporary forms, is the preferred option.
There is also little doubt that, when manufactured to market specifications, compost is a valuable soilamendment. While markets for high quality compost are still emerging, the EPA has investigated theutility of compost as an agricultural product and has formed the conclusion that fertilizer and soilamendment products formed from organic wastes can add value to:
1. Bioremediation and Pollution Prevention (through reduced insecticide and fungicide use)2. Disease Control for Plants and Animals;3. Erosion Control and Landscaping;4. Composting of Contaminated Soils;5. Reforestation, Wetlands Restoration; and6. Habitat Revitalization
In spite of continued efforts to expand agricultural, municipal and residential acceptance of soilamendments manufactured from municipally recycled feedstock, concerns over the quality andconsistency of these products have delayed broad spread adoption. End users of municipally
INTRODUCTION
STEP Green Book Technology Summary Page 6 of 42 Date printed May 24, 2000
manufactured fertilizer are significantly concerned about both inter-batch consistency (includingseasonal consistency) and overall quality (including elimination of pathogens, toxic metals, odors, anddebris – such as glass shards, and metal and plastic fragments).
The Requirements for Technical Solutions: Composting, or more generically, bioconversion of anorganic feedstock waste stream into a microbially-enriched soil amendment, has been evolvingcontinually for hundreds of years. In general, all forms of composting are based upon a microbialbioconversion of cellulose-rich feedstock into an amendment enriched to varying degrees with microbialproducts. On one end of this spectrum, the feedstock is only modestly altered while on the other end ofthe spectrum, the feedstock is converted predominantly into a microbial biomass. A substantiallyaltered microbial product acquires properties that are distinct from the feedstock and which may havespecific appeal to specific end users. Product evolution represents one dimension of technical solutionfor composting practice.
Historically, agricultural feedstock could spontaneously “compost” as mounds of organic matter uponagricultural fields. Urban feedstock sources lack sufficient composting space and impose additionaldemands for odor control. It is widely recognized that odor related to composting is primarilyassociated with anaerobic bioconversion of largely nitrogen-rich feedstocks. Most modern innovation incomposting practice involves “aerating” compost systems to minimize malodorous conditions. Recentinnovation has focused along two divergent management strategies: (1) optimize gas capture and re-use from systems using odor-generating, anaerobic processes or (2) minimize odor and gas generationthrough aerobic processes. For each individual application, the technical solution must consider thecomposition of the feedstock, the performance requirements of the product, and constraints placedupon the production process itself. Process evolution represents the second dimension of technicalsolution for composting practice.
This document seeks to characterize, in a concise manner, the main features of a manufacturing facilityutilizing autothermal thermophilic aerobic digestion as a means of generating a microbial biomassproduct for use as fertilizer. This report will consider both the product and the manufacturing process interms of its benefits, the costs associated with its implementation, regulatory aspects, and lessonslearned from the development and application of this approach. The success of this document will bemeasured in its ability to promote an understanding of the process, and to accelerate the appropriateuse of the enabling technology.
TECHNOLOGY SUMMARY
STEP Green Book Technology Summary Page 7 of 42 Date printed May 24, 2000
Overall Process Schematic
The technology proponents offer a manufacturing system plan and a management strategy for using anin-vessel, slurry system to convert waste food scraps into a stable, microbial biomass product. Theproduct is intended for uses as a fertilizer, either as a fertilizer directly or as organic filler for a chemicalfertilizer product. The manufacturing system consists of:
a supply chain for feedstock;a central processing facility; anda product packaging capacity.
The supply chain exists in the form of a contracted network of pre-sorted, processed food scrapproducers, transfer and slurry generation sites, and bulk and slurry feedstock haulers. The centralprocessing facility is based upon autothermal (or autogenous) thermophilic aerobic digestions (ATAD),a technology with a long history of practice in the municipal wastewater sludge management sector(see EPA/625/10-90/007 September 1990). The technology is based upon the use of a class ofnaturally abundant microbes that thrive at high temperature, and establishing for these microbes a foodsource concentration and oxygen supply that will allow them to self-generate their preferred hightemperature growth conditions. At the completion of microbial digestion, product-packaging operationsconsist of drying, pelletizing and bagging, or, alternatively, thickening and bottling dry and liquidproduct, respectively. The overall fertilizer manufacturing system is modeled after a currentlyoperating, 55 ton per day municipal facility, which recently upgraded to 100 ton per day, located inVancouver, British Columbia. This precedent facility began operations in 1994, and with time allocatedto expanding operations, has over 4 years of full capacity operating history.
The process technology examined in this report includes improvements upon the precedent facility inthe form of a change in operating scale to allow processing of 200 wet tons slurry feedstock per day,and the use of an additional environmentally-benign technology to provide an added dimension of odorcontrol assurance. The precedent facility in Vancouver has experimentally processed a variety of feedstock types, including residuals. The proponents of the use of the technology examined in this reportassert that residuals treatment will not be operating feature of the Uxbridge fertilizer manufacturingfacility.
TECHNOLOGY SUMMARY
STEP Green Book Technology Summary Page 8 of 42 Date printed May 24, 2000
Process Overview
Process Schematic
The central manufacturing facility examined in this study has energy / utility demands principally in theform of transportation to the processing site, and, once within the site, both in the form of supplementalheating for the start-up digestor, for driving the Shearator aeration and mixing systems, and for dryingend product as well as regulatory requirements.
Constraints on System Design
Glass shards and fragmented metal and plastic debris that are commingled with municipal feedstocksupplies need to be removed prior to and during the manufacturing process. Stringent feedstock pre-sorting criteria primarily control admission of restricted materials. Extensive screening and filteringsteps remove non-bioconvertable components during the manufacturing process. These screening andfiltering requirements are asserted to be best met by using a liquid slurry bioconversion process. Thisconstraint on the system design is imposed by market demands for the finished product.
Conversion of feedstock into biomass product needs to occur at high efficiency, rapid cycle time, andpractical cost. High efficiency of product yield from feedstock and efficient use of capital assets throughhigh feedstock throughput present economic demands upon the system design. Capital costs foraerobic and anaerobic organic slurry bioconversion processes are comparable. Thus, liquid aerobicbioconversion is preferred over liquid anaerobic bioconversion for the following reasons:
1. anaerobic digestion converts up to 75% of feedstock fertilizer value into odorous and flammablegases (Tchobanoglous & Burton, 1998);
2. anaerobic digestion does not guarantee pathogen removal during processing; and3. typical anaerobic detention time of approximately 20 days (followed by an additional 30 to 90 days
of “aging”) compares unfavorably with aerobic processing times of 3 to 7 days.
Additionally, the process examined in this document has the capacity to blend incoming slurry with hotrecycled filtrate, such that recycled fluid may reduce the amount of applied heat (i.e. steam) needed to
Collectfoodscrap
Inspect PoolTransfer
InspectSlurryPreparation
Remove non-digestiblematerials
Dry orConcentrate
Package
Inspect
SlurryProcessing
InspectInspect
TECHNOLOGY SUMMARY
STEP Green Book Technology Summary Page 9 of 42 Date printed May 24, 2000
bring the slurry to processing temperature. This thermal recycling feature is asserted to reduceprocessing time by 15 % annually in northern latitudes.
Stabilizing the microbial end product, including incidental odor related to the production process, is aregulatory requirement effecting the system design. The EPA has recognized that product generatedfrom slurry organic feedstock through the action of appropriately managed autothermal thermophilicaerobic digestion is not a source of objectionable odor. Specifically, prior EPA studies have stated“Exhaust air was generally characterized as having a humus-like odor that did not require treatment.With an increasing number of facilities located in non-rural areas, provisions for odor control havebecome routine” (ibid, page 26). Facilities using such processes may or may not be equipped withspecial odor control systems. Where odor control systems are employed, biofilters represent acommon, effective control mechanism. Where odor problems have been identified, “most odors wereshort-term events that occurred when raw sludge was pumped into the reactor and when raw sludgeodors were stripped out into the exhaust. One plant reported odors when the temperature in thesecond-stage reactor approached 70oC” (ibid., page 26). Proponents of the technology examined inthis report feel that such odor was most likely caused at the end of the digestion by the release ofammonia due to a high pH. Proponents of the IBR ATAD process assert that ammonia is not releasedunder conditions of optimal microbial processing as evidenced both by an absence of odor (seesubsequent sections) and a constant nitrogen-phosphorous-potassium ratio in feedstock and endproduct (see subsequent sections).
Product stabilization through on-site dry packaging and liquid bottling, and full entrapment and filtrationof air cycled thorough the processing facility, represent design constraints placed on the system byrequirements for odor control. Odorant molecules are channeled to and degraded within a biofilter (seesubsequent section), and passage ways to and from the processing floor are additionally treated withvolatized essential oils when ever doorways are open. Essential oils entrap and attenuate odors (seesubsequent sections).
Ease of process management is a design constraint to provide quality control of feedstock and productand quality assurance for system performance. Component quality control elements of the precedentIBRC fertilizer manufacturing facility consist of inspections and of containing all transfer operationswithin a single building maintained under negative pressure and from which all air streams are fed intoa biofilter. Key quality control features include, but are not limited to:
1. Visual inspection of individual pails of waste scrap for co-mixed materials;2. Chemical analysis (N-P-K) of representative incoming lots of slurry for consistency ;3. Visual inspection of incoming non-slurry scrap from de-packaging sources;4. Continuous olfactory monitoring of air quality within the building by staff within the building;5. Thermal, chemical and pH monitoring throughout the process;6. Visual, olfactory, and chemical (Nitrogen-Phosphorous-Potassium) characterization of the solid and
liquid finished products.
TECHNOLOGY DESCRIPTION
STEP Green Book Technology Summary Page 10 of 42 Date printed May 24, 2000
Overview of Collection and Transport System
Key elements of the supply stream management strategy:
� food wastes are converted to slurry at the supermarket site using new technology.� slurry will be stored in underground tanks (similar to septic tanks) where low pH and anaerobic
conditions will limit odor production� slurry will be pumped into vacuum trucks and hauled to the manufacturing facility where it will be
off-loaded in a sealed building
The technology and the management practices of the food scrap collection and pre-processing systemthat Bio-Dynamics, the proponents of the technology under review in this document, will employ isbeyond the scope of this technology assessment. For this reason, this aspect of the overall systemdesign will be discussed only in limited detail in this report. The photograph shown at right illustrates anexample of the type of collection truck used by National Challenge Systems Inc. (NCSI), Coquitlam,British Columbia. NCSI is the exclusivedistributor for agricultural technologies ofOrganic Resource Technology Inc. (ORTI),Guelph, Ontario. ORTI has technologiesrelated to on-site dry grinding and liquidslurry storage and transfer of organicresiduals. NCSI has packaged ORTItechnologies into an integrated system(“Organic Resource Recovery System”)consisting of milling solids into a slurry,holding slurry, vacuum transfer of slurry, andtransfer to processing facilities. Bio-Dynamics’ partner, IBR, has adopted theORTI approach as the collectionmethodology for their Vancouver facility(www.ibrcorp.com).
Details of the Bio-Dynamics collection plans have been reviewed by STEP, and those plans appearconsistent with the general operating principles of NCSI and ORTI as discussed in corporate materialsfrom those firms (see also www.nationalchallenge.com). Bio-Dynamics indicates that collection andtransport from food scrap generating facilities will be overseen by Suburban Companies(www.suburbancleaning.com), a Massachusetts-based firm whose principals have experience in facilitysupport and in waste hauling within the Commonwealth of Massachusetts. Incoming lots of feedstockwill be collected into a receiving vessel for quality testing. Rejected lots, if and when encountered, willbe hauled under manifest to disposal sites.
Overview of Receiving and Processing System
STEP has conducted a design review for the proposed Uxbridge facility. Performance statements arebased upon prior EPA analysis of ATAD technology and STEP’s current analysis of third partyexaminations of the Vancouver ATAD manufacturing facility. The processing system employed withinthe central manufacturing facility under study in this report conforms with design standards for the useof autothermal thermophilic aerobic digestion (ATAD) for municipal sludge processing facilities, with thesignificant distinction in the feedstock used for the manufacturing facility. ATAD technology has beenextensively reviewed by the EPA in a study released in September of 1990 (EPA/625/10-90/007). In
STEP Green Book Technology Summary Page 11 of 42 Date printed May 24, 2000
this prior study, EPA researchers determined that ATAD provides a proven, cost-effective way toachieve aerobic digestion and to produce sludge that can be land applied. “The ATAD process hasmany benefits: a high disinfection capability, low space and tankage requirements, and a high sludgetreatment rate. It is a relatively simple technology that is easy to operate (automatic monitoring orcontrol equipment and full time staff are not required) and economical, particularly for small facilities. Itprovides a proven, cost-effective way to achieve aerobic digestion and to produce sludge that can beapplied to land in the US without any management restrictions for pathogen control” (page 1). Thedocument further concludes that “ATAD process can be operated to meet the most stringent U.S.regulatory requirements” (see page 31).
The principal component elements of the fertilizer manufacturing facility plan examined in this analysisconsist of:
1. A set of tanks for receiving and inspecting incoming macerated slurry;2. A secondary tipping floor, conveyor, and macerator system for sorting and pre-processing incoming
non-slurry feedstock;3. A secondary hammer mill for pre-processing incoming non-slurry feedstock recalcitrant to
maceration alone;4. A primary macerator wherein pH is elevated and debris (i.e. commingled plastic) is collected;5. A primary gravity settling tank where grit is collected;6. A start-up digester equipped with a Shearator aeration system and foam cutter, and an auxiliary
heating capacity wherein microbes are introduced into the slurry stream;7. A means of collecting off-gasses from the start-up digestor and channeling them to a biofilter;8. A primary digester equipped with a Shearator aeration system, foam cutter, and grit trap;9. A primary screen chamber, where coarse particulate materials are removed and shunted to a reject
digester;10. A parallel reject digester to degrade coarse particulate matter either into disposable waste or
digestible slurry;11. A secondary digester equipped with a Shearator aeration system, foam cutter, and grit trap;12. A secondary screen;13. A collecting tank for mixing polymer with digested slurry;14. A press for de-watering digested slurry;15. A filtrate tank to collect liquid filtrate from the press (approx. 60% volume);16. A means of recycling filtrate to and through the reject digester, and/or to the primary macerator;17. A means of collecting some volume of the filtrate as a liquid fertilizer product;18. An indirect dryer for drying pressed, digested product;19. A means of collecting off-gasses from the dryer and channeling them to a biofilter;20. A mixer for blending dried product;21. A pelletizer for molding dried product;22. A bagger for packaging dried product;23. A modest negative pressure on the entire building for gas control;24. A system of infusing vented air streams with atomized droplets of water coated with essential oils to
control potential fugitive odor emissions;25. An external biofilter to receive essential oil-treated building air and digester vessel off-gasses as a
primary means of odor control.
STEP has examined the design for the facility and concludes that the proposed facility will include all ofthe elements of benchmarked ATAD systems related to bioconversion of feedstock into product.Proprietary innovative technology related to the processing facility consists of:
TECHNOLOGY DESCRIPTION
STEP Green Book Technology Summary Page 12 of 42 Date printed May 24, 2000
1. An apparatus called a Sherator for aerating digesters with infusions of micro bubbles. Thispatented (US 5,660,766) submerged aeration device saturates the slurry in the digestor withoxygen and optimizes the digestion process.
2. A digester vessel design to enable a succession of filtration steps that remove non-biodegradablematerials from the product stream. A patent is pending for this innovation.
3. A “reject digester” which accepts poorly digestible solids and extracts digestible material to increaseproduct yield. This digester minimizes waste material transferred off site for landfill disposal.
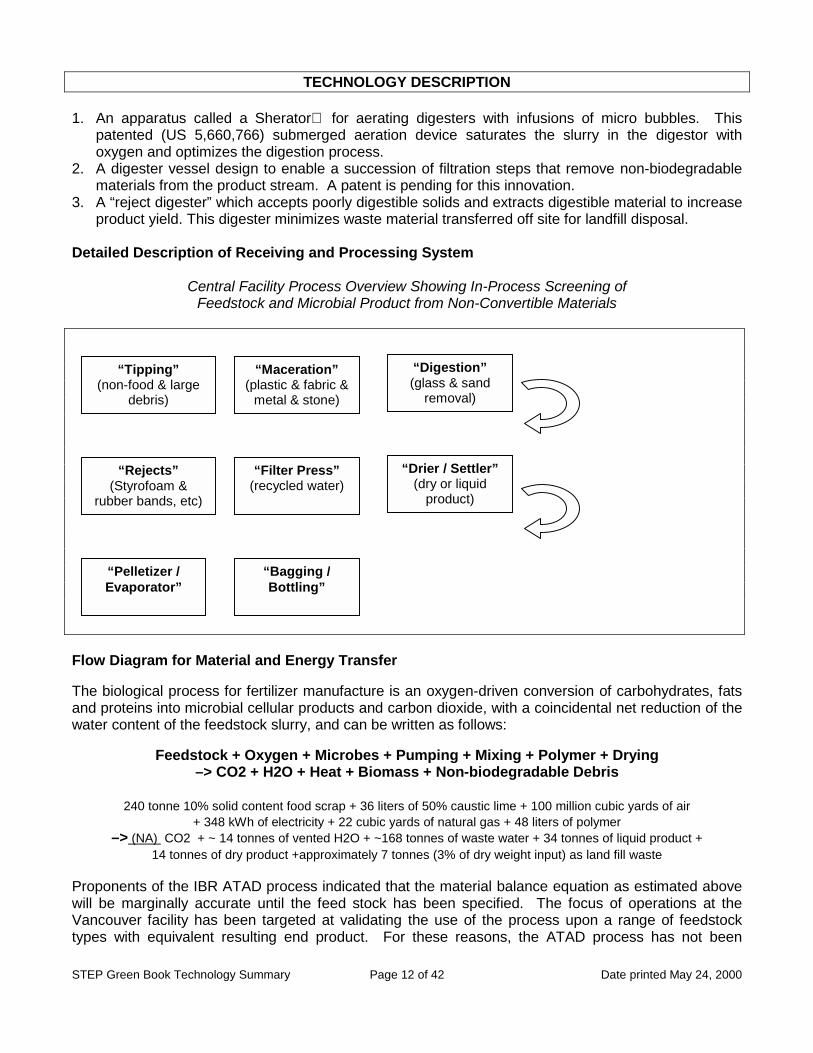
Detailed Description of Receiving and Processing System
Central Facility Process Overview Showing In-Process Screening ofFeedstock and Microbial Product from Non-Convertible Materials
Flow Diagram for Material and Energy Transfer
The biological process for fertilizer manufacture is an oxygen-driven conversion of carbohydrates, fatsand proteins into microbial cellular products and carbon dioxide, with a coincidental net reduction of thewater content of the feedstock slurry, and can be written as follows:
240 tonne 10% solid content food scrap + 36 liters of 50% caustic lime + 100 million cubic yards of air+ 348 kWh of electricity + 22 cubic yards of natural gas + 48 liters of polymer
–> (NA) CO2 + ~ 14 tonnes of vented H2O + ~168 tonnes of waste water + 34 tonnes of liquid product +14 tonnes of dry product +approximately 7 tonnes (3% of dry weight input) as land fill waste
Proponents of the IBR ATAD process indicated that the material balance equation as estimated abovewill be marginally accurate until the feed stock has been specified. The focus of operations at theVancouver facility has been targeted at validating the use of the process upon a range of feedstocktypes with equivalent resulting end product. For these reasons, the ATAD process has not been
“Tipping”(non-food & large
debris)
“Maceration”(plastic & fabric &
metal & stone)
“Rejects”(Styrofoam &
rubber bands, etc)
“Bagging /Bottling”
“Pelletizer /Evaporator”
“Filter Press”(recycled water)
“Digestion”(glass & sand
removal)
“Drier / Settler”(dry or liquid
product)
TECHNOLOGY DESCRIPTION
STEP Green Book Technology Summary Page 13 of 42 Date printed May 24, 2000
optimized for resource use for specific feedstock types at this time. The equation is not balancedspecifically in terms of the amount of carbon dioxide (a recognized green house gas) from theconsumption of organic carbon to both power the bioconversion of feedstock into microbial product andto generate the metabolic heat required to sustain the autothermal process itself. According to an EPAassessment of the ATAD process, the process oxygen requirement (POR) for ATAD is 1.42 kg O2 perkg of VSS converted into microbial biomass (page 28, EPA 625/10-90/007). By design, aeration isoptimized to favor complete conversion of feedstock to microbial biomass, and the reported highquantitative yield of the process (> 90%) is consistent with expectations for efficient bioconversion.
Recent patents on improvements in ATAD technology have asserted that elevated oxygen levelscorrelate with elevated temperature from metabolic heat. Because off-gassing of ammonia issignificantly favored by temperatures around 70oC, one might expect highly aerated ATAD systems tobe subject to heat-related odors. However, proponents of the IBR ATAD process assert that acrosstheir range of operating temperatures, neither odors nor any measurable net loss of nitrogen areobserved (see pg. 23). STEP has collected no data to directly corroborate these assertions (seesubsequent sections for discussions of odor-free operation).
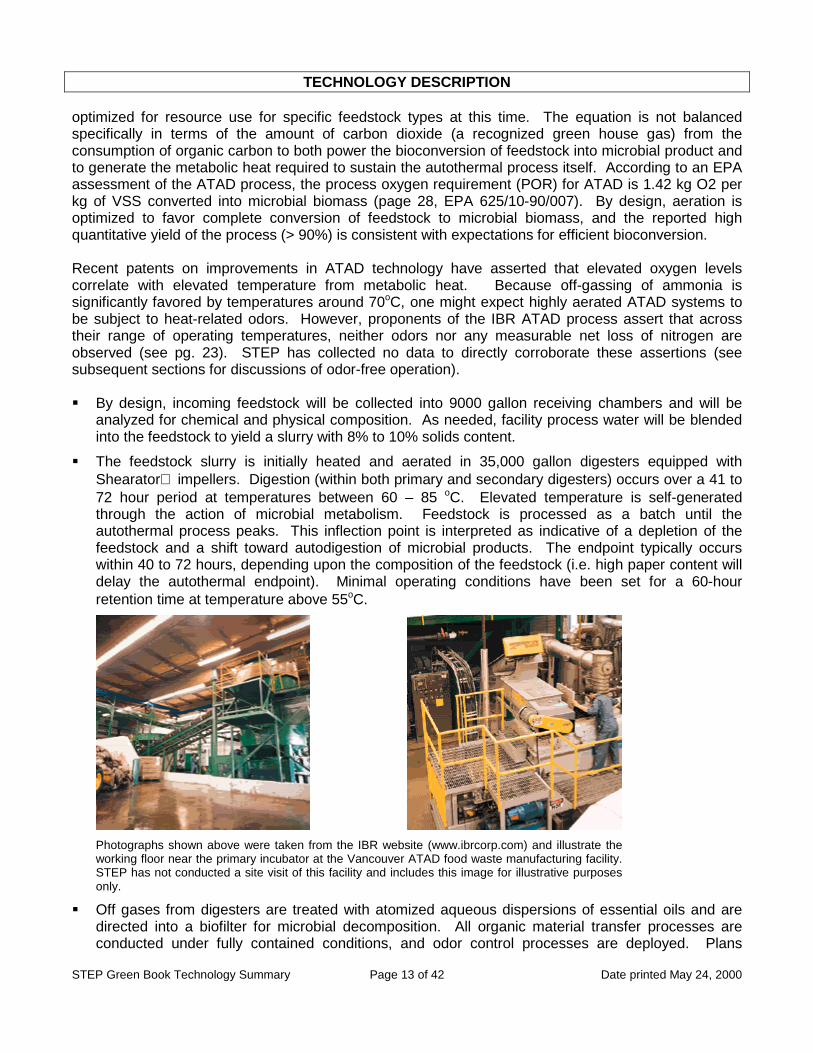
� By design, incoming feedstock will be collected into 9000 gallon receiving chambers and will beanalyzed for chemical and physical composition. As needed, facility process water will be blendedinto the feedstock to yield a slurry with 8% to 10% solids content.
� The feedstock slurry is initially heated and aerated in 35,000 gallon digesters equipped withShearator impellers. Digestion (within both primary and secondary digesters) occurs over a 41 to72 hour period at temperatures between 60 – 85 οC. Elevated temperature is self-generatedthrough the action of microbial metabolism. Feedstock is processed as a batch until theautothermal process peaks. This inflection point is interpreted as indicative of a depletion of thefeedstock and a shift toward autodigestion of microbial products. The endpoint typically occurswithin 40 to 72 hours, depending upon the composition of the feedstock (i.e. high paper content willdelay the autothermal endpoint). Minimal operating conditions have been set for a 60-hourretention time at temperature above 55οC.
Photographs shown above were taken from the IBR website (www.ibrcorp.com) and illustrate theworking floor near the primary incubator at the Vancouver ATAD food waste manufacturing facility.STEP has not conducted a site visit of this facility and includes this image for illustrative purposesonly.
� Off gases from digesters are treated with atomized aqueous dispersions of essential oils and aredirected into a biofilter for microbial decomposition. All organic material transfer processes areconducted under fully contained conditions, and odor control processes are deployed. Plans
STEP Green Book Technology Summary Page 14 of 42 Date printed May 24, 2000
reported to STEP assert that at no time will incoming feedstock be stored on site for any periodgreater than 3 days, and at no time will stabilized microbial end product be stored on site for morethan 60 days. Dried and bagged end product, and bottled liquid product, held under ambienttemperature for periods greater than three months are asserted to remain odor free.Water contained in the incoming food waste slurry is partially recycled during the digestion processto save on heating costs. Approximately 15% of the incoming water ultimately passes through thefacility biofilter in the form of air vapor from digesters and from drying ovens (and therebycontributes to the hydration requirements of the biofilter). About 14% of incoming water contributesto the liquid end product. The remaining water contained in the incoming food waste (about 25,000gallons per day) is discharged to waste water treatment facilities, in compliance with localwastewater treatment requirements.
Atmospheric air is drawn into the system, and, within the heated digester, expands. Expandinggases exit the digesters and are passed through a biofilter as they are returned to the atmosphere.Approximately 13 million cubic yards of air pass through the system daily.
Temperature is maintained by heat generated through microbial metabolism. The digestertemperature is regulated through control over the amount of oxygen that is “mixed” into the fluidthrough the action of submerged aerators (i.e. Shearator™ units).
Heat is subsequently used to dry a portion of the product that represents approximately 12% to13% of the solid matter suspended in the incoming slurry. Heat for product drying is generated by asteam boiler fuelled by natural gas to generate 20 tons of dry and concentrated liquid product from200 tons of slurry feedstock. Process conditions for resource use will need to be optimized forspecific feedstock compositions.
Electricity is used to drive pumps and aeration equipment. The technology proponents assert thatapproximately 35 GW of energy are consumed for processing 200 tons of feedstock.
Overview of Odor Control and Product Stabilization
Regulatory provisions require the proposed manufacturing facility to remain in compliance with respectto odor control. Prior review of ATAD systems and odor control technologies indicate that the proposedmanufacturing facility should be able to operate within full regulatory compliance.
“ATAD odors are characterized mainly as humus-like, with some gaseous ammonia.... Ammonia is releasedby thermophilic aerobic degradation during digestion and cannot be avoided. Ammonia is not subsequentlynitrified due to the suppression of nitrification at thermophilic temperatures. Depending upon the pH of thereactor, ammonia can be stripped into the exhaust. ATAD systems typically exhibit an elevated pH,particularly in the second-stage reactor, which enhances the stripping potential for ammonia. (EPA/625/10-90/007 September 1990, page 26)” Such ammonia is removed from the air as air is passed thoroughbiofilters.
“The biofilter consists of a simple tank containing a filter bed of biologically active material (compost, bark, orsimilar material). Odors are removed by adsorption and digestion. The filter bed should have a moisturecontent between 40% and 60%. A water scrubber precedes the actual filter to pre-humidify the air to amoisture level of about 95%.” (ibid, page 27) In the technology examined in this report, highly aerateddigesters function as water scrubbers in their ability to pre-humidify air before it enters into the biofilter.
TECHNOLOGY DESCRIPTION
STEP Green Book Technology Summary Page 15 of 42 Date printed May 24, 2000
Details of Odor Control Systems
Advantages (Disadvantages) of Options for Common Odor Management Approaches:
Chemical Wet Scrubbing Impregnated Carbon Bio-Filtersmall footprint high removal efficiency no chemicals requiredgood removal simple design effective at high PPM
Efficiency handles high H2S loads (needs chemical regeneration) (air must be captured)(high O&M costs) (landfill of spent carbon) (larger land area needed)(complex system) (only treats low PPM) (landfill of bio-material)
(high maintenance) (air must be captured)(air must be captured)
ATAD facilities may or may not require special odor control systems. Where odor control systems areemployed, biofilters represent the common and effective control mechanism. Currently proposedfeatures of the Bio-Dynamics’ biofilter design have been benchmarked against best practice biofilterswithin the State of Massachusetts. Critical management practices for benchmarked biofilters includedscheduled watering of filler material and inspecting for “dry spots” (either with surface inspection orthrough spot excavation to a depth of 2 feet). Practices differ with respect to the amount of activeturning of filler materials in different sites.
Benchmarks for Biofilters Used for Food or Agricultural Product Manufacturing System:
Parameter Subject BiofilterSite Vancouver Marlborough, MA Somerset, MAVendor IBRC Bedminster Fay, Spofford & Thorndike,
Inc.Waste type Food scrap MSW & sludge SewageEquivalent Solid WasteTon/Day
20 tons 180 tons ~ 3 Tons
Organic product rate N/A Kg/d <10 ppm total non-methane VoC
<2 ppm Total non-methaneVoC
Use of Scrubber equivalent yes yesCanopy / Enclosure Canopy Enclosure EnclosureTotal air into the filter 8,970 CFM 110,000 CFM 25,000 CFMFilter volume 7,200 cu ft 1,350,000 cu ft 38,480 cu ftMaximum loading rate 4.98 CFM /sq ft 4 CFM /sq ft 4.16 CFM /sq ftWorking back pressure NA 2 “ (6 mos.) 4 ½ “ (2 yrs.)*Void volume 60% NA (compression) NA (compression)Reaction time 50 seconds 70 seconds ~ 90 secondsSpecific biomass load Proprietary
Expected bed life 3 years 2 years 7+ yearsRespiration activity N/A N/ADispersion Stack none 30 ft updraft fan available, not in usepH Neutral Not monitored Neutral (leachate)Notes Scrubber brings NH4
from 5 ppm belowthreshold
Scrubber brings NH4 below40 ppm
Note: The Somerset biofilter reports an abundance of earth worms in their filler, which is felt to contribute to acceleratedconsumption of filler (> 100 yards per year), but which may also account for improved air flow and reduced back-pressure.Leachate from this facility empties into a drain on site and was not a source of detectable odor on the day the site was
TECHNOLOGY DESCRIPTION
STEP Green Book Technology Summary Page 16 of 42 Date printed May 24, 2000
examined. Leachate volume is felt to match the amount of water added to humidify the biofilter, but a mass balance has notbeen established to date.
Primary Odor Control System: Biofilter Odor Capture
The primary odor control system will be total facility containment wherein air is forced through abiofilter. Odor management through physical containment is a well-established practice, and biologicalair filters, or “biofilters,” have well-established applications for the removal of low odors in high volumeair streams from food processing plants (e.g. meat processing, food fragrance production andfermentation processes), composting operations, and even sewage treatment plants (H.A.J. Hoitink andH.M.Keener, 1993). The Food Manufacturing Coalition (FMC; www.foodsci.unl.edu/fmc/4odors.htm)asserts that “The biofilter has been shown to effectively control odors produced in food processing(Odor Control of Food Processing Operations by Air Cleaning Technologies, page 10).” STEP’scomparison of biofilter designs indicates that biofilter can effectively manager even exceptionallychallenging odors.
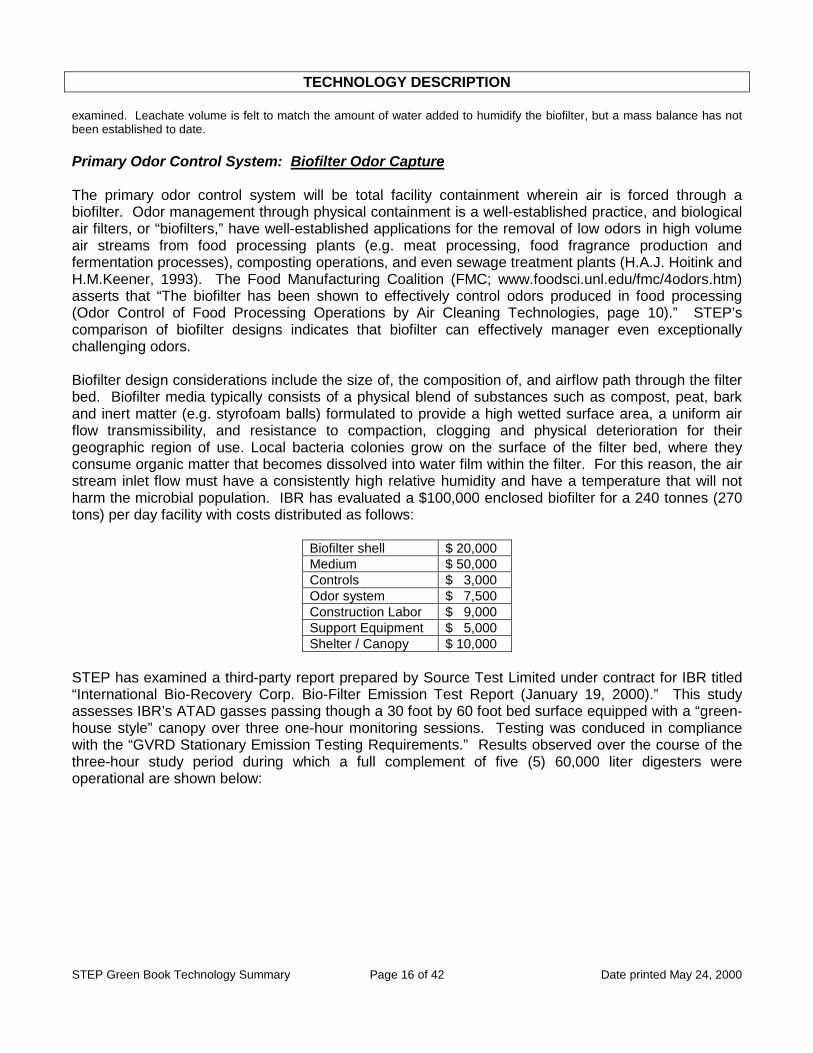
Biofilter design considerations include the size of, the composition of, and airflow path through the filterbed. Biofilter media typically consists of a physical blend of substances such as compost, peat, barkand inert matter (e.g. styrofoam balls) formulated to provide a high wetted surface area, a uniform airflow transmissibility, and resistance to compaction, clogging and physical deterioration for theirgeographic region of use. Local bacteria colonies grow on the surface of the filter bed, where theyconsume organic matter that becomes dissolved into water film within the filter. For this reason, the airstream inlet flow must have a consistently high relative humidity and have a temperature that will notharm the microbial population. IBR has evaluated a $100,000 enclosed biofilter for a 240 tonnes (270tons) per day facility with costs distributed as follows:
STEP has examined a third-party report prepared by Source Test Limited under contract for IBR titled“International Bio-Recovery Corp. Bio-Filter Emission Test Report (January 19, 2000).” This studyassesses IBR’s ATAD gasses passing though a 30 foot by 60 foot bed surface equipped with a “green-house style” canopy over three one-hour monitoring sessions. Testing was conduced in compliancewith the “GVRD Stationary Emission Testing Requirements.” Results observed over the course of thethree-hour study period during which a full complement of five (5) 60,000 liter digesters wereoperational are shown below:
* ppm conversions from mg/m3 using Handbook ofEnvironmental Data on Organic Chemicals
The IBR facility was permitted for air volumes not to exceed 24,735 CFM. The low ammonia andreduced sulfur compound level is consistent with IRB’s claim to operate under conditions of nodetectable odors. STEP has not directly corroborated this claim either by site inspection or through areview of records of local public health offices.
Biofilters are custom designed to manage peak loads, and may additionally be designed in anticipationof potential future plant expansions. To avoid expenses in redesign, typical biofilters are engineeredwith some consideration for expansion (e.g. some near-by reserved space where an additional biofiltercell could be added into the system). In the unlikely condition where a biofilter might be under-engineered, quick remedies (potentially capturing about 25% more capacity) may include expandingthe depth of the filter cells by adding more biologically active filler. The science of biofilter design hasprogressed continuously over the past several decades such that, within the Commonwealth, biofilterdesigners now routinely develop biofilters that meet a wide range of specific performancespecifications. Key parameters of the biofilter design reported for the IBR precedent facility (e.g.maximum loading rate and reaction rate) are comparable with systems known to be effective in odormanagement (page 12).
Vapors that condense within the filter may, in some systems, leach from the filters. Unless condensateleaching is known not to be an issue, some provisions for controlling leachate is recommended.
The capital cost of biofilter systems is reported to be comparable to those of alternate technologiessuch as air scrubbers and adsorption systems. Biofilter operating costs are considered to be minimaldue to the fact that they consume no chemicals or energy (except for electric fans to drive air throughthe filter) and require minimal instrumentation and monitoring. The major costs are filter bed mediareplacement (every 3-5 years) which typically represents a 10% depreciation of total capital cost peryear. The IBR system proponents assert that, through a design that eliminates biodegradable materialwithin the IBR biofilter, no detected change in the pressure was observed across their biofilter bed overthe course of one year of continuous operation. For this reason, the IBR system anticipates deferringbiofilter depreciation costs.
Secondary Odor Control System: Essential Oil Odor Capture
While many systems operate with only a primary odor control system, the Uxbridge facility will employ asecondary system to contain any potential fugitive emissions from the plant. This secondary odorcontrol system will consist of atomized essential oil. An essential oil is the predominately volatilematerial pressed from plants. More than 3,000 oils have been identified and several hundred of thesehave been commercialized. Essential oils have been applied to control odors at landfills, agriculturalsites, restaurants, wastewater treatment, and industrial operations. STEP has not directly corroboratedthe effectiveness of these applications.
TECHNOLOGY DESCRIPTION
STEP Green Book Technology Summary Page 18 of 42 Date printed May 24, 2000
Commercial essential oil mixes consist of essential oils, terpenes and their oxygenated counterparts,terpenoids. Where essential oils are atomized on the surface of a fine mist of water droplets, theessential oils act as a physical, electrostatic trap for some odorant molecules. As the oils form a thinfilm over the water droplet, this “skin” creates an electrostatic charge and attracts charged odormolecules. Where chemical reactions with essential oils are asserted to occur, the principal types ofreactions are thought to be oxidation (including fast-acting hydroxyl radicals), reduction and someesterification.
A range of readily available misting equipment may be used to apply essential oil odor barriers.Application considerations require that water droplets are fine enough so that they do not condense andprecipitate from the column of air. This is accomplished by forcing a mixture through a fine nozzle. Themixture will contain a suitable carrier (e.g. isopropyl alcohol), water, and essential oil. The amount ofessential oil that is applied will depend upon some subjective assessment of need. The need forincreasing the application of essential oil (over some baseline rate) will be governed by perceptions offacility operators, first, and external reporters, second.
The specific essential oil that will be used by Bio-Dynamics is a product called Ecosorb®, a proprietaryformulation of several essential oils and food grade surfactants. The vendor supplying this productreports an illustration of the product’s odor control performance in the table below. While severalorders of magnitude in odorant reduction can be generated within 15 minutes, the vendor’s applicationguidelines target a 5 second vapor-to-odorant contact time in an essential oil mist (i.e. 10 u droplets).The mist should obtain no more than 85% relative humidity at the site of odor containment. In rainyweather, maximal odor containment can expect to be somewhat compromised due to condensation ofessential oil out of the air column. Rain, itself, however, mitigates some odor problems because manyodorant molecules are soluble in water such that rain can act as a natural air scrubber.
EcoSorb® Contact Testing With Identified Gases (ppm/v)Gases Ammonia Hydrogen SulfidePerm Tube 97 48Reactor Out 97 48Contact 68 405 min 5 715 min <1 <2Note: this table reports progressive reduction in the concentrationof two representative odor types with exposure to a mist ofessential oil.
The Uxbridge facility proposal includes provisions for establishing an odor barrier at doorways thatallow access into the tipping floor and processing chambers of the manufacturing facility. Opportunitiesfor fugitive release of odor are limited to those times when trucks enter and leave the building.Essential oil treatment is a strategy for managing these episodes.
In applications where essential oils have been used as a primary odor control mechanism, theEcoSorb® vendor reports effective performance for a fish meal manufacturer (in the southern UnitedStates) who blends barley, soybeans and fish oil to make a dry fish food. The vendor asserts that using106 nozzles spraying into a 30 inch flue as well as a 10x10x24 plenum, the fish food manufacturer usesone gallon of Ecosorb® per operational hour. The same vendor also reports that for a Californiafertilizer manufacturer processing municipal sludge at a 200 acre land fill (an application significantlydifferent from the waste food processing operations proposed in this review), acute odor episodes arecontrolled with two oscillating fan systems that are automatically activated when vehicles dump their
TECHNOLOGY DESCRIPTION
STEP Green Book Technology Summary Page 19 of 42 Date printed May 24, 2000
loads. This site is reported to use 55 gallons of Ecosorb® per month. For in-vessel compostmanufacturing, the vendor cites an East Coast composting facility (again using municipal sludge)operating in a 90,000 square foot indoor facility. This site is reported to use 1,100 gallons of atomizedessential oil per month for complete odor control.
Across a range of applications, essential oil user have offered testimonials to the effectiveness of thisas a primary odor management technology. Third party assessments of different dimensions of theperformance of EcoSorb® have been offered by:
� Dr. Sylvain Savard, Center of Industrial Research for Quebec;� Drs.Ying Shang, R.W. Hurd, and Donald R. Wilkinson, Delaware State University; and� Carter Laboratories, CA
The Safety profile of EcoSorb® has been established through testing performed by Tox MonitorLaboratories, Inc., of Oak Park, IL. Tests performed by this independent laboratory included EPAGuidelines 81-1, 81-2, 81-3, 81-4, 81-5, and 81-6, and found the product non-toxic in all categories(e.g. Toxicity IV for skin effects, Toxicity Category III for eye effects, Toxicity Category IV for acute oralexposure, Toxicity Category IV for acute inhalation exposure, Toxicity Category IV for acute dermalexposure, and no positive Buehler reactions for skin sensitizing effects). The product’s MSDS identifyis Ecosorb 6()6, and is characterized as stable, milky white fluid with a slight citrus or floral odor andwith no fire or explosion hazards.
As a consciously-applied secondary odor control system, the essential oil odor management system ofthe Uxbridge Facility appears fully adequate to manage fugitive odors as may result from incidentalspills or air leaks that might occur within the fully enclosed manufacturing facility. Moreover, if scaledsufficiently, this secondary odor control system may have the capacity to keep the facility odor free forsome undetermined period of time in the event that the primary system experienced a failure. STEPsees the combined use of a biofilter and essential oil misting as an effort to go beyond meetingconventional requirements for air quality control for food scrap remanufacturing operations.
Other Odor Control: Best Management Practices
� Complete containment of all transfer and processing activities within a building maintained undernegative pressure prevents the escape of fugitive emissions. Fugitive emissions are the principalsource of odor in many large-scale operations. The proposed ATAD manufacturing facility includesplans to apply best management practice to its odor control program.
� Vacuum transfer and slurry transportation require that transfer vehicles fully contain incomingfeedstock. This prevents fugitive emissions during transport to the manufacturing facility.
� Acidified, anaerobic holding tanks to collect up slurry at food scrap production sites minimizesopportunities for odor production and fugitive emissions at the source of feedstock generation. It isSTEP’s understanding that underground storage tanks will be preferred over current on-sitepractices for storing food scrap between scheduled waste removal cycles.
TECHNOLOGY APPLICABILITY
STEP Green Book Technology Summary Page 20 of 42 Date printed May 24, 2000
Bioconverted organic feedstock derived from food processing, agriculture, domestic refuse, sewageand industrial effluent contain large quantities of organic matter which must be rendered into a form thatwill not attract vermin, transmit disease or release odor or toxic gases. The in-vessel slurrybioconversion system examined in this study represents one means of managing this problem. Themanufacturing system, considered in its entirety, is applicable for converting organic waste intovaluable agricultural product. Restrictions on land filling, composting, and odor collectively favorconsideration of this technology.
Applicability to Industry/User
The precedent fertilizer manufacturing system technology considered in this report providesadvantages over competing organic waste processing technologies through its use of presorted foodwaste generated by a network of value-added suppliers. Proponents of this approach assert thatcleanliness of collection equipment (including routinely steam cleaned, sealed collection vessels andstainless steel fluid transport vehicles) differentiates this service from current garbage collectionpractices.
The central processing facility has been designed such that it can accommodate up to 20%contamination with plastic, metal, paper and cardboard; however, feedstock supply contracts specify nomore than 10% non-digestible material, which is well within the Massachusetts regulatory guideline of15% maximum residue allowed in the incoming material. Non-digestible contaminates are screenedfrom the slurry during processing. As a result, the finished product has uniform physical characteristics(e.g. texture and fiber content) that add to its value in subsequent soil or fertilizer manufacturingprocesses that require component blending.
In independent tests conducted by BC Research, Inc., product produced by IBRC (the precedent soilmanufacturing facility for the technology described in this report) has been demonstrated to stimulate30% more plant growth than leading commercial chemical fertilizers currently in the market. Thisperformance claim, however, has not been benchmarked against alternative composting products.International Bio Recovery Corporation indicates that the product is a complete growth media that canbe used as fertilizer or can be used as “an organic base for chemical fertilizers” (page 27, FinalProspectus, Sept 29, 1998. Brink, Hudson & LeFever, ltd., Vancouver, BC).
Proponents for the fertilizer manufacturing process examined in this study assert that the processprovides a throughput cycle time of approximately 3 days, compared to 20 to 60 days for windrowcomposting. This is accomplished by digesting waste at temperatures between 60 oC and 80oC throughheat generated by microbial action. Rapid, aerobic cycle times minimize opportunities for anaerobicprocesses to generate odors and opportunities for vermin to be attracted to feedstocks.
The manufacturing technology, based upon aerobic methods, avoids the production of methane. Thus,approximately 75% more of the nutrient value of the processed organic material is retained in thefinished product and made available to beneficial reuses. Odor and explosion risks associated withhandling methane production are avoided.
While the IBR ATAD manufacturing process is more capital intensive than windrow composting,proponents assert ATAD to be cost-competitive with in-vessel composting principally because morerapid throughput improves the return on investments made into more capital intensive systems. STEPhas not completed a full cost comparison across competing technologies primarily because such acomparison must be based upon strong assumptions about the requirements of each specificprocessing site (see “Economic Model”).
TECHNOLOGY APPLICABILITY
STEP Green Book Technology Summary Page 21 of 42 Date printed May 24, 2000
Development/Application History
From January 3, 1993 through May 30, 1998, the manufacturing technology discussed in this study wasbeing developed by International Bio Recovery Corporation, North Vancouver, British Columbia,Canada. IBRC reports costs of $3,560,000 (Canadian) for developing the process and service and$480,000 (Canadian) for developing the product. Innovations principally include adding feedstock pre-sorting processes and redesigning the aeration and foam cutting processes. Refinements include de-watering and drying equipment, and process monitoring and control techniques.
The manufacturing system plans examined in this study have been generated by Uxbridge FoodProcessors LLC, a joint venture of Bio-Dynamics and International Bio Recovery Corporation. Bio-Dynamics is contributing business relationships to provide and haul waste scrap and to negotiate andsecure permits for facility sites. International Bio Recovery Corporation is contributing the technology,and currently operates a commercial scale facility based upon this technology at 52 Riverside Drive,North Vancouver, British Columbia. Bio-Dynamics’ operations at the Uxbridge site will be managed bythe Roy F. Weston Corporation (see details under Lessons Learned / Implementation Issues, page 33).
Lessons Learned During Technology Development
1. Aeration is a critical control aspect of the ATAD process, and application of a means of introducingfine bubble diffusion contributes to advantageous fermentation reactions. The IBR ATAD processproponents assert that the use of Shearator™-type submersible aerators enhances aeration andreduces equipment O&M costs by 40%. The IBR proponents assert that agitation and aeration of aslurry of 10% food waste solids require much more energy than liquid or domestic waste.
2. Slurry digester design and feedstock presorting play key roles in facilitating sieving grit and debrisfrom the feedstock and microbial biomass product stream. Pre-sorting and pre-processing methodsthat avoid shearing plastic and particulate debris facilitate removing non-bioconvertable materialfrom the feedstock stream. Excluding metallic items (i.e. flatware and metal containers) at thesource of food waste entry into the feedstock minimizes occlusion of plastic and small particle filtersduring subsequent steps of the manufacturing process.
3. Odor management is simplified through improved ATAD management. The need for odormanagement under average operating conditions is fully addressed with biofilter systemsprocessing 80,000 m3/d of vented digester gases and 1,000,000 m3/d of air exhausted from thebuilding housing the transfer and processing operations. Literature reports indicate that odorrelease episodes are most likely to occur when odorous materials are being transferred outside ofeffective odor capture containment, and biofilter site examinations indicate that odors are morelikely to issue from fugitive emissions of air scrubbers than from biofilters themselves. Optimal odorsource control is achieved by making feedstock and process fluid transfers only within fullyenclosed, negative pressure facilities. The Vancouver facility discovered that heavy rains couldcompromise the performance of its initial biofilter and lead to odor problems. Using this knowledge,the Vancouver group improved biofilter design and now asserts that the resulting improvementshave resulted in complaint-free operations over a 2-month evaluation period.
4. ATAD systems generate little free ammonia, even though it is recognized that at temperaturesabove 45oC microbial nitrification is inhibited. This phenomenon is explained as a result of excessammonia-nitrogen reacting with carbon dioxide in solution to produce ammonium bicarbonate(Stover, 2000, page 32).
TECHNOLOGY APPLICABILITY
STEP Green Book Technology Summary Page 22 of 42 Date printed May 24, 2000
Benchmarking ATAD Systems
ATAD systems are robust and reliable processing systems that require limited specialized operatingskill. The EPA has examined such systems in depth, and, in this analysis, key features of thosesystems are compared with elements of the IBR ATAD manufacturing system design (see table below).The table shown below compares the IBR ATAD fertilizer manufacturing system with EPA data onATAD systems used to process sludge. The point of the comparison is to illustrate the extent to whichthe IBR system builds upon technologically systems and practices with well-characterized performancehistories.
Benchmarking ATAD-based Process Facilities for Processing Cycle TimeComparable ATAD Process Facility Subject Comp. 1 Comp. 2
Site Vancouver Nette RomersbergVendor IBRC Fuchs Thieme
# of reactors 9 2 2Dimensions (dia., ht. In m) NA NA NA
Active volume @ m3 600 180 48 + 24Standard Retention Time (days) 3 4.7 3.4
Volumetric Loading (kg/d/m3) 13.3 8.4 11.7# of aerators per reactor NA 3 1
Installed aeration power (kW) 505 39 16# of foam cutters per reactor NA 4 NA
Installed foam cutter power (kW) 100 4.5 NATotal installed power (kW) 605 43.5 NA
Power density (W/m3) 1000 121 NADaily power use (kW/day) 14,520 1,044 NA
Specific power applied (W/kg VSS) NA 343 NAYears in service (since 1994) (since 1984) (Since 1985)
Percent of capacity 38% NA NATypes of waste (Domestic/Industrial/Food) Dom / Ind /Food Dom 50% Dom / Ind
Types of sludge (Primary / Activated waste) ( P & A ) P & A P & AFeed solids (%) 0.0 – 40.0 5.7 7.9 – 10.0
Feed Frequency (per day) 1 1 0.42Isolated reaction time (Hr) NA 23 56
R1 temperature (C) 55 42 45R2 temperature (C) 75 56 55-70
Post thickening % solids Dry to 92% Up to 7 % NAO&M time required (Hrs/wk) NA 2 NA
Odor Control system (Installed/not) Installed Installed InstalledMaintenance tests (i.e. cleaning / repair) Aerator
maintenanceAerator
maintenanceAerator
maintenance
• 4410 Kg/ton = 2.205 kg/lb. * 2000 lb./ton� Municipal ATAD design loading calculations are based on an average of 4% VSS concentration� Processed Food Slurry Feedstock calculations are based on an average of 9% TSS concentration� VSS is assumed herein typically to be 75% of TSS (page 14, EPA 625/10-90/007)� IBRC Subject Site (with daily loading of 200 ton/day slurry @ 9% TSS) = 80,000 kg/d TSS� Nette Municipal Site (with 3,000 Kg/d VSS) = 2,250 Kg/d TSS (or 1/35th subject scale)� Romersberg Municipal Site (with 840 Kg/d VSS) = 630 Kg/d TSS (or 1/127th subject scale)
TECHNOLOGY APPLICABILITY
STEP Green Book Technology Summary Page 23 of 42 Date printed May 24, 2000
STEP finds the IRB facility and the proposed facility to conform to the design features of typical ATADoperations, with the specific enhancement of aeration. It is understood by STEP that the increasedaeration (and energy costs associated with this aeration) is one of the key features that improves theuse of ATAD technology for the proposed manufacturing purposes. This enhanced aeration technologyis based upon patented technology and proprietary designs of the IBR Corporation and is beyond thescope of this report.
ATAD technology has advanced over the decade since the US EPA last formally examined it.Innovation is reflected both by patents that have issued in the field (see below) and new products thathave appeared on the market. Patents included both radical and incremental innovation of the ATADprocess (note: a radical innovation is represented by in-process slurry screening such as is embodiedby improved digester design). Incremental innovations appear as “new and improved” features ofsubsystems currently in use in ATAD facilities. An example of new and improved subsystems enteringthe market is illustrated by submersible mixer advances that promote improved energy efficiency andreduced repair times (e.g. 5 fold increase in motor life; U.S Filter’s EMU Products Group, Thomasville,GA). The appearance of incrementally improved products suggests that there may be additionalefficient benefits to be captured in ATAD systems. Incremental efficiency innovations appear wellsuited as retro-fits to ATAD systems.
Representative Recent Patents Illustrating Continued Process Evolution
1999 Process for Treating Biosolids from Wastewater Treatment (US 5948261) Richard L. Pressley, CrownPoint, IN. Improved temperature control through adjusting shear generated through jet aeration devices.
1999 Thermophilic Aerobic Waste Treatment Process (US 5885448) Kenneth L. Norcross & Yanlong Li,Edwardsville, KS. Improved processing efficiency through injecting into the digestion chamber a mix offresh and recycled reactor air.
1998 Process for Thermophilic Aerobic Fermentation of Organic Waste (US 5810903) Rene JosephBranconnier et al, Ontario, Canada. Process for Thermophilic Aerobic Fermentation of Organic Waste.Improved processing efficiency through mixing, enzyme treatment, pre-heating, and continuously mixingin-inoculated feedstock into a reactor containing active aerobic thermophilic microbes.
1998 Process and Apparatus for Liquid Sludge Stabilization (US 5851404) Richard W. Christy & Paul G.Christy, Wayne, PA. Gravity flow design that minimizes the need for mixing in order to move materialthrough the ATAD process.
1997 Waste Conversion by Liquid Thermophilic Aerobic Digestion (US 5702499) Hubert J. Timmenga,Vancouver, Canada. Establishing monitoring parameters to determine stages of processing when themajority of organic nutrient has been consumed without significant consumption of lignin or cellulose.
1992 Method and Apparatus for Improving Efficiency of Fluid Use and Odor Control in In-Vessel CompostingSystems (US 5175106) John G. Laurenson, Jr., St. Augustine, FL. Recycled fluid and air streamsimprove operating efficiency and improve odor containment.
TECHNOLOGY APPLICATION
STEP Green Book Technology Summary Page 24 of 42 Date printed May 24, 2000
General Setting
The IBR plant located in North Vancouver, British Columbia, is a commercial operating facility handling100 tonne per day of mixed biodegradable material collected by commercial haulers from more than 50different generators; i.e. food processors, restaurants, supermarkets, fish processing facilities, hospitalkitchen waste, hotels, etc. This plant produces six (6) tonnes of solid fertilizer and six (6) tonnes ofliquid fertilizer. The Plant is located on a two (2) acre parcel of land located in the light industrial areaadjacent to residential facilities. STEP has not reviewed factors or plans that influenced IBR sitingdecisions.
Technology Implementation at a Manufacturing Plant Site
A simplified footprint of the IBR facility layout is not publicly available at this time. The sequentiallocation of process systems within the manufacturing plant is illustrated in a block flow diagram shownon page 9 of this document. The specific model and brand identification of the major equipmentrequired of manufacturing process is not offered as public information at this time.
Material which does not enter the facility as a slurry arrives on tipping floor for inspection where large,unprocessable materials (i.e., wood pallets, cardboard boxes, etc.), if present, are removed by hand.Bio-Dynamics’ proposed facility in Uxbridge has a specific prohibition against “unprocessed meats” asfertilizer feedstock, and such material will be rejected and returned to haulers for disposal at theirexpense. Accepted material (if not already in a slurry form) is placed in a macerator where it is slurriedto a 8-10% solid content, consistent with incoming slurry feedstock. During maceration (also referred toin this document as “pulping”), plastics, fabrics, particulate metals, gravel and other heavy material aremechanically separated. The slurry is then pumped into a primary digester, heated to a minimum of55ºC and inoculated with bacteria produced in the previous batch. During its 48-hour stay in thisdigester, glass and sand etc. are removed through sedimentation. After this process, the “unders”(material below the foam layer within the digester) from this partial digest are pumped into a secondarydigester for a further digestion of 24 hours. The “overs”, small Styrofoam, plastics, etc., are pumpedinto a rejected digester where they are further digested and separated by a proprietary mechanism.Digested material from the reject digester rejoins the process flow in the secondary digester. Sieved,unprocessable debris is sent to landfill facilities. The digested slurry is partitioned by a rotary press intoa solid cake having a ~50% solid content and a filtrate having a ~2% soluble solid content. The solidsare further dried in a non-contact dryer, pelletized, crumbled, screened into three fractions and baked.The liquid goes through a final settling process after which it is concentrated to a 35% solid content andbottled. Before pelletization or evaporation, and based upon manufacturing requirements, organicadditives may be added to the final product stream to produce fertilizers to meet specific growers’demands.
TECHNOLOGY PERFORMANCE
STEP Green Book Technology Summary Page 25 of 42 Date printed May 24, 2000
The objective of this manufacturing facility is to enable a cost-effective, ATAD-based microbialconversion of waste food feedstock into microbial biomass fertilizer product, without objectionable odor.The technology’s performance in the selected application is described by summarizing the applicationruns made and the performance achieved.
Performance Goals
Environmental Goals
� The IBR technology will not have any negative effect on the environment.
� The IBR technology at the Uxbridge facility will be able to handle 200 tons per day of mixed foodwastes with up to 10% inorganic, unprocessable material, and convert this material into a highquality fertilizer.
� The IBR technology will accommodate urban operations within a small facility footprint, with a rapidwaste conversion cycle, and within a safe, stable and odor-contained operating environment.
Facility Performance Goals
� Solid food scrap waste received at the plant (with an initial average solid content of 15%) will beconverted into high quality end product with an average loss of no more than 2% of incoming solidorganic mass. Total solids in all end product (representing 13% of the incoming 15% solid matter)will exist as stabilized liquid product (9.8 ton of liquid fertilizer at 67% moisture content from 100tons of feedstock slurry) and as stabilized dry product (10.6 ton of solid product is products with an8% moisture content from 100 tons of feedstock slurry). No “unprocessed meats” will be acceptedas fertilizer feedstock at the Uxbridge facility.
� The IBR process will demonstrate itself to have among the highest yield and fastest food wastefertilizer manufacturing cycle time (between 54-72 hours compared to conventional ATAD systemsof 10 days), and will be targeting a product yield of better than 85% throughput on a solid massbasis and a decrease of cycle time by 70%.
� Facilities using the IRB process will manage vapor/air emissions to be in compliance with the moststringent air quality emission regulations.
Product Performance Goals
� Fertilizer produced by the IBR ATAD process will offer cost-comparable or superior crop growthwhile concurrently significantly reducing requirements for added phosphorous, inorganic nitrogen,insecticide and/or fungicide.
Technology Application Test Cases
Performance tests run during the application of ATAD for fertilizer manufacturing include monitoringtemperature over time, and for tracking solids content in product. A range of feedstock types has beenexamined by IRB over the course of its operations. Representative data from processing food wastescraps is shown below.
TECHNOLOGY PERFORMANCE
STEP Green Book Technology Summary Page 26 of 42 Date printed May 24, 2000
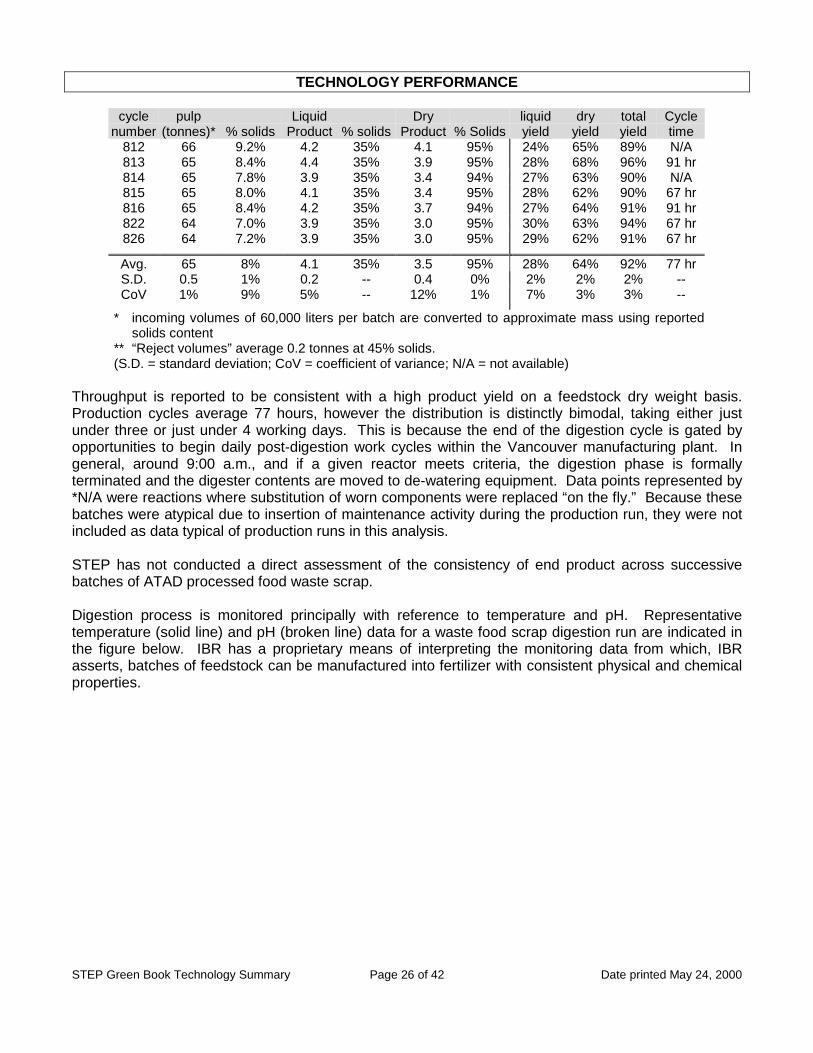
* incoming volumes of 60,000 liters per batch are converted to approximate mass using reportedsolids content
** “Reject volumes” average 0.2 tonnes at 45% solids.(S.D. = standard deviation; CoV = coefficient of variance; N/A = not available)
Throughput is reported to be consistent with a high product yield on a feedstock dry weight basis.Production cycles average 77 hours, however the distribution is distinctly bimodal, taking either justunder three or just under 4 working days. This is because the end of the digestion cycle is gated byopportunities to begin daily post-digestion work cycles within the Vancouver manufacturing plant. Ingeneral, around 9:00 a.m., and if a given reactor meets criteria, the digestion phase is formallyterminated and the digester contents are moved to de-watering equipment. Data points represented by*N/A were reactions where substitution of worn components were replaced “on the fly.” Because thesebatches were atypical due to insertion of maintenance activity during the production run, they were notincluded as data typical of production runs in this analysis.
STEP has not conducted a direct assessment of the consistency of end product across successivebatches of ATAD processed food waste scrap.
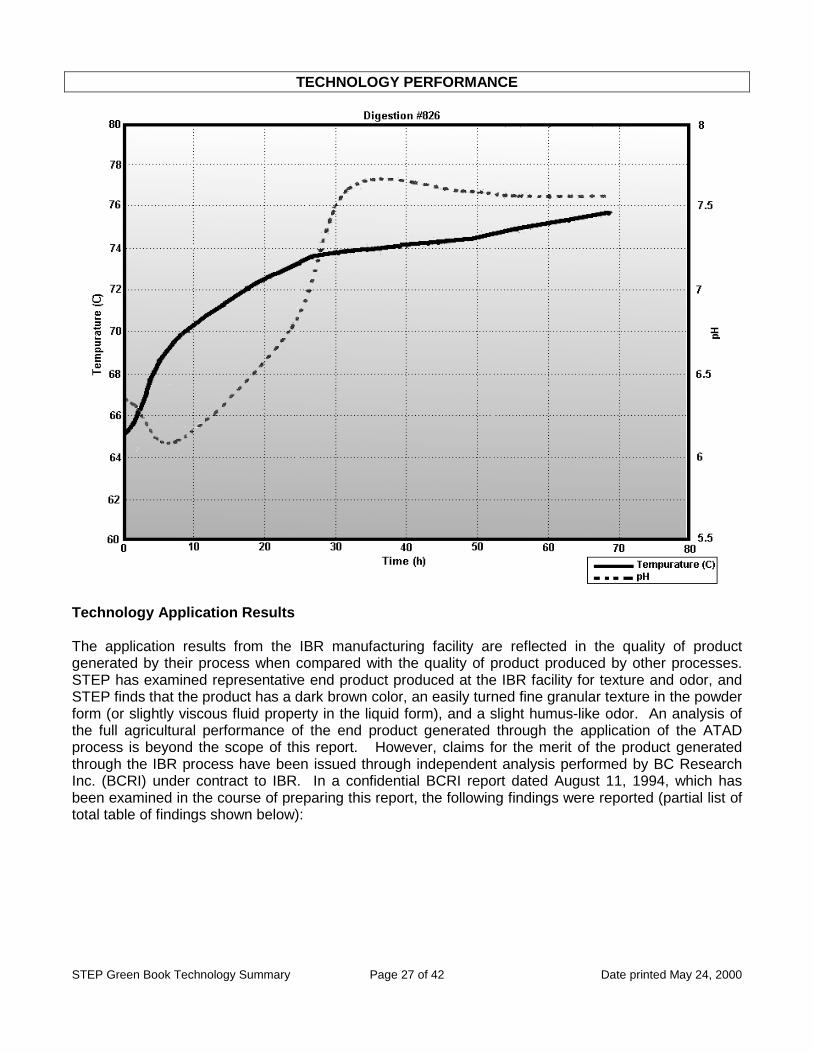
Digestion process is monitored principally with reference to temperature and pH. Representativetemperature (solid line) and pH (broken line) data for a waste food scrap digestion run are indicated inthe figure below. IBR has a proprietary means of interpreting the monitoring data from which, IBRasserts, batches of feedstock can be manufactured into fertilizer with consistent physical and chemicalproperties.
TECHNOLOGY PERFORMANCE
STEP Green Book Technology Summary Page 27 of 42 Date printed May 24, 2000
Technology Application Results
The application results from the IBR manufacturing facility are reflected in the quality of productgenerated by their process when compared with the quality of product produced by other processes.STEP has examined representative end product produced at the IBR facility for texture and odor, andSTEP finds that the product has a dark brown color, an easily turned fine granular texture in the powderform (or slightly viscous fluid property in the liquid form), and a slight humus-like odor. An analysis ofthe full agricultural performance of the end product generated through the application of the ATADprocess is beyond the scope of this report. However, claims for the merit of the product generatedthrough the IBR process have been issued through independent analysis performed by BC ResearchInc. (BCRI) under contract to IBR. In a confidential BCRI report dated August 11, 1994, which hasbeen examined in the course of preparing this report, the following findings were reported (partial list oftotal table of findings shown below):
TECHNOLOGY PERFORMANCE
STEP Green Book Technology Summary Page 28 of 42 Date printed May 24, 2000
Comparative Fertilizer Value of IBRC’s Organic Fertilizer, Commercial Composts, andCommercial Organic Fertilizers.
This same study characterizes the stability of the product by monitoring the reduction of biochemicaloxygen demand (44% reduction) and chemical oxygen demand (31% reduction) of the slurry to thepoint where it is de-watered for packaging or bottling.
BCRI additionally monitored the nitrogen, phosphorous and potassium (N-P-K) ratios within the pulpbefore digestion (1-0.24-0.43), after 36 hours of processing (1-0.25-0.45), and within end productbefore end product was spiked with mineral salts (1-0.24-0.36; recalculated from their reported data).The constant nitrogen to phosphorous ratio is interpreted as evidence for no limited loss of nitrogenduring processing, which corroborates the proponents’ claims that the ATAD manufacturing process isodor-free when applied to food scrap feedstock.
A second independent assessment reviewed by STEP (i.e. excerpts of a study conducted by Mikrotek,Ontario) compared IBR product (6-2-4 N-P-K with 57% organic matter) with a commercial fertilizer (19-25-5 N-P-K with 1.8% sulfur) manufactured by Scotts. In this study, no statistically significant differencein the growth of golf course grass was observed. STEP interprets this data as indicating comparableagricultural performance with 8% of the phosphorous load and with 30% of the inorganic nitrogencontent of the commercial product.
On the basis of material reviewed by STEP, STEP concludes that the IBR end product has genuinevalue as a fertilizer.
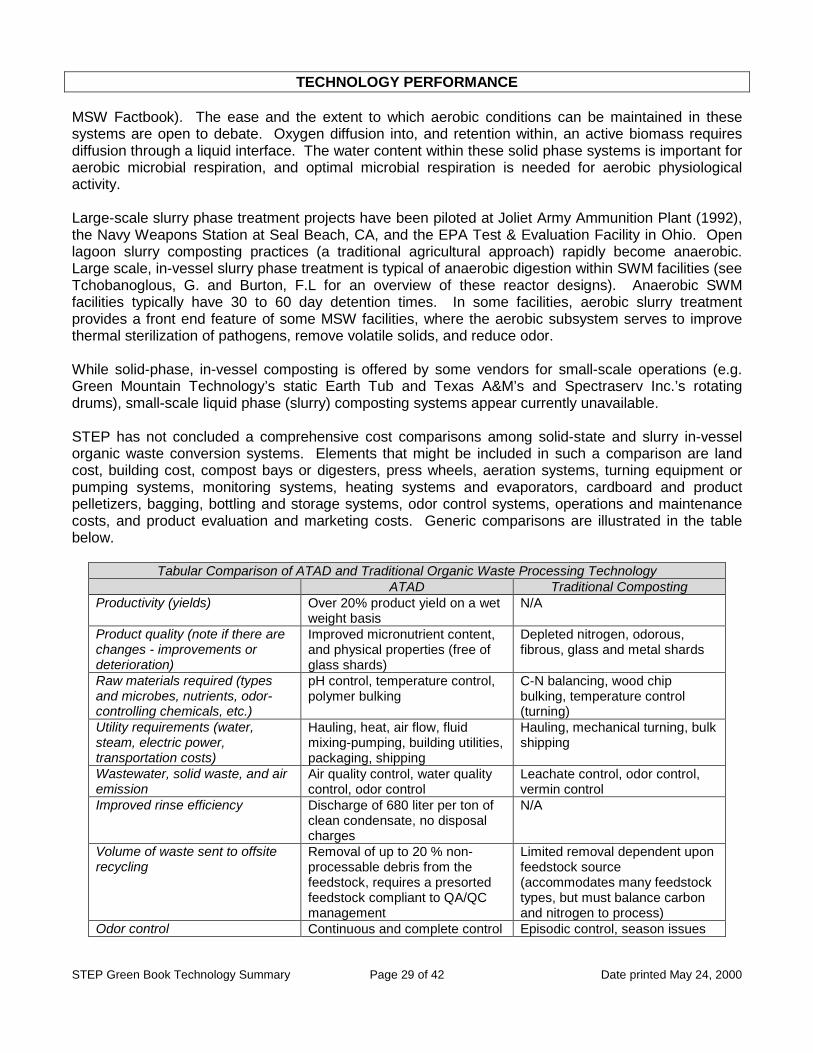
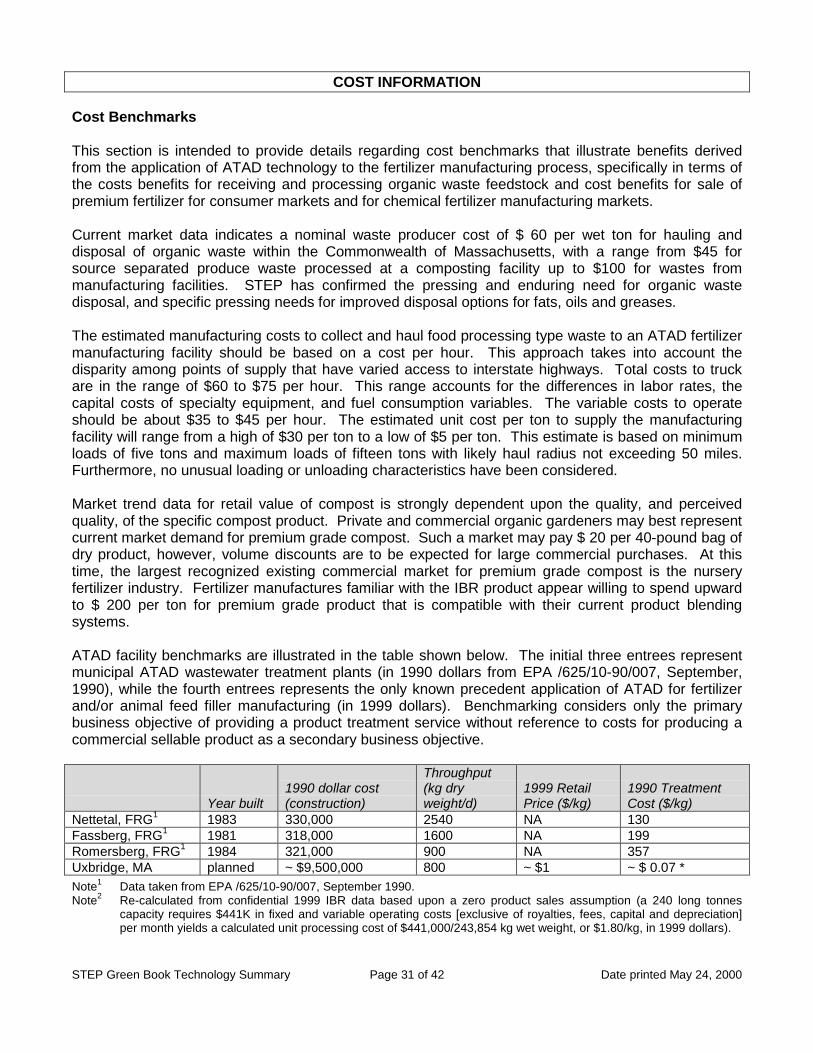
Performance Compared to Existing / Traditional Technology
The use of ATAD as a fertilizer manufacturing process can be compared with alternative means ofgenerating soil amendment. Such alternative methods include solid state bioconversion in the form ofexposed windrows or in-vessel, aerated solid stacks. Because odor containment is a key requirementof urban fertilizer manufacturing, comparisons among in-vessel bioconversion systems are mostmeaningful.
Generic categories of contained composting systems include:
Leading firms advocating very large scale in-vessel composting technologies include Bedminster,Raytheon, Salsem Veciap, ASP, American BioTech, Wright Environmental, and Reidel (source: EPA
TECHNOLOGY PERFORMANCE
STEP Green Book Technology Summary Page 29 of 42 Date printed May 24, 2000
MSW Factbook). The ease and the extent to which aerobic conditions can be maintained in thesesystems are open to debate. Oxygen diffusion into, and retention within, an active biomass requiresdiffusion through a liquid interface. The water content within these solid phase systems is important foraerobic microbial respiration, and optimal microbial respiration is needed for aerobic physiologicalactivity.
Large-scale slurry phase treatment projects have been piloted at Joliet Army Ammunition Plant (1992),the Navy Weapons Station at Seal Beach, CA, and the EPA Test & Evaluation Facility in Ohio. Openlagoon slurry composting practices (a traditional agricultural approach) rapidly become anaerobic.Large scale, in-vessel slurry phase treatment is typical of anaerobic digestion within SWM facilities (seeTchobanoglous, G. and Burton, F.L for an overview of these reactor designs). Anaerobic SWMfacilities typically have 30 to 60 day detention times. In some facilities, aerobic slurry treatmentprovides a front end feature of some MSW facilities, where the aerobic subsystem serves to improvethermal sterilization of pathogens, remove volatile solids, and reduce odor.
While solid-phase, in-vessel composting is offered by some vendors for small-scale operations (e.g.Green Mountain Technology’s static Earth Tub and Texas A&M’s and Spectraserv Inc.’s rotatingdrums), small-scale liquid phase (slurry) composting systems appear currently unavailable.
STEP has not concluded a comprehensive cost comparisons among solid-state and slurry in-vesselorganic waste conversion systems. Elements that might be included in such a comparison are landcost, building cost, compost bays or digesters, press wheels, aeration systems, turning equipment orpumping systems, monitoring systems, heating systems and evaporators, cardboard and productpelletizers, bagging, bottling and storage systems, odor control systems, operations and maintenancecosts, and product evaluation and marketing costs. Generic comparisons are illustrated in the tablebelow.
Tabular Comparison of ATAD and Traditional Organic Waste Processing TechnologyATAD Traditional Composting
Productivity (yields) Over 20% product yield on a wetweight basis
N/A
Product quality (note if there arechanges - improvements ordeterioration)
Depleted nitrogen, odorous,fibrous, glass and metal shards
Raw materials required (typesand microbes, nutrients, odor-controlling chemicals, etc.)
pH control, temperature control,polymer bulking
C-N balancing, wood chipbulking, temperature control(turning)
Utility requirements (water,steam, electric power,transportation costs)
Hauling, heat, air flow, fluidmixing-pumping, building utilities,packaging, shipping
Hauling, mechanical turning, bulkshipping
Wastewater, solid waste, and airemission
Air quality control, water qualitycontrol, odor control
Leachate control, odor control,vermin control
Improved rinse efficiency Discharge of 680 liter per ton ofclean condensate, no disposalcharges
N/A
Volume of waste sent to offsiterecycling
Removal of up to 20 % non-processable debris from thefeedstock, requires a presortedfeedstock compliant to QA/QCmanagement
Limited removal dependent uponfeedstock source(accommodates many feedstocktypes, but must balance carbonand nitrogen to process)
Odor control Continuous and complete control Episodic control, season issues
COST INFORMATION
STEP Green Book Technology Summary Page 30 of 42 Date printed May 24, 2000
Capital Costs
Representative costs of different types of ATAD facilities have limited application where such facilitiesmust process different types of incoming organic material and where such facilities operate at radicallydifferent throughput scales. For purposes of forecasting key costs related to ATAD systems, the tablebelow compares key capital costs categories. While waste processing and fertilizer manufacturingfacilities can be expected to have distinct operating constraints and cost factors, they clearly share theneed to basic enabling components and sub-systems.
ATAD System Component ComparisonComponent Number Vancouver System 2 cost
IBRC ThiemeATAD digesters N/A Yes (capped, steel) Yes (concrete)Aerators N/A Yes YesFoam cutters Yes N/APiping Yes YesElectronic controls Yes YesExhaust blower Yes YesAeration blower Yes YesFeedstock transfer pump Yes YesThickening tank No NoConcrete slab for reactors No YesBiofilter Yes --Total Start Up Costs $ ----------------- --Total Annual Costs/100 tons $ 850,000 N/A
Operating Costs
The following cost item estimates apply to a 240 tonne facility (in Canadian dollars):
� Labor including training and license requirements for supervisors and operators (using fully burdened rates) isestimated at $120,000 / month
� Utilities and special provisions (e.g., electricity, fuel, steam, water, air, space requirements, fire protection,safety requirements, onsite laboratory requirements) are estimated at $54,000 / month
� Maintenance costs is estimated at $15,000 / month� Waste disposal (landfill) expense is estimated at $15,000 / month� Materials (lime, polymer, miscellaneous plant supplies) costs are estimated at $ 11,000 /month� Laboratory costs are estimated at $1,200 / month� Depreciation charges vary from 3 to 20 year amortization schedules, with a nominal 20%� Water and sewer expenses is estimated at $6,000 / month
The operating cost data for the Uxbridge manufacturing facility is a proprietary aspect of their businessplan and is beyond the scope of this document. Costs will reflect local costs for labor, utilities,construction, and financing. For this reason, costs associated with the application of the technologyunder review by STEP cannot be reported in a generic form. For a more complete explanation of thelimitations on projecting costs for this technology, see the section on “Economic Model.”
COST INFORMATION
STEP Green Book Technology Summary Page 31 of 42 Date printed May 24, 2000
Cost Benchmarks
This section is intended to provide details regarding cost benchmarks that illustrate benefits derivedfrom the application of ATAD technology to the fertilizer manufacturing process, specifically in terms ofthe costs benefits for receiving and processing organic waste feedstock and cost benefits for sale ofpremium fertilizer for consumer markets and for chemical fertilizer manufacturing markets.
Current market data indicates a nominal waste producer cost of $ 60 per wet ton for hauling anddisposal of organic waste within the Commonwealth of Massachusetts, with a range from $45 forsource separated produce waste processed at a composting facility up to $100 for wastes frommanufacturing facilities. STEP has confirmed the pressing and enduring need for organic wastedisposal, and specific pressing needs for improved disposal options for fats, oils and greases.
The estimated manufacturing costs to collect and haul food processing type waste to an ATAD fertilizermanufacturing facility should be based on a cost per hour. This approach takes into account thedisparity among points of supply that have varied access to interstate highways. Total costs to truckare in the range of $60 to $75 per hour. This range accounts for the differences in labor rates, thecapital costs of specialty equipment, and fuel consumption variables. The variable costs to operateshould be about $35 to $45 per hour. The estimated unit cost per ton to supply the manufacturingfacility will range from a high of $30 per ton to a low of $5 per ton. This estimate is based on minimumloads of five tons and maximum loads of fifteen tons with likely haul radius not exceeding 50 miles.Furthermore, no unusual loading or unloading characteristics have been considered.
Market trend data for retail value of compost is strongly dependent upon the quality, and perceivedquality, of the specific compost product. Private and commercial organic gardeners may best representcurrent market demand for premium grade compost. Such a market may pay $ 20 per 40-pound bag ofdry product, however, volume discounts are to be expected for large commercial purchases. At thistime, the largest recognized existing commercial market for premium grade compost is the nurseryfertilizer industry. Fertilizer manufactures familiar with the IBR product appear willing to spend upwardto $ 200 per ton for premium grade product that is compatible with their current product blendingsystems.
ATAD facility benchmarks are illustrated in the table shown below. The initial three entrees representmunicipal ATAD wastewater treatment plants (in 1990 dollars from EPA /625/10-90/007, September,1990), while the fourth entrees represents the only known precedent application of ATAD for fertilizerand/or animal feed filler manufacturing (in 1999 dollars). Benchmarking considers only the primarybusiness objective of providing a product treatment service without reference to costs for producing acommercial sellable product as a secondary business objective.
Year built1990 dollar cost(construction)
Throughput(kg dryweight/d)
1999 RetailPrice ($/kg)
1990 TreatmentCost ($/kg)
Nettetal, FRG1 1983 330,000 2540 NA 130Fassberg, FRG1 1981 318,000 1600 NA 199Romersberg, FRG1 1984 321,000 900 NA 357Uxbridge, MA planned ~ $9,500,000 800 ~ $1 ~ $ 0.07 *Note1 Data taken from EPA /625/10-90/007, September 1990.Note2 Re-calculated from confidential 1999 IBR data based upon a zero product sales assumption (a 240 long tonnes
capacity requires $441K in fixed and variable operating costs [exclusive of royalties, fees, capital and depreciation]per month yields a calculated unit processing cost of $441,000/243,854 kg wet weight, or $1.80/kg, in 1999 dollars).
COST INFORMATION
STEP Green Book Technology Summary Page 32 of 42 Date printed May 24, 2000
Note* 1999 US Dollars. STEP understands that the cost structure for the use of ATAD for food scrap re-manufacturing isradically different from the cost structure for waste water treatment principally because waste waters arrive attreatment facilities with a nominal 2% to 3% solids content, and must be concentrated to a 6% to 8% content beforeATAD can become self-sustaining. Typically, the pre-treatment times required to bring waste water organic contentup to operating levels extends the overall treatment cycle to 10 to 12 days of processing.
Economic Model
The limitations of cost comparisons between sites of potential application are best understood byconsidering the economic model upon which the ATAD manufacturing business is based. Thecommercial opportunity for ATAD re-manufacturing of food wastes is driven primarily by
1. rising costs for hauling and disposing organic waste,2. continued closing of landfill disposal sites to organic waste, and3. requirements for nuisance-free waste management technologies in urban settings.
Food scrap waste management options (which, in an economic model, include re-manufacturingtechnologies) are driven both by issues of the scale of the disposal operation and the requirements ofindividual operating sites. Any capital-intensive disposal (or re-manufacturing) operation must considerthe persistence of its supply of feedstock (so that the facility can maintain a year-round operating cycle)and the expense related to getting the feedstock to the operating site. Continuity of the supply of foodscrap is dependent primarily upon population and the distribution of population across any specificservice area. An assumption must be made that an existing supply of food scrap remains available forthe disposal facility (this is analogous to any business making a forecast of the amount of market shareit can capture). At this moment, the relatively few recognized and practical options for food scrapdisposal within urban reaches of the Commonwealth favors the consideration of innovative disposal (re-manufacturing) technologies. With regard to the proposed operation in Uxbridge, the ATADmanufacturing facility currently stands to capture a dominant share of the available food scrap fromwithin its hauling region. The hauling region for any disposal operation is largely defined byexpectations to capture AND RETAIN a sufficient volume of feedstock to efficiently use whatevercapital assets are installed in the manufacturing facility. The reasoning is, of necessity, a bit cyclic.The objective is to balance the equation to reach a desired cost structure (while remaining within otherdesign parameters). The Uxbridge facility has been designed to operate at a nominal processing costof less than $ 32 per ton of food scrap slurry with 10% solid content (exclusive of equity and financingcosts) under safe and nuisance-free conditions. Precise details about capital expenses for startup anddetails about financing arrangements are proprietary aspects of Bio-Dynamics’ business plan, and areexpected to be rigorously reviewed by prospective investors. If new, alternative food waste disposal (orre-manufacturing) technologies emerge within the specified hauling region, the Uxbridge facility may ormay not be able to capture sufficient market share to sustain its operations (on the basis of disposalfees alone). The scale of the facility design represents a forecast of available feedstock, and failing tocapture and retain this feedstock represents the principal business risk.
The Uxbridge food scrap re-manufacturing facility (the fertilizer manufacturing facility) is hedging itsbusiness risk because it has a second revenue stream in the form of sales of its end product (for whichthere will also be marketing costs). At this time, revenue forecasts from the sale of end product have(in STEP’s view) been conservative. The Uxbridge facility is scaled to serve a hauling area sufficient togenerate enough revenue to operate at a profit solely on the basis of fees charged to receive foodscrap waste. For this reason, if the market for end product collapses, fails to develop, or under-performs, the core operations of the facility are not threatened. The business model of the Uxbridgefacility is, however, threatened if food waste disposal practices change in a way that makes shipping
COST INFORMATION
STEP Green Book Technology Summary Page 33 of 42 Date printed May 24, 2000
the food waste to the re-manufacturing site economically unattractive. If, on the other hand, economicconditions increased the appeal of shipping food waste to the re-manufacturing site, the profitability ofthe venture would improve.
There is limited capacity (estimated at no more than 50%) for expansion of operations beyond thosespecified by the current facility design. Because of physical limits of the Uxbridge site, costs related totransportation, and limits set by regulatory permits, proponents of ATAD manufacturing of food wasteswould need to seek to capture opportunities created by any substantial increase in regional demand forits disposal service by replicating its Uxbridge facility at additional sites (where hauling costs can beminimized). STEP is not offering a view of the attractiveness of the business venture from an investorperspective (there are considerably different risks associated with such a consideration). Rather STEPis offering a view of the expected stability of the proposed Uxbridge operation in the context ofreasonably anticipated business risks. The proposed Uxbridge facility appears to face business riskstypical of many manufacturing operations dependent upon bulk transport of critical feedstock. This risk,however, is mitigated by the fact that some comparable form of (disposal/re-manufacturing) activityMUST be made available to businesses across the Commonwealth.
REGULATORY/SAFETY REQUIREMENTS
STEP Green Book Technology Summary Page 34 of 42 Date printed May 24, 2000
Anticipated Regulatory Requirements
Solid Waste Management
This section presents an overview of the Solid Waste Management regulatory process, andsummarizes some procedural and technical requirements. Solid Waste Management facilities in theCommonwealth of Massachusetts are regulated under the provisions of the Massachusetts GeneralLaws (MGL) Chapter 111, Section 150A, and the regulations promulgated thereunder at 310 CMR16.00 “Site Assignment Regulations for Solid Waste Facilities” (Site Regulations), and 310 CMR 19.000“Solid Waste Management Facility Regulations” (Facility Regulations). The Site Regulations pertain tothe process for deciding whether a parcel of land is suitable to serve as a site for a solid wastemanagement facility. The Facility Regulations on the other hand are intended to comprehensivelyregulate the storage, transfer, processing, treatment, disposal, use and reuse of solid waste inMassachusetts.
The Applicability section (310 CMR 16.05) within the Site Regulations considers the range ofoperations involved in the handling or disposal of various types of waste, and the processing ofreusable material, in order to determine which type of activity is subject to site assignment as a solidwaste facility. In addition, this section also provides the requirements for certain types of recycling,composting, and other operations and activities that are either categorically exempt or conditionallyexempt from these regulations, and therefore do not require site assignment.
Certain other recycling and composting operations which do not fall under the categorical exemption orconditional exemption would be subject to “Determination of Need for Site Assignment” (DON) Processunder section 16.05(6). The DON review process has been established for facilities handling sourceseparated materials, but having a wider range of accepted materials and potential site locations. Inthese cases, the proponent will have to apply to the Department for a decision on whether or not a siteassignment is necessary. Composting of unprocessed meat and fish wastes, and sewage sludge arenot eligible to apply for DON.
The criteria by which the DON decision is made include, but are not limited to:
� Whether the material is pre-sorted, is not mixed with solid waste and is not contaminated� Whether the material meets the definition of a recyclable or compostable material� Whether the material can feasibly be processed and recycled under the proposal� The maximum amount of residue allowed from processing the material is also regulated to ensure that excess
solid waste is not being accepted� Materials are handled in a manner which will not cause nuisance conditions, and will ensure protection of
public health and safety, and the environment� The end product material is marketed for reuse and not disposed
Based on the information reviewed in this document (and specifically with reference to using presortedfood waste with less than 15% other residue in the feedstock and excluding sewage residuals), theMassachusetts Department of Environmental Protection believes that the proposed AutothermalThermophilic Aerobic Digestion (ATAD) process technology would fall under the DON review processunder 310 CMR 16.05(6). In the past, the Department issued a DON for a facility using similartechnology. A final determination of applicability will be made when the proponent submits permitapplications. The DON review process requires that the proponent submit a DON Permit Application(BWP SW 02) to the Department for review and approval, and a copy to the local Board of Health.
REGULATORY/SAFETY REQUIREMENTS
STEP Green Book Technology Summary Page 35 of 42 Date printed May 24, 2000
If the proposed project receives the DON approval from the Massachusetts Department ofEnvironmental Protection, then the MEPA process, as it relates to the Review Thresholds for SolidWaste Management facilities would not apply to this project. Therefore, the project proponent wouldnot be required to apply to MEPA for either an ENF or EIR, as far as Solid Waste MEPA reviewthresholds are concerned. The new MEPA Regulations (dated July 1, 1998) state in part: “NewCapacity for storage processing (would require an ENF or EIR) unless the Project is exempt from siteassignment requirements.” However, other MEPA Review Thresholds may still apply to this project.
The residue generated from the operations of the proposed facility would be considered solid wasteand/or “residuals”, and can either be disposed off in any DEP approved solid waste landfill or aresiduals landfill.
MEPA Review
The Massachusetts Environmental Policy Act (MEPA), MGL Chapter 30, Sections 61-62H, isadministered by the Secretary of the Executive Office of Environmental Affairs (EOEA), and by theMEPA Unit within EOEA. The regulations implementing MEPA are promulgated at 301 CMR 11.00. Abrief overview of how the MEPA process interacts with the Department’s Solid Waste ManagementRegulations is presented below.
The purpose of the MEPA process is to examine the environmental impacts of a project, look at theimpacts of alternatives to the project, and provide the public and interested organizations an opportunityto comment on the proposed project. The MEPA process applies to all activities requiring permits fromagencies of the Commonwealth. One permit application to which the MEPA process does not apply isthe application for a Determination of Need (DON) for Site Assignment provided for in 310 CMR 16.05.
The MEPA regulations contain certain threshold levels related to the size of various types of projects. Ifthe project is below the threshold level, the project does not have to go through the MEPA reviewprocess. The MEPA review thresholds for various different types of projects can be found at 301 CMR11.03, and specifically the review thresholds for Solid and Hazardous Waste projects can be found at301 CMR 11.03(9).
The Solid and Hazardous Waste review threshold in part states, “New Capacity… for storage…processing … (would require an ENF or EIR) unless the Project is exempt from site assignmentrequirements”. The proposed project, if permitted under the DON provisions of the Solid Waste SiteAssignment Regulations, would not be required to apply to MEPA for either an ENF or EIR. The projectas proposed here does not trip MEPA review thresholds for air or water issues.
Air Quality Control
The proposed ATAD process will have the potential to produce emissions of air contaminants, fallinginto two main categories: (1) process emissions; and (2) fuel burning equipment emissions. Bothcategories of emissions are subject to regulation under the Massachusetts Air Pollution ControlRegulations, 310 CMR 7.00. The particular requirements for each category are discussed below.
1. Process Emissions
Waste handling and treating processes like the ATAD have the potential to generate significantemissions of the air contaminants dust, odor and noise. Therefore the DEP has the authority to requirethat the proponent file an application for approval to construct under 310 CMR 7.02 prior to
REGULATORY/SAFETY REQUIREMENTS
STEP Green Book Technology Summary Page 36 of 42 Date printed May 24, 2000
commencement of construction and operation. In order to obtain the 7.02 approval, the proponentmust demonstrate that the process has been well designed to minimize the formation of the aircontaminants, and that the contaminants that are generated are reduced by the application of BestAvailable Control Technology (BACT).
Generation of dust emissions (also called particulate matter) is minimized by keeping trucks androadways clean and free of spilled waste, and by ensuring that any dust generated inside the buildingwill be directed to an effective dust control device before being exhausted. The systems intended forodor control often also control dust emissions; this should also be the case for this process.
Generation of odors is minimized by the following: control of the incoming feedstock; propermanagement of raw materials stored indoors; effective periodic building and equipment cleaning; andproper process control. In order to capture any odors that are generated, the processing building willneed to be kept under negative pressure by the exhaust ventilation system. For control (destruction) ofthe odors in the exhaust, the proposed biofilter should be effective if it is properly designed,constructed, operated and maintained. Department policy requires that the proponent mustdemonstrate that the total odor control system will be sufficient to prevent the causing of nuisanceodors off the proponent’s property.
Generation of noise is minimized by the following: selecting inherently low-noise motors and fans;keeping doors and windows closed; placing noise-generating equipment in locations far away fromsensitive receptors; and putting noise-reducing insulation and enclosures around noise sources asnecessary. As with odor, Department policy requires that the applicant demonstrate that the noise fromthe facility will not cause a nuisance off property.
2. Fuel Burning Equipment Emissions
This facility will require various fuel burning equipment such as dryers, boilers, space heaters, etc. The310 CMR 7.02 establishes size cutoffs for fuel utilization facilities; if the rated heat inputs of theequipment exceeds the size cutoffs, then the proponent will be required to file plans and obtainapproval for the equipment under this regulation. In general the fuel utilization facilities must meet allapplicable standards for emissions of criteria air pollutants (particulate matter, carbon monoxide, sulfurdioxide, and nitrogen oxides). It is anticipated that the types of fuel burning equipment ancillary to theATAD process will be able to meet all applicable standards by inherently low-emission combustiondesign and by the burning of clean fuels, without the need for add-on exhaust treatment systems.
Water Pollution Control
The disposal of wastewater in the Commonwealth is regulated under the provisions of the State CleanWaters Act (MGL, Chapter 21, Sections 26-53) and regulations promulgated by the Department ofEnvironmental Protection thereunder at 314 CMR. The wastewater from a commercial pelletizingoperation would be classified by Department regulations as an industrial wastewater, and its disposal toa municipal sewer system would require a sewer connection permit from the Department pursuant to314 CMR 7.00. The sewer connection would also be subject to local sewer ordinances and to anyindustrial wastewater pretreatment requirements imposed by either local requirements or by the stateand federal requirements stipulated in the terms of the discharge permit issued to the municipality.
Should the fertilizer pellets produced from this operation contain any sanitary sewage or septage, thein-state disposal of these pellets would be subject to Department regulations governing land applicationof sludge and septage (310 CMR 32.00). As such, the pellets must first be classified by the
REGULATORY/SAFETY REQUIREMENTS
STEP Green Book Technology Summary Page 37 of 42 Date printed May 24, 2000
Department pursuant to section 32.10. Materials classified as Type I may be sold or used in theCommonwealth without further approval from the Department. The sale or use of materials classifiedas Type II would require prior approval from the Department. The sale or use of materials classifiedType III would require individual site approval by the Department and the use of these materialsrecorded in the registry of deeds in the chain of title for such site.
The Clean Water Act regulations require that any leachate produced in the facility be handled anddisposed of properly.
Health/Safety Issues
Safety issues associated with the use of ATAD technology in a food waste to fertilizer manufacturingfacility include:
� Aerobic digestion does not produce methane gas, and therefor reduces worker exposure to risks from toxicgas and explosion.
� ATAD is recognized to be a simple and robust process, and training requirements are not identified assignificant management issues.
� Spills, if they do occur, do not present a specific hazard due to temperature or caustic exposure. Chemicalstocks used to adjust pH represent a source of worker risk, however, this type of risk is a standard aspect ofmunicipal solid waste management.
� The relatively low level of staff required to operate an ATAD system, and the relatively low O & M demand ofthe ATAD system reduce the amount of worker hours spent at risk per ton of feedstock processed intoproduct.
� End-product generated through the IBR ATAD process is judged to be safe, based on a comparison oftime/temperature conditions achieved by the process with those required by federal regulations (40 CFR Part257) for land-applied residuals from wastewater treatment operations. Note that the IBR ATAD process asproposed for this site will not include residuals processing; this information is presented for comparisonpurposes only. The regulations list acceptable treatment technologies and divide them into two categoriesbased on the level of pathogen control they can achieve: processes to further reduce pathogens (PFRPs) andprocesses to significantly reduce pathogens (PSRPs). Criteria for the more stringent of these twoclassifications, PFRPs, is met when feedstock is “maintained for at least 30 minutes at a minimumtemperature of 70C” (reference: 40 CFR 257, Appendix II; EPA/625/10-90/007, page 32). This treatment isdesignated as “pasteurization.” Criteria for PSRPs is met by maintaining operating conditions of 55C for 4hours were temperatures are otherwise held above 40oC for 5 days. The ATAD process examined in thisdesign review typically reports operating conditions above 70C for 50 to 60 hours, easily qualifying for themore stringent treatment classification as a PFRP technology. Paradoxically, total residence time for materialtreated with this technology (less than 5 days) does not comply with current criteria for the less stringenttreatment classification, PSRP. In other ATAD applications, ATAD has been shown to meet “criteria for PFRPequivalency and the proposed Class A Group 1 (503) standards” for land-application uses (ibid., page 34).The IBR process additionally involves heat-treating end product at more than 100oC for at least 10 minutes(with an average of 15 minutes and an upper end of 30 minutes). Finished products contain survivingthermophilic microbes such as are found in typical soil samples. Examinations conducted in this technologyreview have found no evidence for potential human or animal health risks or agricultural risks fromthermophilic bacteria in land use applications.
LESSONS LEARNED/IMPLEMENTATION ISSUES
STEP Green Book Technology Summary Page 38 of 42 Date printed May 24, 2000
The case study provided in this document is based on a technology applied at a specific site. Lessonslearned in both design and operations areas derived from information provided by the technologyvendor and the user at that site include:
Design Issues
Due to the corrosive and abrasive nature of organic slurries, care should be taken that proper materialsare used in the process; i.e., all wetted parts to be 3/16 stainless steel; all ware parts Ni-Cd. Due to thenature of deliveries of municipal and organic wastes, no down time of a plant can be tolerated.Therefore, ALL equipment has back up so that ANY piece of equipment or feed or discharge line maybe shut down or disconnected while the plant will keep operating to its full capacity. This safety factorcontributes to 25% of the total cost.
Maintenance of plant and capital allowance set aside for replacement should be conducted in such amanner that the plant has an indefinite life span.
Biofilter design should include provisions for expansion in the event expansions become necessary.Provisions for odor-free managing of any potential leachate from biofilter should be incorporated withinthe design.
Implementation Considerations
Based on experience with this technology application, lessons learned relative to future implementationof the technology are listed here. Such items may include:
Labor Related:
� Operating staff familiar with the mechanical trades will require no special training to operate equipment withinthe facility. Managing an ATAD fertilizer manufacturing facility makes use of operating skills common in watertreatment operations. Bio-Dynamics has indicated to STEP that its Uxbridge facility will be managed by theRoy F. Weston, Corporation, a firm with specific strengths in areas of waste processing systems. This firmhas designed, constructed, and operated treatment facilities at several sites within the Commonwealth (e.g.the 100,000-gallon per day Taunton municipal Septage Treatment Facility and the New Bedford Army Corpsof Engineers wastewater treatment plant). The manager overseeing R.F. Weston’s management of theUxbridge facility is (as of this time) Mr. Greg Miller. Mr. Miller has over 25 years of experience in thewastewater field, including plant operations, management, maintenance, and regulatory interaction, and Mr.Miller has been past President of the New York Water Environment Association. His operational experienceincludes management roles at wastewater treatment facilities in Wilmington, DE, in Danbury, CT, inWilliamsburg, VA, in Kent County, DE, and in the towns of Albany, Colonie, and Guilderland, NY. He carriesa Grade 4A wastewater Treatment Operator Certification. STEP feels Mr. Miller possesses the essentialskills needed to implement and oversee day to day operations of the proposed Uxbridge ATAD facility, andthat Roy F. Weston Corporation has the large scale system track record sufficient to suggest that they willmanage this facility appropriately.
Maintenance Related:
� Maintenance schedules apply specifically to pumps and mixing equipment, and should include provisions forsome on-site oxyacetylene welding. Safety training with respect to handling of caustic reagents isrecommended.
� Back-up systems are needed to assure continuity of fluid flow. Spare aerators and mixers are needed toassure continuity of processing operations. Bio-Dynamics has assured STEP that their operations planincludes pre-negotiated agreements with two (2) regional composting entities to accept large volumes of
LESSONS LEARNED/IMPLEMENTATION ISSUES
STEP Green Book Technology Summary Page 39 of 42 Date printed May 24, 2000
partially digested product on short notice in the event of any potential catastrophic failure of theirmanufacturing facility. Through contract with haulers, Biol-Dynamics additionally assures STEP that they willretain sufficient provisions to collect and transfer partially digested product in a timely fashion should suchaction be required.
Implementation Related:
� No seasonal disruptions in operation are expected.� Facilities can receive incoming feedstock at hours of the days that accommodate hauler and citizen schedules
(rush hour traffic shipments can be avoided)� Operations can be conducted in a batch or a semi-continuous mode by mixing incoming feedstock into
digesters containing a fraction of processed slurry. Residence time varies such that a processing endpoint isreached. This processing endpoint consists of an inflection in the heat production kinetics of the microbialmass, and signals a shift in the type of nutrient being consumed within the reactor.
� No specific provisions have been reported for disposal of replaced equipment.� The management team has 6 years of operating experience with the ATAD technology, the facility design,
and supply chain management. The management team has contributed significant innovation (as indexed bypatents awarded to the management team) for equipment and processes related to manufacturing fertilizerfrom waste food products.
� The management team has secured letters of intent from regional haulers planning to serve the Uxbridgefacility, and have established themselves as credible contractors throughout the state.
Product Related:
� Bio-Dynamics has indicated to STEP their intentions to work with soil and agriculture staff of the University ofMassachusetts System in study programs to assess and to confirm features of merit in their manufacturedproduct. This intention is interpreted by STEP to represent a deep and sincere commitment by Bio-Dynamicsto be a collaborative participant in agricultural practice improvement in the Commonwealth.
Management Related:
� The BioDynamics limited liability corporation will be chaired by Mr. James M. Coull, of Concord, MA who, as ageneral manager, will oversee contracts with facility management and collection system managementorganizations. Mr. Coull has 36 years of design/build experience, and is the chairman of the board of adesign/build construction company that specializes in food processing and other process industries. Hisfirm’s projects include a major facility for processing shrimp in Ayre, MA. Mr. Coull currently sits as ViceChairman for the Massachusetts Port Authority (MASSPort) with statutory responsibility for safeguardingenvironmental and construction interests overseen by that organization.
Benefits Derived From Application
This section will present a list of issues that were identified by the technology user as benefits as aresult of installation and implementation of this technology.
Household gardeners and organic agricultural operations are receptive to low cost, high quality, carbon-rich soil amendments. Compost is promoted by the EPA as an environmentally preferred fertilizer(reducing the need both for herbicides and insecticides), and a growing health conscious publiccontinues to expand demand for “safe” lawn and garden products and for foods and herbs produced onorganic farms. Markets for food scrap compost can reasonably be expected to expand.
Food processing facilities (i.e. restaurants) are receptive to systems that will improve the efficiency, andreduce the cost, of managing food scrap waste. Due to consolidation in the waste hauling industry,haulers have increasing power to insist that waste generators comply with some segregation of waste
LESSONS LEARNED/IMPLEMENTATION ISSUES
STEP Green Book Technology Summary Page 40 of 42 Date printed May 24, 2000
types at their source. Quality Control over the composition of food stream wastes can be reasonablyassured through cooperation of haulers.
Limitations in Application
This section will present key issues that were identified by the manufacturer as limitations to the user asa result of installation and implementation of this technology.
The Capital and Operating costs (including the feedstock supply management costs) of an ATADfertilizer manufacturing facility may not compete favorable in locations where vermin and odor control isnot a significant social factor, where conventional composting sites are available at low cost, and whereeasily accessed supply generators and end product markets are not seeking fertilizer with high-enduser features. These conditions may apply to selected rural sites in highly agricultural districts.
PUBLISHED REFERENCES
STEP Green Book Technology Summary Page 41 of 42 Date printed May 24, 2000
This section contains cited source materials, specifically as related to third party validation studies,regulatory agency findings, or economic forecasts for emerging markets.
1. Biosolids Generation, Use, and Disposal in the United States, EPA530-R-99-009 September 1999
2. Contained Composting Systems Review. Robert Rynk, 2000. BioCycle 41(3): 30-35.
3. Environmental Regulations and Technology: Autothermal Thermophilic Aerobic digestion of MunicipalWastewater Sludge. US EPA Risk Reduction Engineering Laboratory (RREL) and Center for EnvironmentalResearch Information (CERI), Cincinnati, OH. September 1990. 65 pages. EPA/625/10-90/007
4. http://www.epa.gov/epaoswer/non-hw/compost/
5. Initial Public Offering, Final Prospectus, International Bio Recovery Corporation, September 30, 1998, Brink,Hudson & Lefever, Ltd. 1200-595 Burrard Street, Vancouver, BC V7X 1J1.
6. Innovative Uses of Compost: Bioremediation and Pollution Prevention, EPA530-F-97-042, October 1997
7. Innovative Uses of Compost: Disease Control For Plants and Animals, EPA530-F-97-044, October 1997
8. Innovative Uses of Compost: Erosion Control, Turf Remediation, and Landscaping, EPA 530-F-97-043,October 1997
9. Innovative Uses of Compost: Reforestation, Wetlands Restoration, and Habitat Revitalization, EPA 530-F-97-046, October 1997
10. Solid Waste and Emergency Response (5306W). EPA 530-R-99-016 July 1999
11. Solid Waste and Emergency Response (5305) EPA report # EPA 530-R-97-015, prepared by The FranklinAssociates, Ltd. on February of 1994
12. Stover, Enos L., 2000. Some like it hot: thermophilic treatment process in an effective alternative tomesophilic treatment for high-strength industrial waste residuals. Industrial Wastewater 405 (1212): pg 31-34.
13. Tchobanoglous, G. and Burton, F.L., 1998. Wastewater Engineering: Treatment, Disposal and Reuse. Thirdedition. McGrall-Hill Publishing Company, New York, NY.
14. Water Prevention, Recycling, and Composting Options: Lessons from 30 Communities
APPENDIX A. LETTER OF ASSERTION FROM TECHNOLOGY PROPONENTS
STEP Green Book Technology Summary Page 42 of 42 Date printed May 24, 2000