THE STRUCTURE OF INCENTIVES IN SUDAN'S RAINFED AGRICULTURAL SECTOR Curtis E. Youngblood David L. Franklin Alberto Vald6s Sigma One Corporation February 198 1101 Oberlin Road Raleigh, North Carolina 27609
Transcript
THE STRUCTURE OF INCENTIVES IN SUDANS
RAINFED AGRICULTURAL SECTOR
Curtis E Youngblood David L Franklin Alberto Vald6s
Sigma One Corporation February 198 1101 Oberlin Road Raleigh North Carolina 27609
EXECUTIVE SUMMARY
The purpose of this report is to examine the structure of incentives facshying Sudanese agriculture in particular the rainfed sector in the North The analysis estimates how recent and possible future policy changes may affect agricultural productivity and their potential for improving the performance of the ecooomy The report also considers specific activities which may b3 supshyported by the US Agency for International Developrent in assisting the government of Sudan in its efforts to increase the rainfed secturs contribushytion to economic growth export earnings and improved producer incomes
Since the rainfed sector is primarily in private hands these activities can best be implemented through policy initiat ives that enhance the structure of incentives to the private sector and through selected public sector initiashytives such as accelerated investments in agricultural research and extension and enhancements to the agricultural marketing system (includiiig road and rail transport) Recent experience in sorghum production and marketing indicates that private rainfed agriculture has the potential and ability to respond to improved incentives
Working with secondary data sources the report presents an overview of the agricultural sector in the last ten years and analyses of the tax systemexchange rate policies agricultural pricing and marketing and governmentintervention and their implications for relative efficiency These analyses are presented in tle context of the macro economic situatior specifically trade money supply and fiscal deficits
The output Df the rainfed sector increased throughout the 1970s through an expansion in cropped areas By coritraEt output from the irrigated sector declined because there was no growth in cropped areas and yields were declinshying or stagnant Even though most public sector investment was directed towards the irrigated sector the structure of incentives was such that these resources were effectively taxed away On the other hand the disinceitives facing the rainfed sector were not as severe and producers were more responshysive to private market mechanisms
Recer~t policy initiatives have eliminated some of the distortions in the structure of incentives Export duties on several agricultural commodities have been removed The exchange rate poundytem was recently unified and devalued thereby bringing the price of fireign exchange closer to its true value This removed an implicit subsidy on imports of wheat flour sugarpetroleum agrochemicals and spare parts it raised the prices received bydomestic producers for exports of their output this may not elicit a largeincrease in the output from the rainfed sector since its commodities have been traded at the trLe price of foreign exchange since September 1980 Explicit subsidies on petroleum wheat and sugar are being phased out with consequent Treasury savings of $50 to $60 million per year The recent bumper crop of sorghum depressed world prices for wheat and sugar and United States wheat imports under the PL 480 Title III program should dampen the cost of living and nutritional impacts caused by the removal of the implicit and explicit subsidies
Much remains to be done Low land rents and subsidized credit haveresulted in undercapitalization of the rainFed sector The tax system lacksbuoyancy and progressivity increased agricultural research and more imporshytantly an effective extension service are needed to increase productivityTechnical and economic inefficiencies in the marketing system must be elimishynated Policy initiatives in these areas will significantly imprcve the structure of incentives facing rainfed agriculture thereby realizing some of the potential of this sector and ameliorating the problems in Sudans domestic economy and its foreign trade position
ACKNOWLEDGEMENTS
Several people made valuable contributions of their time and resources to
this study Siddig Salih a graduate student in economics at Duke University
provided data and useful comments on agricultural pricing and marketing In
the Ministry of National Planning Dr E A A Zaki commented on an earlier
draft of this report and gave us a draft of his article on the Sudanese
economy which will be published in the Sudanow Yearbook El Fatih Obeidallah
Taha obtained important information on producer prices for Thurvald Moeus
of the World Bank provided information on transport costs and discussed other
aspects of Sudanese agriculture with us Marielouise Harrell on the staff of
Sigma One Corporation was responsible for the computer plots of the figures
and helped prepare an earlier draft of this report Finally we would like to
thank Evelynne Rasl and Jacquelyn Epperson who cheerfully labored long hours
typing and retyping the report
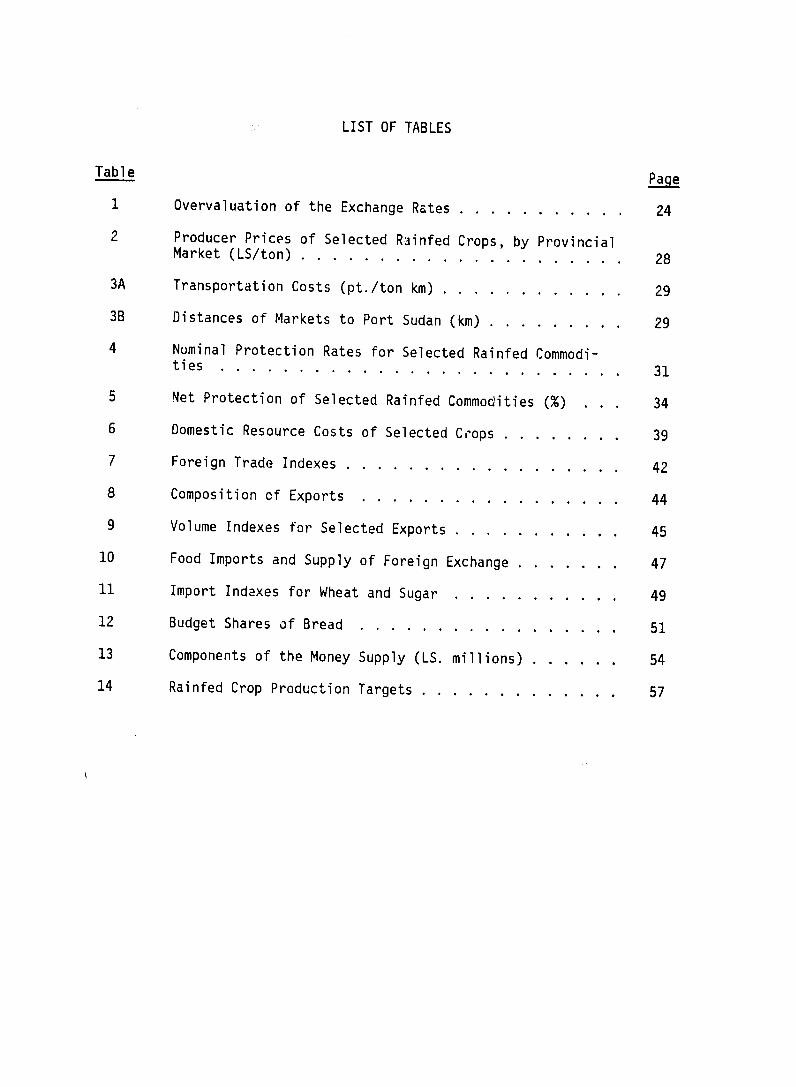
TABLE OF CONTENTS
Section Page
INTRODUCTION 1
11 Purpose 2 12 Setting 3
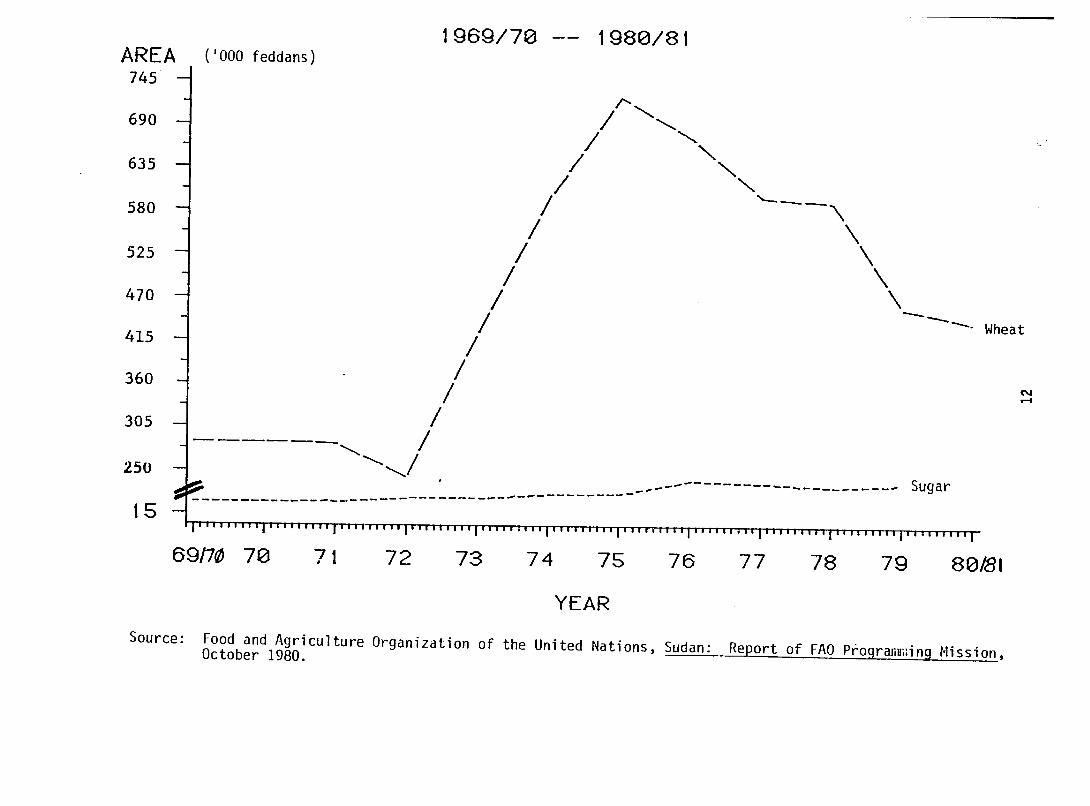
2 RECENT PERFORMANCE OF THE AGRICULTURAL SECTOR 5
21 Export Crops 6 22 Import-substitute Crops 11 23 Millet The Nontraded Good 14
3 THE STRUCTURE OF INCENTIVES 18
31 The Tax System 19
311 Exports 19 312 Imports 20 313 Taxes on Domestic Production 21
32 The Exchange Rate System 21
321 Exchange Rate History 22 322 Overvaluation of the Exchange Rate 23
33 Pricing and Marketing of Selected Rainfed Crops 26
331 Nominal Protection Rates 26
332 Net Protection Rates for Selected Rainfed Crops 33
34 Subsidies in the Rainfed Sector 35 35 Comparative Advantage in the Irrigated and Rainfed
Sectors 37
4 IMPACTS OF THE STRUCTURE OF INCENTIVES ON FOREIGN TRADE AND THE DOMESTIC ECONOMY 41
Pre June 0348 0640 839 0400 0640 600 Post June 0400 0640 600 0500 0640 280
1979
Pre September 0400 0731 828 0500 0731 462 Post September 0500 0731 462 0800 0731 -86
1980 0500 0819 638 0800 0819 24
1981 Pre November 0500 - - 0800 - -Post November 0900 - 0900 -
aThe 1972 black market rate from Picks Currency Index (LS0516=$1) was assumed to
be the real exchange rate in that year Real rates for the remaining years were calculated using the consumer price index for Sudan (1975 = 100) CPI S the IBRD world inflation index (1975 100) CPI W1 and the followiig formula
C CPIW i 72
i 72E -E S W where E is the real exchange rateCP172 CPI 1 in year i
E - E
Overvaluation x 100 where E is the nominal exchange rate in year i E 1
24
estimates of the shadow exchange rate because the prices of traded commodities
are included in the Sudanese and world CPIs in the deflator A shadow
exchange rate would reflect price changes in Sudans home (nontraded) goods
relative to price changes in the home goods of its major trading partner for
example the EEC However such indexes were not available so the estimates
of real exchange rates were used as proxies for shadow exchange rates
The results show that exports traded at the official rate were implicitly
taxed at rates between 40 and 80 percent imports brought in at this rate were
subsidized by equivalent amounts Until September 1979 when the parallel rate
was established the amount of overvaluation ranged from 25 to 60 percent
The parallel rate was slightly undervalued (9 percent) but because most comshy
modities were shifted to the official rate at that time the implicit tax
(subsidy) on exports (imports) was over 40 percent During 1980 the parallel
rate was only slightly overvalued Thus trading many commodities at the
parallel rate removed much of the implicit taxation or subsidization
However the tax rate on cotton and the subsidy rate for wheat flour sugar
petroleum and pharmaceuticals climbed to over 60 percent since these
commodities were traded at the official exchange rate Although price indexes
for 1981 are not available the unification and devaluation of the exchange
rates in November 1981 probably brought the nominal exchange rate closer to
the real price of foreign exchange since inflation in Sudan has reportedly
been higher than the world inflation rate Since all of Sudans exports from
the rainfed sector have been traded at close to the real price of foreign
exchange since September 1980 the November 1981 exchange rate regime will not
significantly boost exports from this sector The major impact will tobe
increase the price of petroleum thereby inflating transportation costs
25
33 Pricing and Marketing of Selected Rainfed Crops
In a perfectly competitive economy agricultural producers would receive
100 percent of the world market price net of an efficient marketing margin
for their output Divergences from this ideal are introduced by exchange rate
overvaluations or undervaluations government taxes and subsidies and inshy
flated marketing margins If the net effect of these factors raises producer
prices above world prices positive protection exists and producers are
effectively subsidized by the amount of the difference between world and
domestic prices If the net effect is to depress producer prices relative to
world prices the protection is negative and producers are effectively taxed
by the amount of the price difference The purpose of this section is to
estimate the net protection of dura sesame and groundnuts in three proshy
vincial markets over time and examine the policy implications of the results
The net protection rate is the difference between the nominal protection
rate (NRP) and the amount of exchange rate overvaluation The NRP for a
commodity captures the effects of government taxes and subsidies on the output
of that commodity it is the percentage difference between the domestic
producer price and the world (border) price adjusted to reflect transport and
marketing costs Estimates of the NRPs are presented in Section 331 In
Section 332 these are combined with the effect of the overvalued exchange
rate (Section 322) to arrive at an estimate of the net protection for the
major rainfed crops
331 Nominal Protection Rates
Four markets in three provinces were selected for analysis The Gedaref
market in Kassala (Eastern Sudan) is one of the largest markets for dura and
sesame El Obeid in Northern Kordofan is a major trading center for Western
26
Sudan dura sesame and groundnuts are among the commodities marketed In
the White Nile Province (Central Sudan) Kosti represents a major market for
dura while large quantities of sesame and groundnuts are traded in Tendelti
All four markets are linked by rail to Khartoum and Port Sudan
Producer prices in these markets for the crop years 197576-197879 are
presented in Table 2 There is considerable variation both across markets in
a given year and across time in a given market In general prices are higher
in the western markets than in the central and eastern markets These
variations reflect differences in transportation costs production costs
demand conditions and levels of marketed surpluses The producer prices of
dura in El Fasher (Northern Darfur) which are significantly higher than the
prices in other markets are also presented to support a conclusion that will
be drawn from the analysis of the NRPs below
The cost of transportation from the market to Port Sudan must be netted
out of the border price of each commodity to determine the border price facing
the producer or the export parity price Ideally other marketing costs
such as storage handling and commissions should also be netted out this
information was not available so the marketing margin is not treated in this
analysis Two sets of transprotation costs were estimated one for road
transport by lorries and one for rail transport (see Table 3A) Rail
transport costs were assumed to be 50 percent of road transport costs no
attempt was made to calculate transportation costs by commodity These costs
which are given in piasters per ton kilometer were multiplied by the distance
of each market from Port Sudan (Table 36) and the result was suotracted from
the border prices of the commodities to determine the export parity prices
The percentage difference between the producer and export parity prices of a
commodity is the nominal protection rate for that commodity these are preshy
27
Table 2
Dura
aPort Sudan (FOB)
Gedaref
El Obeid
Kosti
El Fasher
Sesame
aPort Sudan (FOB)
Gedaref
El Obeid
Tendelti
Groundnuts
Port Sudan (FOB)a
El Obeid
Tendelti
Producer Prices of Selected Rainfed Crops by Provincial Market (LSton)
19751976 19761977 19771978 19781979
434 453 540 885
178 277 356 411
461 527 451 1181
224 210 477 412
733 1365 1097 1255
1841 2037 2601 4040
1112 691 1147 1566
1250 1332 816 1409
1205 857 1292 2079
1371 2176 2091 2827
624 973 805 1079
700 546 765 974
Sources Internal Trade Statistics and Price Indices 1978 Department of Statistics Ministry of Planning April 1981
Sudan Foreign Trade Analysis 1970-1979 Department of Statistics Ministry of Planning May 1981
aExport (border) prices FOB Port Sudan in LSton converted at official exchange rate
28
Table 3A Transportation Costs (ptton km)a
RailbRoad
1976 14 07
1977 20 10
1978 30 15
1979 35 18
Sources John F Due Rail and Road Transport in the Sudan Faculty Working Paper No 423 Universityof Illinois at Urbana-Champaign July 1977 Thurvald Moe World Bank
aRates assumed to be the same for all commodities
bAssumed to be one-half the road transport costs
Table 3B Distances of Markets to Port Sudan (km)
Road Rail
Gedaref (Kassala) 852 800
El Obeid (N Kordofan) 1613 1537
Kosti (White Nile) 1512 1217
Tendelti (White Nile) 1624 1313
29
sented in Table 4 Because not all marketing costs could be identified these
estimates understate positive protection and overstate negative protection
Most of the NRPs for dura marketed in Gedaref are negative Nominal
protection tended to increase (the NRPs became less negative) from 197576
through 197778 but decreased sharply in 197879 However NRPs for dura
marketed in El Obeid and Kosti paint a different picture Both NRP estimates
for the El Obeid market show high levels of positive protection those based
on road transport costs range between 120 and 700 percent while those based
on rail transport costs are between 40 and 90 percent The results for dura
traded in Kosti are mixed the NRPs based on road transport costs are conshy
sistently positive (between 1 and 450 percent) while those based on rail
transport costs are negative for all years (around -37 percent) except
197778 Since a positive NRP implies that the producer is receiving more
than the world market price dura from El Obeid and Kosti could not be
competitive on the export market Saudi Arabia has recently been importing
Sudanese dura at a premium above the world price but this does not account
for the positive NRPs in the earlier years Since there were no explicit
subsidies in these two markets the high positive protection rates could
reflect high marketing costs disarticulated regional markets export markets
other than Port Sudan or all three of these
For example El Obeid dura is competitive in the west Prices in the El
Fasher and Nyala markets in the Darfurs (see Table 2) were significantly above
those in other provincial markets reflecting a high demand for Sudanese dura
in Chad and the Central African Republic to alleviate the food shortages in
these countries Political unrest in the Kordofans and Darfurs kept prices
high as people stockpiled food against possible interruptions in supply The
El Obeid market and possibly the Kosti and Tendelti markets as well
30
Table 4 Nominal Protection Rates for Selected Rainfed Commodities ()a
19751976 19761977 19771978 19781979 NRP NRPc NRP b NRP c NRP b NRP NRP br NRPrd rr rrd rr rd rr rd rr
aNominal protection rate (NRP) = (pproducer pborder) - 1 Producer prices are from Table 2 Border prices taken from Table 2 and adjusted for transport costs from market to Port Sudan from Table 3
bNRPs calculated by netting road transport costs out of tie border price CNRPs calculated by netting rail transport costs out of the border price
supplied these needs El Obeid served the same function for Western Sudan and
its neighbors as Port Sudan did for the world market Thus while El Obeid is
not export competitive because of cost barriers between it and Port Sudan it
is competitive in its own region even given the high costs incurred in shipshy
ping dura to markets further west Even if links between El Obeid and
Khartoum and Port Sudan are improved the El Obeid market will probably
continue to supply the western regions rather than becoming a major supplier
of the eastern provinces and the export market
Sesame is heavily taxed in the Gedaref El Obeid and Tendelti markets
Nominal protection in Gedaref decreased from about -35 percent in 197576 to
between -50 to -65 percent from 197677-197879 In El Obeid the NRPs were
between -20 and -30 percent in 197576 and 197677 then sharply decreased to
-60 percent in 197778 and 197879 Nominal protection for sesame marketed in
Tendelti decreased from -30 percent in 197576 between 40to to 50 percent
from 197677-197879 Thus producers were confronted with greater disincen-
Lives in the last two years of the period since the effective taxation of
their output increased That the nominal protection for sesame is signifishy
cantly less than that for dura in these markets probably had a debilitating
influence on the production of sesame relative to dura The negative protecshy
tion of sesame relative to dura across widely dispersed markets may also help
to account in part for the trend towards the monoculture of dura in rainfed
agriculture and may also indicate a bias in government policies in favor of
food production and against cash crop production Given the relative riski-shy
ness of sesame production and its potential for export earnings a lower level
of taxation would appear warranted
Producers of rainfed groundnuts also faced severe disincentives in the
markets examined The gap between road and rail transport costs made little
32
difference in the El Obeid market NRPs consistently remained around -50
percent from 197576-197879 In Tendelti which is closer to Port Sudan
nominal protection decreased sharply from -40 percent in 197576 to -70
percent in 197677 then increased to about -60 percent in the last two years
of the period These NRPs which are about par with those for sesame and
significantly lower than those for dura lend credence to a pro-food cropantishy
cash crop bias in the structure of incentives in the rainfed sector
332 Net Protection Rates for Selected Rainfed Crops
The analysis of nominal protection rates did not account for the impact
on the producer of overvalued exchange rates Since an overvalued exchange
rate implicitly taxes agricultural production it decreases the nominal proshy
tection If there is negative nominal protection the overvaluation would
make the protection rate moreeven negative thereby adding to the overall
taxation of output This section presents estimates of the netprotection for
rainfed commodities which is defined as the difference between the NRPs
(Section 331) and the overvaluation of the exchange rateofficial (Section
322) The results shown in Table 5are
Since the nominal protection for sesame and groundnuts was negative in
all markets during the period the overvaluation of the exchange rate further
reduced the protection of these crops The net protectioo rates for sesame
and groundnuts were usually between -100 and -130 percent over the period A
brief example will illustrate the effect of protection rates of this magnitude
It is appropriate to use the overvaluation of the official exchange rate even though most rainfed products are traded at the effective or parallel ratebecause all trade statistics from which the border prices were taken are converted at the official rate
33
Table 5 Net Protection of Selected Rainfed Commodities ()a
aNet protection = NRP minus the percent overvaluation of the exchange rate Overvaluation of the officialexchange rate was used in these calculations because all trade statistics (from which tile border priceswere taken) are converted at this rate
bCalculated using the NRP rd entries from Table 4
CCalculated using the NRP entries from Table 4 dweighted average of overvaluations in 1978 to account for the June devaluation
eWeight-d average of overvaluations in 1979 to account for the September devaluation
on producer incomes If the net protection of a crop was -100 percent and the
producer received LS500 for his output theincreasing protection to zero
percent would add LS1000 to his revenue increasing net protection to -50
percent would double his revenue Thus negative net protection rates of this
size not only are a severe disincentive to production but also have signifishy
cant income effects
The net protection of dura marketed in Gedaref arid Kosti is generally
negative regardless of which set of transportation costs are used Although
net protection increases (becomes less negative) in these markets from
197576-197778 it decreased sharply in 197879 (see Table 5) The net
protection rates based on road transport costs for dura marketed in El Obeid
are still positive and range between 60 600 percentand over the period
Those based on rail transport costs oscillate closely about percenta zero
rate over time hence transport costs and the availability of transportashy
tion are a critical determinant in the export competitiveness of dura
34 Subsidies in the Rainfed Sector
The mechanized farming schemes are the principal recipients of subsidies
to rainfed agriculture Because of the nature of traditional farming such as
the way land is allocated (there is no private ownership of land)farm and
cultivation methods the traditional rainfed sector is not subsidized to any
extent The three types of subsidies considered in this section are exchange
rate overvaluation low land rents and credit extension by the Agricultural
Bank of Sudan (ABS)
The overvalued exchange rate implicitly subsidizes imported inputs such
as petroleum agrochemicals tractors spare Thereand parts is an
additional subsidy if the input is traded at the official rather than the
parallel rate as petroleum was Since traditional rainfed agriculture uses
35
very few imported inputs jute sacks being the primary one the mechanized
schemes were the primary beneficiaries of the implicit factar subsidies
However the recent exchange rate unification and devaluation of Noveraber 1981
eliminated this subsidy As a result the cost of production on these schemes
will rise significantly Unless there is a corresponding increase in the
prices of agricultural commodities the more inefficient private mechanized
farms will fail Thus at least in the short run the growth of +his sector
could stagnate
The low annual land rent (5 ptfeddan in 1977) has several Undesirable
effects It is far below the opportunity cost of the land (LS10feddan)
[16] Thus extensive use of the land is encouraged Low land rents are a
disincentive to capital investment in land because there is not incentive to
adopt modern technology that would exploit the land already under cultivation
The fact that horizontal expansion of the mechanized farming sector is encourshy
aged might also contribute to soil conservation problems With land essenshy
tially a free good and currently available at an almost infinitely elastic
supply there is no incentive to save that resource or augment its productivshy
ity This problem is closely related to yet another form of subsidy credit
extended by the ABS
Although not intended to be a subsidy the poor repayment of loans
extended by the ABS has transformed its loan program into a subsidy program
With land underpriced and readily available there is a tendency to use credit
to meet annual operating expenses rather than to invest in capital that would
enhance the productivity of the land A bad harvest will mean the farmer is
unable to repay the loan Since the farmer has not invested in capital
assets the bank cannot recover its money since the farmer has little incenshy
tive to repay
36
Because a primary offactor production is greatly undervalued and the
cost of entry into mechanized farming is relatively low there is little or no
penalty attached to the use of inferior complementary factors of production
such as farm management skills This increases the probability of poor pershy
formance and its consequences abandonment of cleared land that will eventushy
ally be covered by scrub thorn bushes (thereby reducing the value of the land)
and a default on payments with little or no possibility of loan recovery
rhus low land rents and subsidized credit have resulted in undercapitalshy
ization of the rainfed agricultural sector and a poor credit recovery
experience Raising land rents and tightening up the conditions under which
loans are granted might lead to thA adoption of new technology and consequentshy
ly to more intensive use of the land Productivity would increase total
output might increase even though fewer farms might be operating and soil
conservation problems would ease Additionally the increased -evenues could
be invested in developing the infrastructure which would make the marketing
and distribution systems more efficient as well as enhancing the value of the
land
35 Comparative Advantage in the Irrigated and Rainfed Sectors
In view of the current condition of the agricultural sector and Sudans
financial crisis it is important that any investments designed to rehabilishy
tate or to develop this sector be directed towards those areas and activitieshy
that will generate the largest returns A first step in this process is to
determine in which crops Sudan has a comparative advantage The domestic
resource cost (DRC) of producing a particular agricultural commodity is a good
measure of comparative advantage The DRC for an exportable good measures the
amount of foreign exchange earned when a unit of domestic resources is
37
committed to its production for an import substitute it gives the amount of
foreign exchange saved when a unit of domestic resources is used to produce
that good Since domestic resources are measured in units of local currency
and foreign exchange earnings or savings in foreign currencies the DRC for a
good is an exchaiige rate that applies to the production of that good When it
is divided by the shadow price of foreign exchange the DRC becomes a unitless
number If it is less than one the country or region has a comparative
advantage in its production because it can exchange domestic resources for
foreign exchange at a rate below that at which the economy as a whole converts
domestic resources into foreign exchange a DRC greater than one means that a
comparative disadvantage exists
Table 6 presents the DRCs of the four major export crops and the two
import substitutes in the irrigated and rainfed sectors DRCs of irrigated
crops are given for two crop years 197273 and 197677 The results show
that Sudan clearly has had a comparative advantage in the production of longshy
and medium-staple cotton and sugar Production of wheat shows a comparative
disadvantage the Sudan would have saved foreign exchange if less wheat had
been domestically produced The Sudan moved from a comparative disadvantage
in the production of irrigated dura to a competitively neutral position The
competitiveness of irrigated groundnuts also improved over the period The
DRCs of traditional and mechanized rainfed crops are also given for the
198081 crop year (with the exception of groundnuts) For each subsector
DRCs were calculated under two yield assumptions The high yield assumption
is more optimistic the low yield was assumed to be 75 percent of the high
yield in each case and better reflects past experience
The DRCs for the traditional subsector apply to crops grown in the
Nuba Mountains of Southern Kordofan This region has a strong comparative
38
--
-- ---- --
-- __
-- -- --
-- --
__
Table 6 Domestic Resource Costs of Selected Crops=
Rainfed (198081)
Traditional Traditionalb MechanizedIrriqated Modernized(Nuba Mountains Mechanized private d
State farms(Nuba Mountains)197273 197677 (Eastern Sudan)Low Yield High Yield (Eastern Sudan)Low Yield High Yield Low Yield High Yield Low Yield High Yield
aDomestic resource cost (DRC) is tile value of domestic resourc s (infeddan divided by the Sudanese pounds) committed to is a unitless number
value 3dded in world prices (US dollars) This result is the production of output from one
A value less than one then divided by the real exchange rateindicates a coaparative advantage the result a value greater than onedisadvantage indicates a comparative
Daafrom K NashashibiVol 27 No A Supply Framework1 March 1980 Tables 3 and 4 for Exchange RenrnReal exchange rates in Developing Countiesor [S050 = $1 Ihe Experience of Sudonfor 1973 and LS061 IMFStaff apers= $1 for 1977 were used asfor the shadow exchange rate proxiesin those years CData from Sudanese Consulting Bureau adapted by Sigma One Corp exceptdData fom Sudanese Consulting Bureau adapted by Sigma One Corp
for groundnuts High yields taken from SCB data low yields are 75 percent of high yields
advantage in the production of short-staple cotton dura and sesame under
both yield assumptions The modernized traditional schemes DRCs(the are
given in parentheses in Table 6) however do not fare as well low dura
yields place these schemes at a comparative disadvantage Groundnuts producshy
tion also enjoys a comparative advantage although not as great as that of
sesame dura and cotton at lower yields
The DRCs for the mechanized rainfed sector apply production in theto
province of Kassala (Eastern Sudan) Results are shown for both private farms
and state-run farms (numbers in parentheses) Both private and state-owned
mechanized schemes are competitive in the production of cotton and sesame
under both yield assumptions The state-run farms are at a comparative disadshy
vantage in dura production at both yield levels Private tenancies are compeshy
titively neutral in dura production when yields are low but have a comparashy
tive advantage at higher yields
In summary Sudan has a clear comparative advantage in cotton production
in both the irrigated and rainfed sectors The sharp decline in rainfed cotshy
ton output is attributable to the governments policy of fixing producer
prices at a level far below the world price of short-staple cotton In dura
production the traditional rainfed sector has a competitive edge over the
irrigated sector the modernized rainfed subsector and the mechanized rainfed
sector The traditional sector also has a comparative advantage relative to
the irrigated in thesector production of groundnuts Both the traditional
and mechanized rainfed subsectors show a comparative advantage in sesame proshy
duction The rainfed sector has benefited from recent policy changes These
are necessary conditions but are not sufficient to elicit major output
increases from this sector Much remains to be done in the areas of tax
reform agricultural research and improvements in the marketing system
40
SECTION 4 IMPACTS OF THE STRUCTURE OF INCENTIVES ON
FOREIGN TRADE AND THE DOMESTIC ECONOMY
The structure of incentives in the agricultural sector has directly
contributed to problems in Sudans domestic economy and in its foreign trade
position This section analyzes the recent performance of foreign trade
(Section 41) and certain aspects of the domestic economy (Section 42) The
deterioration of the economy has been caused by distortions in the structure
of incentives thus solutions to these problems are best achieved by
eliminating these distortions Section 43 examines the likelihood of meeting
the objectives set out for rainfed agriculture in the Export Action Program
given recent changes in the incentive structure
41 Recent Foreign Trade Performance
Sudans balance of payments position deteriorated drastically during the
1970s mainly as a result of a steadily worsening balance of trade In FY
1973 exports of goods and services exceeded imports by $50 million In FY
1974 there was a deficit of $280 million because of the increase in world oil
prices The trade balance continued to decline until by FY 1981 imports were
close to $2 billion while exports were just over $1 billion Much of the
deterioration in Sudans trade balance occurred because the volume of exports
declined erratically from 1974 on while import volumes were generally higher
than their 1970 level (see Table 7) Table 7 also shows that the terms of
trade contributed to the declining trade balance but were not the primary
cause The net effect of the volume and price changes was that the nominal
value of exports more than doubled from 1970 through 1979 while the nominal
value of imports more than tripled
41
Table 7 Foreign Trade Indexes
Export Indexes Import Indexes Terms of Value Volume Price Value Volume Price Trade
1970 1000 1000 1000 1000 1000 1000 1000
1971 1817 1417 1282 1179 1057 1115 1150
1972 1217 1127 1080 1088 949 1146 942
1973 1425 1118 1275 1544 1098 1406 907
1974 1518 679 2236 2291 1004 2282 980
1975 1542 781 1974 3253 1158 2809 703
1976 1808 1031 1754 3496 1249 2799 627
1977 1722 778 2214 3253 1171 2778 797
1978 2534 864 2933 3564 1089 3273 894
1979 2372 758 3129 3551 968 3668 853
Source Sudan Foreign Trade Analysis 1970-1979 Dept of Statistics Ministry of Planning May 1981
42
411 Exports
Table 8 shows the contribution of the major export crops to the total
value of exports for selected years Although the export mix has varied from
year to year cotton has always been the major export crop accounting for 50
to 60 percent of the total value of exports Groundnuts and sesame have
generally been the second and third largest contributors although in 1979
sorghum was the second largest export crop of valuein terms The irrigated
sector produced almost all the cotton that was exported while the rainfed
sector accounted for all the sorghum and sesame each sector generated roughly
equal amounts of the export value of groundnuts
As can be seen the irrigated sector alone accounted for over half the
total value of exports with the production of a single commodity cotton The
rainfed sector generated about 40 percent oF total export earnings about 15
percent of this amount was in the four major crops While its relative conshy
tribution in these crops may be small exports from the rainfed sector proshy
vided diversification in the export mix a policy objective that the governshy
ment tried to achieve in the irrigated sector with little success
The reason behind the decrease in total export volumes can be seen by
examining the export volumes of selected commodities (Table 9) The decline
over the 1970-1979 period of long-staple cotton exports from the irrigated
sector to 50 percent of their 1970 volume is the chief reason Groundnuts and
sesame exports which had been fairly strong through the late 1970s suddenly
fell off in 1979 because of production difficulties nd government policies
restricting the exports of oil Asseeds a result their contribution to the
total value of exports decreased from 23 percent in 1977 to 8 percent in 1979
(see Table 8) Dura exports grew at a phenomenal rate in 1979 the volume
was over 100 times that in 1970 This growth is attributable to a special
43
Table 8 Composition of Exports (percent of total export value)
1971 1973 1975 1977 Irrigated 1979 Rainfed Total
Cotton
Sorghurr
Groundnuts
61
1
8
55
2
9
46
2
23
57
3
13
55
-
2
2
7
3
57
7
5
Sesame 7 8 8 10 - 3 3
Cake and meal
Other a
4
19
5
21
3
18
3
14
2
-
3
23
5
23
aIncludes gum arabic livestock and all other exports
Source Export Action Program 1980-1990 Ministry of National Planning September 1980
44
Table 9 Volume Indexes for Selected Exports
Long-staple Total Cotton Dura Groundnuts Sesame Exports
1970 1000 1000 1000 1000 1000
1971 1111 19040 2060 1176 1417
1972 1111 30380 1949 1057 1127
1973 980 52164 2357 1279 1118
1974 399 49945 2208 1317 679
1975 620 24434 3496 692 781
1976 850 47744 5201 1264 1031
1977 683 67864 2725 1335 778
1978 433 32337 1665 826 864
1979 526 100143 780 215 758
Source Sudan Foreign Trade Analysis 1970-1979 Dept of Statistics Ministry of Planning May 1981
45
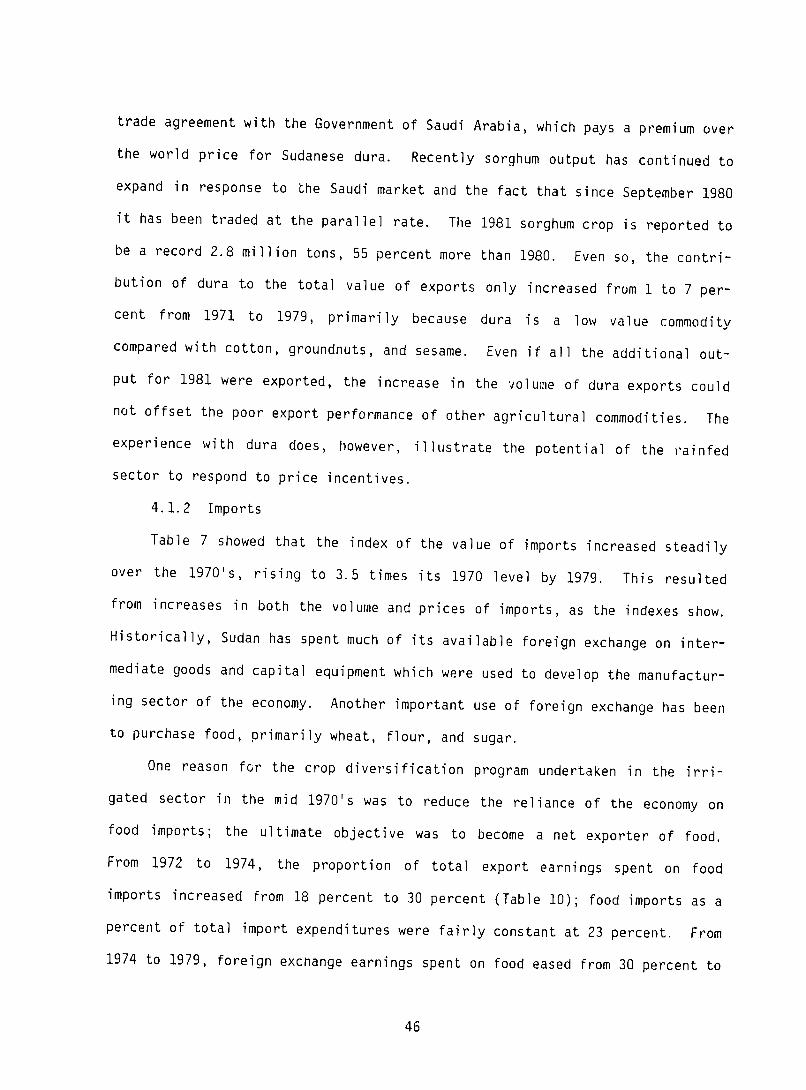
trade agreement with the Government of Saudi Arabia which pays a premium over
the world price for Sudanese dura Recently sorghum output has continued to
expand in response to the Saudi market and the fact that since September 1980
it has been traded at the parallel rate The 1981 sorghum crop is reported to
be a record 28 million tons 55 percent more than 1980 Even so the contrishy
bution of dura to the total value of exports only increased from 1 to 7 pershy
cent from 1971 to 1979 primarily because dura is a low value commodity
compared with cotton groundnuts and sesame Even if all the additional outshy
put for 1981 were exported the increase in the volume of dura exports could
not offset the poor export performance of other agricultural commodities The
experience with dura does however illustrate the potential of the rainfed
sector to respond to price incentives
412 Imports
Table 7 showed that the index of the value of imports increased steadily
over the 1970s rising to 35 times its 1970 level by 1979 This resulted
from increases in both the volume and prices of imports as the indexes show
Historically Sudan has spent much of its available foreign exchange on intershy
mediate goods and capital equipment which were used to develop the manufacturshy
ing sector of the economy Another important use of foreign exchange has been
to purchase food primarily wheat flour and sugar
One reason for the crop diversification program undertaken in the irrishy
gated sector in the mid 1970s was to reduce the reliance of the economy on
food imports the ultimate objective was to become a net exporter of food
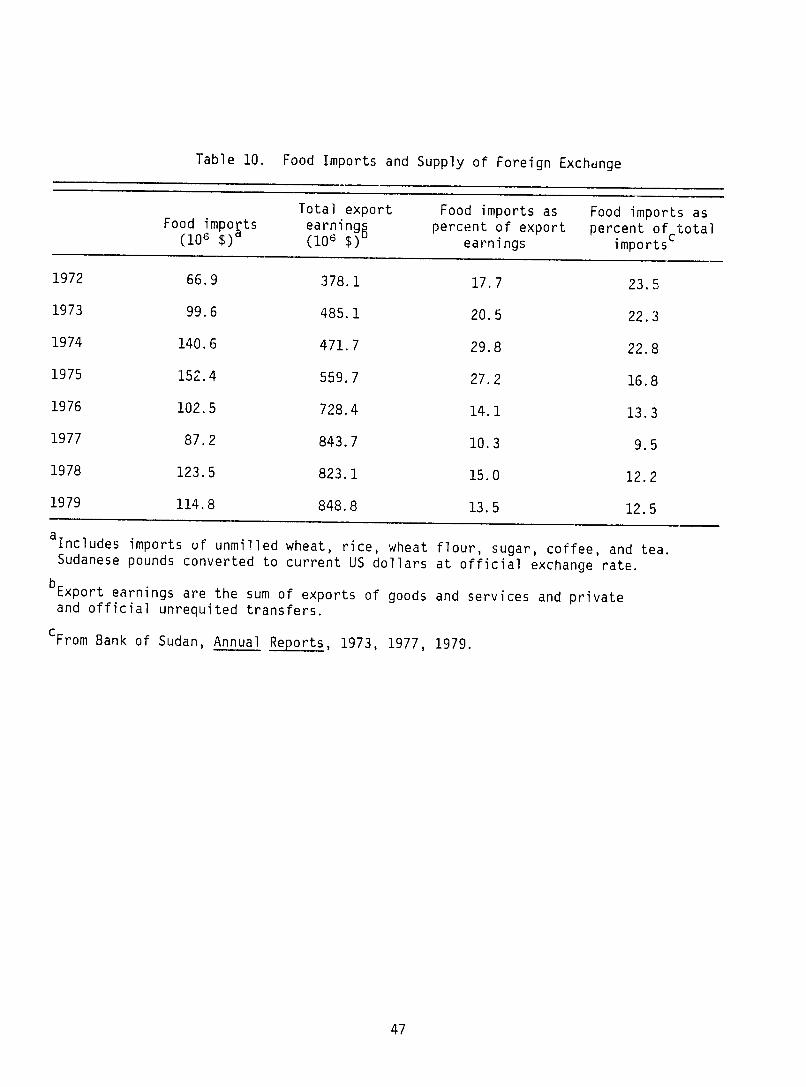
From 1972 to 1974 the proportion of total export earnings spent on food
imports increased from 18 percent to 30 percent (Table 10) food imports as a
percent of total import expenditures were fairly constant at 23 percent From
1974 to 1979 foreign exchange earnings spent on food eased from 30 percent to
46
Table 10 Food Imports and Supply of Foreign Exchdnge
Total export Food imports as Food imports asFood imports earning5 percent of export percent of total
(106 $)a (106 $) earnings importsc
1972 669 3781 177 235
1973 996 4851 205 223
1974 1406 4717 298 228
1975 1524 5597 272 168
1976 1025 7284 141 133
1977 872 8437 103 95
1978 1235 8231 150 122
1979 1148 8488 135 125
aIncludes imports uf unmilled wheat rice wheat flour sugar coffee and tea Sudanese pounds converted to current US dollars at official exchange rate
bExport earnings are the sum of exports of goods and services and private and official unrequited transfers
cFrom Bank of Sudan Annual Reports 1973 1977 1979
47
14 percent of the total food declined from 23 percent to 13 percent of the
total import bill over this period This level of dependence on food imports
is high in comparison to other sub-Saharan African countries particularly
since the official statistics may not include all food aid The average ratio
of food imports to foreign exchange earnings for six other sub-Saharan African
countries over the 1965-1976 period ranged from 2 percent to 12 percent 5 out
of 6 were between 2 and 7 percent [18]
4122 Wheat and Sugar Imports The quantity price ard value indexes
for wheat and sugar inorts (the bulk of ood imports) show why expenditures
on food claimed a high proportion of the total supply of foreign exchange
(Table 11) Although the volume of wheat and flour imports declined throughshy
out most of the 1970s then increased in 1978 and 1979 to close to their 1970
levels the price rose to more than twice its 1970 in 1974level remained
there through 1978 and quadrupled in 1979 Since 1979 wheat imports have
continued to grow to a level in excess of half a million metric tons per year
Of this concessionary sales from the United States represent almost a third
The volume of sugar imports was almost 70 percent higher in 1979 than itwas
in 1970 Sugar prices peaked at 6 to 7 times their 1970 level in 1974 and
1975 then fell off to over three times the 1970 level by 1979 As a result
during the period 1973-1975 when food imports accounted for 20 to 30 percent
of total export earnings the value of wheat and flour imports was over 15
times the 1970 level while that for sugar was 4 to 7 times its 1970 level
Including concessional imports ($45 million) the 19801981 import bill for
wheat and sugar was in excess of $250 million US Even at these high levels
of wheat imports and increasing domestic output the price subsidy scheme that
maintains the price of bread artificially low has created excess demands A
48
Table 11 Import Indexes for Wheat and Sugar
Wheat and flour Sugar
Value Volume Price Value Volume Price
1970 1000 1000 1000 1000 1000 1000
1971 944 833 1133 1797 1585 1134
1972 961 961 10C0 1827 1062 1720
1973 1570 868 1809 3558 1635 2176
1974 1506 504 2988 5798 962 6027
1975 1620 610 2656 7428 1051 7068
1976 1420 551 2577 4133 1142 3619
1977 1226 598 2050 2379 1348 1765
1978 1644 753 2183 4424 1822 2428
1979 3780 951 3975 5467 1689 3237
Source Sudan Foreign Trade Analysis 1970-1979 Dept of Statistics Ministry of Planning May 1981
49
factor that has contributed to this is that wheat aiJ sugar were traded at the
overvalued exchange rate which helped maintain the prices of these commodities
at the artifically low levels
4122 Bread Price Policy Bread provides approximately one-third of
the calorie requirements for the population of the greater Khartoum conurbashy
tion Per capita consumption of wheat has been rising rapidly in the last few
years with about a third of the officially marketed wheat being consumed in
the Khartoum conurbation This increase cannot be explained by increased
incomes and growing urbanization It must in large part be attributable to an
explicit cheap bread policy for the urban dwellers Table 2 presents the
budget shares for bread for different income groups in Khartoum Even for the
lowest income group bread represents only 111 percent of food expenditures
and less than 7 percent of total expenditures Even if these figures exclude
food away from home for workers bread represents a high zhare of nutrients
and in relation to this a rather low share of food costs
Exchange rate unification the PL480-III Agreement with the United States
and negotiations with international lenders have placed pressure on the
government to raise the price of bread If import parity pricing were to be
applied to wheat and flour the price of bread would need to be increased by
about 80 percent Reportedly the government intends to raise the price of
bread by close to this amount (66 percent)
This has undoubtedly been a politically difficult decision but its real
impact should not be as great as the current political manifestations would
suggest if the demand for bread is totally inelastic in the short run the
The material sectionin this touches on several issues that will be more thoroughly analyzed in the forthcoming wheat pricing study being conducted by Sigma One Corporation
50
Table 12 Budget Shares of Bread
Income group Share of
Food expenditures Share of
Total expenditures
() ()
Urban Khartoum (3 towns)
All Groups 1061 620
lt 500 LS 1107 689
500-1000 1072 672
1000-2000 1106 678
2000-3000 1045 571
3000+ 854 400
Rural i oum
All Groups 406 274
lt 500 LS 410 313
500-1000 453 312
1000-2000 432 208
2000-3000 NA NA
3000+ 075 053
Source Department of Statistics Ministry of Planning Household Budget Survey 1979
51
cost of living impact will be about 5 percent in real terms for the lowest
income strata in Khartoum If bread is somewhat price elastic the cost of
living impacts are even lower In this case the consumption impacts would
reduce calorie intake by approximately 10 percent for consumers at the FAO
requirements and less for those above it Since there is little indication
that urban Khartoum h-s serious nutritional problems (save for the refugee
population) the deleterious impacts on human nutrition are likely to be
small
The timing for these actions is fortuitous in that Sudan has experienced
a bumper crop in dura and world wheat prices are depressed With exchange
rate unification and import parity pricing the domestic producer price of
LS16750 per ton will not change much This should enable significant savings
in treasury costs ($50 to $60 million) by eliminating the so-called producers
subsidy It is also reasonable to expect substitution of wheat demand for
dura consumption With these policy changes the growth in import demand for
wheat should be slowed The USAID PL480 Title III Program which was supportshy
ing the implicit subsidy can under the new policy regime facilitate the
transition to lower reliance on food imports by continuing the supply without
requiring an increase in the foreign exchange allocations to food imports
42 Fiscal and Monetary Impacts
Much of the impact of the structure of incentives on fiscal problems and
excessive growth of the money supply has occurred through the performance of
parastatal or public entities The poor performance of these state-run corshy
Concern for consumption and nutritional impacts on low-income and othershywise at-risk populations could be more effectively addressed through alternashytives such as the CRS Title II program
52
porations over the past several years created a growing demand for public
sector credit thereby exacerbating the governments budgetary problems and
forcing it to turn increasingly to external sources of credit to finance the
resulting deficits
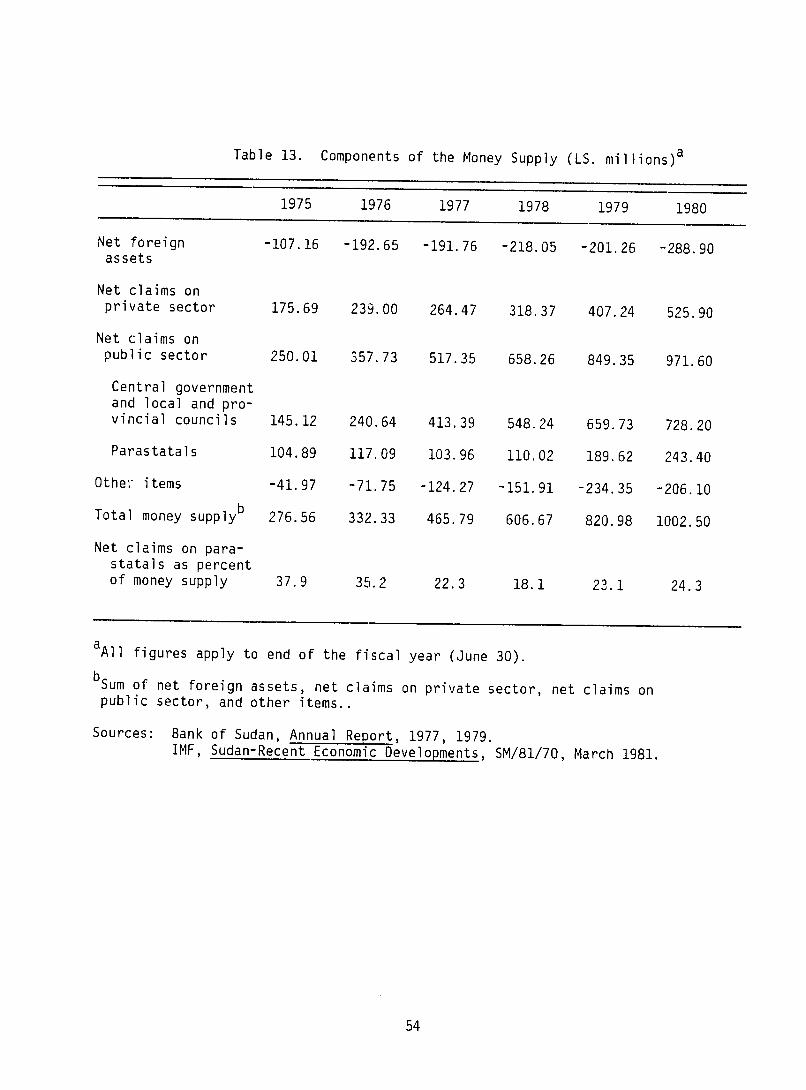
Table 13 contains a breakdown of the money supply for FY 1975-FY 1980
The supply of money increased from LS277 million in 1975 to over LS1 billion
in 1980 at a compounded growth rate of 29 percent per year This is a primary
factor underlying the high rate of inflation Net claims on the public secshy
tor which comprises the central government local and provincial councils
and parastatal entities was the primary reason from LS250 million in 1975
they grew at an annual rate of 31 percent to over LS970 million in 1980 The
parastatals which include the agricultural and industrial entities and the
public utilities accounted for a substantial portion of the net claims on the
public sector The claims against these bodies increased from LS105 milshy
lion in 1975 to over LS240 million in 1980 growing at 20 percent perover
year Since their growth rate was lower than that of the money supply the
proportion of net claims on the parastatals to the money supply declined from
38 percent to 24 percent over the period Besides being inflationary public
sector borrowing of this magnitude crowds out private borrowing and thereby
inhibits the capitalization of the private sector
Of the parastatal entities the agi-icultural corporations and boards
receive the largest share of bank credit with the public utilities and the
industrial boards a distant second and third respectiely The boards conshy
trolling the irrigation schemes accounted for most of the credit extended to
agriculture by the banking sector Of LS140 million in 1977 these boards
received about LS120 million in 1980 they received LS205 million in credit
against a total of LS215 million [11] On the other hand credit extended to
53
aTable 13 Components of the Money Supply (LS millions)
1975 1976 1977 1978 1979 1980
Net foreign -10716 -19265 -19176 -21805 -20126 -28890 assets
Net claims on private sector 17569 23900 26447 31837 40724 52590
Net claims on public sector 25001 35773 51735 65826 84935 97160
Central government and local and proshyvincial councils 14512 24064 41339 54824 65973 72820
Total money supply b 27656 33233 46579 60667 82098 100250
Net claims on parashystatals as percentof money supply 379 352 223 181 231 243
aAll figures apply to end of the fiscal year (June 30)
bSum of net foreign assets net claims on private sector net claims on public sector and other items
Sources Bank of Sudan Annual Report 1977 1979 IMF Sudan-Recent Economic Developments SM8170 March 1981
54
the Mechanized Farming Corporation the only parastatal body directly involved
in rainfed crop agriculture increased from LS10 million in FY 1977 to
LS26 million in FY 1980
Rainfed agriculture is relatively isolated from the publiL sector
course it benefits (or suffers) from the performance of the largest public
utility Sudan Railways And most of the loans granted by the Agricultural
Bank of Sudan a government-controlled financial entity go to the rainfed
sector Thus any policy changes affecting the organization or financial
status of the parastatals would affect this sector primarily through its
credit availability and its marketing and distribution system Policy changes
would not be likely to directly affect the viability or productivity of the
sector as a whole as would changes in the boards operating the irrigation
schemes
As discussed above the subsidies on wheat and sugar are a drain on the
Treasury It is estimated that eliminating them would save between $50 and
$60 million per year This would reduce the budget deficit and consequently
ease inflationary pressures A smaller deficit would also mean less public
sector borrowing which would help the private sector by allowing more private
borrowing
43 The Export Action Program Potential of the Rainfed Sector
The Export Action Program (EAP) of 1980 outlines an ambitious program to
promote exports from the irrigated and rainfed sectors over the next 10 years
thereby increasing foreign exchange earnings and eventually solving Sudans
balance of payments problems The proposed program for the rainfed sector is
not as detailed or extensive as the one for the irrigated sector which in the
main calls for rehabilitating the existing schemes It is forthrightly
55
admitted that the specific constraints to raising productivity in the rainfed
sector have not yet been identified and that it is not known whether the conshy
straints once identified can be overcome [12] The plan recognizes that
labor constraints in the rainfed sector mean that more capital investment is
needed if the 1990 targets are to be met However the capital requirements
are small compared with those for the irrigated sector Public sector investshy
ment of LS160 million is planned over the next 5 to 7 years most of this
outlay will be directed towards agricultural research and pilot projects In
addition the EAP recognizes the rainfed sectors need for improved infrashy
structure in particular adequate transport and marketing facilities as well
as adequate supplies of good seeds and credit
The EAP lists projects and policies undertaken or planned for the benefit
of rainfed agriculture and then gives the 1990 export target for each of
the major rainfed products These targets are actually estimates of export
availabilities which were derived by setting production targets and netting
out estimates of increased consumption seed waste etc The production
targets for the major rainfed crops except gum arabic are presented in Table
14 along with the targeted increases in cropped areas and yields that would
enable the targets to be met This section analyzes the feasibility of the
targets in light of the past performance of the rainfed sector the
constraints on its potential performance and how the recent policy changes
might relax those constraints
Examination of the production targets in Table shows more14 that
reliance is placed on horizontal expansion than on vertical expansion The
annual growth rates for areas cropped in groundnuts sesame dura and cotton
are roughly twice the growth rates of yields A policy aimed at intensifying
56
Table 14 Rainfed Crop Production Targets
Groundnuts Area (000 fed) Yield (kgfed) Production (000 tons)
Sesame Area (000 fed) Yield (kgfed) Production (000 tons)
Dura Area (000 fed) Yield (kgfed) Production (000 tons)
Cotton Area (000 fed) Yield (Kantarfed)a Production (000 tons)
aKantar = 143 kg
Source Export Action Programme
September 1980
Required1978-1979 annual average 1990 growth rate ()
1976 2950 38 262 328 20 517 967 58
2058 2860 30 104 122 15 214 350 46
6246 9540 39 300 353 15
1846 3370 56
164 530 113 09 20 75
21 150 196
1980-1990 Ministry of National planning
57
the use of areas presently under cultivation would result in growth rates of
yields that significantly exceeded the growth rates of areas cropped Given
the vast areas of arable land not yet under cultivation and the relatively
small amount of capital investment allocated to the rainfed sector over the
next decade a policy that implicitly relies on horizontal expansion to meet
the targets might be reasonable
However infrastructure constraints are more likely to confound such a
policy In particular expanding horizontally will increase the demand for
transportation If the planned extension of the road system is insufficient
to meet future needs it will be a major obstacle to the EAP since most of the
increased production of cotton groundnuts and sesame are intended for the
export market Without an adequate transport system the western markets will
remain isolated from the world market and increased output will only tend to
depress producer prices
Although the EAP does not specify precisely how much expansion is
targeted for each province some of this information is given for sesame
production dura output from mechanized farms and groundnuts production from
traditional farms The results show that cropped areas in Kassala particushy
larly the Gedaref area are expected to increase by 600 thousand feddans or
26 percent over the decade Cropped areas should expand by over 13 million
feddans or 130 percent in the central provinces of the Blue Nile and Whte
Nile A substantial increase of 12 million feddans almost 50 percent is
also anticipated for the western provinces about equally divided between the
Kordofans and the Darfurs
Plans to extend the road system involve all these provinces The highway
from Port Sudan to Khartoum passes through the Gedaref region in addition
58
five feeder roads in the area are under consideration In the Blue Nile the
Wad Medani-Sennar road has been completed and roads from Sennar to Damazin
(an important mechanized farming region) and from Sennar to Kosti are under
construction Of three planned roads in the Kordofans the El Obeid-Dubeibat
road is under construction and the En Nahud-Abu Zabad and Habila-Dubeibat
roads are being negotiated In the Darfurs a road connecting Nyala and El
Fasher has been budgeted A road From Nyala through Kas and Zalingei and
ending northwestern borderat the town of Geneina is currently under conshy
struction Whether these roads will adequately serve the future needs of
these provinces is not known At a minimum however all the roads that have
been budgeted negotiated for or are under construction need to be completed
paoticularly if the targets in the central and western provinces are to be
met
Even if the targeted expansion in cropped areas occurs greater producshy
tivity in the form of increased yields is needed if the output targets for the
rainfed sector are to be achieved Although the Sudan has had an agricultural
research program for several years it has had little impact on rainfed
farmers because extension services are practically nonexistent The current
research program needs to be continued and expanded and much more effort needs
to be made to get research results to Sincethe farmer a major weakness of
the extension service is a shortage of trained personnel a policy initiative
designed to (or train)attract qualified people would seem appropriate An
effective extension service providing the best available information on cultishy
vation techniques and seed varieties is required for sustained improvements in
rainfed sector yields
59
Other policies have been implemented or are under consideration to
improve the structure of incentives in the rainfed sector These incluae the
unification and devaluation of the exchange rates and the removal of the
export duties on cotton and sesame Abolishing the monopoly of the Sudan Oilshy
seeds Company in exports of oilseeds resulted in substantial increases in
groundnuts seeds and oil shipments during the third quarter of 1981 [9]
In the public sector the ABS is being strengthened through the IDAshy
financed Agricultural Services Project which calls for an outlay $300 million
over the rest of the century Under its auspices the ABS will be reorganized
so that it can provide more credit to the rainfed sector as well as more
tractors and spare parts Tax incentives under the Agricultural Investments
Act of 1976 include concessions to private investors who operate huge mechanshy
ized farms (between 250 thousand and 500 thousand feddans) The size of these
farms means that their location must be very carefully considered so that the
already shaky relations between the nomads and the mechanized farmers are not
exacerbated [16] A policy of dubious merit is the government encouragement
of producer cooperatives as the most efficient means of getting credit to
smallholder farmers and to insure greater private control of resources Howshy
ever past experience with cooperatives does not support this optimistic conshy
clusion they usually break down after a few months [16]
The best way of realizing the potential of the rainfed sector still
remains untapped however because of the governments policy of fixing the
purchase prices for rainfed cotton sesame and groundnuts The government
recognizes what a severe disincentive this is it recently doubled the purshy
chase price of rainfed cotton from LS260 per small kantar to LS700 in
belated recognition of the fact that for years the internal price of shortshy
staple cotton has been far below the international price As discussed in
60
Section 33 the production and marketing system operates very effectively
given the tremendous infrastructure constraints it is faced with Commodities
like dura and millet whose prices are relatively free from government intershy
ference move from surplus to deficit areas as reflected in price differenshy
tials both within the country and from the country to the world market Oilshy
seeds and oil exports increased once the Sudan Oilseeds Company was forced to
compete with the private trading sector Removal of government intervention
in market prices would narrow the wedge between producer and world prices
improve producer incomes and realize some of the potential--at little or no
cost--of the rainfed sector
61
SECTION 5 CONCLUSIONS AND RECOMMENDATIONS
In the past 10 years the performance of the agricultural sector
deteriorated especially in the irrigated schemes causing severe problems for
Sudans domestic economy and its foreign exchange reserves Since land is not
the limiting factor it seems reasonable that the productivity levels of the
early 1970s are realizable through an improved structure of incentives with
consequent improvements in the domestic economy and Sudans foreign trade
position Recent experience indicates that the rainfed sector has the
potential and ability to respond to improved incentives
Throughout the 1970s rainfed agriculture was expanding for all annual
crops except cotton through increases in cropped areas Recent rapid
increases in sorghum production which are believed to be a response to an
improving structure of incentives have principally been achieved through area
expansion Yields in sorghum have generally been stagnant at rather low
levels While further area expansion can undoubtedly be realized there
appears now an opportunity for increasing output through the intensification
of production in existing In this research andareas regard agricultural
enhanced availability of modern factors of production could play a key role in
facilitating private farmers abilities to respond to the improved incentives
generated by recent policy initiatives The realization of this potential
would however require effective public sector delivery of research results
and substantial improvements in factor markets
In the latter half of the decade irrigated areas sown to cotton and
other crops decreased absolutely as a result of the disincentive effects of
the joint account system and the reduced revenues of the management boards of
62
the irrigated schemes The experience in the irrigated sector during the
1970s illustrates that it is not sufficient to direct resources towards a
sector without the same theat time providing appropriate incentives for
farmers to make effective use of the publicly-provided resources That is
research infrastructure and agricultural services will not lead to
productivity increases if the incentives facing farmers have the effect of
taxing away the value of the publicly-provided resources
The terms of trade were not the primary cause of the deteriorating
balance of payments situation Rather the growth in value of imports far
outstripped the growth in value ot exports The chief reason is the decline
in cotton output This is not surprising since cotton production faced the
most severe disincentives The motivation for the direct and explicit
taxation of cotton may have been to secure operating revenues for the governshy
mlent and the parastatals but in so doing the disincentives were so severe
that the revenue base was eroded This experience emphasizes needthe for
extensive tax reform in the Sudan
Tax reform is under considerzion and some changes have been made For
example the export duties on cotton and sesame have been removed the removal
of the duties on groundnuts and livestock products is under consideration
Other reform measures should be directed towards increasing the buoyancy and
progressivity of the tax system for example by eliminating specific taxes
Since September 1979 the parallel exchange rate was minimally overshy
valued if not in fact undervalued some of the time By placing many
of the tradeables on the parallel rate in September 1980 the Sudan has
removed one of the most important sources of distortions to the structure of
incentives With the exchange rate Lnification and devaluation of November 9
1981 the potential for aligning the valuation of domestic resources with
63
their international valuation has been created Under this new regime
official price interventions will need to be stated explicitly and fiscal
budget implications clearly identified For example the overvaluation of the
official exchange has tendedrate to mask the economic and budgetary cost of
Sudans cheap bread policy Under the new regime the Sudan may choose to
continue to subsidize the price of bread but the amount and source of the
subsidy will need to be explicitly stated in the fiscal budget In so doing
budget planners will be better able to gauge the opportunity cost of the
resources allocated to the bread subsidy In the past a substantial portion
of the implicit subsidy for bread was borne by domestic wheat producers yet
the accounting figures made it appear as if wheat producers were being
directly subsidized Furthermore with multiple exchange rates for wheat and
sorghum the relative prices for wheat versus sorghum were inverted from their
usual international price relationship In the absence of the special sorghum
export arrangements to Saudi Arabia this condition would have been a serious
distortion and disincentive to both domestic wheat and sorghum production
The other side of exchange rate unification relates to higher factor
costs (petroleum prices) in mechanized agriculture and in the transportation
system This will tend to shift back the supply of agricultural output from
the more modern subsectors Since sorghum has been at the paralleltraded
rate since September it is possible much the1980 that of response to
improved pricing has already been realized Thus major supply increases
should not be expected result from exchange rate unification per se Thisto
policy reform however does create an environment which makes it more
possible for resources to be utilized efficiently This should in turn
create incentives for investment and innovation
64
Indirect estimates of marketing costs for dura in the West suggest that
even if transport links between El Obeid and Khartoum and Port Sudan are
improved the El Obeid market will probably continue supply the westernto
regions rather than becoming a major supolier of the eastern provinces and the
export market This result is important because much has been made of the
need to rehabilitate the rail system and to extend the road systen in the
investments toWest such need be carefully evaluated because the anticipated
flow of produce (dura) may not be forthcoming This is not to say that
enhancement of the transport system may not be warranted but that higher
returns may possibly be obtained from intraregional connections in the West
than from linking the West to the more developed East An important caveat to
be considered in this regard is the thinness and instability of the markets to
the West
The exchange rate unification and devaluation of November 9 1981 has
eliminated the implicit subsidies to petroleum agrochemicils and spare
parts The costs of production in the mechanized farming schemes and the
irrigated sector are expected to rise in proportion to the product of the
devaluation and the share of costs represented by these previously subsidized
factors The devaluation will have little impact in reducing the negative
nominal protection facing the rainfed sector (with the exception of rainfed
cotton)
In the absence of other changes in the structure of incentives output
from this sector is likely to decline at least in the short run To dampen
this potentially deleterious impact a combination of further tax reform (such
as removing all remaining export duties) and public sector initiatives that
enhance the productivity of the sector a whole egas accelerated
agricultural research to increase the productivity of the scarce factors of
65
production (agrochemicals labor and for the irrigated sector water) and
reduction of any technical and economic inefficiencies in the marketing
system Our estimates of nominal protection reveal the likelihood that
marketing margins are high
Low land rents and subsidized credit have resulted in undercapitalization
of the rainfed agricultural sector a poor creditand recovery experience
Raising land rents and tightening up the conditions under which loans are
granted might lead to the adoption of new technology and consequently to more
intensive use of the land Productivity would increase total output might
increase even though fewer farms might be operating and soil conservation
problems would ease Additionally the increased revenues could be invested
in developing the infrastructure which would make the marketing and distrishy
bution systems more efficient as well as enhancing the value of the land
The Sudan should n)t lose the current opportunity to remove an important
distortion in the market for food and realize Treasury and foreign exchange
savings by eliminating the implicit and explicit subsidies on wheat and sugar
Three favorable conditions exist--a bumper crop in domestic sorghum production
depressed international prices for wheat and sugar and substantial concesshy
sionary assistance through the wheat imports from the US under the PL 480
Title III Program--whch minimize the deleterious cost livingof and
nutritional impacts on the urban minority which has become dependent on these
subsidies The long term impacts of removing the subsidies should be
beneficial to the majority of Sudanese that are engaged in agricultural
production
66
Sudan has a clear comparative advantage in cotton production in both the
irrigated and rainfed sectors The sharp decline in rainfed cotton output is
attributable to the governments policy of fixing producer prices at a level
far below the world price of short-staple cotton In dura production the
traditional rainfed sector has a competitive edge over the irrigated sector
the modernized rainfed subsector and the mechanized rainfed sector The
traditional sector also has a comparative advantage relative to the irrigated
sector in the production of groundnuts Both the traditional and mechanized
rainfed subsectors show a comparative advantage in sesame production The
rainfed sector has benefited from recent policy changes These are necessary
conditions but are insufficient to cause major output increases from rainfed
agriculture Much remains to be done in the areas of tax reform agricultural
research and improvements in the marketing system
67
REFERENCES
1 Acharya Shankar N Incentives for Resource Allocation A Case Studyof Sudan World Bank Staff Working Paper No 367 Washington DC December 1979
2 Alibaruho George Prospects for Production and Export of Food in theSudan A Cautionary Note Working Paper 789CGFPI International Food Policy Research Institute Washington DC March 1978
3 Bank of Sudan Annual Reports 1973 1977 1979 Khartoum The Democratic Republic of the Sudan
4 Department of Agricultural Economics Ministry of Agriculture Food andNatural Resources Current Agricultural Statistics Vol 1 No 3 Khartoum June 1979
5 Department of Statistics Ministry of Planning Sudan Foreign Trade Analysis 1970-1979 Khartoum May 1981
6 Arl 1981Internal Trade Statistics and Price Indices 1978 Khartoum April 1981
7 Due John F Rail and Road Transport in the Sudan Faculty WorkingPaper No 423 (Transportation Paper No 15) University of Illinois at Urbana-Champaign July 1977
8 The Tax Structure of the Democratic Republic of Sudan WithEmphasis on the Indirect Taxes and Potential Reforms Parts A and BFaculty Working Papers Nc 419 and 420 University of Illinois at Urbana-Champaign July 1977
9 The Economist Intelligence Unit Ltd Quarterly Economic Review of Sudan4th Quarter 1980 1st Quarter 1981 3rd Quarter 1981 London
10 Food and Agriculture Orgarization of the United Nations Sudan Report of FAO Programming Mission October 1980
11 International Monetary Fund Unpublished data
12 Ministry of National Planning Export Action Programme 1980-1990 Khartoum September 1980
13 Nashashibi K A Supply Framework for Exchange Reform in DevelopingCountries The Experience of budan IMF Staff Papers Vol 27 No 1 March 1980
14 Picks Currency Yearbook Sudanese Pound New York 1979 pp581-586
68
15 Scobie Grant M Investment in International Agricultural Research Some Economic Dimensions World bank Staff Working Paper No 361Washington DC October 1979
16 Simpson IG and Morag C Simpson Alternative Strategies for AgriculturalDevelopment in the Central Rainlands of the Sudan Rural Development StudyNo 3 University of Leeds 1978
17 Sudan Gezira Board Statistical Bulletin No 2 Barakat March 1981
18 Valdes A and P Konandreas Assessing Food Insecurity Based onNational Aggregates in Developing Countries in Food Security forDeveloping Countries ed Alberto Valdes Westview Press 1981
19 The World Bank Accelerated Development in Sub-Saharan Africa An Agenda for Action Washington DC 1981
20 The Basic Economic Progam Address by HE President Gaafar Mohamed Nimeiry November 9 1981
69
EXECUTIVE SUMMARY
The purpose of this report is to examine the structure of incentives facshying Sudanese agriculture in particular the rainfed sector in the North The analysis estimates how recent and possible future policy changes may affect agricultural productivity and their potential for improving the performance of the ecooomy The report also considers specific activities which may b3 supshyported by the US Agency for International Developrent in assisting the government of Sudan in its efforts to increase the rainfed secturs contribushytion to economic growth export earnings and improved producer incomes
Since the rainfed sector is primarily in private hands these activities can best be implemented through policy initiat ives that enhance the structure of incentives to the private sector and through selected public sector initiashytives such as accelerated investments in agricultural research and extension and enhancements to the agricultural marketing system (includiiig road and rail transport) Recent experience in sorghum production and marketing indicates that private rainfed agriculture has the potential and ability to respond to improved incentives
Working with secondary data sources the report presents an overview of the agricultural sector in the last ten years and analyses of the tax systemexchange rate policies agricultural pricing and marketing and governmentintervention and their implications for relative efficiency These analyses are presented in tle context of the macro economic situatior specifically trade money supply and fiscal deficits
The output Df the rainfed sector increased throughout the 1970s through an expansion in cropped areas By coritraEt output from the irrigated sector declined because there was no growth in cropped areas and yields were declinshying or stagnant Even though most public sector investment was directed towards the irrigated sector the structure of incentives was such that these resources were effectively taxed away On the other hand the disinceitives facing the rainfed sector were not as severe and producers were more responshysive to private market mechanisms
Recer~t policy initiatives have eliminated some of the distortions in the structure of incentives Export duties on several agricultural commodities have been removed The exchange rate poundytem was recently unified and devalued thereby bringing the price of fireign exchange closer to its true value This removed an implicit subsidy on imports of wheat flour sugarpetroleum agrochemicals and spare parts it raised the prices received bydomestic producers for exports of their output this may not elicit a largeincrease in the output from the rainfed sector since its commodities have been traded at the trLe price of foreign exchange since September 1980 Explicit subsidies on petroleum wheat and sugar are being phased out with consequent Treasury savings of $50 to $60 million per year The recent bumper crop of sorghum depressed world prices for wheat and sugar and United States wheat imports under the PL 480 Title III program should dampen the cost of living and nutritional impacts caused by the removal of the implicit and explicit subsidies
Much remains to be done Low land rents and subsidized credit haveresulted in undercapitalization of the rainFed sector The tax system lacksbuoyancy and progressivity increased agricultural research and more imporshytantly an effective extension service are needed to increase productivityTechnical and economic inefficiencies in the marketing system must be elimishynated Policy initiatives in these areas will significantly imprcve the structure of incentives facing rainfed agriculture thereby realizing some of the potential of this sector and ameliorating the problems in Sudans domestic economy and its foreign trade position
ACKNOWLEDGEMENTS
Several people made valuable contributions of their time and resources to
this study Siddig Salih a graduate student in economics at Duke University
provided data and useful comments on agricultural pricing and marketing In
the Ministry of National Planning Dr E A A Zaki commented on an earlier
draft of this report and gave us a draft of his article on the Sudanese
economy which will be published in the Sudanow Yearbook El Fatih Obeidallah
Taha obtained important information on producer prices for Thurvald Moeus
of the World Bank provided information on transport costs and discussed other
aspects of Sudanese agriculture with us Marielouise Harrell on the staff of
Sigma One Corporation was responsible for the computer plots of the figures
and helped prepare an earlier draft of this report Finally we would like to
thank Evelynne Rasl and Jacquelyn Epperson who cheerfully labored long hours
typing and retyping the report
TABLE OF CONTENTS
Section Page
INTRODUCTION 1
11 Purpose 2 12 Setting 3
2 RECENT PERFORMANCE OF THE AGRICULTURAL SECTOR 5
21 Export Crops 6 22 Import-substitute Crops 11 23 Millet The Nontraded Good 14
3 THE STRUCTURE OF INCENTIVES 18
31 The Tax System 19
311 Exports 19 312 Imports 20 313 Taxes on Domestic Production 21
32 The Exchange Rate System 21
321 Exchange Rate History 22 322 Overvaluation of the Exchange Rate 23
33 Pricing and Marketing of Selected Rainfed Crops 26
331 Nominal Protection Rates 26
332 Net Protection Rates for Selected Rainfed Crops 33
34 Subsidies in the Rainfed Sector 35 35 Comparative Advantage in the Irrigated and Rainfed
Sectors 37
4 IMPACTS OF THE STRUCTURE OF INCENTIVES ON FOREIGN TRADE AND THE DOMESTIC ECONOMY 41
Pre June 0348 0640 839 0400 0640 600 Post June 0400 0640 600 0500 0640 280
1979
Pre September 0400 0731 828 0500 0731 462 Post September 0500 0731 462 0800 0731 -86
1980 0500 0819 638 0800 0819 24
1981 Pre November 0500 - - 0800 - -Post November 0900 - 0900 -
aThe 1972 black market rate from Picks Currency Index (LS0516=$1) was assumed to
be the real exchange rate in that year Real rates for the remaining years were calculated using the consumer price index for Sudan (1975 = 100) CPI S the IBRD world inflation index (1975 100) CPI W1 and the followiig formula
C CPIW i 72
i 72E -E S W where E is the real exchange rateCP172 CPI 1 in year i
E - E
Overvaluation x 100 where E is the nominal exchange rate in year i E 1
24
estimates of the shadow exchange rate because the prices of traded commodities
are included in the Sudanese and world CPIs in the deflator A shadow
exchange rate would reflect price changes in Sudans home (nontraded) goods
relative to price changes in the home goods of its major trading partner for
example the EEC However such indexes were not available so the estimates
of real exchange rates were used as proxies for shadow exchange rates
The results show that exports traded at the official rate were implicitly
taxed at rates between 40 and 80 percent imports brought in at this rate were
subsidized by equivalent amounts Until September 1979 when the parallel rate
was established the amount of overvaluation ranged from 25 to 60 percent
The parallel rate was slightly undervalued (9 percent) but because most comshy
modities were shifted to the official rate at that time the implicit tax
(subsidy) on exports (imports) was over 40 percent During 1980 the parallel
rate was only slightly overvalued Thus trading many commodities at the
parallel rate removed much of the implicit taxation or subsidization
However the tax rate on cotton and the subsidy rate for wheat flour sugar
petroleum and pharmaceuticals climbed to over 60 percent since these
commodities were traded at the official exchange rate Although price indexes
for 1981 are not available the unification and devaluation of the exchange
rates in November 1981 probably brought the nominal exchange rate closer to
the real price of foreign exchange since inflation in Sudan has reportedly
been higher than the world inflation rate Since all of Sudans exports from
the rainfed sector have been traded at close to the real price of foreign
exchange since September 1980 the November 1981 exchange rate regime will not
significantly boost exports from this sector The major impact will tobe
increase the price of petroleum thereby inflating transportation costs
25
33 Pricing and Marketing of Selected Rainfed Crops
In a perfectly competitive economy agricultural producers would receive
100 percent of the world market price net of an efficient marketing margin
for their output Divergences from this ideal are introduced by exchange rate
overvaluations or undervaluations government taxes and subsidies and inshy
flated marketing margins If the net effect of these factors raises producer
prices above world prices positive protection exists and producers are
effectively subsidized by the amount of the difference between world and
domestic prices If the net effect is to depress producer prices relative to
world prices the protection is negative and producers are effectively taxed
by the amount of the price difference The purpose of this section is to
estimate the net protection of dura sesame and groundnuts in three proshy
vincial markets over time and examine the policy implications of the results
The net protection rate is the difference between the nominal protection
rate (NRP) and the amount of exchange rate overvaluation The NRP for a
commodity captures the effects of government taxes and subsidies on the output
of that commodity it is the percentage difference between the domestic
producer price and the world (border) price adjusted to reflect transport and
marketing costs Estimates of the NRPs are presented in Section 331 In
Section 332 these are combined with the effect of the overvalued exchange
rate (Section 322) to arrive at an estimate of the net protection for the
major rainfed crops
331 Nominal Protection Rates
Four markets in three provinces were selected for analysis The Gedaref
market in Kassala (Eastern Sudan) is one of the largest markets for dura and
sesame El Obeid in Northern Kordofan is a major trading center for Western
26
Sudan dura sesame and groundnuts are among the commodities marketed In
the White Nile Province (Central Sudan) Kosti represents a major market for
dura while large quantities of sesame and groundnuts are traded in Tendelti
All four markets are linked by rail to Khartoum and Port Sudan
Producer prices in these markets for the crop years 197576-197879 are
presented in Table 2 There is considerable variation both across markets in
a given year and across time in a given market In general prices are higher
in the western markets than in the central and eastern markets These
variations reflect differences in transportation costs production costs
demand conditions and levels of marketed surpluses The producer prices of
dura in El Fasher (Northern Darfur) which are significantly higher than the
prices in other markets are also presented to support a conclusion that will
be drawn from the analysis of the NRPs below
The cost of transportation from the market to Port Sudan must be netted
out of the border price of each commodity to determine the border price facing
the producer or the export parity price Ideally other marketing costs
such as storage handling and commissions should also be netted out this
information was not available so the marketing margin is not treated in this
analysis Two sets of transprotation costs were estimated one for road
transport by lorries and one for rail transport (see Table 3A) Rail
transport costs were assumed to be 50 percent of road transport costs no
attempt was made to calculate transportation costs by commodity These costs
which are given in piasters per ton kilometer were multiplied by the distance
of each market from Port Sudan (Table 36) and the result was suotracted from
the border prices of the commodities to determine the export parity prices
The percentage difference between the producer and export parity prices of a
commodity is the nominal protection rate for that commodity these are preshy
27
Table 2
Dura
aPort Sudan (FOB)
Gedaref
El Obeid
Kosti
El Fasher
Sesame
aPort Sudan (FOB)
Gedaref
El Obeid
Tendelti
Groundnuts
Port Sudan (FOB)a
El Obeid
Tendelti
Producer Prices of Selected Rainfed Crops by Provincial Market (LSton)
19751976 19761977 19771978 19781979
434 453 540 885
178 277 356 411
461 527 451 1181
224 210 477 412
733 1365 1097 1255
1841 2037 2601 4040
1112 691 1147 1566
1250 1332 816 1409
1205 857 1292 2079
1371 2176 2091 2827
624 973 805 1079
700 546 765 974
Sources Internal Trade Statistics and Price Indices 1978 Department of Statistics Ministry of Planning April 1981
Sudan Foreign Trade Analysis 1970-1979 Department of Statistics Ministry of Planning May 1981
aExport (border) prices FOB Port Sudan in LSton converted at official exchange rate
28
Table 3A Transportation Costs (ptton km)a
RailbRoad
1976 14 07
1977 20 10
1978 30 15
1979 35 18
Sources John F Due Rail and Road Transport in the Sudan Faculty Working Paper No 423 Universityof Illinois at Urbana-Champaign July 1977 Thurvald Moe World Bank
aRates assumed to be the same for all commodities
bAssumed to be one-half the road transport costs
Table 3B Distances of Markets to Port Sudan (km)
Road Rail
Gedaref (Kassala) 852 800
El Obeid (N Kordofan) 1613 1537
Kosti (White Nile) 1512 1217
Tendelti (White Nile) 1624 1313
29
sented in Table 4 Because not all marketing costs could be identified these
estimates understate positive protection and overstate negative protection
Most of the NRPs for dura marketed in Gedaref are negative Nominal
protection tended to increase (the NRPs became less negative) from 197576
through 197778 but decreased sharply in 197879 However NRPs for dura
marketed in El Obeid and Kosti paint a different picture Both NRP estimates
for the El Obeid market show high levels of positive protection those based
on road transport costs range between 120 and 700 percent while those based
on rail transport costs are between 40 and 90 percent The results for dura
traded in Kosti are mixed the NRPs based on road transport costs are conshy
sistently positive (between 1 and 450 percent) while those based on rail
transport costs are negative for all years (around -37 percent) except
197778 Since a positive NRP implies that the producer is receiving more
than the world market price dura from El Obeid and Kosti could not be
competitive on the export market Saudi Arabia has recently been importing
Sudanese dura at a premium above the world price but this does not account
for the positive NRPs in the earlier years Since there were no explicit
subsidies in these two markets the high positive protection rates could
reflect high marketing costs disarticulated regional markets export markets
other than Port Sudan or all three of these
For example El Obeid dura is competitive in the west Prices in the El
Fasher and Nyala markets in the Darfurs (see Table 2) were significantly above
those in other provincial markets reflecting a high demand for Sudanese dura
in Chad and the Central African Republic to alleviate the food shortages in
these countries Political unrest in the Kordofans and Darfurs kept prices
high as people stockpiled food against possible interruptions in supply The
El Obeid market and possibly the Kosti and Tendelti markets as well
30
Table 4 Nominal Protection Rates for Selected Rainfed Commodities ()a
19751976 19761977 19771978 19781979 NRP NRPc NRP b NRP c NRP b NRP NRP br NRPrd rr rrd rr rd rr rd rr
aNominal protection rate (NRP) = (pproducer pborder) - 1 Producer prices are from Table 2 Border prices taken from Table 2 and adjusted for transport costs from market to Port Sudan from Table 3
bNRPs calculated by netting road transport costs out of tie border price CNRPs calculated by netting rail transport costs out of the border price
supplied these needs El Obeid served the same function for Western Sudan and
its neighbors as Port Sudan did for the world market Thus while El Obeid is
not export competitive because of cost barriers between it and Port Sudan it
is competitive in its own region even given the high costs incurred in shipshy
ping dura to markets further west Even if links between El Obeid and
Khartoum and Port Sudan are improved the El Obeid market will probably
continue to supply the western regions rather than becoming a major supplier
of the eastern provinces and the export market
Sesame is heavily taxed in the Gedaref El Obeid and Tendelti markets
Nominal protection in Gedaref decreased from about -35 percent in 197576 to
between -50 to -65 percent from 197677-197879 In El Obeid the NRPs were
between -20 and -30 percent in 197576 and 197677 then sharply decreased to
-60 percent in 197778 and 197879 Nominal protection for sesame marketed in
Tendelti decreased from -30 percent in 197576 between 40to to 50 percent
from 197677-197879 Thus producers were confronted with greater disincen-
Lives in the last two years of the period since the effective taxation of
their output increased That the nominal protection for sesame is signifishy
cantly less than that for dura in these markets probably had a debilitating
influence on the production of sesame relative to dura The negative protecshy
tion of sesame relative to dura across widely dispersed markets may also help
to account in part for the trend towards the monoculture of dura in rainfed
agriculture and may also indicate a bias in government policies in favor of
food production and against cash crop production Given the relative riski-shy
ness of sesame production and its potential for export earnings a lower level
of taxation would appear warranted
Producers of rainfed groundnuts also faced severe disincentives in the
markets examined The gap between road and rail transport costs made little
32
difference in the El Obeid market NRPs consistently remained around -50
percent from 197576-197879 In Tendelti which is closer to Port Sudan
nominal protection decreased sharply from -40 percent in 197576 to -70
percent in 197677 then increased to about -60 percent in the last two years
of the period These NRPs which are about par with those for sesame and
significantly lower than those for dura lend credence to a pro-food cropantishy
cash crop bias in the structure of incentives in the rainfed sector
332 Net Protection Rates for Selected Rainfed Crops
The analysis of nominal protection rates did not account for the impact
on the producer of overvalued exchange rates Since an overvalued exchange
rate implicitly taxes agricultural production it decreases the nominal proshy
tection If there is negative nominal protection the overvaluation would
make the protection rate moreeven negative thereby adding to the overall
taxation of output This section presents estimates of the netprotection for
rainfed commodities which is defined as the difference between the NRPs
(Section 331) and the overvaluation of the exchange rateofficial (Section
322) The results shown in Table 5are
Since the nominal protection for sesame and groundnuts was negative in
all markets during the period the overvaluation of the exchange rate further
reduced the protection of these crops The net protectioo rates for sesame
and groundnuts were usually between -100 and -130 percent over the period A
brief example will illustrate the effect of protection rates of this magnitude
It is appropriate to use the overvaluation of the official exchange rate even though most rainfed products are traded at the effective or parallel ratebecause all trade statistics from which the border prices were taken are converted at the official rate
33
Table 5 Net Protection of Selected Rainfed Commodities ()a
aNet protection = NRP minus the percent overvaluation of the exchange rate Overvaluation of the officialexchange rate was used in these calculations because all trade statistics (from which tile border priceswere taken) are converted at this rate
bCalculated using the NRP rd entries from Table 4
CCalculated using the NRP entries from Table 4 dweighted average of overvaluations in 1978 to account for the June devaluation
eWeight-d average of overvaluations in 1979 to account for the September devaluation
on producer incomes If the net protection of a crop was -100 percent and the
producer received LS500 for his output theincreasing protection to zero
percent would add LS1000 to his revenue increasing net protection to -50
percent would double his revenue Thus negative net protection rates of this
size not only are a severe disincentive to production but also have signifishy
cant income effects
The net protection of dura marketed in Gedaref arid Kosti is generally
negative regardless of which set of transportation costs are used Although
net protection increases (becomes less negative) in these markets from
197576-197778 it decreased sharply in 197879 (see Table 5) The net
protection rates based on road transport costs for dura marketed in El Obeid
are still positive and range between 60 600 percentand over the period
Those based on rail transport costs oscillate closely about percenta zero
rate over time hence transport costs and the availability of transportashy
tion are a critical determinant in the export competitiveness of dura
34 Subsidies in the Rainfed Sector
The mechanized farming schemes are the principal recipients of subsidies
to rainfed agriculture Because of the nature of traditional farming such as
the way land is allocated (there is no private ownership of land)farm and
cultivation methods the traditional rainfed sector is not subsidized to any
extent The three types of subsidies considered in this section are exchange
rate overvaluation low land rents and credit extension by the Agricultural
Bank of Sudan (ABS)
The overvalued exchange rate implicitly subsidizes imported inputs such
as petroleum agrochemicals tractors spare Thereand parts is an
additional subsidy if the input is traded at the official rather than the
parallel rate as petroleum was Since traditional rainfed agriculture uses
35
very few imported inputs jute sacks being the primary one the mechanized
schemes were the primary beneficiaries of the implicit factar subsidies
However the recent exchange rate unification and devaluation of Noveraber 1981
eliminated this subsidy As a result the cost of production on these schemes
will rise significantly Unless there is a corresponding increase in the
prices of agricultural commodities the more inefficient private mechanized
farms will fail Thus at least in the short run the growth of +his sector
could stagnate
The low annual land rent (5 ptfeddan in 1977) has several Undesirable
effects It is far below the opportunity cost of the land (LS10feddan)
[16] Thus extensive use of the land is encouraged Low land rents are a
disincentive to capital investment in land because there is not incentive to
adopt modern technology that would exploit the land already under cultivation
The fact that horizontal expansion of the mechanized farming sector is encourshy
aged might also contribute to soil conservation problems With land essenshy
tially a free good and currently available at an almost infinitely elastic
supply there is no incentive to save that resource or augment its productivshy
ity This problem is closely related to yet another form of subsidy credit
extended by the ABS
Although not intended to be a subsidy the poor repayment of loans
extended by the ABS has transformed its loan program into a subsidy program
With land underpriced and readily available there is a tendency to use credit
to meet annual operating expenses rather than to invest in capital that would
enhance the productivity of the land A bad harvest will mean the farmer is
unable to repay the loan Since the farmer has not invested in capital
assets the bank cannot recover its money since the farmer has little incenshy
tive to repay
36
Because a primary offactor production is greatly undervalued and the
cost of entry into mechanized farming is relatively low there is little or no
penalty attached to the use of inferior complementary factors of production
such as farm management skills This increases the probability of poor pershy
formance and its consequences abandonment of cleared land that will eventushy
ally be covered by scrub thorn bushes (thereby reducing the value of the land)
and a default on payments with little or no possibility of loan recovery
rhus low land rents and subsidized credit have resulted in undercapitalshy
ization of the rainfed agricultural sector and a poor credit recovery
experience Raising land rents and tightening up the conditions under which
loans are granted might lead to thA adoption of new technology and consequentshy
ly to more intensive use of the land Productivity would increase total
output might increase even though fewer farms might be operating and soil
conservation problems would ease Additionally the increased -evenues could
be invested in developing the infrastructure which would make the marketing
and distribution systems more efficient as well as enhancing the value of the
land
35 Comparative Advantage in the Irrigated and Rainfed Sectors
In view of the current condition of the agricultural sector and Sudans
financial crisis it is important that any investments designed to rehabilishy
tate or to develop this sector be directed towards those areas and activitieshy
that will generate the largest returns A first step in this process is to
determine in which crops Sudan has a comparative advantage The domestic
resource cost (DRC) of producing a particular agricultural commodity is a good
measure of comparative advantage The DRC for an exportable good measures the
amount of foreign exchange earned when a unit of domestic resources is
37
committed to its production for an import substitute it gives the amount of
foreign exchange saved when a unit of domestic resources is used to produce
that good Since domestic resources are measured in units of local currency
and foreign exchange earnings or savings in foreign currencies the DRC for a
good is an exchaiige rate that applies to the production of that good When it
is divided by the shadow price of foreign exchange the DRC becomes a unitless
number If it is less than one the country or region has a comparative
advantage in its production because it can exchange domestic resources for
foreign exchange at a rate below that at which the economy as a whole converts
domestic resources into foreign exchange a DRC greater than one means that a
comparative disadvantage exists
Table 6 presents the DRCs of the four major export crops and the two
import substitutes in the irrigated and rainfed sectors DRCs of irrigated
crops are given for two crop years 197273 and 197677 The results show
that Sudan clearly has had a comparative advantage in the production of longshy
and medium-staple cotton and sugar Production of wheat shows a comparative
disadvantage the Sudan would have saved foreign exchange if less wheat had
been domestically produced The Sudan moved from a comparative disadvantage
in the production of irrigated dura to a competitively neutral position The
competitiveness of irrigated groundnuts also improved over the period The
DRCs of traditional and mechanized rainfed crops are also given for the
198081 crop year (with the exception of groundnuts) For each subsector
DRCs were calculated under two yield assumptions The high yield assumption
is more optimistic the low yield was assumed to be 75 percent of the high
yield in each case and better reflects past experience
The DRCs for the traditional subsector apply to crops grown in the
Nuba Mountains of Southern Kordofan This region has a strong comparative
38
--
-- ---- --
-- __
-- -- --
-- --
__
Table 6 Domestic Resource Costs of Selected Crops=
Rainfed (198081)
Traditional Traditionalb MechanizedIrriqated Modernized(Nuba Mountains Mechanized private d
State farms(Nuba Mountains)197273 197677 (Eastern Sudan)Low Yield High Yield (Eastern Sudan)Low Yield High Yield Low Yield High Yield Low Yield High Yield
aDomestic resource cost (DRC) is tile value of domestic resourc s (infeddan divided by the Sudanese pounds) committed to is a unitless number
value 3dded in world prices (US dollars) This result is the production of output from one
A value less than one then divided by the real exchange rateindicates a coaparative advantage the result a value greater than onedisadvantage indicates a comparative
Daafrom K NashashibiVol 27 No A Supply Framework1 March 1980 Tables 3 and 4 for Exchange RenrnReal exchange rates in Developing Countiesor [S050 = $1 Ihe Experience of Sudonfor 1973 and LS061 IMFStaff apers= $1 for 1977 were used asfor the shadow exchange rate proxiesin those years CData from Sudanese Consulting Bureau adapted by Sigma One Corp exceptdData fom Sudanese Consulting Bureau adapted by Sigma One Corp
for groundnuts High yields taken from SCB data low yields are 75 percent of high yields
advantage in the production of short-staple cotton dura and sesame under
both yield assumptions The modernized traditional schemes DRCs(the are
given in parentheses in Table 6) however do not fare as well low dura
yields place these schemes at a comparative disadvantage Groundnuts producshy
tion also enjoys a comparative advantage although not as great as that of
sesame dura and cotton at lower yields
The DRCs for the mechanized rainfed sector apply production in theto
province of Kassala (Eastern Sudan) Results are shown for both private farms
and state-run farms (numbers in parentheses) Both private and state-owned
mechanized schemes are competitive in the production of cotton and sesame
under both yield assumptions The state-run farms are at a comparative disadshy
vantage in dura production at both yield levels Private tenancies are compeshy
titively neutral in dura production when yields are low but have a comparashy
tive advantage at higher yields
In summary Sudan has a clear comparative advantage in cotton production
in both the irrigated and rainfed sectors The sharp decline in rainfed cotshy
ton output is attributable to the governments policy of fixing producer
prices at a level far below the world price of short-staple cotton In dura
production the traditional rainfed sector has a competitive edge over the
irrigated sector the modernized rainfed subsector and the mechanized rainfed
sector The traditional sector also has a comparative advantage relative to
the irrigated in thesector production of groundnuts Both the traditional
and mechanized rainfed subsectors show a comparative advantage in sesame proshy
duction The rainfed sector has benefited from recent policy changes These
are necessary conditions but are not sufficient to elicit major output
increases from this sector Much remains to be done in the areas of tax
reform agricultural research and improvements in the marketing system
40
SECTION 4 IMPACTS OF THE STRUCTURE OF INCENTIVES ON
FOREIGN TRADE AND THE DOMESTIC ECONOMY
The structure of incentives in the agricultural sector has directly
contributed to problems in Sudans domestic economy and in its foreign trade
position This section analyzes the recent performance of foreign trade
(Section 41) and certain aspects of the domestic economy (Section 42) The
deterioration of the economy has been caused by distortions in the structure
of incentives thus solutions to these problems are best achieved by
eliminating these distortions Section 43 examines the likelihood of meeting
the objectives set out for rainfed agriculture in the Export Action Program
given recent changes in the incentive structure
41 Recent Foreign Trade Performance
Sudans balance of payments position deteriorated drastically during the
1970s mainly as a result of a steadily worsening balance of trade In FY
1973 exports of goods and services exceeded imports by $50 million In FY
1974 there was a deficit of $280 million because of the increase in world oil
prices The trade balance continued to decline until by FY 1981 imports were
close to $2 billion while exports were just over $1 billion Much of the
deterioration in Sudans trade balance occurred because the volume of exports
declined erratically from 1974 on while import volumes were generally higher
than their 1970 level (see Table 7) Table 7 also shows that the terms of
trade contributed to the declining trade balance but were not the primary
cause The net effect of the volume and price changes was that the nominal
value of exports more than doubled from 1970 through 1979 while the nominal
value of imports more than tripled
41
Table 7 Foreign Trade Indexes
Export Indexes Import Indexes Terms of Value Volume Price Value Volume Price Trade
1970 1000 1000 1000 1000 1000 1000 1000
1971 1817 1417 1282 1179 1057 1115 1150
1972 1217 1127 1080 1088 949 1146 942
1973 1425 1118 1275 1544 1098 1406 907
1974 1518 679 2236 2291 1004 2282 980
1975 1542 781 1974 3253 1158 2809 703
1976 1808 1031 1754 3496 1249 2799 627
1977 1722 778 2214 3253 1171 2778 797
1978 2534 864 2933 3564 1089 3273 894
1979 2372 758 3129 3551 968 3668 853
Source Sudan Foreign Trade Analysis 1970-1979 Dept of Statistics Ministry of Planning May 1981
42
411 Exports
Table 8 shows the contribution of the major export crops to the total
value of exports for selected years Although the export mix has varied from
year to year cotton has always been the major export crop accounting for 50
to 60 percent of the total value of exports Groundnuts and sesame have
generally been the second and third largest contributors although in 1979
sorghum was the second largest export crop of valuein terms The irrigated
sector produced almost all the cotton that was exported while the rainfed
sector accounted for all the sorghum and sesame each sector generated roughly
equal amounts of the export value of groundnuts
As can be seen the irrigated sector alone accounted for over half the
total value of exports with the production of a single commodity cotton The
rainfed sector generated about 40 percent oF total export earnings about 15
percent of this amount was in the four major crops While its relative conshy
tribution in these crops may be small exports from the rainfed sector proshy
vided diversification in the export mix a policy objective that the governshy
ment tried to achieve in the irrigated sector with little success
The reason behind the decrease in total export volumes can be seen by
examining the export volumes of selected commodities (Table 9) The decline
over the 1970-1979 period of long-staple cotton exports from the irrigated
sector to 50 percent of their 1970 volume is the chief reason Groundnuts and
sesame exports which had been fairly strong through the late 1970s suddenly
fell off in 1979 because of production difficulties nd government policies
restricting the exports of oil Asseeds a result their contribution to the
total value of exports decreased from 23 percent in 1977 to 8 percent in 1979
(see Table 8) Dura exports grew at a phenomenal rate in 1979 the volume
was over 100 times that in 1970 This growth is attributable to a special
43
Table 8 Composition of Exports (percent of total export value)
1971 1973 1975 1977 Irrigated 1979 Rainfed Total
Cotton
Sorghurr
Groundnuts
61
1
8
55
2
9
46
2
23
57
3
13
55
-
2
2
7
3
57
7
5
Sesame 7 8 8 10 - 3 3
Cake and meal
Other a
4
19
5
21
3
18
3
14
2
-
3
23
5
23
aIncludes gum arabic livestock and all other exports
Source Export Action Program 1980-1990 Ministry of National Planning September 1980
44
Table 9 Volume Indexes for Selected Exports
Long-staple Total Cotton Dura Groundnuts Sesame Exports
1970 1000 1000 1000 1000 1000
1971 1111 19040 2060 1176 1417
1972 1111 30380 1949 1057 1127
1973 980 52164 2357 1279 1118
1974 399 49945 2208 1317 679
1975 620 24434 3496 692 781
1976 850 47744 5201 1264 1031
1977 683 67864 2725 1335 778
1978 433 32337 1665 826 864
1979 526 100143 780 215 758
Source Sudan Foreign Trade Analysis 1970-1979 Dept of Statistics Ministry of Planning May 1981
45
trade agreement with the Government of Saudi Arabia which pays a premium over
the world price for Sudanese dura Recently sorghum output has continued to
expand in response to the Saudi market and the fact that since September 1980
it has been traded at the parallel rate The 1981 sorghum crop is reported to
be a record 28 million tons 55 percent more than 1980 Even so the contrishy
bution of dura to the total value of exports only increased from 1 to 7 pershy
cent from 1971 to 1979 primarily because dura is a low value commodity
compared with cotton groundnuts and sesame Even if all the additional outshy
put for 1981 were exported the increase in the volume of dura exports could
not offset the poor export performance of other agricultural commodities The
experience with dura does however illustrate the potential of the rainfed
sector to respond to price incentives
412 Imports
Table 7 showed that the index of the value of imports increased steadily
over the 1970s rising to 35 times its 1970 level by 1979 This resulted
from increases in both the volume and prices of imports as the indexes show
Historically Sudan has spent much of its available foreign exchange on intershy
mediate goods and capital equipment which were used to develop the manufacturshy
ing sector of the economy Another important use of foreign exchange has been
to purchase food primarily wheat flour and sugar
One reason for the crop diversification program undertaken in the irrishy
gated sector in the mid 1970s was to reduce the reliance of the economy on
food imports the ultimate objective was to become a net exporter of food
From 1972 to 1974 the proportion of total export earnings spent on food
imports increased from 18 percent to 30 percent (Table 10) food imports as a
percent of total import expenditures were fairly constant at 23 percent From
1974 to 1979 foreign exchange earnings spent on food eased from 30 percent to
46
Table 10 Food Imports and Supply of Foreign Exchdnge
Total export Food imports as Food imports asFood imports earning5 percent of export percent of total
(106 $)a (106 $) earnings importsc
1972 669 3781 177 235
1973 996 4851 205 223
1974 1406 4717 298 228
1975 1524 5597 272 168
1976 1025 7284 141 133
1977 872 8437 103 95
1978 1235 8231 150 122
1979 1148 8488 135 125
aIncludes imports uf unmilled wheat rice wheat flour sugar coffee and tea Sudanese pounds converted to current US dollars at official exchange rate
bExport earnings are the sum of exports of goods and services and private and official unrequited transfers
cFrom Bank of Sudan Annual Reports 1973 1977 1979
47
14 percent of the total food declined from 23 percent to 13 percent of the
total import bill over this period This level of dependence on food imports
is high in comparison to other sub-Saharan African countries particularly
since the official statistics may not include all food aid The average ratio
of food imports to foreign exchange earnings for six other sub-Saharan African
countries over the 1965-1976 period ranged from 2 percent to 12 percent 5 out
of 6 were between 2 and 7 percent [18]
4122 Wheat and Sugar Imports The quantity price ard value indexes
for wheat and sugar inorts (the bulk of ood imports) show why expenditures
on food claimed a high proportion of the total supply of foreign exchange
(Table 11) Although the volume of wheat and flour imports declined throughshy
out most of the 1970s then increased in 1978 and 1979 to close to their 1970
levels the price rose to more than twice its 1970 in 1974level remained
there through 1978 and quadrupled in 1979 Since 1979 wheat imports have
continued to grow to a level in excess of half a million metric tons per year
Of this concessionary sales from the United States represent almost a third
The volume of sugar imports was almost 70 percent higher in 1979 than itwas
in 1970 Sugar prices peaked at 6 to 7 times their 1970 level in 1974 and
1975 then fell off to over three times the 1970 level by 1979 As a result
during the period 1973-1975 when food imports accounted for 20 to 30 percent
of total export earnings the value of wheat and flour imports was over 15
times the 1970 level while that for sugar was 4 to 7 times its 1970 level
Including concessional imports ($45 million) the 19801981 import bill for
wheat and sugar was in excess of $250 million US Even at these high levels
of wheat imports and increasing domestic output the price subsidy scheme that
maintains the price of bread artificially low has created excess demands A
48
Table 11 Import Indexes for Wheat and Sugar
Wheat and flour Sugar
Value Volume Price Value Volume Price
1970 1000 1000 1000 1000 1000 1000
1971 944 833 1133 1797 1585 1134
1972 961 961 10C0 1827 1062 1720
1973 1570 868 1809 3558 1635 2176
1974 1506 504 2988 5798 962 6027
1975 1620 610 2656 7428 1051 7068
1976 1420 551 2577 4133 1142 3619
1977 1226 598 2050 2379 1348 1765
1978 1644 753 2183 4424 1822 2428
1979 3780 951 3975 5467 1689 3237
Source Sudan Foreign Trade Analysis 1970-1979 Dept of Statistics Ministry of Planning May 1981
49
factor that has contributed to this is that wheat aiJ sugar were traded at the
overvalued exchange rate which helped maintain the prices of these commodities
at the artifically low levels
4122 Bread Price Policy Bread provides approximately one-third of
the calorie requirements for the population of the greater Khartoum conurbashy
tion Per capita consumption of wheat has been rising rapidly in the last few
years with about a third of the officially marketed wheat being consumed in
the Khartoum conurbation This increase cannot be explained by increased
incomes and growing urbanization It must in large part be attributable to an
explicit cheap bread policy for the urban dwellers Table 2 presents the
budget shares for bread for different income groups in Khartoum Even for the
lowest income group bread represents only 111 percent of food expenditures
and less than 7 percent of total expenditures Even if these figures exclude
food away from home for workers bread represents a high zhare of nutrients
and in relation to this a rather low share of food costs
Exchange rate unification the PL480-III Agreement with the United States
and negotiations with international lenders have placed pressure on the
government to raise the price of bread If import parity pricing were to be
applied to wheat and flour the price of bread would need to be increased by
about 80 percent Reportedly the government intends to raise the price of
bread by close to this amount (66 percent)
This has undoubtedly been a politically difficult decision but its real
impact should not be as great as the current political manifestations would
suggest if the demand for bread is totally inelastic in the short run the
The material sectionin this touches on several issues that will be more thoroughly analyzed in the forthcoming wheat pricing study being conducted by Sigma One Corporation
50
Table 12 Budget Shares of Bread
Income group Share of
Food expenditures Share of
Total expenditures
() ()
Urban Khartoum (3 towns)
All Groups 1061 620
lt 500 LS 1107 689
500-1000 1072 672
1000-2000 1106 678
2000-3000 1045 571
3000+ 854 400
Rural i oum
All Groups 406 274
lt 500 LS 410 313
500-1000 453 312
1000-2000 432 208
2000-3000 NA NA
3000+ 075 053
Source Department of Statistics Ministry of Planning Household Budget Survey 1979
51
cost of living impact will be about 5 percent in real terms for the lowest
income strata in Khartoum If bread is somewhat price elastic the cost of
living impacts are even lower In this case the consumption impacts would
reduce calorie intake by approximately 10 percent for consumers at the FAO
requirements and less for those above it Since there is little indication
that urban Khartoum h-s serious nutritional problems (save for the refugee
population) the deleterious impacts on human nutrition are likely to be
small
The timing for these actions is fortuitous in that Sudan has experienced
a bumper crop in dura and world wheat prices are depressed With exchange
rate unification and import parity pricing the domestic producer price of
LS16750 per ton will not change much This should enable significant savings
in treasury costs ($50 to $60 million) by eliminating the so-called producers
subsidy It is also reasonable to expect substitution of wheat demand for
dura consumption With these policy changes the growth in import demand for
wheat should be slowed The USAID PL480 Title III Program which was supportshy
ing the implicit subsidy can under the new policy regime facilitate the
transition to lower reliance on food imports by continuing the supply without
requiring an increase in the foreign exchange allocations to food imports
42 Fiscal and Monetary Impacts
Much of the impact of the structure of incentives on fiscal problems and
excessive growth of the money supply has occurred through the performance of
parastatal or public entities The poor performance of these state-run corshy
Concern for consumption and nutritional impacts on low-income and othershywise at-risk populations could be more effectively addressed through alternashytives such as the CRS Title II program
52
porations over the past several years created a growing demand for public
sector credit thereby exacerbating the governments budgetary problems and
forcing it to turn increasingly to external sources of credit to finance the
resulting deficits
Table 13 contains a breakdown of the money supply for FY 1975-FY 1980
The supply of money increased from LS277 million in 1975 to over LS1 billion
in 1980 at a compounded growth rate of 29 percent per year This is a primary
factor underlying the high rate of inflation Net claims on the public secshy
tor which comprises the central government local and provincial councils
and parastatal entities was the primary reason from LS250 million in 1975
they grew at an annual rate of 31 percent to over LS970 million in 1980 The
parastatals which include the agricultural and industrial entities and the
public utilities accounted for a substantial portion of the net claims on the
public sector The claims against these bodies increased from LS105 milshy
lion in 1975 to over LS240 million in 1980 growing at 20 percent perover
year Since their growth rate was lower than that of the money supply the
proportion of net claims on the parastatals to the money supply declined from
38 percent to 24 percent over the period Besides being inflationary public
sector borrowing of this magnitude crowds out private borrowing and thereby
inhibits the capitalization of the private sector
Of the parastatal entities the agi-icultural corporations and boards
receive the largest share of bank credit with the public utilities and the
industrial boards a distant second and third respectiely The boards conshy
trolling the irrigation schemes accounted for most of the credit extended to
agriculture by the banking sector Of LS140 million in 1977 these boards
received about LS120 million in 1980 they received LS205 million in credit
against a total of LS215 million [11] On the other hand credit extended to
53
aTable 13 Components of the Money Supply (LS millions)
1975 1976 1977 1978 1979 1980
Net foreign -10716 -19265 -19176 -21805 -20126 -28890 assets
Net claims on private sector 17569 23900 26447 31837 40724 52590
Net claims on public sector 25001 35773 51735 65826 84935 97160
Central government and local and proshyvincial councils 14512 24064 41339 54824 65973 72820
Total money supply b 27656 33233 46579 60667 82098 100250
Net claims on parashystatals as percentof money supply 379 352 223 181 231 243
aAll figures apply to end of the fiscal year (June 30)
bSum of net foreign assets net claims on private sector net claims on public sector and other items
Sources Bank of Sudan Annual Report 1977 1979 IMF Sudan-Recent Economic Developments SM8170 March 1981
54
the Mechanized Farming Corporation the only parastatal body directly involved
in rainfed crop agriculture increased from LS10 million in FY 1977 to
LS26 million in FY 1980
Rainfed agriculture is relatively isolated from the publiL sector
course it benefits (or suffers) from the performance of the largest public
utility Sudan Railways And most of the loans granted by the Agricultural
Bank of Sudan a government-controlled financial entity go to the rainfed
sector Thus any policy changes affecting the organization or financial
status of the parastatals would affect this sector primarily through its
credit availability and its marketing and distribution system Policy changes
would not be likely to directly affect the viability or productivity of the
sector as a whole as would changes in the boards operating the irrigation
schemes
As discussed above the subsidies on wheat and sugar are a drain on the
Treasury It is estimated that eliminating them would save between $50 and
$60 million per year This would reduce the budget deficit and consequently
ease inflationary pressures A smaller deficit would also mean less public
sector borrowing which would help the private sector by allowing more private
borrowing
43 The Export Action Program Potential of the Rainfed Sector
The Export Action Program (EAP) of 1980 outlines an ambitious program to
promote exports from the irrigated and rainfed sectors over the next 10 years
thereby increasing foreign exchange earnings and eventually solving Sudans
balance of payments problems The proposed program for the rainfed sector is
not as detailed or extensive as the one for the irrigated sector which in the
main calls for rehabilitating the existing schemes It is forthrightly
55
admitted that the specific constraints to raising productivity in the rainfed
sector have not yet been identified and that it is not known whether the conshy
straints once identified can be overcome [12] The plan recognizes that
labor constraints in the rainfed sector mean that more capital investment is
needed if the 1990 targets are to be met However the capital requirements
are small compared with those for the irrigated sector Public sector investshy
ment of LS160 million is planned over the next 5 to 7 years most of this
outlay will be directed towards agricultural research and pilot projects In
addition the EAP recognizes the rainfed sectors need for improved infrashy
structure in particular adequate transport and marketing facilities as well
as adequate supplies of good seeds and credit
The EAP lists projects and policies undertaken or planned for the benefit
of rainfed agriculture and then gives the 1990 export target for each of
the major rainfed products These targets are actually estimates of export
availabilities which were derived by setting production targets and netting
out estimates of increased consumption seed waste etc The production
targets for the major rainfed crops except gum arabic are presented in Table
14 along with the targeted increases in cropped areas and yields that would
enable the targets to be met This section analyzes the feasibility of the
targets in light of the past performance of the rainfed sector the
constraints on its potential performance and how the recent policy changes
might relax those constraints
Examination of the production targets in Table shows more14 that
reliance is placed on horizontal expansion than on vertical expansion The
annual growth rates for areas cropped in groundnuts sesame dura and cotton
are roughly twice the growth rates of yields A policy aimed at intensifying
56
Table 14 Rainfed Crop Production Targets
Groundnuts Area (000 fed) Yield (kgfed) Production (000 tons)
Sesame Area (000 fed) Yield (kgfed) Production (000 tons)
Dura Area (000 fed) Yield (kgfed) Production (000 tons)
Cotton Area (000 fed) Yield (Kantarfed)a Production (000 tons)
aKantar = 143 kg
Source Export Action Programme
September 1980
Required1978-1979 annual average 1990 growth rate ()
1976 2950 38 262 328 20 517 967 58
2058 2860 30 104 122 15 214 350 46
6246 9540 39 300 353 15
1846 3370 56
164 530 113 09 20 75
21 150 196
1980-1990 Ministry of National planning
57
the use of areas presently under cultivation would result in growth rates of
yields that significantly exceeded the growth rates of areas cropped Given
the vast areas of arable land not yet under cultivation and the relatively
small amount of capital investment allocated to the rainfed sector over the
next decade a policy that implicitly relies on horizontal expansion to meet
the targets might be reasonable
However infrastructure constraints are more likely to confound such a
policy In particular expanding horizontally will increase the demand for
transportation If the planned extension of the road system is insufficient
to meet future needs it will be a major obstacle to the EAP since most of the
increased production of cotton groundnuts and sesame are intended for the
export market Without an adequate transport system the western markets will
remain isolated from the world market and increased output will only tend to
depress producer prices
Although the EAP does not specify precisely how much expansion is
targeted for each province some of this information is given for sesame
production dura output from mechanized farms and groundnuts production from
traditional farms The results show that cropped areas in Kassala particushy
larly the Gedaref area are expected to increase by 600 thousand feddans or
26 percent over the decade Cropped areas should expand by over 13 million
feddans or 130 percent in the central provinces of the Blue Nile and Whte
Nile A substantial increase of 12 million feddans almost 50 percent is
also anticipated for the western provinces about equally divided between the
Kordofans and the Darfurs
Plans to extend the road system involve all these provinces The highway
from Port Sudan to Khartoum passes through the Gedaref region in addition
58
five feeder roads in the area are under consideration In the Blue Nile the
Wad Medani-Sennar road has been completed and roads from Sennar to Damazin
(an important mechanized farming region) and from Sennar to Kosti are under
construction Of three planned roads in the Kordofans the El Obeid-Dubeibat
road is under construction and the En Nahud-Abu Zabad and Habila-Dubeibat
roads are being negotiated In the Darfurs a road connecting Nyala and El
Fasher has been budgeted A road From Nyala through Kas and Zalingei and
ending northwestern borderat the town of Geneina is currently under conshy
struction Whether these roads will adequately serve the future needs of
these provinces is not known At a minimum however all the roads that have
been budgeted negotiated for or are under construction need to be completed
paoticularly if the targets in the central and western provinces are to be
met
Even if the targeted expansion in cropped areas occurs greater producshy
tivity in the form of increased yields is needed if the output targets for the
rainfed sector are to be achieved Although the Sudan has had an agricultural
research program for several years it has had little impact on rainfed
farmers because extension services are practically nonexistent The current
research program needs to be continued and expanded and much more effort needs
to be made to get research results to Sincethe farmer a major weakness of
the extension service is a shortage of trained personnel a policy initiative
designed to (or train)attract qualified people would seem appropriate An
effective extension service providing the best available information on cultishy
vation techniques and seed varieties is required for sustained improvements in
rainfed sector yields
59
Other policies have been implemented or are under consideration to
improve the structure of incentives in the rainfed sector These incluae the
unification and devaluation of the exchange rates and the removal of the
export duties on cotton and sesame Abolishing the monopoly of the Sudan Oilshy
seeds Company in exports of oilseeds resulted in substantial increases in
groundnuts seeds and oil shipments during the third quarter of 1981 [9]
In the public sector the ABS is being strengthened through the IDAshy
financed Agricultural Services Project which calls for an outlay $300 million
over the rest of the century Under its auspices the ABS will be reorganized
so that it can provide more credit to the rainfed sector as well as more
tractors and spare parts Tax incentives under the Agricultural Investments
Act of 1976 include concessions to private investors who operate huge mechanshy
ized farms (between 250 thousand and 500 thousand feddans) The size of these
farms means that their location must be very carefully considered so that the
already shaky relations between the nomads and the mechanized farmers are not
exacerbated [16] A policy of dubious merit is the government encouragement
of producer cooperatives as the most efficient means of getting credit to
smallholder farmers and to insure greater private control of resources Howshy
ever past experience with cooperatives does not support this optimistic conshy
clusion they usually break down after a few months [16]
The best way of realizing the potential of the rainfed sector still
remains untapped however because of the governments policy of fixing the
purchase prices for rainfed cotton sesame and groundnuts The government
recognizes what a severe disincentive this is it recently doubled the purshy
chase price of rainfed cotton from LS260 per small kantar to LS700 in
belated recognition of the fact that for years the internal price of shortshy
staple cotton has been far below the international price As discussed in
60
Section 33 the production and marketing system operates very effectively
given the tremendous infrastructure constraints it is faced with Commodities
like dura and millet whose prices are relatively free from government intershy
ference move from surplus to deficit areas as reflected in price differenshy
tials both within the country and from the country to the world market Oilshy
seeds and oil exports increased once the Sudan Oilseeds Company was forced to
compete with the private trading sector Removal of government intervention
in market prices would narrow the wedge between producer and world prices
improve producer incomes and realize some of the potential--at little or no
cost--of the rainfed sector
61
SECTION 5 CONCLUSIONS AND RECOMMENDATIONS
In the past 10 years the performance of the agricultural sector
deteriorated especially in the irrigated schemes causing severe problems for
Sudans domestic economy and its foreign exchange reserves Since land is not
the limiting factor it seems reasonable that the productivity levels of the
early 1970s are realizable through an improved structure of incentives with
consequent improvements in the domestic economy and Sudans foreign trade
position Recent experience indicates that the rainfed sector has the
potential and ability to respond to improved incentives
Throughout the 1970s rainfed agriculture was expanding for all annual
crops except cotton through increases in cropped areas Recent rapid
increases in sorghum production which are believed to be a response to an
improving structure of incentives have principally been achieved through area
expansion Yields in sorghum have generally been stagnant at rather low
levels While further area expansion can undoubtedly be realized there
appears now an opportunity for increasing output through the intensification
of production in existing In this research andareas regard agricultural
enhanced availability of modern factors of production could play a key role in
facilitating private farmers abilities to respond to the improved incentives
generated by recent policy initiatives The realization of this potential
would however require effective public sector delivery of research results
and substantial improvements in factor markets
In the latter half of the decade irrigated areas sown to cotton and
other crops decreased absolutely as a result of the disincentive effects of
the joint account system and the reduced revenues of the management boards of
62
the irrigated schemes The experience in the irrigated sector during the
1970s illustrates that it is not sufficient to direct resources towards a
sector without the same theat time providing appropriate incentives for
farmers to make effective use of the publicly-provided resources That is
research infrastructure and agricultural services will not lead to
productivity increases if the incentives facing farmers have the effect of
taxing away the value of the publicly-provided resources
The terms of trade were not the primary cause of the deteriorating
balance of payments situation Rather the growth in value of imports far
outstripped the growth in value ot exports The chief reason is the decline
in cotton output This is not surprising since cotton production faced the
most severe disincentives The motivation for the direct and explicit
taxation of cotton may have been to secure operating revenues for the governshy
mlent and the parastatals but in so doing the disincentives were so severe
that the revenue base was eroded This experience emphasizes needthe for
extensive tax reform in the Sudan
Tax reform is under considerzion and some changes have been made For
example the export duties on cotton and sesame have been removed the removal
of the duties on groundnuts and livestock products is under consideration
Other reform measures should be directed towards increasing the buoyancy and
progressivity of the tax system for example by eliminating specific taxes
Since September 1979 the parallel exchange rate was minimally overshy
valued if not in fact undervalued some of the time By placing many
of the tradeables on the parallel rate in September 1980 the Sudan has
removed one of the most important sources of distortions to the structure of
incentives With the exchange rate Lnification and devaluation of November 9
1981 the potential for aligning the valuation of domestic resources with
63
their international valuation has been created Under this new regime
official price interventions will need to be stated explicitly and fiscal
budget implications clearly identified For example the overvaluation of the
official exchange has tendedrate to mask the economic and budgetary cost of
Sudans cheap bread policy Under the new regime the Sudan may choose to
continue to subsidize the price of bread but the amount and source of the
subsidy will need to be explicitly stated in the fiscal budget In so doing
budget planners will be better able to gauge the opportunity cost of the
resources allocated to the bread subsidy In the past a substantial portion
of the implicit subsidy for bread was borne by domestic wheat producers yet
the accounting figures made it appear as if wheat producers were being
directly subsidized Furthermore with multiple exchange rates for wheat and
sorghum the relative prices for wheat versus sorghum were inverted from their
usual international price relationship In the absence of the special sorghum
export arrangements to Saudi Arabia this condition would have been a serious
distortion and disincentive to both domestic wheat and sorghum production
The other side of exchange rate unification relates to higher factor
costs (petroleum prices) in mechanized agriculture and in the transportation
system This will tend to shift back the supply of agricultural output from
the more modern subsectors Since sorghum has been at the paralleltraded
rate since September it is possible much the1980 that of response to
improved pricing has already been realized Thus major supply increases
should not be expected result from exchange rate unification per se Thisto
policy reform however does create an environment which makes it more
possible for resources to be utilized efficiently This should in turn
create incentives for investment and innovation
64
Indirect estimates of marketing costs for dura in the West suggest that
even if transport links between El Obeid and Khartoum and Port Sudan are
improved the El Obeid market will probably continue supply the westernto
regions rather than becoming a major supolier of the eastern provinces and the
export market This result is important because much has been made of the
need to rehabilitate the rail system and to extend the road systen in the
investments toWest such need be carefully evaluated because the anticipated
flow of produce (dura) may not be forthcoming This is not to say that
enhancement of the transport system may not be warranted but that higher
returns may possibly be obtained from intraregional connections in the West
than from linking the West to the more developed East An important caveat to
be considered in this regard is the thinness and instability of the markets to
the West
The exchange rate unification and devaluation of November 9 1981 has
eliminated the implicit subsidies to petroleum agrochemicils and spare
parts The costs of production in the mechanized farming schemes and the
irrigated sector are expected to rise in proportion to the product of the
devaluation and the share of costs represented by these previously subsidized
factors The devaluation will have little impact in reducing the negative
nominal protection facing the rainfed sector (with the exception of rainfed
cotton)
In the absence of other changes in the structure of incentives output
from this sector is likely to decline at least in the short run To dampen
this potentially deleterious impact a combination of further tax reform (such
as removing all remaining export duties) and public sector initiatives that
enhance the productivity of the sector a whole egas accelerated
agricultural research to increase the productivity of the scarce factors of
65
production (agrochemicals labor and for the irrigated sector water) and
reduction of any technical and economic inefficiencies in the marketing
system Our estimates of nominal protection reveal the likelihood that
marketing margins are high
Low land rents and subsidized credit have resulted in undercapitalization
of the rainfed agricultural sector a poor creditand recovery experience
Raising land rents and tightening up the conditions under which loans are
granted might lead to the adoption of new technology and consequently to more
intensive use of the land Productivity would increase total output might
increase even though fewer farms might be operating and soil conservation
problems would ease Additionally the increased revenues could be invested
in developing the infrastructure which would make the marketing and distrishy
bution systems more efficient as well as enhancing the value of the land
The Sudan should n)t lose the current opportunity to remove an important
distortion in the market for food and realize Treasury and foreign exchange
savings by eliminating the implicit and explicit subsidies on wheat and sugar
Three favorable conditions exist--a bumper crop in domestic sorghum production
depressed international prices for wheat and sugar and substantial concesshy
sionary assistance through the wheat imports from the US under the PL 480
Title III Program--whch minimize the deleterious cost livingof and
nutritional impacts on the urban minority which has become dependent on these
subsidies The long term impacts of removing the subsidies should be
beneficial to the majority of Sudanese that are engaged in agricultural
production
66
Sudan has a clear comparative advantage in cotton production in both the
irrigated and rainfed sectors The sharp decline in rainfed cotton output is
attributable to the governments policy of fixing producer prices at a level
far below the world price of short-staple cotton In dura production the
traditional rainfed sector has a competitive edge over the irrigated sector
the modernized rainfed subsector and the mechanized rainfed sector The
traditional sector also has a comparative advantage relative to the irrigated
sector in the production of groundnuts Both the traditional and mechanized
rainfed subsectors show a comparative advantage in sesame production The
rainfed sector has benefited from recent policy changes These are necessary
conditions but are insufficient to cause major output increases from rainfed
agriculture Much remains to be done in the areas of tax reform agricultural
research and improvements in the marketing system
67
REFERENCES
1 Acharya Shankar N Incentives for Resource Allocation A Case Studyof Sudan World Bank Staff Working Paper No 367 Washington DC December 1979
2 Alibaruho George Prospects for Production and Export of Food in theSudan A Cautionary Note Working Paper 789CGFPI International Food Policy Research Institute Washington DC March 1978
3 Bank of Sudan Annual Reports 1973 1977 1979 Khartoum The Democratic Republic of the Sudan
4 Department of Agricultural Economics Ministry of Agriculture Food andNatural Resources Current Agricultural Statistics Vol 1 No 3 Khartoum June 1979
5 Department of Statistics Ministry of Planning Sudan Foreign Trade Analysis 1970-1979 Khartoum May 1981
6 Arl 1981Internal Trade Statistics and Price Indices 1978 Khartoum April 1981
7 Due John F Rail and Road Transport in the Sudan Faculty WorkingPaper No 423 (Transportation Paper No 15) University of Illinois at Urbana-Champaign July 1977
8 The Tax Structure of the Democratic Republic of Sudan WithEmphasis on the Indirect Taxes and Potential Reforms Parts A and BFaculty Working Papers Nc 419 and 420 University of Illinois at Urbana-Champaign July 1977
9 The Economist Intelligence Unit Ltd Quarterly Economic Review of Sudan4th Quarter 1980 1st Quarter 1981 3rd Quarter 1981 London
10 Food and Agriculture Orgarization of the United Nations Sudan Report of FAO Programming Mission October 1980
11 International Monetary Fund Unpublished data
12 Ministry of National Planning Export Action Programme 1980-1990 Khartoum September 1980
13 Nashashibi K A Supply Framework for Exchange Reform in DevelopingCountries The Experience of budan IMF Staff Papers Vol 27 No 1 March 1980
14 Picks Currency Yearbook Sudanese Pound New York 1979 pp581-586
68
15 Scobie Grant M Investment in International Agricultural Research Some Economic Dimensions World bank Staff Working Paper No 361Washington DC October 1979
16 Simpson IG and Morag C Simpson Alternative Strategies for AgriculturalDevelopment in the Central Rainlands of the Sudan Rural Development StudyNo 3 University of Leeds 1978
17 Sudan Gezira Board Statistical Bulletin No 2 Barakat March 1981
18 Valdes A and P Konandreas Assessing Food Insecurity Based onNational Aggregates in Developing Countries in Food Security forDeveloping Countries ed Alberto Valdes Westview Press 1981
19 The World Bank Accelerated Development in Sub-Saharan Africa An Agenda for Action Washington DC 1981
20 The Basic Economic Progam Address by HE President Gaafar Mohamed Nimeiry November 9 1981
69
LIST OF TABLES
Table Page
1 Overvaluation of the Exchange Rates 24
2 Producer Prices of Selected Rainfed Crops by Provincial Market (LSton) 28
3A Transportation Costs (ptton km) 29
3B Distances of Markets to Port Sudan (km) 29
4 Nominal Protection Rates for Selected Rainfed Commodishyties 31
5 Net Protection of Selected Rainfed Commodities () 34
6 Domestic Resource Costs of Selected Crops 39
7 Foreign Trade Indexes 42
8 Composition of Exports 44
9 Volume Indexes for Selected Exports 45
10 Food Imports and Supply of Foreign Exchange 47
11 Import Indexes for Wheat and Sugar 49
12 Budget Shares of Bread 51
13 Components of the Money Supply (LS millions) 54
14 Rainfed Crop Production Targets 57
1
2
3
4
5
6
LIST OF FIGURES
Figure Page
Area Planted in Export Crops 7
8
Area Planted in Import Crops 12
Average Yields of Export Crops
Average Yields of Import Crops 13
Area Planted inMillet 16
Average Yields of Millet 17
SECTION 1 INTRODUCTION
11 Purpose
The problems that have plagued Sudans economy ever the past 10 years are
inextricably linked to the performance of the agricultural sector Any
solution to those problems must therefore be based on revitalizing that
sector The potential is there The productivity of the sector in the past
demonstrates what could be achieved again How can the performance of the
sector be improved so that this potential is realized The most efficient and
effective way is to improve the structure of incentives within agriculture
that is the signals to which producers respond that are generated by the tax
system exchange rate policies prices of agricultural commodities government
subsidies and activities of parastatal organizations
The exact characteristics of the structure of incentives depend on the
nature of agricultural production which in the Sudan encompasses both irrishy
gated and rainfed agriculture The irrigated sector includes the governmentshy
controlled and private schemes along the banks of the Blue Nile White Nile
and Nile River Initially these projects were devoted solely to the
production of cotton Sudans major export During the 1970s the government
changed the cropping pattern and introduced wheat sorghum (dura) and
groundnuts The rainfed sector is the rest of the country This report
however focuses on rainfed agriculture in the North because this region has
the highest potential for improving the countrys economic situation in the
near term Major products of this sector include gum arabic livestock
groundnuts dura millet (dukhn) and sesame For the most part these are
produced by traditional farming methods which are labor intensive and use few
1
imported inputs such as fertilizers and pesticides In recent years some
mechanized farming schemes have been developed in the rainfed sector in the
North These schemes now account for one-half of total dura production and
about 25 percent of the total output of this sector [12] Mechanized farms
use more imported inputs mainly tractors fuel and spare parts for land
preparation and planting Weeding and harvesting of most crops are still done
by hand
The purpose of this report is to examine the structure of incentives
facing producers in the agricultural sector in particular rainfed agriculshy
ture The irrigated sector has been extensively analyzed and has always
received the lions share of funds invested in agricultural development The
rainfed sector has been neglected relative to the irrigated sector Yet
rainfed agriculture provides the Sudan with a diversified export mix supplies
it with several important food grains and oilseeds has the potential of
making Sudan self-sufficient in food production and is the major source of
employment By contributing to growth in the rainfed sector it is possible
to improve the incomes of the majority of the population which constitutes the
bulk of the private sector in the Sudan
In addition to examining the structure of incentives we will analyze its
impacts on rainfed agricultural productivity and the domestic economy over the
past decade and attempt to estimate how recent policy changes will enhance
productivity improve the performance of the domestic economy and ameliorate
the balance of payments problems by increasing foreign exchange earnings
Finally we suggest USAID activities that will aid and support the government
of Sudan in its efforts to increase the rainfed sectors contribution to
economic growth export earnings and improved producer incomes
2
12 Setting
Agriculture is the major productive activity in the Sudan It generates
35-40 percent of the gross domestic product The crop-producing subsector
contributes about 40 percent of this amount the livestock and forestry
suosectors account for most of the remainder Agriculture employs over
two-thirds of the labor force It supplies over 95 percent of total exports
by value The industrial sector primarily comprises industries that process
agricultural products eg textiles sugar vegetable oils Other large
sectors of the economy notably wholesale and retail trade and transport and
communications either service the agricultural sector or are major users of
its outputs Thus the performance of this sector dptermines the performance
of the domestic economy as well as Sudans foreign trade position Consequentshy
ly government policies and international and domestic events that affect
agriculture will be quickly transmitted throughout the economy and will have
direct impacts in Sudans foreign exchange reserves
In some respects Sudans economy performed well during the 1970s
relative to other sub-Saharan African countries [19] Sudans gross domestic
product (GDP) grew at an annual rate of 43 percent during the 1970-1979
period compared with 29 percent for sub-Saharan Africa (16 percent if
Nigeria is excluded) Sudans current account deficit declined from 86
percent of GDP in fiscal year (FY) 1976 to 61 percent in FY 1980 by
contrast the ratio for oil-importing African countries was higher and only
decreased slightly from 95 percent in 1975 to 92 percent in 1980 Per
capita GNP in 1979 was $370 compared with $411 for sub-Saharan Africa
In other important respects however Sudans economy lagged far behind
the average performance of the sub-Saharan African countries [19] Export
volumes from Sudan declined at an annual rate of 44 percent over the
3
1970-1979 period compared with an overall decline of 08 percent per year for
the other countries The growth of import volumes during this period 45
percent per year exceeded the 33 percent annual growth rate for sub-Saharan
Africa As a result Sudans trade balance deteriorated rapidly from a $50
million surplus toin FY 1973 a $1 billion deficit in FY 1981 The current
account balance which includes trade in invisibles moved from a surplus of
$14 million in FY 1973 to a deficit of $543 million in FY 1980 As scarce
foreign exchange reserves dwindled and budget deficits increased the governshy
ment increased its borrowing from outside sources the external debt increased
from $12 billion in 1975 to over $3 billion in 1980 [9] or approximately 30
percent of GDP over this period Interest and principal payments on external
debt as a percent of total export earnings (the debt service ratio) declined
from 20 percent in 1975 to 11 percent in 1977 then increased to 21 percent by
1980 it reportedly rose to about 50 percent by the end of 1980 [9] By
contrast the debt service ratio for all oil-importing African countries rose
from 8 percent in 1977 to 16 percent in 1980 Finally real GOP which
increased by almost 6 percent in FY 1978 declined by 12 and 06 percent in
FY 1979 and FY 1980 respectively primarily a result of decreases in the
output of the agricultural sector [11]
In spite of this mixed picture the prospects for improvement are good
The country has extensive unrealized natural and human potential and its
leadership has amanifested commitment towards efficiency by encouraging
market mechanisms as the principal means for resource allocation [20] The
costs of this transition will be high and may have extensive redistributive
effects Well-targeted and -executed external assistance can assist the Sudan
in achieving the transition to growth and efficiency in an equitable manner
4
SECTION 2 RECENT PERFORMANCE OF THE AGRICULTURAL SECTOR
The output of Sudans major crops (except cotton) increased during the
197C-1981 period through an expansion of cropped areas in the rainfed sector
in the irrigated sector there was no growth in areas planted Yields were
either declining or stagnant in both sectors Both the yield and the area
cropped in cotton fell over this period resulting in a decrease in total
output Among the tradeable commodities the major export crops (exportables)
discussed in this section are cotton dura groundnuts and sesame two crops
grown entirely in the irrigated sector wheat and sugar are termed import
substitutes because all domestic production offsets imports of these comshy
modities Millet a major food grain is generally a nontraded good
The total area planted in the export crops increased from 8 million
Feddans in 196970 to 12 million feddans in 198081 at an annual average
growth rate of 4 percent The increase of 4 million feddans occurred entirely
in the rainfed sector the area cropped in the irrigated schemes was about 2
million feddans in 196970 and 198081 dlthough it did peak at approximately
26 million feddans in 197576 Irrigated areas planted in wheat and sugar
rose from 300 thousand feddans to 500 thousand feddans during the same period
representing an average growth rate of just under 5 percent per year
However this increase was not large enough to offset the decrease in
irrigated areas devoted to cotton While there is little if any physical
competition for resources between these crops and cotton the structure of
incentives (including the joint account system) was such that cotton declined
by 42 per cent in the period The contribution of areas cropped and yields to
total output of the export crops the import substitutes and the nontraded
commodity is examined inmore detail in the following sections
5
21 Export Crops
Figures 1 and 2 show the cropped and average yields for the majorareas
export crops from 196970 to 198081 During the period the area planted in
seed cotton declined at an annual rate of 13 percent from 13 million feddans
in 196970 to 11 million feddans in 198081 Average yields also declined at
a rate of 36 percent per year from 540 kgfeddan to 360 kgfeddan As a
result production of seed cotton fell 48 percent arnually from 675 thousand
tons in 196870 to 390 thousand tons in 198081 Since the area planted in
rainfed cotton is approximately 10 percent of the total or 100 thousand
feddans the poor performance of cotton production is concentrated in the
irrigated sector
Total cropped areas in the irrigated schemes rose during the first half
of the decade from 20 to 26 million feddans then gradually fell to its
original level of 20 million feddans by 198081 The expansion of irrigated
land from 196970 to 197576 occurred because new schemes were brought into
production The decrease in total cotton output was a result of a change in
government policy which also affected the production of other irrigated crops
To promote export crop diversification and food self-sufficiency the governshy
ment in 1974 began diverting land away from cotton and into other crops
notably groundnuts wheat and dura At the Fme time it did not change the
financial relationship between the tenant farmers and the management boards of
the irrigated schemes nor did it alter its cotton trade policies Hence all
operating costs of the schemes regardless of what crops were grown were
charged to the cotton account tenants continued to receive 49 percent of the
net proceeds from the sale of cotton while collecting all receipts from the
sale of other crops an explicit export tax on cotton applied and cotton
was traded at overvalued official exchange rates
6
Figure 1 AREA PLANTED IN EXPORT CROPS
AREA 7270
(000 feddans) 196970 -- 198081
15 0 - Sorg hum
6230
5730
5210 I
J
-
4700 --
4190
2430shy
1920---- Groundnuts
Sesame
1410-----gllD
I1 1 U I
---------- ----oto - - - -Cotton
I 1 5 i
I I
6970 70 71 72 73 74 75 76 77 78 79 8081
YEAR
Source Food and Agriculture Organization of the United Nations Sudan October 1980
Report of FAO Programming Mission
196970 -- 198081 YIELD (kgfeddan)
610_
- - 506 -~ i
454 -
402 4 0 2
Ground uts
350 ___ 298298 ]
_ -
~------ N -- - ---- - ~
-
--
C Sorghum
Srgu
246 Co
194
142
90 - Sesame lllilriilli~ v i l ii l I r~ vil r I I
69170 70 71 72 73 74 75 76 77 78 79 8081
YEAR Source Food and Agriculture Organization of the United Nations Sudan Report of FAO Programming Mission
October 1980
This policy implicitly taxed export crop production by the amount of the overshy
valuation (see Section 32) Diversification into groundnuts and wheat meant
these crops were competing with cotton for the available irrigation water
between November and January Cotton production fell thus reducing the
revenues that normally accrued to the management boards and the government
As operating expenses were also rising the resulting operating deficits had
to be financed by borrowing from the banking system a process which fueled
inflation (see Section 42) As a result of the fall in cotton exports
foreign exchange reserves declined This meant that the necessary maintenance
of the schemes could not be performed Machinery and spare parts could not be
obtained the irrigation canals began to fill with weeds further restricting
water availability Thus areas cropped in groundnuts and dura also declined
by nea-ly 300 thousand feddans between 197576 and 197879 while yields for
these commodities did not significantly improve This exacerbated the decline
in performance of the irrigated sector Thus there was a shift away from
cotton production resulting in a decrease in total output of that crop at the
same time total irrigated area fell during the latter half of the decade
resulting in absolute decreases in the areas planted in the crops which were
being grown in place of cotton
The output of groundnuts doubled in the decade of the 1970s with most of
the increase coming from area increases in the rainfed sector In the Gezira
scheme of the irrigated sector the area planted in groundnuts increased from
151 thousand feddans in 196970 to 424 thousand feddans in 197576 then fell
sharply to 229 thousand feddans by 197980 this represents an average annual
growth rate of 43 percent over the decade In the Gezira average yields
increased from 350 kgfeddan in 196970 to 1500 kgfeddan in 197576 then
9
declined to 1200 kgfeddan in 197980 [17] These yields are two to four
times the yields in the traditional rainfed sector and the annual growth rate
of 13 percent in irrigated yields far outstrips the very slight improvement in
rainfed groundnut yields However during this period the traditional
rainfed sector produced between 50-70 percent of total output [12] Available
data for 197576-197879 indicate that the area cropped in groundnuts in the
rainfed sector accounted for 75-85 percent of tne total area [14] The total
area planted in groundnuts doubled during 196970-198081 from 11 million
feddans to 22 million feddans growing at an annual rate of 68 percent Of
the 11 million feddans brought under groundnuts cultivation during the
1970s the irrigated sector accounted for 100 thousand feddans or 9 percent
of the total increase Although yields fluctuated widely over this period
there was no sustained growth so that 198081 saw little improvement on the
average yield of 360 kgfeddan in 196970 Thus the increase in output from
390 thousand tons in 196970 to 800 thousand tons in 198081 came entirely
from the expansion in areas cropped primarily in the rainfed sector
The mechanized rainfed sector produces about 50 percent of total dura
output Traditional rainfed agriculture accounts for another 40 percent and
the remaining 10 percent is produced in the irrigated sector The total area
cropped grew at an annual rate of 45 percent from 42 million feddans in
196970 to 68 million feddans in 198081 The average yield declined over
the period by 1 percent annually from 340 kgfeddan to 310 kgfeddan As a
result sorghum production increased from 15 million tons in 196970 to 21
million tons in 198081 at a rate of 35 percent per year The increases in
area cropped and output occurred almost entirely in the rainfed sector partishy
cularly the mechanized farms In the Gezira scheme the area cropped in dura
10
increased on average at 12 percent annually from 290 thousand feddans in
196970 to 327 thousand feddans in 197980 while there was only nominal
growth in yields of 06 percent per year from 470 kgfeddan to 500 kgfeddan
The expansion of areas cropped in the irrigated sector accounted for only 1
percent of the additional 26 million feddans brought under cultivation
although it represented over 10 percent of the additional 216 thousand tons
produced
Sesame is grown in both the mechanized and the traditional rainfed
sectors The area cropped increased at an average annual rate of 36 percent
from 14 million feddans in 196970 to 20 million feddans in 198081
Average yields however declined by almost 2 percent per year from 130
kgfeddan to 100 kgfeddan so that output only increased from 180 thousand
tons to 210 thousand tons or at an annual rate of 17 percent
With the exceptiog of groundnuts the performance of the irrigated sector
was generally weaker than that of the rainfed sector Although yields are
significantiy higher in the irrigated sector they did not as a rule improve
much over time combined with the lack of growth in cropped areas production
from this sector was lackluster These results especially the increases in
areas cropped could be explained as the combined effect of two phenomena
(1) government policie3 that discriminated against the irrigated sector relashy
tive to the rainfed sector even though the bulk of public sector investment
in agriculture has been directed towards the irrigated sector and (2) the atshy
tempts of rainfed agricultural producers to maintain their incomes and to inshy
sure food security in the presence of declining yields
22 Import-substitute Crops
The major import substitutes wheat and sugar are grown only in the irrishy
gated sector Figures 3 and 4 depict cropped areas and yields respectively
11
--
196970 -- 198081 AREA (000 feddans)
745
690 - 635
N N
580 shy
525
470 -47
Wheat 415
360 shy
305 ~
250 -- Sugar
15shy
6970 70 71 72 73 74 75 76 77 78 79 8081
YEAR Source Food and Agriculture Organization of the United Nations Sudan Report of FAO Prograuing Mission
October 1980
---
Figure 4 AVEPAGE YIELDS OF IMPORT CROPS
196970 -- 198081YIELD (kgfeddan)
3500
3340 -
3200
3060
2920 --
2780 jI
2640 IfIt S I
2500 _ _-Sugar
586 7_ - Z-
Z- - -- Wheat300
1hh I hhh13001 I a m1 I1I I111111I 1 11s1aual I I Irl j
6970 70 71 72 73 74 75 76 77 78 79 8081
YEAR
Source Food and Agriculture Organization of the United Nations Sudan Report of FAO Programming Mission October 1980
for wheat and sugar Because of the government-directed cropping pattern
described above the plantedarea in wheat increased from about 300 thousand
feddans in 196970 to a peak of 700 thousand feddans in 197576 it then fell
to about 450 thousand feddans by 198081 as maintenance problems increased in
the irrigated schemes Over the decade wheat yields improved only slightly
from 400 kgfeddan in 196970 to 500 kgfeddan in 198081 an annual growth
rate of 21 percent As a result of increases in cropped areas and yields
wheat production grew at a rate of 61 percent from 115 thousand metric tons
to 220 thousand metric tons Areas planted in sugar rose from 30 thousand
feddans in 196970 to over 50 thousand feddans in 197980 an annual increase
of 62 percent Yields rose from 25 tonsfeddan in 196970 to around 35
tonsfeddan in the early 1970s then fell off and stabilized at 25
tonsfeddan during the latter part of the 1970s As a result production of
sugar increased over the decade from 75 thousand to 130 thousand metric tons
at an average annual growth rate of 58 percent
Although the production of wheat and sugar rose over the decade primarily
because of an increase in cropped areas it was not nearly enough to satisfy
domestic demand The government policy of import substitution fell far short
of its objective and this level of output was achieved at a cost higher than
would have been incurred had an amount equal to domestic production been
imported Sudans general comparative disadvantage in wheat production has
been central to the recent debates on agricultural policy This will be
discussed inmore detail in Section 4
23 Millet The Nontraded Good
Millet is an important food staple in Western Sudan All of it is proshy
duced in the rainfed sector Very little is exported and none is imported
It is considered a nontraded commodity since the market for it clears domestishy
14
cally The area cropped in millet rose steadily during the early 1970s from
15 million feddans to about 25 million feddans it peaked in 197879 at 3
million feddans but in the last two crop years declined to around 26 million
feddans (Figure 5) Millet yields declined fairly steadily throughout the
first half of the decade from 260 kgfeddan to about 160 kgfeddan since then
they increased erratically to their current level of 190 kgfeddan in 198081
(Figure 6) As a result of these two effects the total output of millet
increased from just under 300 thousand metric tons in 196970 to just under
500 thousand metric tons in 198081 Among the major grains and oilseeds
grown in the Sudan (groundnuts sesame dura wheat) output of millet has
generally ranked third behind dura and groundnuts In terms of areas cropped
only dura exceeded that for millet Thus while it has little value as an
export millet is an important foodgrain and should figure significantly into
any policies designed to achieve food self-sufficiency and improve rural
incomes
Millet sorghum groundnuts and -esame all typify the performance of the
rainfed sector Output increases have been achieved through increases in
areas cropped in the presence of declining or st3gnant yields
15
I~bll --- l~kd1UI
AREA (000 feddans)
3000
2750shy
2500shy
2250shy
2000shy
1750shy
1500-
I II 1 1 111 1 11aI aIi 1
697 70 71 72 73 74 75 76
YEAR Source Food and Agriculture Organization of the United Nations Sudan
October 1980
1 I I I I I III I I11 1I7
77 78 79 8081
Report of FAO Programming Mission
Figure 6 AVERAGE YIELDS OF MILLET
196970 198081 YIELD (kgfeddan)
250
225
200
175
ISOshy
125
100
6970 70 71 72 73 74 75 76 77 78 79 8081
Source YEAR
Food and Agriculture Organization of the United Nations Sudan Otober 1980
Report of FAO Proqramning Mission
SECTION 3 THE STRUCTURE OF INCENTIVES
The structure of incentives comprises the tax system exchange rate
policies prices of agricultural commodities and government intervention in
the markets for agricultural inputs and outputs such as subsidy programs and
parastatal involvement in the production and distribution system This strucshy
ture affects resource allocation decisions in agriculture because it generates
a real price or cost for every input and output to which producers respond
It determines the performance of the sector any problems can best be solved
by changing the structure Although some elements of the incentive structure
are common to all subsectors within agriculture the precise characteristics
vary with the type of production system For example the joint account
system used in the irrigated schemes governed tenants decisions regarding
which crops would receive their time and resources but it did not directly
affect producers in the rainfed sector The purpose of this section is to
examine the structure of incentives in the traditional and mechanized rainfed
sectors
Rainfed agriculture has historically been a part of the private sector
unlike the irrigated schemes While private agriculture can benefit from
increased government support (for example improvements in the infrastructure
and agricultural research) it has been responsive to price incentives
Rainfed producers are more responsive to market forces than producers in irrishy
gated schemes Public sector investment designed to improve the functioning
of provincial markets including the development and dissemination of agrishy
cultural research results and marketing information would capitalize on the
intrinsic strength of the rainfed sector and yield high returns to relatively
small outlays
18
31 The Tax System
Tax revenues have consistently provided at least 80 percent of total censhy
tral government revenue since the mid-1970s [8] Of this amount indirect
taxes have accounted for about 80 percent direct taxes on income and profits
f-r 10-15 percent and export duties for 5-10 percent The heavy reliance on
indirect taxes is unusual for an African country [8] To better understand
how the tax system affects the agricultural sector the discussion in this
section focuses theon incidence of direct and indirect taxes on exports
imports and domestic production (The implicit taxation from exchange rate
overvaluation is discussed in Section 32) It should also be noted that this
discussion is primarily descriptive others have studied the tax system
extensively and made recommendations for its reform and improvement [1 8] A
principal recomnendation includes eliminating specific taxes in favor of ad
valorem taxes to increase both the buoyancy of the tax system and its proshy
gressivity Although some reform would be desirable the present tax system
is not a significant explicit disincentive to producers in the rainfed sector
especially traditional producers
311 Exports
Exports are taxed directly through export duties and indirectly through
the development tax Export duties are ad valorem taxes There are several
rates most between 5 and 15 percent in the past the rate for a specific
commodity has varied widely from year to year The duty on cotton was elishy
minated in 1980 as was the duty on sesame Exports )f dura are currently
taxed at 25 percent millet groundnut cottonseed cottenseed and sesame
cake and vegetable oils are taxed at 15 percent Livestock and livestock
products are taxed at rates of 5 10 14 15 20 and 25 percent A developshy
ment tax of 5 percent (essentially a manufacturers sales tax) currently
19
applies to exports of all commodities Thus for any export there will be a
wedge of at least 5 percent Lp to a maximum of 30 percent between world and
domestic producer prices
312 Imports
Imports are subject to customs duties consumption duties and the
defense tax The combined levies on imports account for about 50 percent of
total tax revenues [8] Customs duties alone generated around 40 percent of
all tax revenues they comprise 25 ad valorem rates (the basic rate is 40
percent) and 16 specific rates Development items are generally taxed at the
lower rates while the highest rates (100 to 900 percent) are applied to
luxury items Consumption duties applied to beer cigarettes matches motor
fuel and lubricating oil are equivalent to the excise taxes levied on
domestic production Prior 1979to the 5 percent development tax applied to
all imports except wheat and flour medicines and milk for babies This was
lifted in 1979 and a 5 percent defense tax took its place In March 1981
the defense tax was increased to 10 percent
The rainfed sector unlike the irrigated sector uses few imported inputs
and is thus relatively immune from the impacts of these taxes Seeds insectishy
cides and agricultural machinery were exempted from customs duties in 1976
Imports of urea and other fertilizers were taxed at 5 percent and sacks and
bags at 12 percent However many of the inputs to the transportation sector
are subject to import dutieF railway rails (10 percent) diesel fuel (15
percent) railway equipment parts (20 percent) freight cars (25 percent)
tires and trucks (30 percent) petroleum and all other railway equipment (40
percent)
Except for millet and sorghum many agricultural commodities are taxed at
rates designed to protect domestic production Wheat and wheat flour are
20
taxed at 25 percent refined sugar at 30 percent rice cottonseed and oil
cake at 40 percent bread at 50 percent groundnuts raw sugar and all other
grains at 70 percent Inexplicably several commodities subject to customs
duties are either directly subsidized (wheat flour sugar bread) or used in
heavily subsidized industries (rail transport) The subsidies on wheat and
sugar are currently being phased out [20]
313 Taxes on Domestic Production
Taxes levied on domestic production include the 5 percent development
tax a complicated system of 33 categories of excise taxes employing both ad
valorem and specific rates and local taxes Specific excise taxes are
applied to the production of wheat flour vegetable oils and sugar the
development tax would only apply to an agricultural commodity if it were
processed--vegetable oils for example Local taxes (ushur) are levied on the
output of mechanized farms in the west and southwest they are an important
source of revenue for the regional governments The amount of the tax varies
from region to region but is usually between 10 and 15 percent Detailed
information on these taxes is not available local taxes are a disincentive
because they drive a wedge between the demand and the supply price and
farmers revenues are generally decreased
32 The Exchange Rate System
Exchange rate policies are a critical factor in the structure of incenshy
tives facing agriculture An overvalued exchange rate has two important
effects First it discourages the production of exportables and import
substitutes because the prices (in domestic currency) received by producers
are below those they would receive if the exchange rate were at its market
equilibrium Second it stimulates the demand for imports by effectively
lowering the prices domestic consumers have to pay
21
321 Exchange Rate History
Prior to March 1972 the official exchange rate at which all commodities
were traded was fixed at $287 = LS1 (LS0348 = $1) In March 1972 a de
facto devaluation of 15 percent was accomplished thro gh an exchange subsidy
for receipts and an exchange tax on payments this established an effective
exchange rate of $250 = LS1 (LSO4 = $1) that applied to all transactions
except exports of cotton and gum arabic In May 1975 gum arabic exports were
moved to the effective rate A second devaluation took place in June 1978
The official rate was fixed at $250 = LS1 and the effective rate was
devalued to $200 = LSl (LSO50 = $1) by increasing the exchange taxsubsidy
rate Cotton remained the only commodity traded at the official rate all
other exports and all imports were converted at the effective rate
In September 1979 a third devaluation occurred The official rate was
fixed at $200 = LS1 (the old effective rate) The exchange taxsubsidy proshy
gram was eliminated and a parallel rate was established in its place at
$125 - LS1 (LS08 = $1) At the same time however the list of comshy
modities and transactions converted at the official rate was expanded to
include government transfers essential imports invisibles and traditional
exports such as cotton groundnuts dura and sesame Only nontraditional
exports (about 8 percent of the total) and imports previously brought in under
the nil value license system (approximately 30 percent of the total) were
traded at the new parallel rate Thus this devaluation did little to
stimulate traditional exports or curb imports
One year later in September 1980 many of the commodities traded at the
official raue were shifted to the parallel rate The official rate still apshy
plied to cotton wheat flour sugar petroleum pharmaceuticals and powdered
milk During the third quarter of 1981 cotton was finally transferred to the
list of commodities traded at the parallel rate
22
On November 9 1981 the two-tiered system of exchange rates was replaced
by a unified system and devalued to $111 = LS1 (LS09 = $1) [20] This
policy change corrected one of the greatest distortions in the structure of
incentives in the agricultural sector by eliminating much of the overvaluation
that characterized the exchanqe rate system in the past This point is
discussed further in the following section
322 Overvaluation of the Exchange Rate
An overvalued exchange rate implicitly taxes exports and subsidizes
imports by an amount equal to the overvaluation This section presents
estimates of the overvaluation of the official and effective (or parallel)
exchange rates results usedThe are in estimating the net protection of
three important rainfed crops (Section 33)
A purchasing-power-parity appr-oach was used to convert nominal exchange
rates to rel rates This iovolved selecting an appropriate base year
obtaining an estimate of the real rate in the base -ear and calculating a set
of deflators The year 1972 was selected as the base because in FY 1973 (1
July 1972 - 30 June 1973) the current account was almost in balance with a
small surplus of LS500 thousand An estimate of the real exchange rate in
1972 was obtained from PicKs Currency Index [14] by averaging the black
market rates for that year The deflator for Each year is the ratio of two
ratios the numerator is the ratio of Sudans CPI for the year of interest to
the CPI in 1972 the denominator is the ratio of the IBRD world inflation
index in the year of interest to the index in 1972 The real exchange rate
for a given year is the product of the deflator for that year and the real
exchange rate in 1972 The amount of overvaluation in each year was calcushy
lated as the percentage difference between the real and nominal exchange rates
The results which are presented in Table 1 should not be interpreted as
23
Table 1 Overvaluation of the Exchange Rates
Official Effective (parallel) Over- Over-
Nominal Real a valuationb Nominal Real a valuationb (LS$) (LS$) (M) (LS$) (LS$) (M)
Pre June 0348 0640 839 0400 0640 600 Post June 0400 0640 600 0500 0640 280
1979
Pre September 0400 0731 828 0500 0731 462 Post September 0500 0731 462 0800 0731 -86
1980 0500 0819 638 0800 0819 24
1981 Pre November 0500 - - 0800 - -Post November 0900 - 0900 -
aThe 1972 black market rate from Picks Currency Index (LS0516=$1) was assumed to
be the real exchange rate in that year Real rates for the remaining years were calculated using the consumer price index for Sudan (1975 = 100) CPI S the IBRD world inflation index (1975 100) CPI W1 and the followiig formula
C CPIW i 72
i 72E -E S W where E is the real exchange rateCP172 CPI 1 in year i
E - E
Overvaluation x 100 where E is the nominal exchange rate in year i E 1
24
estimates of the shadow exchange rate because the prices of traded commodities
are included in the Sudanese and world CPIs in the deflator A shadow
exchange rate would reflect price changes in Sudans home (nontraded) goods
relative to price changes in the home goods of its major trading partner for
example the EEC However such indexes were not available so the estimates
of real exchange rates were used as proxies for shadow exchange rates
The results show that exports traded at the official rate were implicitly
taxed at rates between 40 and 80 percent imports brought in at this rate were
subsidized by equivalent amounts Until September 1979 when the parallel rate
was established the amount of overvaluation ranged from 25 to 60 percent
The parallel rate was slightly undervalued (9 percent) but because most comshy
modities were shifted to the official rate at that time the implicit tax
(subsidy) on exports (imports) was over 40 percent During 1980 the parallel
rate was only slightly overvalued Thus trading many commodities at the
parallel rate removed much of the implicit taxation or subsidization
However the tax rate on cotton and the subsidy rate for wheat flour sugar
petroleum and pharmaceuticals climbed to over 60 percent since these
commodities were traded at the official exchange rate Although price indexes
for 1981 are not available the unification and devaluation of the exchange
rates in November 1981 probably brought the nominal exchange rate closer to
the real price of foreign exchange since inflation in Sudan has reportedly
been higher than the world inflation rate Since all of Sudans exports from
the rainfed sector have been traded at close to the real price of foreign
exchange since September 1980 the November 1981 exchange rate regime will not
significantly boost exports from this sector The major impact will tobe
increase the price of petroleum thereby inflating transportation costs
25
33 Pricing and Marketing of Selected Rainfed Crops
In a perfectly competitive economy agricultural producers would receive
100 percent of the world market price net of an efficient marketing margin
for their output Divergences from this ideal are introduced by exchange rate
overvaluations or undervaluations government taxes and subsidies and inshy
flated marketing margins If the net effect of these factors raises producer
prices above world prices positive protection exists and producers are
effectively subsidized by the amount of the difference between world and
domestic prices If the net effect is to depress producer prices relative to
world prices the protection is negative and producers are effectively taxed
by the amount of the price difference The purpose of this section is to
estimate the net protection of dura sesame and groundnuts in three proshy
vincial markets over time and examine the policy implications of the results
The net protection rate is the difference between the nominal protection
rate (NRP) and the amount of exchange rate overvaluation The NRP for a
commodity captures the effects of government taxes and subsidies on the output
of that commodity it is the percentage difference between the domestic
producer price and the world (border) price adjusted to reflect transport and
marketing costs Estimates of the NRPs are presented in Section 331 In
Section 332 these are combined with the effect of the overvalued exchange
rate (Section 322) to arrive at an estimate of the net protection for the
major rainfed crops
331 Nominal Protection Rates
Four markets in three provinces were selected for analysis The Gedaref
market in Kassala (Eastern Sudan) is one of the largest markets for dura and
sesame El Obeid in Northern Kordofan is a major trading center for Western
26
Sudan dura sesame and groundnuts are among the commodities marketed In
the White Nile Province (Central Sudan) Kosti represents a major market for
dura while large quantities of sesame and groundnuts are traded in Tendelti
All four markets are linked by rail to Khartoum and Port Sudan
Producer prices in these markets for the crop years 197576-197879 are
presented in Table 2 There is considerable variation both across markets in
a given year and across time in a given market In general prices are higher
in the western markets than in the central and eastern markets These
variations reflect differences in transportation costs production costs
demand conditions and levels of marketed surpluses The producer prices of
dura in El Fasher (Northern Darfur) which are significantly higher than the
prices in other markets are also presented to support a conclusion that will
be drawn from the analysis of the NRPs below
The cost of transportation from the market to Port Sudan must be netted
out of the border price of each commodity to determine the border price facing
the producer or the export parity price Ideally other marketing costs
such as storage handling and commissions should also be netted out this
information was not available so the marketing margin is not treated in this
analysis Two sets of transprotation costs were estimated one for road
transport by lorries and one for rail transport (see Table 3A) Rail
transport costs were assumed to be 50 percent of road transport costs no
attempt was made to calculate transportation costs by commodity These costs
which are given in piasters per ton kilometer were multiplied by the distance
of each market from Port Sudan (Table 36) and the result was suotracted from
the border prices of the commodities to determine the export parity prices
The percentage difference between the producer and export parity prices of a
commodity is the nominal protection rate for that commodity these are preshy
27
Table 2
Dura
aPort Sudan (FOB)
Gedaref
El Obeid
Kosti
El Fasher
Sesame
aPort Sudan (FOB)
Gedaref
El Obeid
Tendelti
Groundnuts
Port Sudan (FOB)a
El Obeid
Tendelti
Producer Prices of Selected Rainfed Crops by Provincial Market (LSton)
19751976 19761977 19771978 19781979
434 453 540 885
178 277 356 411
461 527 451 1181
224 210 477 412
733 1365 1097 1255
1841 2037 2601 4040
1112 691 1147 1566
1250 1332 816 1409
1205 857 1292 2079
1371 2176 2091 2827
624 973 805 1079
700 546 765 974
Sources Internal Trade Statistics and Price Indices 1978 Department of Statistics Ministry of Planning April 1981
Sudan Foreign Trade Analysis 1970-1979 Department of Statistics Ministry of Planning May 1981
aExport (border) prices FOB Port Sudan in LSton converted at official exchange rate
28
Table 3A Transportation Costs (ptton km)a
RailbRoad
1976 14 07
1977 20 10
1978 30 15
1979 35 18
Sources John F Due Rail and Road Transport in the Sudan Faculty Working Paper No 423 Universityof Illinois at Urbana-Champaign July 1977 Thurvald Moe World Bank
aRates assumed to be the same for all commodities
bAssumed to be one-half the road transport costs
Table 3B Distances of Markets to Port Sudan (km)
Road Rail
Gedaref (Kassala) 852 800
El Obeid (N Kordofan) 1613 1537
Kosti (White Nile) 1512 1217
Tendelti (White Nile) 1624 1313
29
sented in Table 4 Because not all marketing costs could be identified these
estimates understate positive protection and overstate negative protection
Most of the NRPs for dura marketed in Gedaref are negative Nominal
protection tended to increase (the NRPs became less negative) from 197576
through 197778 but decreased sharply in 197879 However NRPs for dura
marketed in El Obeid and Kosti paint a different picture Both NRP estimates
for the El Obeid market show high levels of positive protection those based
on road transport costs range between 120 and 700 percent while those based
on rail transport costs are between 40 and 90 percent The results for dura
traded in Kosti are mixed the NRPs based on road transport costs are conshy
sistently positive (between 1 and 450 percent) while those based on rail
transport costs are negative for all years (around -37 percent) except
197778 Since a positive NRP implies that the producer is receiving more
than the world market price dura from El Obeid and Kosti could not be
competitive on the export market Saudi Arabia has recently been importing
Sudanese dura at a premium above the world price but this does not account
for the positive NRPs in the earlier years Since there were no explicit
subsidies in these two markets the high positive protection rates could
reflect high marketing costs disarticulated regional markets export markets
other than Port Sudan or all three of these
For example El Obeid dura is competitive in the west Prices in the El
Fasher and Nyala markets in the Darfurs (see Table 2) were significantly above
those in other provincial markets reflecting a high demand for Sudanese dura
in Chad and the Central African Republic to alleviate the food shortages in
these countries Political unrest in the Kordofans and Darfurs kept prices
high as people stockpiled food against possible interruptions in supply The
El Obeid market and possibly the Kosti and Tendelti markets as well
30
Table 4 Nominal Protection Rates for Selected Rainfed Commodities ()a
19751976 19761977 19771978 19781979 NRP NRPc NRP b NRP c NRP b NRP NRP br NRPrd rr rrd rr rd rr rd rr
aNominal protection rate (NRP) = (pproducer pborder) - 1 Producer prices are from Table 2 Border prices taken from Table 2 and adjusted for transport costs from market to Port Sudan from Table 3
bNRPs calculated by netting road transport costs out of tie border price CNRPs calculated by netting rail transport costs out of the border price
supplied these needs El Obeid served the same function for Western Sudan and
its neighbors as Port Sudan did for the world market Thus while El Obeid is
not export competitive because of cost barriers between it and Port Sudan it
is competitive in its own region even given the high costs incurred in shipshy
ping dura to markets further west Even if links between El Obeid and
Khartoum and Port Sudan are improved the El Obeid market will probably
continue to supply the western regions rather than becoming a major supplier
of the eastern provinces and the export market
Sesame is heavily taxed in the Gedaref El Obeid and Tendelti markets
Nominal protection in Gedaref decreased from about -35 percent in 197576 to
between -50 to -65 percent from 197677-197879 In El Obeid the NRPs were
between -20 and -30 percent in 197576 and 197677 then sharply decreased to
-60 percent in 197778 and 197879 Nominal protection for sesame marketed in
Tendelti decreased from -30 percent in 197576 between 40to to 50 percent
from 197677-197879 Thus producers were confronted with greater disincen-
Lives in the last two years of the period since the effective taxation of
their output increased That the nominal protection for sesame is signifishy
cantly less than that for dura in these markets probably had a debilitating
influence on the production of sesame relative to dura The negative protecshy
tion of sesame relative to dura across widely dispersed markets may also help
to account in part for the trend towards the monoculture of dura in rainfed
agriculture and may also indicate a bias in government policies in favor of
food production and against cash crop production Given the relative riski-shy
ness of sesame production and its potential for export earnings a lower level
of taxation would appear warranted
Producers of rainfed groundnuts also faced severe disincentives in the
markets examined The gap between road and rail transport costs made little
32
difference in the El Obeid market NRPs consistently remained around -50
percent from 197576-197879 In Tendelti which is closer to Port Sudan
nominal protection decreased sharply from -40 percent in 197576 to -70
percent in 197677 then increased to about -60 percent in the last two years
of the period These NRPs which are about par with those for sesame and
significantly lower than those for dura lend credence to a pro-food cropantishy
cash crop bias in the structure of incentives in the rainfed sector
332 Net Protection Rates for Selected Rainfed Crops
The analysis of nominal protection rates did not account for the impact
on the producer of overvalued exchange rates Since an overvalued exchange
rate implicitly taxes agricultural production it decreases the nominal proshy
tection If there is negative nominal protection the overvaluation would
make the protection rate moreeven negative thereby adding to the overall
taxation of output This section presents estimates of the netprotection for
rainfed commodities which is defined as the difference between the NRPs
(Section 331) and the overvaluation of the exchange rateofficial (Section
322) The results shown in Table 5are
Since the nominal protection for sesame and groundnuts was negative in
all markets during the period the overvaluation of the exchange rate further
reduced the protection of these crops The net protectioo rates for sesame
and groundnuts were usually between -100 and -130 percent over the period A
brief example will illustrate the effect of protection rates of this magnitude
It is appropriate to use the overvaluation of the official exchange rate even though most rainfed products are traded at the effective or parallel ratebecause all trade statistics from which the border prices were taken are converted at the official rate
33
Table 5 Net Protection of Selected Rainfed Commodities ()a
aNet protection = NRP minus the percent overvaluation of the exchange rate Overvaluation of the officialexchange rate was used in these calculations because all trade statistics (from which tile border priceswere taken) are converted at this rate
bCalculated using the NRP rd entries from Table 4
CCalculated using the NRP entries from Table 4 dweighted average of overvaluations in 1978 to account for the June devaluation
eWeight-d average of overvaluations in 1979 to account for the September devaluation
on producer incomes If the net protection of a crop was -100 percent and the
producer received LS500 for his output theincreasing protection to zero
percent would add LS1000 to his revenue increasing net protection to -50
percent would double his revenue Thus negative net protection rates of this
size not only are a severe disincentive to production but also have signifishy
cant income effects
The net protection of dura marketed in Gedaref arid Kosti is generally
negative regardless of which set of transportation costs are used Although
net protection increases (becomes less negative) in these markets from
197576-197778 it decreased sharply in 197879 (see Table 5) The net
protection rates based on road transport costs for dura marketed in El Obeid
are still positive and range between 60 600 percentand over the period
Those based on rail transport costs oscillate closely about percenta zero
rate over time hence transport costs and the availability of transportashy
tion are a critical determinant in the export competitiveness of dura
34 Subsidies in the Rainfed Sector
The mechanized farming schemes are the principal recipients of subsidies
to rainfed agriculture Because of the nature of traditional farming such as
the way land is allocated (there is no private ownership of land)farm and
cultivation methods the traditional rainfed sector is not subsidized to any
extent The three types of subsidies considered in this section are exchange
rate overvaluation low land rents and credit extension by the Agricultural
Bank of Sudan (ABS)
The overvalued exchange rate implicitly subsidizes imported inputs such
as petroleum agrochemicals tractors spare Thereand parts is an
additional subsidy if the input is traded at the official rather than the
parallel rate as petroleum was Since traditional rainfed agriculture uses
35
very few imported inputs jute sacks being the primary one the mechanized
schemes were the primary beneficiaries of the implicit factar subsidies
However the recent exchange rate unification and devaluation of Noveraber 1981
eliminated this subsidy As a result the cost of production on these schemes
will rise significantly Unless there is a corresponding increase in the
prices of agricultural commodities the more inefficient private mechanized
farms will fail Thus at least in the short run the growth of +his sector
could stagnate
The low annual land rent (5 ptfeddan in 1977) has several Undesirable
effects It is far below the opportunity cost of the land (LS10feddan)
[16] Thus extensive use of the land is encouraged Low land rents are a
disincentive to capital investment in land because there is not incentive to
adopt modern technology that would exploit the land already under cultivation
The fact that horizontal expansion of the mechanized farming sector is encourshy
aged might also contribute to soil conservation problems With land essenshy
tially a free good and currently available at an almost infinitely elastic
supply there is no incentive to save that resource or augment its productivshy
ity This problem is closely related to yet another form of subsidy credit
extended by the ABS
Although not intended to be a subsidy the poor repayment of loans
extended by the ABS has transformed its loan program into a subsidy program
With land underpriced and readily available there is a tendency to use credit
to meet annual operating expenses rather than to invest in capital that would
enhance the productivity of the land A bad harvest will mean the farmer is
unable to repay the loan Since the farmer has not invested in capital
assets the bank cannot recover its money since the farmer has little incenshy
tive to repay
36
Because a primary offactor production is greatly undervalued and the
cost of entry into mechanized farming is relatively low there is little or no
penalty attached to the use of inferior complementary factors of production
such as farm management skills This increases the probability of poor pershy
formance and its consequences abandonment of cleared land that will eventushy
ally be covered by scrub thorn bushes (thereby reducing the value of the land)
and a default on payments with little or no possibility of loan recovery
rhus low land rents and subsidized credit have resulted in undercapitalshy
ization of the rainfed agricultural sector and a poor credit recovery
experience Raising land rents and tightening up the conditions under which
loans are granted might lead to thA adoption of new technology and consequentshy
ly to more intensive use of the land Productivity would increase total
output might increase even though fewer farms might be operating and soil
conservation problems would ease Additionally the increased -evenues could
be invested in developing the infrastructure which would make the marketing
and distribution systems more efficient as well as enhancing the value of the
land
35 Comparative Advantage in the Irrigated and Rainfed Sectors
In view of the current condition of the agricultural sector and Sudans
financial crisis it is important that any investments designed to rehabilishy
tate or to develop this sector be directed towards those areas and activitieshy
that will generate the largest returns A first step in this process is to
determine in which crops Sudan has a comparative advantage The domestic
resource cost (DRC) of producing a particular agricultural commodity is a good
measure of comparative advantage The DRC for an exportable good measures the
amount of foreign exchange earned when a unit of domestic resources is
37
committed to its production for an import substitute it gives the amount of
foreign exchange saved when a unit of domestic resources is used to produce
that good Since domestic resources are measured in units of local currency
and foreign exchange earnings or savings in foreign currencies the DRC for a
good is an exchaiige rate that applies to the production of that good When it
is divided by the shadow price of foreign exchange the DRC becomes a unitless
number If it is less than one the country or region has a comparative
advantage in its production because it can exchange domestic resources for
foreign exchange at a rate below that at which the economy as a whole converts
domestic resources into foreign exchange a DRC greater than one means that a
comparative disadvantage exists
Table 6 presents the DRCs of the four major export crops and the two
import substitutes in the irrigated and rainfed sectors DRCs of irrigated
crops are given for two crop years 197273 and 197677 The results show
that Sudan clearly has had a comparative advantage in the production of longshy
and medium-staple cotton and sugar Production of wheat shows a comparative
disadvantage the Sudan would have saved foreign exchange if less wheat had
been domestically produced The Sudan moved from a comparative disadvantage
in the production of irrigated dura to a competitively neutral position The
competitiveness of irrigated groundnuts also improved over the period The
DRCs of traditional and mechanized rainfed crops are also given for the
198081 crop year (with the exception of groundnuts) For each subsector
DRCs were calculated under two yield assumptions The high yield assumption
is more optimistic the low yield was assumed to be 75 percent of the high
yield in each case and better reflects past experience
The DRCs for the traditional subsector apply to crops grown in the
Nuba Mountains of Southern Kordofan This region has a strong comparative
38
--
-- ---- --
-- __
-- -- --
-- --
__
Table 6 Domestic Resource Costs of Selected Crops=
Rainfed (198081)
Traditional Traditionalb MechanizedIrriqated Modernized(Nuba Mountains Mechanized private d
State farms(Nuba Mountains)197273 197677 (Eastern Sudan)Low Yield High Yield (Eastern Sudan)Low Yield High Yield Low Yield High Yield Low Yield High Yield
aDomestic resource cost (DRC) is tile value of domestic resourc s (infeddan divided by the Sudanese pounds) committed to is a unitless number
value 3dded in world prices (US dollars) This result is the production of output from one
A value less than one then divided by the real exchange rateindicates a coaparative advantage the result a value greater than onedisadvantage indicates a comparative
Daafrom K NashashibiVol 27 No A Supply Framework1 March 1980 Tables 3 and 4 for Exchange RenrnReal exchange rates in Developing Countiesor [S050 = $1 Ihe Experience of Sudonfor 1973 and LS061 IMFStaff apers= $1 for 1977 were used asfor the shadow exchange rate proxiesin those years CData from Sudanese Consulting Bureau adapted by Sigma One Corp exceptdData fom Sudanese Consulting Bureau adapted by Sigma One Corp
for groundnuts High yields taken from SCB data low yields are 75 percent of high yields
advantage in the production of short-staple cotton dura and sesame under
both yield assumptions The modernized traditional schemes DRCs(the are
given in parentheses in Table 6) however do not fare as well low dura
yields place these schemes at a comparative disadvantage Groundnuts producshy
tion also enjoys a comparative advantage although not as great as that of
sesame dura and cotton at lower yields
The DRCs for the mechanized rainfed sector apply production in theto
province of Kassala (Eastern Sudan) Results are shown for both private farms
and state-run farms (numbers in parentheses) Both private and state-owned
mechanized schemes are competitive in the production of cotton and sesame
under both yield assumptions The state-run farms are at a comparative disadshy
vantage in dura production at both yield levels Private tenancies are compeshy
titively neutral in dura production when yields are low but have a comparashy
tive advantage at higher yields
In summary Sudan has a clear comparative advantage in cotton production
in both the irrigated and rainfed sectors The sharp decline in rainfed cotshy
ton output is attributable to the governments policy of fixing producer
prices at a level far below the world price of short-staple cotton In dura
production the traditional rainfed sector has a competitive edge over the
irrigated sector the modernized rainfed subsector and the mechanized rainfed
sector The traditional sector also has a comparative advantage relative to
the irrigated in thesector production of groundnuts Both the traditional
and mechanized rainfed subsectors show a comparative advantage in sesame proshy
duction The rainfed sector has benefited from recent policy changes These
are necessary conditions but are not sufficient to elicit major output
increases from this sector Much remains to be done in the areas of tax
reform agricultural research and improvements in the marketing system
40
SECTION 4 IMPACTS OF THE STRUCTURE OF INCENTIVES ON
FOREIGN TRADE AND THE DOMESTIC ECONOMY
The structure of incentives in the agricultural sector has directly
contributed to problems in Sudans domestic economy and in its foreign trade
position This section analyzes the recent performance of foreign trade
(Section 41) and certain aspects of the domestic economy (Section 42) The
deterioration of the economy has been caused by distortions in the structure
of incentives thus solutions to these problems are best achieved by
eliminating these distortions Section 43 examines the likelihood of meeting
the objectives set out for rainfed agriculture in the Export Action Program
given recent changes in the incentive structure
41 Recent Foreign Trade Performance
Sudans balance of payments position deteriorated drastically during the
1970s mainly as a result of a steadily worsening balance of trade In FY
1973 exports of goods and services exceeded imports by $50 million In FY
1974 there was a deficit of $280 million because of the increase in world oil
prices The trade balance continued to decline until by FY 1981 imports were
close to $2 billion while exports were just over $1 billion Much of the
deterioration in Sudans trade balance occurred because the volume of exports
declined erratically from 1974 on while import volumes were generally higher
than their 1970 level (see Table 7) Table 7 also shows that the terms of
trade contributed to the declining trade balance but were not the primary
cause The net effect of the volume and price changes was that the nominal
value of exports more than doubled from 1970 through 1979 while the nominal
value of imports more than tripled
41
Table 7 Foreign Trade Indexes
Export Indexes Import Indexes Terms of Value Volume Price Value Volume Price Trade
1970 1000 1000 1000 1000 1000 1000 1000
1971 1817 1417 1282 1179 1057 1115 1150
1972 1217 1127 1080 1088 949 1146 942
1973 1425 1118 1275 1544 1098 1406 907
1974 1518 679 2236 2291 1004 2282 980
1975 1542 781 1974 3253 1158 2809 703
1976 1808 1031 1754 3496 1249 2799 627
1977 1722 778 2214 3253 1171 2778 797
1978 2534 864 2933 3564 1089 3273 894
1979 2372 758 3129 3551 968 3668 853
Source Sudan Foreign Trade Analysis 1970-1979 Dept of Statistics Ministry of Planning May 1981
42
411 Exports
Table 8 shows the contribution of the major export crops to the total
value of exports for selected years Although the export mix has varied from
year to year cotton has always been the major export crop accounting for 50
to 60 percent of the total value of exports Groundnuts and sesame have
generally been the second and third largest contributors although in 1979
sorghum was the second largest export crop of valuein terms The irrigated
sector produced almost all the cotton that was exported while the rainfed
sector accounted for all the sorghum and sesame each sector generated roughly
equal amounts of the export value of groundnuts
As can be seen the irrigated sector alone accounted for over half the
total value of exports with the production of a single commodity cotton The
rainfed sector generated about 40 percent oF total export earnings about 15
percent of this amount was in the four major crops While its relative conshy
tribution in these crops may be small exports from the rainfed sector proshy
vided diversification in the export mix a policy objective that the governshy
ment tried to achieve in the irrigated sector with little success
The reason behind the decrease in total export volumes can be seen by
examining the export volumes of selected commodities (Table 9) The decline
over the 1970-1979 period of long-staple cotton exports from the irrigated
sector to 50 percent of their 1970 volume is the chief reason Groundnuts and
sesame exports which had been fairly strong through the late 1970s suddenly
fell off in 1979 because of production difficulties nd government policies
restricting the exports of oil Asseeds a result their contribution to the
total value of exports decreased from 23 percent in 1977 to 8 percent in 1979
(see Table 8) Dura exports grew at a phenomenal rate in 1979 the volume
was over 100 times that in 1970 This growth is attributable to a special
43
Table 8 Composition of Exports (percent of total export value)
1971 1973 1975 1977 Irrigated 1979 Rainfed Total
Cotton
Sorghurr
Groundnuts
61
1
8
55
2
9
46
2
23
57
3
13
55
-
2
2
7
3
57
7
5
Sesame 7 8 8 10 - 3 3
Cake and meal
Other a
4
19
5
21
3
18
3
14
2
-
3
23
5
23
aIncludes gum arabic livestock and all other exports
Source Export Action Program 1980-1990 Ministry of National Planning September 1980
44
Table 9 Volume Indexes for Selected Exports
Long-staple Total Cotton Dura Groundnuts Sesame Exports
1970 1000 1000 1000 1000 1000
1971 1111 19040 2060 1176 1417
1972 1111 30380 1949 1057 1127
1973 980 52164 2357 1279 1118
1974 399 49945 2208 1317 679
1975 620 24434 3496 692 781
1976 850 47744 5201 1264 1031
1977 683 67864 2725 1335 778
1978 433 32337 1665 826 864
1979 526 100143 780 215 758
Source Sudan Foreign Trade Analysis 1970-1979 Dept of Statistics Ministry of Planning May 1981
45
trade agreement with the Government of Saudi Arabia which pays a premium over
the world price for Sudanese dura Recently sorghum output has continued to
expand in response to the Saudi market and the fact that since September 1980
it has been traded at the parallel rate The 1981 sorghum crop is reported to
be a record 28 million tons 55 percent more than 1980 Even so the contrishy
bution of dura to the total value of exports only increased from 1 to 7 pershy
cent from 1971 to 1979 primarily because dura is a low value commodity
compared with cotton groundnuts and sesame Even if all the additional outshy
put for 1981 were exported the increase in the volume of dura exports could
not offset the poor export performance of other agricultural commodities The
experience with dura does however illustrate the potential of the rainfed
sector to respond to price incentives
412 Imports
Table 7 showed that the index of the value of imports increased steadily
over the 1970s rising to 35 times its 1970 level by 1979 This resulted
from increases in both the volume and prices of imports as the indexes show
Historically Sudan has spent much of its available foreign exchange on intershy
mediate goods and capital equipment which were used to develop the manufacturshy
ing sector of the economy Another important use of foreign exchange has been
to purchase food primarily wheat flour and sugar
One reason for the crop diversification program undertaken in the irrishy
gated sector in the mid 1970s was to reduce the reliance of the economy on
food imports the ultimate objective was to become a net exporter of food
From 1972 to 1974 the proportion of total export earnings spent on food
imports increased from 18 percent to 30 percent (Table 10) food imports as a
percent of total import expenditures were fairly constant at 23 percent From
1974 to 1979 foreign exchange earnings spent on food eased from 30 percent to
46
Table 10 Food Imports and Supply of Foreign Exchdnge
Total export Food imports as Food imports asFood imports earning5 percent of export percent of total
(106 $)a (106 $) earnings importsc
1972 669 3781 177 235
1973 996 4851 205 223
1974 1406 4717 298 228
1975 1524 5597 272 168
1976 1025 7284 141 133
1977 872 8437 103 95
1978 1235 8231 150 122
1979 1148 8488 135 125
aIncludes imports uf unmilled wheat rice wheat flour sugar coffee and tea Sudanese pounds converted to current US dollars at official exchange rate
bExport earnings are the sum of exports of goods and services and private and official unrequited transfers
cFrom Bank of Sudan Annual Reports 1973 1977 1979
47
14 percent of the total food declined from 23 percent to 13 percent of the
total import bill over this period This level of dependence on food imports
is high in comparison to other sub-Saharan African countries particularly
since the official statistics may not include all food aid The average ratio
of food imports to foreign exchange earnings for six other sub-Saharan African
countries over the 1965-1976 period ranged from 2 percent to 12 percent 5 out
of 6 were between 2 and 7 percent [18]
4122 Wheat and Sugar Imports The quantity price ard value indexes
for wheat and sugar inorts (the bulk of ood imports) show why expenditures
on food claimed a high proportion of the total supply of foreign exchange
(Table 11) Although the volume of wheat and flour imports declined throughshy
out most of the 1970s then increased in 1978 and 1979 to close to their 1970
levels the price rose to more than twice its 1970 in 1974level remained
there through 1978 and quadrupled in 1979 Since 1979 wheat imports have
continued to grow to a level in excess of half a million metric tons per year
Of this concessionary sales from the United States represent almost a third
The volume of sugar imports was almost 70 percent higher in 1979 than itwas
in 1970 Sugar prices peaked at 6 to 7 times their 1970 level in 1974 and
1975 then fell off to over three times the 1970 level by 1979 As a result
during the period 1973-1975 when food imports accounted for 20 to 30 percent
of total export earnings the value of wheat and flour imports was over 15
times the 1970 level while that for sugar was 4 to 7 times its 1970 level
Including concessional imports ($45 million) the 19801981 import bill for
wheat and sugar was in excess of $250 million US Even at these high levels
of wheat imports and increasing domestic output the price subsidy scheme that
maintains the price of bread artificially low has created excess demands A
48
Table 11 Import Indexes for Wheat and Sugar
Wheat and flour Sugar
Value Volume Price Value Volume Price
1970 1000 1000 1000 1000 1000 1000
1971 944 833 1133 1797 1585 1134
1972 961 961 10C0 1827 1062 1720
1973 1570 868 1809 3558 1635 2176
1974 1506 504 2988 5798 962 6027
1975 1620 610 2656 7428 1051 7068
1976 1420 551 2577 4133 1142 3619
1977 1226 598 2050 2379 1348 1765
1978 1644 753 2183 4424 1822 2428
1979 3780 951 3975 5467 1689 3237
Source Sudan Foreign Trade Analysis 1970-1979 Dept of Statistics Ministry of Planning May 1981
49
factor that has contributed to this is that wheat aiJ sugar were traded at the
overvalued exchange rate which helped maintain the prices of these commodities
at the artifically low levels
4122 Bread Price Policy Bread provides approximately one-third of
the calorie requirements for the population of the greater Khartoum conurbashy
tion Per capita consumption of wheat has been rising rapidly in the last few
years with about a third of the officially marketed wheat being consumed in
the Khartoum conurbation This increase cannot be explained by increased
incomes and growing urbanization It must in large part be attributable to an
explicit cheap bread policy for the urban dwellers Table 2 presents the
budget shares for bread for different income groups in Khartoum Even for the
lowest income group bread represents only 111 percent of food expenditures
and less than 7 percent of total expenditures Even if these figures exclude
food away from home for workers bread represents a high zhare of nutrients
and in relation to this a rather low share of food costs
Exchange rate unification the PL480-III Agreement with the United States
and negotiations with international lenders have placed pressure on the
government to raise the price of bread If import parity pricing were to be
applied to wheat and flour the price of bread would need to be increased by
about 80 percent Reportedly the government intends to raise the price of
bread by close to this amount (66 percent)
This has undoubtedly been a politically difficult decision but its real
impact should not be as great as the current political manifestations would
suggest if the demand for bread is totally inelastic in the short run the
The material sectionin this touches on several issues that will be more thoroughly analyzed in the forthcoming wheat pricing study being conducted by Sigma One Corporation
50
Table 12 Budget Shares of Bread
Income group Share of
Food expenditures Share of
Total expenditures
() ()
Urban Khartoum (3 towns)
All Groups 1061 620
lt 500 LS 1107 689
500-1000 1072 672
1000-2000 1106 678
2000-3000 1045 571
3000+ 854 400
Rural i oum
All Groups 406 274
lt 500 LS 410 313
500-1000 453 312
1000-2000 432 208
2000-3000 NA NA
3000+ 075 053
Source Department of Statistics Ministry of Planning Household Budget Survey 1979
51
cost of living impact will be about 5 percent in real terms for the lowest
income strata in Khartoum If bread is somewhat price elastic the cost of
living impacts are even lower In this case the consumption impacts would
reduce calorie intake by approximately 10 percent for consumers at the FAO
requirements and less for those above it Since there is little indication
that urban Khartoum h-s serious nutritional problems (save for the refugee
population) the deleterious impacts on human nutrition are likely to be
small
The timing for these actions is fortuitous in that Sudan has experienced
a bumper crop in dura and world wheat prices are depressed With exchange
rate unification and import parity pricing the domestic producer price of
LS16750 per ton will not change much This should enable significant savings
in treasury costs ($50 to $60 million) by eliminating the so-called producers
subsidy It is also reasonable to expect substitution of wheat demand for
dura consumption With these policy changes the growth in import demand for
wheat should be slowed The USAID PL480 Title III Program which was supportshy
ing the implicit subsidy can under the new policy regime facilitate the
transition to lower reliance on food imports by continuing the supply without
requiring an increase in the foreign exchange allocations to food imports
42 Fiscal and Monetary Impacts
Much of the impact of the structure of incentives on fiscal problems and
excessive growth of the money supply has occurred through the performance of
parastatal or public entities The poor performance of these state-run corshy
Concern for consumption and nutritional impacts on low-income and othershywise at-risk populations could be more effectively addressed through alternashytives such as the CRS Title II program
52
porations over the past several years created a growing demand for public
sector credit thereby exacerbating the governments budgetary problems and
forcing it to turn increasingly to external sources of credit to finance the
resulting deficits
Table 13 contains a breakdown of the money supply for FY 1975-FY 1980
The supply of money increased from LS277 million in 1975 to over LS1 billion
in 1980 at a compounded growth rate of 29 percent per year This is a primary
factor underlying the high rate of inflation Net claims on the public secshy
tor which comprises the central government local and provincial councils
and parastatal entities was the primary reason from LS250 million in 1975
they grew at an annual rate of 31 percent to over LS970 million in 1980 The
parastatals which include the agricultural and industrial entities and the
public utilities accounted for a substantial portion of the net claims on the
public sector The claims against these bodies increased from LS105 milshy
lion in 1975 to over LS240 million in 1980 growing at 20 percent perover
year Since their growth rate was lower than that of the money supply the
proportion of net claims on the parastatals to the money supply declined from
38 percent to 24 percent over the period Besides being inflationary public
sector borrowing of this magnitude crowds out private borrowing and thereby
inhibits the capitalization of the private sector
Of the parastatal entities the agi-icultural corporations and boards
receive the largest share of bank credit with the public utilities and the
industrial boards a distant second and third respectiely The boards conshy
trolling the irrigation schemes accounted for most of the credit extended to
agriculture by the banking sector Of LS140 million in 1977 these boards
received about LS120 million in 1980 they received LS205 million in credit
against a total of LS215 million [11] On the other hand credit extended to
53
aTable 13 Components of the Money Supply (LS millions)
1975 1976 1977 1978 1979 1980
Net foreign -10716 -19265 -19176 -21805 -20126 -28890 assets
Net claims on private sector 17569 23900 26447 31837 40724 52590
Net claims on public sector 25001 35773 51735 65826 84935 97160
Central government and local and proshyvincial councils 14512 24064 41339 54824 65973 72820
Total money supply b 27656 33233 46579 60667 82098 100250
Net claims on parashystatals as percentof money supply 379 352 223 181 231 243
aAll figures apply to end of the fiscal year (June 30)
bSum of net foreign assets net claims on private sector net claims on public sector and other items
Sources Bank of Sudan Annual Report 1977 1979 IMF Sudan-Recent Economic Developments SM8170 March 1981
54
the Mechanized Farming Corporation the only parastatal body directly involved
in rainfed crop agriculture increased from LS10 million in FY 1977 to
LS26 million in FY 1980
Rainfed agriculture is relatively isolated from the publiL sector
course it benefits (or suffers) from the performance of the largest public
utility Sudan Railways And most of the loans granted by the Agricultural
Bank of Sudan a government-controlled financial entity go to the rainfed
sector Thus any policy changes affecting the organization or financial
status of the parastatals would affect this sector primarily through its
credit availability and its marketing and distribution system Policy changes
would not be likely to directly affect the viability or productivity of the
sector as a whole as would changes in the boards operating the irrigation
schemes
As discussed above the subsidies on wheat and sugar are a drain on the
Treasury It is estimated that eliminating them would save between $50 and
$60 million per year This would reduce the budget deficit and consequently
ease inflationary pressures A smaller deficit would also mean less public
sector borrowing which would help the private sector by allowing more private
borrowing
43 The Export Action Program Potential of the Rainfed Sector
The Export Action Program (EAP) of 1980 outlines an ambitious program to
promote exports from the irrigated and rainfed sectors over the next 10 years
thereby increasing foreign exchange earnings and eventually solving Sudans
balance of payments problems The proposed program for the rainfed sector is
not as detailed or extensive as the one for the irrigated sector which in the
main calls for rehabilitating the existing schemes It is forthrightly
55
admitted that the specific constraints to raising productivity in the rainfed
sector have not yet been identified and that it is not known whether the conshy
straints once identified can be overcome [12] The plan recognizes that
labor constraints in the rainfed sector mean that more capital investment is
needed if the 1990 targets are to be met However the capital requirements
are small compared with those for the irrigated sector Public sector investshy
ment of LS160 million is planned over the next 5 to 7 years most of this
outlay will be directed towards agricultural research and pilot projects In
addition the EAP recognizes the rainfed sectors need for improved infrashy
structure in particular adequate transport and marketing facilities as well
as adequate supplies of good seeds and credit
The EAP lists projects and policies undertaken or planned for the benefit
of rainfed agriculture and then gives the 1990 export target for each of
the major rainfed products These targets are actually estimates of export
availabilities which were derived by setting production targets and netting
out estimates of increased consumption seed waste etc The production
targets for the major rainfed crops except gum arabic are presented in Table
14 along with the targeted increases in cropped areas and yields that would
enable the targets to be met This section analyzes the feasibility of the
targets in light of the past performance of the rainfed sector the
constraints on its potential performance and how the recent policy changes
might relax those constraints
Examination of the production targets in Table shows more14 that
reliance is placed on horizontal expansion than on vertical expansion The
annual growth rates for areas cropped in groundnuts sesame dura and cotton
are roughly twice the growth rates of yields A policy aimed at intensifying
56
Table 14 Rainfed Crop Production Targets
Groundnuts Area (000 fed) Yield (kgfed) Production (000 tons)
Sesame Area (000 fed) Yield (kgfed) Production (000 tons)
Dura Area (000 fed) Yield (kgfed) Production (000 tons)
Cotton Area (000 fed) Yield (Kantarfed)a Production (000 tons)
aKantar = 143 kg
Source Export Action Programme
September 1980
Required1978-1979 annual average 1990 growth rate ()
1976 2950 38 262 328 20 517 967 58
2058 2860 30 104 122 15 214 350 46
6246 9540 39 300 353 15
1846 3370 56
164 530 113 09 20 75
21 150 196
1980-1990 Ministry of National planning
57
the use of areas presently under cultivation would result in growth rates of
yields that significantly exceeded the growth rates of areas cropped Given
the vast areas of arable land not yet under cultivation and the relatively
small amount of capital investment allocated to the rainfed sector over the
next decade a policy that implicitly relies on horizontal expansion to meet
the targets might be reasonable
However infrastructure constraints are more likely to confound such a
policy In particular expanding horizontally will increase the demand for
transportation If the planned extension of the road system is insufficient
to meet future needs it will be a major obstacle to the EAP since most of the
increased production of cotton groundnuts and sesame are intended for the
export market Without an adequate transport system the western markets will
remain isolated from the world market and increased output will only tend to
depress producer prices
Although the EAP does not specify precisely how much expansion is
targeted for each province some of this information is given for sesame
production dura output from mechanized farms and groundnuts production from
traditional farms The results show that cropped areas in Kassala particushy
larly the Gedaref area are expected to increase by 600 thousand feddans or
26 percent over the decade Cropped areas should expand by over 13 million
feddans or 130 percent in the central provinces of the Blue Nile and Whte
Nile A substantial increase of 12 million feddans almost 50 percent is
also anticipated for the western provinces about equally divided between the
Kordofans and the Darfurs
Plans to extend the road system involve all these provinces The highway
from Port Sudan to Khartoum passes through the Gedaref region in addition
58
five feeder roads in the area are under consideration In the Blue Nile the
Wad Medani-Sennar road has been completed and roads from Sennar to Damazin
(an important mechanized farming region) and from Sennar to Kosti are under
construction Of three planned roads in the Kordofans the El Obeid-Dubeibat
road is under construction and the En Nahud-Abu Zabad and Habila-Dubeibat
roads are being negotiated In the Darfurs a road connecting Nyala and El
Fasher has been budgeted A road From Nyala through Kas and Zalingei and
ending northwestern borderat the town of Geneina is currently under conshy
struction Whether these roads will adequately serve the future needs of
these provinces is not known At a minimum however all the roads that have
been budgeted negotiated for or are under construction need to be completed
paoticularly if the targets in the central and western provinces are to be
met
Even if the targeted expansion in cropped areas occurs greater producshy
tivity in the form of increased yields is needed if the output targets for the
rainfed sector are to be achieved Although the Sudan has had an agricultural
research program for several years it has had little impact on rainfed
farmers because extension services are practically nonexistent The current
research program needs to be continued and expanded and much more effort needs
to be made to get research results to Sincethe farmer a major weakness of
the extension service is a shortage of trained personnel a policy initiative
designed to (or train)attract qualified people would seem appropriate An
effective extension service providing the best available information on cultishy
vation techniques and seed varieties is required for sustained improvements in
rainfed sector yields
59
Other policies have been implemented or are under consideration to
improve the structure of incentives in the rainfed sector These incluae the
unification and devaluation of the exchange rates and the removal of the
export duties on cotton and sesame Abolishing the monopoly of the Sudan Oilshy
seeds Company in exports of oilseeds resulted in substantial increases in
groundnuts seeds and oil shipments during the third quarter of 1981 [9]
In the public sector the ABS is being strengthened through the IDAshy
financed Agricultural Services Project which calls for an outlay $300 million
over the rest of the century Under its auspices the ABS will be reorganized
so that it can provide more credit to the rainfed sector as well as more
tractors and spare parts Tax incentives under the Agricultural Investments
Act of 1976 include concessions to private investors who operate huge mechanshy
ized farms (between 250 thousand and 500 thousand feddans) The size of these
farms means that their location must be very carefully considered so that the
already shaky relations between the nomads and the mechanized farmers are not
exacerbated [16] A policy of dubious merit is the government encouragement
of producer cooperatives as the most efficient means of getting credit to
smallholder farmers and to insure greater private control of resources Howshy
ever past experience with cooperatives does not support this optimistic conshy
clusion they usually break down after a few months [16]
The best way of realizing the potential of the rainfed sector still
remains untapped however because of the governments policy of fixing the
purchase prices for rainfed cotton sesame and groundnuts The government
recognizes what a severe disincentive this is it recently doubled the purshy
chase price of rainfed cotton from LS260 per small kantar to LS700 in
belated recognition of the fact that for years the internal price of shortshy
staple cotton has been far below the international price As discussed in
60
Section 33 the production and marketing system operates very effectively
given the tremendous infrastructure constraints it is faced with Commodities
like dura and millet whose prices are relatively free from government intershy
ference move from surplus to deficit areas as reflected in price differenshy
tials both within the country and from the country to the world market Oilshy
seeds and oil exports increased once the Sudan Oilseeds Company was forced to
compete with the private trading sector Removal of government intervention
in market prices would narrow the wedge between producer and world prices
improve producer incomes and realize some of the potential--at little or no
cost--of the rainfed sector
61
SECTION 5 CONCLUSIONS AND RECOMMENDATIONS
In the past 10 years the performance of the agricultural sector
deteriorated especially in the irrigated schemes causing severe problems for
Sudans domestic economy and its foreign exchange reserves Since land is not
the limiting factor it seems reasonable that the productivity levels of the
early 1970s are realizable through an improved structure of incentives with
consequent improvements in the domestic economy and Sudans foreign trade
position Recent experience indicates that the rainfed sector has the
potential and ability to respond to improved incentives
Throughout the 1970s rainfed agriculture was expanding for all annual
crops except cotton through increases in cropped areas Recent rapid
increases in sorghum production which are believed to be a response to an
improving structure of incentives have principally been achieved through area
expansion Yields in sorghum have generally been stagnant at rather low
levels While further area expansion can undoubtedly be realized there
appears now an opportunity for increasing output through the intensification
of production in existing In this research andareas regard agricultural
enhanced availability of modern factors of production could play a key role in
facilitating private farmers abilities to respond to the improved incentives
generated by recent policy initiatives The realization of this potential
would however require effective public sector delivery of research results
and substantial improvements in factor markets
In the latter half of the decade irrigated areas sown to cotton and
other crops decreased absolutely as a result of the disincentive effects of
the joint account system and the reduced revenues of the management boards of
62
the irrigated schemes The experience in the irrigated sector during the
1970s illustrates that it is not sufficient to direct resources towards a
sector without the same theat time providing appropriate incentives for
farmers to make effective use of the publicly-provided resources That is
research infrastructure and agricultural services will not lead to
productivity increases if the incentives facing farmers have the effect of
taxing away the value of the publicly-provided resources
The terms of trade were not the primary cause of the deteriorating
balance of payments situation Rather the growth in value of imports far
outstripped the growth in value ot exports The chief reason is the decline
in cotton output This is not surprising since cotton production faced the
most severe disincentives The motivation for the direct and explicit
taxation of cotton may have been to secure operating revenues for the governshy
mlent and the parastatals but in so doing the disincentives were so severe
that the revenue base was eroded This experience emphasizes needthe for
extensive tax reform in the Sudan
Tax reform is under considerzion and some changes have been made For
example the export duties on cotton and sesame have been removed the removal
of the duties on groundnuts and livestock products is under consideration
Other reform measures should be directed towards increasing the buoyancy and
progressivity of the tax system for example by eliminating specific taxes
Since September 1979 the parallel exchange rate was minimally overshy
valued if not in fact undervalued some of the time By placing many
of the tradeables on the parallel rate in September 1980 the Sudan has
removed one of the most important sources of distortions to the structure of
incentives With the exchange rate Lnification and devaluation of November 9
1981 the potential for aligning the valuation of domestic resources with
63
their international valuation has been created Under this new regime
official price interventions will need to be stated explicitly and fiscal
budget implications clearly identified For example the overvaluation of the
official exchange has tendedrate to mask the economic and budgetary cost of
Sudans cheap bread policy Under the new regime the Sudan may choose to
continue to subsidize the price of bread but the amount and source of the
subsidy will need to be explicitly stated in the fiscal budget In so doing
budget planners will be better able to gauge the opportunity cost of the
resources allocated to the bread subsidy In the past a substantial portion
of the implicit subsidy for bread was borne by domestic wheat producers yet
the accounting figures made it appear as if wheat producers were being
directly subsidized Furthermore with multiple exchange rates for wheat and
sorghum the relative prices for wheat versus sorghum were inverted from their
usual international price relationship In the absence of the special sorghum
export arrangements to Saudi Arabia this condition would have been a serious
distortion and disincentive to both domestic wheat and sorghum production
The other side of exchange rate unification relates to higher factor
costs (petroleum prices) in mechanized agriculture and in the transportation
system This will tend to shift back the supply of agricultural output from
the more modern subsectors Since sorghum has been at the paralleltraded
rate since September it is possible much the1980 that of response to
improved pricing has already been realized Thus major supply increases
should not be expected result from exchange rate unification per se Thisto
policy reform however does create an environment which makes it more
possible for resources to be utilized efficiently This should in turn
create incentives for investment and innovation
64
Indirect estimates of marketing costs for dura in the West suggest that
even if transport links between El Obeid and Khartoum and Port Sudan are
improved the El Obeid market will probably continue supply the westernto
regions rather than becoming a major supolier of the eastern provinces and the
export market This result is important because much has been made of the
need to rehabilitate the rail system and to extend the road systen in the
investments toWest such need be carefully evaluated because the anticipated
flow of produce (dura) may not be forthcoming This is not to say that
enhancement of the transport system may not be warranted but that higher
returns may possibly be obtained from intraregional connections in the West
than from linking the West to the more developed East An important caveat to
be considered in this regard is the thinness and instability of the markets to
the West
The exchange rate unification and devaluation of November 9 1981 has
eliminated the implicit subsidies to petroleum agrochemicils and spare
parts The costs of production in the mechanized farming schemes and the
irrigated sector are expected to rise in proportion to the product of the
devaluation and the share of costs represented by these previously subsidized
factors The devaluation will have little impact in reducing the negative
nominal protection facing the rainfed sector (with the exception of rainfed
cotton)
In the absence of other changes in the structure of incentives output
from this sector is likely to decline at least in the short run To dampen
this potentially deleterious impact a combination of further tax reform (such
as removing all remaining export duties) and public sector initiatives that
enhance the productivity of the sector a whole egas accelerated
agricultural research to increase the productivity of the scarce factors of
65
production (agrochemicals labor and for the irrigated sector water) and
reduction of any technical and economic inefficiencies in the marketing
system Our estimates of nominal protection reveal the likelihood that
marketing margins are high
Low land rents and subsidized credit have resulted in undercapitalization
of the rainfed agricultural sector a poor creditand recovery experience
Raising land rents and tightening up the conditions under which loans are
granted might lead to the adoption of new technology and consequently to more
intensive use of the land Productivity would increase total output might
increase even though fewer farms might be operating and soil conservation
problems would ease Additionally the increased revenues could be invested
in developing the infrastructure which would make the marketing and distrishy
bution systems more efficient as well as enhancing the value of the land
The Sudan should n)t lose the current opportunity to remove an important
distortion in the market for food and realize Treasury and foreign exchange
savings by eliminating the implicit and explicit subsidies on wheat and sugar
Three favorable conditions exist--a bumper crop in domestic sorghum production
depressed international prices for wheat and sugar and substantial concesshy
sionary assistance through the wheat imports from the US under the PL 480
Title III Program--whch minimize the deleterious cost livingof and
nutritional impacts on the urban minority which has become dependent on these
subsidies The long term impacts of removing the subsidies should be
beneficial to the majority of Sudanese that are engaged in agricultural
production
66
Sudan has a clear comparative advantage in cotton production in both the
irrigated and rainfed sectors The sharp decline in rainfed cotton output is
attributable to the governments policy of fixing producer prices at a level
far below the world price of short-staple cotton In dura production the
traditional rainfed sector has a competitive edge over the irrigated sector
the modernized rainfed subsector and the mechanized rainfed sector The
traditional sector also has a comparative advantage relative to the irrigated
sector in the production of groundnuts Both the traditional and mechanized
rainfed subsectors show a comparative advantage in sesame production The
rainfed sector has benefited from recent policy changes These are necessary
conditions but are insufficient to cause major output increases from rainfed
agriculture Much remains to be done in the areas of tax reform agricultural
research and improvements in the marketing system
67
REFERENCES
1 Acharya Shankar N Incentives for Resource Allocation A Case Studyof Sudan World Bank Staff Working Paper No 367 Washington DC December 1979
2 Alibaruho George Prospects for Production and Export of Food in theSudan A Cautionary Note Working Paper 789CGFPI International Food Policy Research Institute Washington DC March 1978
3 Bank of Sudan Annual Reports 1973 1977 1979 Khartoum The Democratic Republic of the Sudan
4 Department of Agricultural Economics Ministry of Agriculture Food andNatural Resources Current Agricultural Statistics Vol 1 No 3 Khartoum June 1979
5 Department of Statistics Ministry of Planning Sudan Foreign Trade Analysis 1970-1979 Khartoum May 1981
6 Arl 1981Internal Trade Statistics and Price Indices 1978 Khartoum April 1981
7 Due John F Rail and Road Transport in the Sudan Faculty WorkingPaper No 423 (Transportation Paper No 15) University of Illinois at Urbana-Champaign July 1977
8 The Tax Structure of the Democratic Republic of Sudan WithEmphasis on the Indirect Taxes and Potential Reforms Parts A and BFaculty Working Papers Nc 419 and 420 University of Illinois at Urbana-Champaign July 1977
9 The Economist Intelligence Unit Ltd Quarterly Economic Review of Sudan4th Quarter 1980 1st Quarter 1981 3rd Quarter 1981 London
10 Food and Agriculture Orgarization of the United Nations Sudan Report of FAO Programming Mission October 1980
11 International Monetary Fund Unpublished data
12 Ministry of National Planning Export Action Programme 1980-1990 Khartoum September 1980
13 Nashashibi K A Supply Framework for Exchange Reform in DevelopingCountries The Experience of budan IMF Staff Papers Vol 27 No 1 March 1980
14 Picks Currency Yearbook Sudanese Pound New York 1979 pp581-586
68
15 Scobie Grant M Investment in International Agricultural Research Some Economic Dimensions World bank Staff Working Paper No 361Washington DC October 1979
16 Simpson IG and Morag C Simpson Alternative Strategies for AgriculturalDevelopment in the Central Rainlands of the Sudan Rural Development StudyNo 3 University of Leeds 1978
17 Sudan Gezira Board Statistical Bulletin No 2 Barakat March 1981
18 Valdes A and P Konandreas Assessing Food Insecurity Based onNational Aggregates in Developing Countries in Food Security forDeveloping Countries ed Alberto Valdes Westview Press 1981
19 The World Bank Accelerated Development in Sub-Saharan Africa An Agenda for Action Washington DC 1981
20 The Basic Economic Progam Address by HE President Gaafar Mohamed Nimeiry November 9 1981
69
1
2
3
4
5
6
LIST OF FIGURES
Figure Page
Area Planted in Export Crops 7
8
Area Planted in Import Crops 12
Average Yields of Export Crops
Average Yields of Import Crops 13
Area Planted inMillet 16
Average Yields of Millet 17
SECTION 1 INTRODUCTION
11 Purpose
The problems that have plagued Sudans economy ever the past 10 years are
inextricably linked to the performance of the agricultural sector Any
solution to those problems must therefore be based on revitalizing that
sector The potential is there The productivity of the sector in the past
demonstrates what could be achieved again How can the performance of the
sector be improved so that this potential is realized The most efficient and
effective way is to improve the structure of incentives within agriculture
that is the signals to which producers respond that are generated by the tax
system exchange rate policies prices of agricultural commodities government
subsidies and activities of parastatal organizations
The exact characteristics of the structure of incentives depend on the
nature of agricultural production which in the Sudan encompasses both irrishy
gated and rainfed agriculture The irrigated sector includes the governmentshy
controlled and private schemes along the banks of the Blue Nile White Nile
and Nile River Initially these projects were devoted solely to the
production of cotton Sudans major export During the 1970s the government
changed the cropping pattern and introduced wheat sorghum (dura) and
groundnuts The rainfed sector is the rest of the country This report
however focuses on rainfed agriculture in the North because this region has
the highest potential for improving the countrys economic situation in the
near term Major products of this sector include gum arabic livestock
groundnuts dura millet (dukhn) and sesame For the most part these are
produced by traditional farming methods which are labor intensive and use few
1
imported inputs such as fertilizers and pesticides In recent years some
mechanized farming schemes have been developed in the rainfed sector in the
North These schemes now account for one-half of total dura production and
about 25 percent of the total output of this sector [12] Mechanized farms
use more imported inputs mainly tractors fuel and spare parts for land
preparation and planting Weeding and harvesting of most crops are still done
by hand
The purpose of this report is to examine the structure of incentives
facing producers in the agricultural sector in particular rainfed agriculshy
ture The irrigated sector has been extensively analyzed and has always
received the lions share of funds invested in agricultural development The
rainfed sector has been neglected relative to the irrigated sector Yet
rainfed agriculture provides the Sudan with a diversified export mix supplies
it with several important food grains and oilseeds has the potential of
making Sudan self-sufficient in food production and is the major source of
employment By contributing to growth in the rainfed sector it is possible
to improve the incomes of the majority of the population which constitutes the
bulk of the private sector in the Sudan
In addition to examining the structure of incentives we will analyze its
impacts on rainfed agricultural productivity and the domestic economy over the
past decade and attempt to estimate how recent policy changes will enhance
productivity improve the performance of the domestic economy and ameliorate
the balance of payments problems by increasing foreign exchange earnings
Finally we suggest USAID activities that will aid and support the government
of Sudan in its efforts to increase the rainfed sectors contribution to
economic growth export earnings and improved producer incomes
2
12 Setting
Agriculture is the major productive activity in the Sudan It generates
35-40 percent of the gross domestic product The crop-producing subsector
contributes about 40 percent of this amount the livestock and forestry
suosectors account for most of the remainder Agriculture employs over
two-thirds of the labor force It supplies over 95 percent of total exports
by value The industrial sector primarily comprises industries that process
agricultural products eg textiles sugar vegetable oils Other large
sectors of the economy notably wholesale and retail trade and transport and
communications either service the agricultural sector or are major users of
its outputs Thus the performance of this sector dptermines the performance
of the domestic economy as well as Sudans foreign trade position Consequentshy
ly government policies and international and domestic events that affect
agriculture will be quickly transmitted throughout the economy and will have
direct impacts in Sudans foreign exchange reserves
In some respects Sudans economy performed well during the 1970s
relative to other sub-Saharan African countries [19] Sudans gross domestic
product (GDP) grew at an annual rate of 43 percent during the 1970-1979
period compared with 29 percent for sub-Saharan Africa (16 percent if
Nigeria is excluded) Sudans current account deficit declined from 86
percent of GDP in fiscal year (FY) 1976 to 61 percent in FY 1980 by
contrast the ratio for oil-importing African countries was higher and only
decreased slightly from 95 percent in 1975 to 92 percent in 1980 Per
capita GNP in 1979 was $370 compared with $411 for sub-Saharan Africa
In other important respects however Sudans economy lagged far behind
the average performance of the sub-Saharan African countries [19] Export
volumes from Sudan declined at an annual rate of 44 percent over the
3
1970-1979 period compared with an overall decline of 08 percent per year for
the other countries The growth of import volumes during this period 45
percent per year exceeded the 33 percent annual growth rate for sub-Saharan
Africa As a result Sudans trade balance deteriorated rapidly from a $50
million surplus toin FY 1973 a $1 billion deficit in FY 1981 The current
account balance which includes trade in invisibles moved from a surplus of
$14 million in FY 1973 to a deficit of $543 million in FY 1980 As scarce
foreign exchange reserves dwindled and budget deficits increased the governshy
ment increased its borrowing from outside sources the external debt increased
from $12 billion in 1975 to over $3 billion in 1980 [9] or approximately 30
percent of GDP over this period Interest and principal payments on external
debt as a percent of total export earnings (the debt service ratio) declined
from 20 percent in 1975 to 11 percent in 1977 then increased to 21 percent by
1980 it reportedly rose to about 50 percent by the end of 1980 [9] By
contrast the debt service ratio for all oil-importing African countries rose
from 8 percent in 1977 to 16 percent in 1980 Finally real GOP which
increased by almost 6 percent in FY 1978 declined by 12 and 06 percent in
FY 1979 and FY 1980 respectively primarily a result of decreases in the
output of the agricultural sector [11]
In spite of this mixed picture the prospects for improvement are good
The country has extensive unrealized natural and human potential and its
leadership has amanifested commitment towards efficiency by encouraging
market mechanisms as the principal means for resource allocation [20] The
costs of this transition will be high and may have extensive redistributive
effects Well-targeted and -executed external assistance can assist the Sudan
in achieving the transition to growth and efficiency in an equitable manner
4
SECTION 2 RECENT PERFORMANCE OF THE AGRICULTURAL SECTOR
The output of Sudans major crops (except cotton) increased during the
197C-1981 period through an expansion of cropped areas in the rainfed sector
in the irrigated sector there was no growth in areas planted Yields were
either declining or stagnant in both sectors Both the yield and the area
cropped in cotton fell over this period resulting in a decrease in total
output Among the tradeable commodities the major export crops (exportables)
discussed in this section are cotton dura groundnuts and sesame two crops
grown entirely in the irrigated sector wheat and sugar are termed import
substitutes because all domestic production offsets imports of these comshy
modities Millet a major food grain is generally a nontraded good
The total area planted in the export crops increased from 8 million
Feddans in 196970 to 12 million feddans in 198081 at an annual average
growth rate of 4 percent The increase of 4 million feddans occurred entirely
in the rainfed sector the area cropped in the irrigated schemes was about 2
million feddans in 196970 and 198081 dlthough it did peak at approximately
26 million feddans in 197576 Irrigated areas planted in wheat and sugar
rose from 300 thousand feddans to 500 thousand feddans during the same period
representing an average growth rate of just under 5 percent per year
However this increase was not large enough to offset the decrease in
irrigated areas devoted to cotton While there is little if any physical
competition for resources between these crops and cotton the structure of
incentives (including the joint account system) was such that cotton declined
by 42 per cent in the period The contribution of areas cropped and yields to
total output of the export crops the import substitutes and the nontraded
commodity is examined inmore detail in the following sections
5
21 Export Crops
Figures 1 and 2 show the cropped and average yields for the majorareas
export crops from 196970 to 198081 During the period the area planted in
seed cotton declined at an annual rate of 13 percent from 13 million feddans
in 196970 to 11 million feddans in 198081 Average yields also declined at
a rate of 36 percent per year from 540 kgfeddan to 360 kgfeddan As a
result production of seed cotton fell 48 percent arnually from 675 thousand
tons in 196870 to 390 thousand tons in 198081 Since the area planted in
rainfed cotton is approximately 10 percent of the total or 100 thousand
feddans the poor performance of cotton production is concentrated in the
irrigated sector
Total cropped areas in the irrigated schemes rose during the first half
of the decade from 20 to 26 million feddans then gradually fell to its
original level of 20 million feddans by 198081 The expansion of irrigated
land from 196970 to 197576 occurred because new schemes were brought into
production The decrease in total cotton output was a result of a change in
government policy which also affected the production of other irrigated crops
To promote export crop diversification and food self-sufficiency the governshy
ment in 1974 began diverting land away from cotton and into other crops
notably groundnuts wheat and dura At the Fme time it did not change the
financial relationship between the tenant farmers and the management boards of
the irrigated schemes nor did it alter its cotton trade policies Hence all
operating costs of the schemes regardless of what crops were grown were
charged to the cotton account tenants continued to receive 49 percent of the
net proceeds from the sale of cotton while collecting all receipts from the
sale of other crops an explicit export tax on cotton applied and cotton
was traded at overvalued official exchange rates
6
Figure 1 AREA PLANTED IN EXPORT CROPS
AREA 7270
(000 feddans) 196970 -- 198081
15 0 - Sorg hum
6230
5730
5210 I
J
-
4700 --
4190
2430shy
1920---- Groundnuts
Sesame
1410-----gllD
I1 1 U I
---------- ----oto - - - -Cotton
I 1 5 i
I I
6970 70 71 72 73 74 75 76 77 78 79 8081
YEAR
Source Food and Agriculture Organization of the United Nations Sudan October 1980
Report of FAO Programming Mission
196970 -- 198081 YIELD (kgfeddan)
610_
- - 506 -~ i
454 -
402 4 0 2
Ground uts
350 ___ 298298 ]
_ -
~------ N -- - ---- - ~
-
--
C Sorghum
Srgu
246 Co
194
142
90 - Sesame lllilriilli~ v i l ii l I r~ vil r I I
69170 70 71 72 73 74 75 76 77 78 79 8081
YEAR Source Food and Agriculture Organization of the United Nations Sudan Report of FAO Programming Mission
October 1980
This policy implicitly taxed export crop production by the amount of the overshy
valuation (see Section 32) Diversification into groundnuts and wheat meant
these crops were competing with cotton for the available irrigation water
between November and January Cotton production fell thus reducing the
revenues that normally accrued to the management boards and the government
As operating expenses were also rising the resulting operating deficits had
to be financed by borrowing from the banking system a process which fueled
inflation (see Section 42) As a result of the fall in cotton exports
foreign exchange reserves declined This meant that the necessary maintenance
of the schemes could not be performed Machinery and spare parts could not be
obtained the irrigation canals began to fill with weeds further restricting
water availability Thus areas cropped in groundnuts and dura also declined
by nea-ly 300 thousand feddans between 197576 and 197879 while yields for
these commodities did not significantly improve This exacerbated the decline
in performance of the irrigated sector Thus there was a shift away from
cotton production resulting in a decrease in total output of that crop at the
same time total irrigated area fell during the latter half of the decade
resulting in absolute decreases in the areas planted in the crops which were
being grown in place of cotton
The output of groundnuts doubled in the decade of the 1970s with most of
the increase coming from area increases in the rainfed sector In the Gezira
scheme of the irrigated sector the area planted in groundnuts increased from
151 thousand feddans in 196970 to 424 thousand feddans in 197576 then fell
sharply to 229 thousand feddans by 197980 this represents an average annual
growth rate of 43 percent over the decade In the Gezira average yields
increased from 350 kgfeddan in 196970 to 1500 kgfeddan in 197576 then
9
declined to 1200 kgfeddan in 197980 [17] These yields are two to four
times the yields in the traditional rainfed sector and the annual growth rate
of 13 percent in irrigated yields far outstrips the very slight improvement in
rainfed groundnut yields However during this period the traditional
rainfed sector produced between 50-70 percent of total output [12] Available
data for 197576-197879 indicate that the area cropped in groundnuts in the
rainfed sector accounted for 75-85 percent of tne total area [14] The total
area planted in groundnuts doubled during 196970-198081 from 11 million
feddans to 22 million feddans growing at an annual rate of 68 percent Of
the 11 million feddans brought under groundnuts cultivation during the
1970s the irrigated sector accounted for 100 thousand feddans or 9 percent
of the total increase Although yields fluctuated widely over this period
there was no sustained growth so that 198081 saw little improvement on the
average yield of 360 kgfeddan in 196970 Thus the increase in output from
390 thousand tons in 196970 to 800 thousand tons in 198081 came entirely
from the expansion in areas cropped primarily in the rainfed sector
The mechanized rainfed sector produces about 50 percent of total dura
output Traditional rainfed agriculture accounts for another 40 percent and
the remaining 10 percent is produced in the irrigated sector The total area
cropped grew at an annual rate of 45 percent from 42 million feddans in
196970 to 68 million feddans in 198081 The average yield declined over
the period by 1 percent annually from 340 kgfeddan to 310 kgfeddan As a
result sorghum production increased from 15 million tons in 196970 to 21
million tons in 198081 at a rate of 35 percent per year The increases in
area cropped and output occurred almost entirely in the rainfed sector partishy
cularly the mechanized farms In the Gezira scheme the area cropped in dura
10
increased on average at 12 percent annually from 290 thousand feddans in
196970 to 327 thousand feddans in 197980 while there was only nominal
growth in yields of 06 percent per year from 470 kgfeddan to 500 kgfeddan
The expansion of areas cropped in the irrigated sector accounted for only 1
percent of the additional 26 million feddans brought under cultivation
although it represented over 10 percent of the additional 216 thousand tons
produced
Sesame is grown in both the mechanized and the traditional rainfed
sectors The area cropped increased at an average annual rate of 36 percent
from 14 million feddans in 196970 to 20 million feddans in 198081
Average yields however declined by almost 2 percent per year from 130
kgfeddan to 100 kgfeddan so that output only increased from 180 thousand
tons to 210 thousand tons or at an annual rate of 17 percent
With the exceptiog of groundnuts the performance of the irrigated sector
was generally weaker than that of the rainfed sector Although yields are
significantiy higher in the irrigated sector they did not as a rule improve
much over time combined with the lack of growth in cropped areas production
from this sector was lackluster These results especially the increases in
areas cropped could be explained as the combined effect of two phenomena
(1) government policie3 that discriminated against the irrigated sector relashy
tive to the rainfed sector even though the bulk of public sector investment
in agriculture has been directed towards the irrigated sector and (2) the atshy
tempts of rainfed agricultural producers to maintain their incomes and to inshy
sure food security in the presence of declining yields
22 Import-substitute Crops
The major import substitutes wheat and sugar are grown only in the irrishy
gated sector Figures 3 and 4 depict cropped areas and yields respectively
11
--
196970 -- 198081 AREA (000 feddans)
745
690 - 635
N N
580 shy
525
470 -47
Wheat 415
360 shy
305 ~
250 -- Sugar
15shy
6970 70 71 72 73 74 75 76 77 78 79 8081
YEAR Source Food and Agriculture Organization of the United Nations Sudan Report of FAO Prograuing Mission
October 1980
---
Figure 4 AVEPAGE YIELDS OF IMPORT CROPS
196970 -- 198081YIELD (kgfeddan)
3500
3340 -
3200
3060
2920 --
2780 jI
2640 IfIt S I
2500 _ _-Sugar
586 7_ - Z-
Z- - -- Wheat300
1hh I hhh13001 I a m1 I1I I111111I 1 11s1aual I I Irl j
6970 70 71 72 73 74 75 76 77 78 79 8081
YEAR
Source Food and Agriculture Organization of the United Nations Sudan Report of FAO Programming Mission October 1980
for wheat and sugar Because of the government-directed cropping pattern
described above the plantedarea in wheat increased from about 300 thousand
feddans in 196970 to a peak of 700 thousand feddans in 197576 it then fell
to about 450 thousand feddans by 198081 as maintenance problems increased in
the irrigated schemes Over the decade wheat yields improved only slightly
from 400 kgfeddan in 196970 to 500 kgfeddan in 198081 an annual growth
rate of 21 percent As a result of increases in cropped areas and yields
wheat production grew at a rate of 61 percent from 115 thousand metric tons
to 220 thousand metric tons Areas planted in sugar rose from 30 thousand
feddans in 196970 to over 50 thousand feddans in 197980 an annual increase
of 62 percent Yields rose from 25 tonsfeddan in 196970 to around 35
tonsfeddan in the early 1970s then fell off and stabilized at 25
tonsfeddan during the latter part of the 1970s As a result production of
sugar increased over the decade from 75 thousand to 130 thousand metric tons
at an average annual growth rate of 58 percent
Although the production of wheat and sugar rose over the decade primarily
because of an increase in cropped areas it was not nearly enough to satisfy
domestic demand The government policy of import substitution fell far short
of its objective and this level of output was achieved at a cost higher than
would have been incurred had an amount equal to domestic production been
imported Sudans general comparative disadvantage in wheat production has
been central to the recent debates on agricultural policy This will be
discussed inmore detail in Section 4
23 Millet The Nontraded Good
Millet is an important food staple in Western Sudan All of it is proshy
duced in the rainfed sector Very little is exported and none is imported
It is considered a nontraded commodity since the market for it clears domestishy
14
cally The area cropped in millet rose steadily during the early 1970s from
15 million feddans to about 25 million feddans it peaked in 197879 at 3
million feddans but in the last two crop years declined to around 26 million
feddans (Figure 5) Millet yields declined fairly steadily throughout the
first half of the decade from 260 kgfeddan to about 160 kgfeddan since then
they increased erratically to their current level of 190 kgfeddan in 198081
(Figure 6) As a result of these two effects the total output of millet
increased from just under 300 thousand metric tons in 196970 to just under
500 thousand metric tons in 198081 Among the major grains and oilseeds
grown in the Sudan (groundnuts sesame dura wheat) output of millet has
generally ranked third behind dura and groundnuts In terms of areas cropped
only dura exceeded that for millet Thus while it has little value as an
export millet is an important foodgrain and should figure significantly into
any policies designed to achieve food self-sufficiency and improve rural
incomes
Millet sorghum groundnuts and -esame all typify the performance of the
rainfed sector Output increases have been achieved through increases in
areas cropped in the presence of declining or st3gnant yields
15
I~bll --- l~kd1UI
AREA (000 feddans)
3000
2750shy
2500shy
2250shy
2000shy
1750shy
1500-
I II 1 1 111 1 11aI aIi 1
697 70 71 72 73 74 75 76
YEAR Source Food and Agriculture Organization of the United Nations Sudan
October 1980
1 I I I I I III I I11 1I7
77 78 79 8081
Report of FAO Programming Mission
Figure 6 AVERAGE YIELDS OF MILLET
196970 198081 YIELD (kgfeddan)
250
225
200
175
ISOshy
125
100
6970 70 71 72 73 74 75 76 77 78 79 8081
Source YEAR
Food and Agriculture Organization of the United Nations Sudan Otober 1980
Report of FAO Proqramning Mission
SECTION 3 THE STRUCTURE OF INCENTIVES
The structure of incentives comprises the tax system exchange rate
policies prices of agricultural commodities and government intervention in
the markets for agricultural inputs and outputs such as subsidy programs and
parastatal involvement in the production and distribution system This strucshy
ture affects resource allocation decisions in agriculture because it generates
a real price or cost for every input and output to which producers respond
It determines the performance of the sector any problems can best be solved
by changing the structure Although some elements of the incentive structure
are common to all subsectors within agriculture the precise characteristics
vary with the type of production system For example the joint account
system used in the irrigated schemes governed tenants decisions regarding
which crops would receive their time and resources but it did not directly
affect producers in the rainfed sector The purpose of this section is to
examine the structure of incentives in the traditional and mechanized rainfed
sectors
Rainfed agriculture has historically been a part of the private sector
unlike the irrigated schemes While private agriculture can benefit from
increased government support (for example improvements in the infrastructure
and agricultural research) it has been responsive to price incentives
Rainfed producers are more responsive to market forces than producers in irrishy
gated schemes Public sector investment designed to improve the functioning
of provincial markets including the development and dissemination of agrishy
cultural research results and marketing information would capitalize on the
intrinsic strength of the rainfed sector and yield high returns to relatively
small outlays
18
31 The Tax System
Tax revenues have consistently provided at least 80 percent of total censhy
tral government revenue since the mid-1970s [8] Of this amount indirect
taxes have accounted for about 80 percent direct taxes on income and profits
f-r 10-15 percent and export duties for 5-10 percent The heavy reliance on
indirect taxes is unusual for an African country [8] To better understand
how the tax system affects the agricultural sector the discussion in this
section focuses theon incidence of direct and indirect taxes on exports
imports and domestic production (The implicit taxation from exchange rate
overvaluation is discussed in Section 32) It should also be noted that this
discussion is primarily descriptive others have studied the tax system
extensively and made recommendations for its reform and improvement [1 8] A
principal recomnendation includes eliminating specific taxes in favor of ad
valorem taxes to increase both the buoyancy of the tax system and its proshy
gressivity Although some reform would be desirable the present tax system
is not a significant explicit disincentive to producers in the rainfed sector
especially traditional producers
311 Exports
Exports are taxed directly through export duties and indirectly through
the development tax Export duties are ad valorem taxes There are several
rates most between 5 and 15 percent in the past the rate for a specific
commodity has varied widely from year to year The duty on cotton was elishy
minated in 1980 as was the duty on sesame Exports )f dura are currently
taxed at 25 percent millet groundnut cottonseed cottenseed and sesame
cake and vegetable oils are taxed at 15 percent Livestock and livestock
products are taxed at rates of 5 10 14 15 20 and 25 percent A developshy
ment tax of 5 percent (essentially a manufacturers sales tax) currently
19
applies to exports of all commodities Thus for any export there will be a
wedge of at least 5 percent Lp to a maximum of 30 percent between world and
domestic producer prices
312 Imports
Imports are subject to customs duties consumption duties and the
defense tax The combined levies on imports account for about 50 percent of
total tax revenues [8] Customs duties alone generated around 40 percent of
all tax revenues they comprise 25 ad valorem rates (the basic rate is 40
percent) and 16 specific rates Development items are generally taxed at the
lower rates while the highest rates (100 to 900 percent) are applied to
luxury items Consumption duties applied to beer cigarettes matches motor
fuel and lubricating oil are equivalent to the excise taxes levied on
domestic production Prior 1979to the 5 percent development tax applied to
all imports except wheat and flour medicines and milk for babies This was
lifted in 1979 and a 5 percent defense tax took its place In March 1981
the defense tax was increased to 10 percent
The rainfed sector unlike the irrigated sector uses few imported inputs
and is thus relatively immune from the impacts of these taxes Seeds insectishy
cides and agricultural machinery were exempted from customs duties in 1976
Imports of urea and other fertilizers were taxed at 5 percent and sacks and
bags at 12 percent However many of the inputs to the transportation sector
are subject to import dutieF railway rails (10 percent) diesel fuel (15
percent) railway equipment parts (20 percent) freight cars (25 percent)
tires and trucks (30 percent) petroleum and all other railway equipment (40
percent)
Except for millet and sorghum many agricultural commodities are taxed at
rates designed to protect domestic production Wheat and wheat flour are
20
taxed at 25 percent refined sugar at 30 percent rice cottonseed and oil
cake at 40 percent bread at 50 percent groundnuts raw sugar and all other
grains at 70 percent Inexplicably several commodities subject to customs
duties are either directly subsidized (wheat flour sugar bread) or used in
heavily subsidized industries (rail transport) The subsidies on wheat and
sugar are currently being phased out [20]
313 Taxes on Domestic Production
Taxes levied on domestic production include the 5 percent development
tax a complicated system of 33 categories of excise taxes employing both ad
valorem and specific rates and local taxes Specific excise taxes are
applied to the production of wheat flour vegetable oils and sugar the
development tax would only apply to an agricultural commodity if it were
processed--vegetable oils for example Local taxes (ushur) are levied on the
output of mechanized farms in the west and southwest they are an important
source of revenue for the regional governments The amount of the tax varies
from region to region but is usually between 10 and 15 percent Detailed
information on these taxes is not available local taxes are a disincentive
because they drive a wedge between the demand and the supply price and
farmers revenues are generally decreased
32 The Exchange Rate System
Exchange rate policies are a critical factor in the structure of incenshy
tives facing agriculture An overvalued exchange rate has two important
effects First it discourages the production of exportables and import
substitutes because the prices (in domestic currency) received by producers
are below those they would receive if the exchange rate were at its market
equilibrium Second it stimulates the demand for imports by effectively
lowering the prices domestic consumers have to pay
21
321 Exchange Rate History
Prior to March 1972 the official exchange rate at which all commodities
were traded was fixed at $287 = LS1 (LS0348 = $1) In March 1972 a de
facto devaluation of 15 percent was accomplished thro gh an exchange subsidy
for receipts and an exchange tax on payments this established an effective
exchange rate of $250 = LS1 (LSO4 = $1) that applied to all transactions
except exports of cotton and gum arabic In May 1975 gum arabic exports were
moved to the effective rate A second devaluation took place in June 1978
The official rate was fixed at $250 = LS1 and the effective rate was
devalued to $200 = LSl (LSO50 = $1) by increasing the exchange taxsubsidy
rate Cotton remained the only commodity traded at the official rate all
other exports and all imports were converted at the effective rate
In September 1979 a third devaluation occurred The official rate was
fixed at $200 = LS1 (the old effective rate) The exchange taxsubsidy proshy
gram was eliminated and a parallel rate was established in its place at
$125 - LS1 (LS08 = $1) At the same time however the list of comshy
modities and transactions converted at the official rate was expanded to
include government transfers essential imports invisibles and traditional
exports such as cotton groundnuts dura and sesame Only nontraditional
exports (about 8 percent of the total) and imports previously brought in under
the nil value license system (approximately 30 percent of the total) were
traded at the new parallel rate Thus this devaluation did little to
stimulate traditional exports or curb imports
One year later in September 1980 many of the commodities traded at the
official raue were shifted to the parallel rate The official rate still apshy
plied to cotton wheat flour sugar petroleum pharmaceuticals and powdered
milk During the third quarter of 1981 cotton was finally transferred to the
list of commodities traded at the parallel rate
22
On November 9 1981 the two-tiered system of exchange rates was replaced
by a unified system and devalued to $111 = LS1 (LS09 = $1) [20] This
policy change corrected one of the greatest distortions in the structure of
incentives in the agricultural sector by eliminating much of the overvaluation
that characterized the exchanqe rate system in the past This point is
discussed further in the following section
322 Overvaluation of the Exchange Rate
An overvalued exchange rate implicitly taxes exports and subsidizes
imports by an amount equal to the overvaluation This section presents
estimates of the overvaluation of the official and effective (or parallel)
exchange rates results usedThe are in estimating the net protection of
three important rainfed crops (Section 33)
A purchasing-power-parity appr-oach was used to convert nominal exchange
rates to rel rates This iovolved selecting an appropriate base year
obtaining an estimate of the real rate in the base -ear and calculating a set
of deflators The year 1972 was selected as the base because in FY 1973 (1
July 1972 - 30 June 1973) the current account was almost in balance with a
small surplus of LS500 thousand An estimate of the real exchange rate in
1972 was obtained from PicKs Currency Index [14] by averaging the black
market rates for that year The deflator for Each year is the ratio of two
ratios the numerator is the ratio of Sudans CPI for the year of interest to
the CPI in 1972 the denominator is the ratio of the IBRD world inflation
index in the year of interest to the index in 1972 The real exchange rate
for a given year is the product of the deflator for that year and the real
exchange rate in 1972 The amount of overvaluation in each year was calcushy
lated as the percentage difference between the real and nominal exchange rates
The results which are presented in Table 1 should not be interpreted as
23
Table 1 Overvaluation of the Exchange Rates
Official Effective (parallel) Over- Over-
Nominal Real a valuationb Nominal Real a valuationb (LS$) (LS$) (M) (LS$) (LS$) (M)
Pre June 0348 0640 839 0400 0640 600 Post June 0400 0640 600 0500 0640 280
1979
Pre September 0400 0731 828 0500 0731 462 Post September 0500 0731 462 0800 0731 -86
1980 0500 0819 638 0800 0819 24
1981 Pre November 0500 - - 0800 - -Post November 0900 - 0900 -
aThe 1972 black market rate from Picks Currency Index (LS0516=$1) was assumed to
be the real exchange rate in that year Real rates for the remaining years were calculated using the consumer price index for Sudan (1975 = 100) CPI S the IBRD world inflation index (1975 100) CPI W1 and the followiig formula
C CPIW i 72
i 72E -E S W where E is the real exchange rateCP172 CPI 1 in year i
E - E
Overvaluation x 100 where E is the nominal exchange rate in year i E 1
24
estimates of the shadow exchange rate because the prices of traded commodities
are included in the Sudanese and world CPIs in the deflator A shadow
exchange rate would reflect price changes in Sudans home (nontraded) goods
relative to price changes in the home goods of its major trading partner for
example the EEC However such indexes were not available so the estimates
of real exchange rates were used as proxies for shadow exchange rates
The results show that exports traded at the official rate were implicitly
taxed at rates between 40 and 80 percent imports brought in at this rate were
subsidized by equivalent amounts Until September 1979 when the parallel rate
was established the amount of overvaluation ranged from 25 to 60 percent
The parallel rate was slightly undervalued (9 percent) but because most comshy
modities were shifted to the official rate at that time the implicit tax
(subsidy) on exports (imports) was over 40 percent During 1980 the parallel
rate was only slightly overvalued Thus trading many commodities at the
parallel rate removed much of the implicit taxation or subsidization
However the tax rate on cotton and the subsidy rate for wheat flour sugar
petroleum and pharmaceuticals climbed to over 60 percent since these
commodities were traded at the official exchange rate Although price indexes
for 1981 are not available the unification and devaluation of the exchange
rates in November 1981 probably brought the nominal exchange rate closer to
the real price of foreign exchange since inflation in Sudan has reportedly
been higher than the world inflation rate Since all of Sudans exports from
the rainfed sector have been traded at close to the real price of foreign
exchange since September 1980 the November 1981 exchange rate regime will not
significantly boost exports from this sector The major impact will tobe
increase the price of petroleum thereby inflating transportation costs
25
33 Pricing and Marketing of Selected Rainfed Crops
In a perfectly competitive economy agricultural producers would receive
100 percent of the world market price net of an efficient marketing margin
for their output Divergences from this ideal are introduced by exchange rate
overvaluations or undervaluations government taxes and subsidies and inshy
flated marketing margins If the net effect of these factors raises producer
prices above world prices positive protection exists and producers are
effectively subsidized by the amount of the difference between world and
domestic prices If the net effect is to depress producer prices relative to
world prices the protection is negative and producers are effectively taxed
by the amount of the price difference The purpose of this section is to
estimate the net protection of dura sesame and groundnuts in three proshy
vincial markets over time and examine the policy implications of the results
The net protection rate is the difference between the nominal protection
rate (NRP) and the amount of exchange rate overvaluation The NRP for a
commodity captures the effects of government taxes and subsidies on the output
of that commodity it is the percentage difference between the domestic
producer price and the world (border) price adjusted to reflect transport and
marketing costs Estimates of the NRPs are presented in Section 331 In
Section 332 these are combined with the effect of the overvalued exchange
rate (Section 322) to arrive at an estimate of the net protection for the
major rainfed crops
331 Nominal Protection Rates
Four markets in three provinces were selected for analysis The Gedaref
market in Kassala (Eastern Sudan) is one of the largest markets for dura and
sesame El Obeid in Northern Kordofan is a major trading center for Western
26
Sudan dura sesame and groundnuts are among the commodities marketed In
the White Nile Province (Central Sudan) Kosti represents a major market for
dura while large quantities of sesame and groundnuts are traded in Tendelti
All four markets are linked by rail to Khartoum and Port Sudan
Producer prices in these markets for the crop years 197576-197879 are
presented in Table 2 There is considerable variation both across markets in
a given year and across time in a given market In general prices are higher
in the western markets than in the central and eastern markets These
variations reflect differences in transportation costs production costs
demand conditions and levels of marketed surpluses The producer prices of
dura in El Fasher (Northern Darfur) which are significantly higher than the
prices in other markets are also presented to support a conclusion that will
be drawn from the analysis of the NRPs below
The cost of transportation from the market to Port Sudan must be netted
out of the border price of each commodity to determine the border price facing
the producer or the export parity price Ideally other marketing costs
such as storage handling and commissions should also be netted out this
information was not available so the marketing margin is not treated in this
analysis Two sets of transprotation costs were estimated one for road
transport by lorries and one for rail transport (see Table 3A) Rail
transport costs were assumed to be 50 percent of road transport costs no
attempt was made to calculate transportation costs by commodity These costs
which are given in piasters per ton kilometer were multiplied by the distance
of each market from Port Sudan (Table 36) and the result was suotracted from
the border prices of the commodities to determine the export parity prices
The percentage difference between the producer and export parity prices of a
commodity is the nominal protection rate for that commodity these are preshy
27
Table 2
Dura
aPort Sudan (FOB)
Gedaref
El Obeid
Kosti
El Fasher
Sesame
aPort Sudan (FOB)
Gedaref
El Obeid
Tendelti
Groundnuts
Port Sudan (FOB)a
El Obeid
Tendelti
Producer Prices of Selected Rainfed Crops by Provincial Market (LSton)
19751976 19761977 19771978 19781979
434 453 540 885
178 277 356 411
461 527 451 1181
224 210 477 412
733 1365 1097 1255
1841 2037 2601 4040
1112 691 1147 1566
1250 1332 816 1409
1205 857 1292 2079
1371 2176 2091 2827
624 973 805 1079
700 546 765 974
Sources Internal Trade Statistics and Price Indices 1978 Department of Statistics Ministry of Planning April 1981
Sudan Foreign Trade Analysis 1970-1979 Department of Statistics Ministry of Planning May 1981
aExport (border) prices FOB Port Sudan in LSton converted at official exchange rate
28
Table 3A Transportation Costs (ptton km)a
RailbRoad
1976 14 07
1977 20 10
1978 30 15
1979 35 18
Sources John F Due Rail and Road Transport in the Sudan Faculty Working Paper No 423 Universityof Illinois at Urbana-Champaign July 1977 Thurvald Moe World Bank
aRates assumed to be the same for all commodities
bAssumed to be one-half the road transport costs
Table 3B Distances of Markets to Port Sudan (km)
Road Rail
Gedaref (Kassala) 852 800
El Obeid (N Kordofan) 1613 1537
Kosti (White Nile) 1512 1217
Tendelti (White Nile) 1624 1313
29
sented in Table 4 Because not all marketing costs could be identified these
estimates understate positive protection and overstate negative protection
Most of the NRPs for dura marketed in Gedaref are negative Nominal
protection tended to increase (the NRPs became less negative) from 197576
through 197778 but decreased sharply in 197879 However NRPs for dura
marketed in El Obeid and Kosti paint a different picture Both NRP estimates
for the El Obeid market show high levels of positive protection those based
on road transport costs range between 120 and 700 percent while those based
on rail transport costs are between 40 and 90 percent The results for dura
traded in Kosti are mixed the NRPs based on road transport costs are conshy
sistently positive (between 1 and 450 percent) while those based on rail
transport costs are negative for all years (around -37 percent) except
197778 Since a positive NRP implies that the producer is receiving more
than the world market price dura from El Obeid and Kosti could not be
competitive on the export market Saudi Arabia has recently been importing
Sudanese dura at a premium above the world price but this does not account
for the positive NRPs in the earlier years Since there were no explicit
subsidies in these two markets the high positive protection rates could
reflect high marketing costs disarticulated regional markets export markets
other than Port Sudan or all three of these
For example El Obeid dura is competitive in the west Prices in the El
Fasher and Nyala markets in the Darfurs (see Table 2) were significantly above
those in other provincial markets reflecting a high demand for Sudanese dura
in Chad and the Central African Republic to alleviate the food shortages in
these countries Political unrest in the Kordofans and Darfurs kept prices
high as people stockpiled food against possible interruptions in supply The
El Obeid market and possibly the Kosti and Tendelti markets as well
30
Table 4 Nominal Protection Rates for Selected Rainfed Commodities ()a
19751976 19761977 19771978 19781979 NRP NRPc NRP b NRP c NRP b NRP NRP br NRPrd rr rrd rr rd rr rd rr
aNominal protection rate (NRP) = (pproducer pborder) - 1 Producer prices are from Table 2 Border prices taken from Table 2 and adjusted for transport costs from market to Port Sudan from Table 3
bNRPs calculated by netting road transport costs out of tie border price CNRPs calculated by netting rail transport costs out of the border price
supplied these needs El Obeid served the same function for Western Sudan and
its neighbors as Port Sudan did for the world market Thus while El Obeid is
not export competitive because of cost barriers between it and Port Sudan it
is competitive in its own region even given the high costs incurred in shipshy
ping dura to markets further west Even if links between El Obeid and
Khartoum and Port Sudan are improved the El Obeid market will probably
continue to supply the western regions rather than becoming a major supplier
of the eastern provinces and the export market
Sesame is heavily taxed in the Gedaref El Obeid and Tendelti markets
Nominal protection in Gedaref decreased from about -35 percent in 197576 to
between -50 to -65 percent from 197677-197879 In El Obeid the NRPs were
between -20 and -30 percent in 197576 and 197677 then sharply decreased to
-60 percent in 197778 and 197879 Nominal protection for sesame marketed in
Tendelti decreased from -30 percent in 197576 between 40to to 50 percent
from 197677-197879 Thus producers were confronted with greater disincen-
Lives in the last two years of the period since the effective taxation of
their output increased That the nominal protection for sesame is signifishy
cantly less than that for dura in these markets probably had a debilitating
influence on the production of sesame relative to dura The negative protecshy
tion of sesame relative to dura across widely dispersed markets may also help
to account in part for the trend towards the monoculture of dura in rainfed
agriculture and may also indicate a bias in government policies in favor of
food production and against cash crop production Given the relative riski-shy
ness of sesame production and its potential for export earnings a lower level
of taxation would appear warranted
Producers of rainfed groundnuts also faced severe disincentives in the
markets examined The gap between road and rail transport costs made little
32
difference in the El Obeid market NRPs consistently remained around -50
percent from 197576-197879 In Tendelti which is closer to Port Sudan
nominal protection decreased sharply from -40 percent in 197576 to -70
percent in 197677 then increased to about -60 percent in the last two years
of the period These NRPs which are about par with those for sesame and
significantly lower than those for dura lend credence to a pro-food cropantishy
cash crop bias in the structure of incentives in the rainfed sector
332 Net Protection Rates for Selected Rainfed Crops
The analysis of nominal protection rates did not account for the impact
on the producer of overvalued exchange rates Since an overvalued exchange
rate implicitly taxes agricultural production it decreases the nominal proshy
tection If there is negative nominal protection the overvaluation would
make the protection rate moreeven negative thereby adding to the overall
taxation of output This section presents estimates of the netprotection for
rainfed commodities which is defined as the difference between the NRPs
(Section 331) and the overvaluation of the exchange rateofficial (Section
322) The results shown in Table 5are
Since the nominal protection for sesame and groundnuts was negative in
all markets during the period the overvaluation of the exchange rate further
reduced the protection of these crops The net protectioo rates for sesame
and groundnuts were usually between -100 and -130 percent over the period A
brief example will illustrate the effect of protection rates of this magnitude
It is appropriate to use the overvaluation of the official exchange rate even though most rainfed products are traded at the effective or parallel ratebecause all trade statistics from which the border prices were taken are converted at the official rate
33
Table 5 Net Protection of Selected Rainfed Commodities ()a
aNet protection = NRP minus the percent overvaluation of the exchange rate Overvaluation of the officialexchange rate was used in these calculations because all trade statistics (from which tile border priceswere taken) are converted at this rate
bCalculated using the NRP rd entries from Table 4
CCalculated using the NRP entries from Table 4 dweighted average of overvaluations in 1978 to account for the June devaluation
eWeight-d average of overvaluations in 1979 to account for the September devaluation
on producer incomes If the net protection of a crop was -100 percent and the
producer received LS500 for his output theincreasing protection to zero
percent would add LS1000 to his revenue increasing net protection to -50
percent would double his revenue Thus negative net protection rates of this
size not only are a severe disincentive to production but also have signifishy
cant income effects
The net protection of dura marketed in Gedaref arid Kosti is generally
negative regardless of which set of transportation costs are used Although
net protection increases (becomes less negative) in these markets from
197576-197778 it decreased sharply in 197879 (see Table 5) The net
protection rates based on road transport costs for dura marketed in El Obeid
are still positive and range between 60 600 percentand over the period
Those based on rail transport costs oscillate closely about percenta zero
rate over time hence transport costs and the availability of transportashy
tion are a critical determinant in the export competitiveness of dura
34 Subsidies in the Rainfed Sector
The mechanized farming schemes are the principal recipients of subsidies
to rainfed agriculture Because of the nature of traditional farming such as
the way land is allocated (there is no private ownership of land)farm and
cultivation methods the traditional rainfed sector is not subsidized to any
extent The three types of subsidies considered in this section are exchange
rate overvaluation low land rents and credit extension by the Agricultural
Bank of Sudan (ABS)
The overvalued exchange rate implicitly subsidizes imported inputs such
as petroleum agrochemicals tractors spare Thereand parts is an
additional subsidy if the input is traded at the official rather than the
parallel rate as petroleum was Since traditional rainfed agriculture uses
35
very few imported inputs jute sacks being the primary one the mechanized
schemes were the primary beneficiaries of the implicit factar subsidies
However the recent exchange rate unification and devaluation of Noveraber 1981
eliminated this subsidy As a result the cost of production on these schemes
will rise significantly Unless there is a corresponding increase in the
prices of agricultural commodities the more inefficient private mechanized
farms will fail Thus at least in the short run the growth of +his sector
could stagnate
The low annual land rent (5 ptfeddan in 1977) has several Undesirable
effects It is far below the opportunity cost of the land (LS10feddan)
[16] Thus extensive use of the land is encouraged Low land rents are a
disincentive to capital investment in land because there is not incentive to
adopt modern technology that would exploit the land already under cultivation
The fact that horizontal expansion of the mechanized farming sector is encourshy
aged might also contribute to soil conservation problems With land essenshy
tially a free good and currently available at an almost infinitely elastic
supply there is no incentive to save that resource or augment its productivshy
ity This problem is closely related to yet another form of subsidy credit
extended by the ABS
Although not intended to be a subsidy the poor repayment of loans
extended by the ABS has transformed its loan program into a subsidy program
With land underpriced and readily available there is a tendency to use credit
to meet annual operating expenses rather than to invest in capital that would
enhance the productivity of the land A bad harvest will mean the farmer is
unable to repay the loan Since the farmer has not invested in capital
assets the bank cannot recover its money since the farmer has little incenshy
tive to repay
36
Because a primary offactor production is greatly undervalued and the
cost of entry into mechanized farming is relatively low there is little or no
penalty attached to the use of inferior complementary factors of production
such as farm management skills This increases the probability of poor pershy
formance and its consequences abandonment of cleared land that will eventushy
ally be covered by scrub thorn bushes (thereby reducing the value of the land)
and a default on payments with little or no possibility of loan recovery
rhus low land rents and subsidized credit have resulted in undercapitalshy
ization of the rainfed agricultural sector and a poor credit recovery
experience Raising land rents and tightening up the conditions under which
loans are granted might lead to thA adoption of new technology and consequentshy
ly to more intensive use of the land Productivity would increase total
output might increase even though fewer farms might be operating and soil
conservation problems would ease Additionally the increased -evenues could
be invested in developing the infrastructure which would make the marketing
and distribution systems more efficient as well as enhancing the value of the
land
35 Comparative Advantage in the Irrigated and Rainfed Sectors
In view of the current condition of the agricultural sector and Sudans
financial crisis it is important that any investments designed to rehabilishy
tate or to develop this sector be directed towards those areas and activitieshy
that will generate the largest returns A first step in this process is to
determine in which crops Sudan has a comparative advantage The domestic
resource cost (DRC) of producing a particular agricultural commodity is a good
measure of comparative advantage The DRC for an exportable good measures the
amount of foreign exchange earned when a unit of domestic resources is
37
committed to its production for an import substitute it gives the amount of
foreign exchange saved when a unit of domestic resources is used to produce
that good Since domestic resources are measured in units of local currency
and foreign exchange earnings or savings in foreign currencies the DRC for a
good is an exchaiige rate that applies to the production of that good When it
is divided by the shadow price of foreign exchange the DRC becomes a unitless
number If it is less than one the country or region has a comparative
advantage in its production because it can exchange domestic resources for
foreign exchange at a rate below that at which the economy as a whole converts
domestic resources into foreign exchange a DRC greater than one means that a
comparative disadvantage exists
Table 6 presents the DRCs of the four major export crops and the two
import substitutes in the irrigated and rainfed sectors DRCs of irrigated
crops are given for two crop years 197273 and 197677 The results show
that Sudan clearly has had a comparative advantage in the production of longshy
and medium-staple cotton and sugar Production of wheat shows a comparative
disadvantage the Sudan would have saved foreign exchange if less wheat had
been domestically produced The Sudan moved from a comparative disadvantage
in the production of irrigated dura to a competitively neutral position The
competitiveness of irrigated groundnuts also improved over the period The
DRCs of traditional and mechanized rainfed crops are also given for the
198081 crop year (with the exception of groundnuts) For each subsector
DRCs were calculated under two yield assumptions The high yield assumption
is more optimistic the low yield was assumed to be 75 percent of the high
yield in each case and better reflects past experience
The DRCs for the traditional subsector apply to crops grown in the
Nuba Mountains of Southern Kordofan This region has a strong comparative
38
--
-- ---- --
-- __
-- -- --
-- --
__
Table 6 Domestic Resource Costs of Selected Crops=
Rainfed (198081)
Traditional Traditionalb MechanizedIrriqated Modernized(Nuba Mountains Mechanized private d
State farms(Nuba Mountains)197273 197677 (Eastern Sudan)Low Yield High Yield (Eastern Sudan)Low Yield High Yield Low Yield High Yield Low Yield High Yield
aDomestic resource cost (DRC) is tile value of domestic resourc s (infeddan divided by the Sudanese pounds) committed to is a unitless number
value 3dded in world prices (US dollars) This result is the production of output from one
A value less than one then divided by the real exchange rateindicates a coaparative advantage the result a value greater than onedisadvantage indicates a comparative
Daafrom K NashashibiVol 27 No A Supply Framework1 March 1980 Tables 3 and 4 for Exchange RenrnReal exchange rates in Developing Countiesor [S050 = $1 Ihe Experience of Sudonfor 1973 and LS061 IMFStaff apers= $1 for 1977 were used asfor the shadow exchange rate proxiesin those years CData from Sudanese Consulting Bureau adapted by Sigma One Corp exceptdData fom Sudanese Consulting Bureau adapted by Sigma One Corp
for groundnuts High yields taken from SCB data low yields are 75 percent of high yields
advantage in the production of short-staple cotton dura and sesame under
both yield assumptions The modernized traditional schemes DRCs(the are
given in parentheses in Table 6) however do not fare as well low dura
yields place these schemes at a comparative disadvantage Groundnuts producshy
tion also enjoys a comparative advantage although not as great as that of
sesame dura and cotton at lower yields
The DRCs for the mechanized rainfed sector apply production in theto
province of Kassala (Eastern Sudan) Results are shown for both private farms
and state-run farms (numbers in parentheses) Both private and state-owned
mechanized schemes are competitive in the production of cotton and sesame
under both yield assumptions The state-run farms are at a comparative disadshy
vantage in dura production at both yield levels Private tenancies are compeshy
titively neutral in dura production when yields are low but have a comparashy
tive advantage at higher yields
In summary Sudan has a clear comparative advantage in cotton production
in both the irrigated and rainfed sectors The sharp decline in rainfed cotshy
ton output is attributable to the governments policy of fixing producer
prices at a level far below the world price of short-staple cotton In dura
production the traditional rainfed sector has a competitive edge over the
irrigated sector the modernized rainfed subsector and the mechanized rainfed
sector The traditional sector also has a comparative advantage relative to
the irrigated in thesector production of groundnuts Both the traditional
and mechanized rainfed subsectors show a comparative advantage in sesame proshy
duction The rainfed sector has benefited from recent policy changes These
are necessary conditions but are not sufficient to elicit major output
increases from this sector Much remains to be done in the areas of tax
reform agricultural research and improvements in the marketing system
40
SECTION 4 IMPACTS OF THE STRUCTURE OF INCENTIVES ON
FOREIGN TRADE AND THE DOMESTIC ECONOMY
The structure of incentives in the agricultural sector has directly
contributed to problems in Sudans domestic economy and in its foreign trade
position This section analyzes the recent performance of foreign trade
(Section 41) and certain aspects of the domestic economy (Section 42) The
deterioration of the economy has been caused by distortions in the structure
of incentives thus solutions to these problems are best achieved by
eliminating these distortions Section 43 examines the likelihood of meeting
the objectives set out for rainfed agriculture in the Export Action Program
given recent changes in the incentive structure
41 Recent Foreign Trade Performance
Sudans balance of payments position deteriorated drastically during the
1970s mainly as a result of a steadily worsening balance of trade In FY
1973 exports of goods and services exceeded imports by $50 million In FY
1974 there was a deficit of $280 million because of the increase in world oil
prices The trade balance continued to decline until by FY 1981 imports were
close to $2 billion while exports were just over $1 billion Much of the
deterioration in Sudans trade balance occurred because the volume of exports
declined erratically from 1974 on while import volumes were generally higher
than their 1970 level (see Table 7) Table 7 also shows that the terms of
trade contributed to the declining trade balance but were not the primary
cause The net effect of the volume and price changes was that the nominal
value of exports more than doubled from 1970 through 1979 while the nominal
value of imports more than tripled
41
Table 7 Foreign Trade Indexes
Export Indexes Import Indexes Terms of Value Volume Price Value Volume Price Trade
1970 1000 1000 1000 1000 1000 1000 1000
1971 1817 1417 1282 1179 1057 1115 1150
1972 1217 1127 1080 1088 949 1146 942
1973 1425 1118 1275 1544 1098 1406 907
1974 1518 679 2236 2291 1004 2282 980
1975 1542 781 1974 3253 1158 2809 703
1976 1808 1031 1754 3496 1249 2799 627
1977 1722 778 2214 3253 1171 2778 797
1978 2534 864 2933 3564 1089 3273 894
1979 2372 758 3129 3551 968 3668 853
Source Sudan Foreign Trade Analysis 1970-1979 Dept of Statistics Ministry of Planning May 1981
42
411 Exports
Table 8 shows the contribution of the major export crops to the total
value of exports for selected years Although the export mix has varied from
year to year cotton has always been the major export crop accounting for 50
to 60 percent of the total value of exports Groundnuts and sesame have
generally been the second and third largest contributors although in 1979
sorghum was the second largest export crop of valuein terms The irrigated
sector produced almost all the cotton that was exported while the rainfed
sector accounted for all the sorghum and sesame each sector generated roughly
equal amounts of the export value of groundnuts
As can be seen the irrigated sector alone accounted for over half the
total value of exports with the production of a single commodity cotton The
rainfed sector generated about 40 percent oF total export earnings about 15
percent of this amount was in the four major crops While its relative conshy
tribution in these crops may be small exports from the rainfed sector proshy
vided diversification in the export mix a policy objective that the governshy
ment tried to achieve in the irrigated sector with little success
The reason behind the decrease in total export volumes can be seen by
examining the export volumes of selected commodities (Table 9) The decline
over the 1970-1979 period of long-staple cotton exports from the irrigated
sector to 50 percent of their 1970 volume is the chief reason Groundnuts and
sesame exports which had been fairly strong through the late 1970s suddenly
fell off in 1979 because of production difficulties nd government policies
restricting the exports of oil Asseeds a result their contribution to the
total value of exports decreased from 23 percent in 1977 to 8 percent in 1979
(see Table 8) Dura exports grew at a phenomenal rate in 1979 the volume
was over 100 times that in 1970 This growth is attributable to a special
43
Table 8 Composition of Exports (percent of total export value)
1971 1973 1975 1977 Irrigated 1979 Rainfed Total
Cotton
Sorghurr
Groundnuts
61
1
8
55
2
9
46
2
23
57
3
13
55
-
2
2
7
3
57
7
5
Sesame 7 8 8 10 - 3 3
Cake and meal
Other a
4
19
5
21
3
18
3
14
2
-
3
23
5
23
aIncludes gum arabic livestock and all other exports
Source Export Action Program 1980-1990 Ministry of National Planning September 1980
44
Table 9 Volume Indexes for Selected Exports
Long-staple Total Cotton Dura Groundnuts Sesame Exports
1970 1000 1000 1000 1000 1000
1971 1111 19040 2060 1176 1417
1972 1111 30380 1949 1057 1127
1973 980 52164 2357 1279 1118
1974 399 49945 2208 1317 679
1975 620 24434 3496 692 781
1976 850 47744 5201 1264 1031
1977 683 67864 2725 1335 778
1978 433 32337 1665 826 864
1979 526 100143 780 215 758
Source Sudan Foreign Trade Analysis 1970-1979 Dept of Statistics Ministry of Planning May 1981
45
trade agreement with the Government of Saudi Arabia which pays a premium over
the world price for Sudanese dura Recently sorghum output has continued to
expand in response to the Saudi market and the fact that since September 1980
it has been traded at the parallel rate The 1981 sorghum crop is reported to
be a record 28 million tons 55 percent more than 1980 Even so the contrishy
bution of dura to the total value of exports only increased from 1 to 7 pershy
cent from 1971 to 1979 primarily because dura is a low value commodity
compared with cotton groundnuts and sesame Even if all the additional outshy
put for 1981 were exported the increase in the volume of dura exports could
not offset the poor export performance of other agricultural commodities The
experience with dura does however illustrate the potential of the rainfed
sector to respond to price incentives
412 Imports
Table 7 showed that the index of the value of imports increased steadily
over the 1970s rising to 35 times its 1970 level by 1979 This resulted
from increases in both the volume and prices of imports as the indexes show
Historically Sudan has spent much of its available foreign exchange on intershy
mediate goods and capital equipment which were used to develop the manufacturshy
ing sector of the economy Another important use of foreign exchange has been
to purchase food primarily wheat flour and sugar
One reason for the crop diversification program undertaken in the irrishy
gated sector in the mid 1970s was to reduce the reliance of the economy on
food imports the ultimate objective was to become a net exporter of food
From 1972 to 1974 the proportion of total export earnings spent on food
imports increased from 18 percent to 30 percent (Table 10) food imports as a
percent of total import expenditures were fairly constant at 23 percent From
1974 to 1979 foreign exchange earnings spent on food eased from 30 percent to
46
Table 10 Food Imports and Supply of Foreign Exchdnge
Total export Food imports as Food imports asFood imports earning5 percent of export percent of total
(106 $)a (106 $) earnings importsc
1972 669 3781 177 235
1973 996 4851 205 223
1974 1406 4717 298 228
1975 1524 5597 272 168
1976 1025 7284 141 133
1977 872 8437 103 95
1978 1235 8231 150 122
1979 1148 8488 135 125
aIncludes imports uf unmilled wheat rice wheat flour sugar coffee and tea Sudanese pounds converted to current US dollars at official exchange rate
bExport earnings are the sum of exports of goods and services and private and official unrequited transfers
cFrom Bank of Sudan Annual Reports 1973 1977 1979
47
14 percent of the total food declined from 23 percent to 13 percent of the
total import bill over this period This level of dependence on food imports
is high in comparison to other sub-Saharan African countries particularly
since the official statistics may not include all food aid The average ratio
of food imports to foreign exchange earnings for six other sub-Saharan African
countries over the 1965-1976 period ranged from 2 percent to 12 percent 5 out
of 6 were between 2 and 7 percent [18]
4122 Wheat and Sugar Imports The quantity price ard value indexes
for wheat and sugar inorts (the bulk of ood imports) show why expenditures
on food claimed a high proportion of the total supply of foreign exchange
(Table 11) Although the volume of wheat and flour imports declined throughshy
out most of the 1970s then increased in 1978 and 1979 to close to their 1970
levels the price rose to more than twice its 1970 in 1974level remained
there through 1978 and quadrupled in 1979 Since 1979 wheat imports have
continued to grow to a level in excess of half a million metric tons per year
Of this concessionary sales from the United States represent almost a third
The volume of sugar imports was almost 70 percent higher in 1979 than itwas
in 1970 Sugar prices peaked at 6 to 7 times their 1970 level in 1974 and
1975 then fell off to over three times the 1970 level by 1979 As a result
during the period 1973-1975 when food imports accounted for 20 to 30 percent
of total export earnings the value of wheat and flour imports was over 15
times the 1970 level while that for sugar was 4 to 7 times its 1970 level
Including concessional imports ($45 million) the 19801981 import bill for
wheat and sugar was in excess of $250 million US Even at these high levels
of wheat imports and increasing domestic output the price subsidy scheme that
maintains the price of bread artificially low has created excess demands A
48
Table 11 Import Indexes for Wheat and Sugar
Wheat and flour Sugar
Value Volume Price Value Volume Price
1970 1000 1000 1000 1000 1000 1000
1971 944 833 1133 1797 1585 1134
1972 961 961 10C0 1827 1062 1720
1973 1570 868 1809 3558 1635 2176
1974 1506 504 2988 5798 962 6027
1975 1620 610 2656 7428 1051 7068
1976 1420 551 2577 4133 1142 3619
1977 1226 598 2050 2379 1348 1765
1978 1644 753 2183 4424 1822 2428
1979 3780 951 3975 5467 1689 3237
Source Sudan Foreign Trade Analysis 1970-1979 Dept of Statistics Ministry of Planning May 1981
49
factor that has contributed to this is that wheat aiJ sugar were traded at the
overvalued exchange rate which helped maintain the prices of these commodities
at the artifically low levels
4122 Bread Price Policy Bread provides approximately one-third of
the calorie requirements for the population of the greater Khartoum conurbashy
tion Per capita consumption of wheat has been rising rapidly in the last few
years with about a third of the officially marketed wheat being consumed in
the Khartoum conurbation This increase cannot be explained by increased
incomes and growing urbanization It must in large part be attributable to an
explicit cheap bread policy for the urban dwellers Table 2 presents the
budget shares for bread for different income groups in Khartoum Even for the
lowest income group bread represents only 111 percent of food expenditures
and less than 7 percent of total expenditures Even if these figures exclude
food away from home for workers bread represents a high zhare of nutrients
and in relation to this a rather low share of food costs
Exchange rate unification the PL480-III Agreement with the United States
and negotiations with international lenders have placed pressure on the
government to raise the price of bread If import parity pricing were to be
applied to wheat and flour the price of bread would need to be increased by
about 80 percent Reportedly the government intends to raise the price of
bread by close to this amount (66 percent)
This has undoubtedly been a politically difficult decision but its real
impact should not be as great as the current political manifestations would
suggest if the demand for bread is totally inelastic in the short run the
The material sectionin this touches on several issues that will be more thoroughly analyzed in the forthcoming wheat pricing study being conducted by Sigma One Corporation
50
Table 12 Budget Shares of Bread
Income group Share of
Food expenditures Share of
Total expenditures
() ()
Urban Khartoum (3 towns)
All Groups 1061 620
lt 500 LS 1107 689
500-1000 1072 672
1000-2000 1106 678
2000-3000 1045 571
3000+ 854 400
Rural i oum
All Groups 406 274
lt 500 LS 410 313
500-1000 453 312
1000-2000 432 208
2000-3000 NA NA
3000+ 075 053
Source Department of Statistics Ministry of Planning Household Budget Survey 1979
51
cost of living impact will be about 5 percent in real terms for the lowest
income strata in Khartoum If bread is somewhat price elastic the cost of
living impacts are even lower In this case the consumption impacts would
reduce calorie intake by approximately 10 percent for consumers at the FAO
requirements and less for those above it Since there is little indication
that urban Khartoum h-s serious nutritional problems (save for the refugee
population) the deleterious impacts on human nutrition are likely to be
small
The timing for these actions is fortuitous in that Sudan has experienced
a bumper crop in dura and world wheat prices are depressed With exchange
rate unification and import parity pricing the domestic producer price of
LS16750 per ton will not change much This should enable significant savings
in treasury costs ($50 to $60 million) by eliminating the so-called producers
subsidy It is also reasonable to expect substitution of wheat demand for
dura consumption With these policy changes the growth in import demand for
wheat should be slowed The USAID PL480 Title III Program which was supportshy
ing the implicit subsidy can under the new policy regime facilitate the
transition to lower reliance on food imports by continuing the supply without
requiring an increase in the foreign exchange allocations to food imports
42 Fiscal and Monetary Impacts
Much of the impact of the structure of incentives on fiscal problems and
excessive growth of the money supply has occurred through the performance of
parastatal or public entities The poor performance of these state-run corshy
Concern for consumption and nutritional impacts on low-income and othershywise at-risk populations could be more effectively addressed through alternashytives such as the CRS Title II program
52
porations over the past several years created a growing demand for public
sector credit thereby exacerbating the governments budgetary problems and
forcing it to turn increasingly to external sources of credit to finance the
resulting deficits
Table 13 contains a breakdown of the money supply for FY 1975-FY 1980
The supply of money increased from LS277 million in 1975 to over LS1 billion
in 1980 at a compounded growth rate of 29 percent per year This is a primary
factor underlying the high rate of inflation Net claims on the public secshy
tor which comprises the central government local and provincial councils
and parastatal entities was the primary reason from LS250 million in 1975
they grew at an annual rate of 31 percent to over LS970 million in 1980 The
parastatals which include the agricultural and industrial entities and the
public utilities accounted for a substantial portion of the net claims on the
public sector The claims against these bodies increased from LS105 milshy
lion in 1975 to over LS240 million in 1980 growing at 20 percent perover
year Since their growth rate was lower than that of the money supply the
proportion of net claims on the parastatals to the money supply declined from
38 percent to 24 percent over the period Besides being inflationary public
sector borrowing of this magnitude crowds out private borrowing and thereby
inhibits the capitalization of the private sector
Of the parastatal entities the agi-icultural corporations and boards
receive the largest share of bank credit with the public utilities and the
industrial boards a distant second and third respectiely The boards conshy
trolling the irrigation schemes accounted for most of the credit extended to
agriculture by the banking sector Of LS140 million in 1977 these boards
received about LS120 million in 1980 they received LS205 million in credit
against a total of LS215 million [11] On the other hand credit extended to
53
aTable 13 Components of the Money Supply (LS millions)
1975 1976 1977 1978 1979 1980
Net foreign -10716 -19265 -19176 -21805 -20126 -28890 assets
Net claims on private sector 17569 23900 26447 31837 40724 52590
Net claims on public sector 25001 35773 51735 65826 84935 97160
Central government and local and proshyvincial councils 14512 24064 41339 54824 65973 72820
Total money supply b 27656 33233 46579 60667 82098 100250
Net claims on parashystatals as percentof money supply 379 352 223 181 231 243
aAll figures apply to end of the fiscal year (June 30)
bSum of net foreign assets net claims on private sector net claims on public sector and other items
Sources Bank of Sudan Annual Report 1977 1979 IMF Sudan-Recent Economic Developments SM8170 March 1981
54
the Mechanized Farming Corporation the only parastatal body directly involved
in rainfed crop agriculture increased from LS10 million in FY 1977 to
LS26 million in FY 1980
Rainfed agriculture is relatively isolated from the publiL sector
course it benefits (or suffers) from the performance of the largest public
utility Sudan Railways And most of the loans granted by the Agricultural
Bank of Sudan a government-controlled financial entity go to the rainfed
sector Thus any policy changes affecting the organization or financial
status of the parastatals would affect this sector primarily through its
credit availability and its marketing and distribution system Policy changes
would not be likely to directly affect the viability or productivity of the
sector as a whole as would changes in the boards operating the irrigation
schemes
As discussed above the subsidies on wheat and sugar are a drain on the
Treasury It is estimated that eliminating them would save between $50 and
$60 million per year This would reduce the budget deficit and consequently
ease inflationary pressures A smaller deficit would also mean less public
sector borrowing which would help the private sector by allowing more private
borrowing
43 The Export Action Program Potential of the Rainfed Sector
The Export Action Program (EAP) of 1980 outlines an ambitious program to
promote exports from the irrigated and rainfed sectors over the next 10 years
thereby increasing foreign exchange earnings and eventually solving Sudans
balance of payments problems The proposed program for the rainfed sector is
not as detailed or extensive as the one for the irrigated sector which in the
main calls for rehabilitating the existing schemes It is forthrightly
55
admitted that the specific constraints to raising productivity in the rainfed
sector have not yet been identified and that it is not known whether the conshy
straints once identified can be overcome [12] The plan recognizes that
labor constraints in the rainfed sector mean that more capital investment is
needed if the 1990 targets are to be met However the capital requirements
are small compared with those for the irrigated sector Public sector investshy
ment of LS160 million is planned over the next 5 to 7 years most of this
outlay will be directed towards agricultural research and pilot projects In
addition the EAP recognizes the rainfed sectors need for improved infrashy
structure in particular adequate transport and marketing facilities as well
as adequate supplies of good seeds and credit
The EAP lists projects and policies undertaken or planned for the benefit
of rainfed agriculture and then gives the 1990 export target for each of
the major rainfed products These targets are actually estimates of export
availabilities which were derived by setting production targets and netting
out estimates of increased consumption seed waste etc The production
targets for the major rainfed crops except gum arabic are presented in Table
14 along with the targeted increases in cropped areas and yields that would
enable the targets to be met This section analyzes the feasibility of the
targets in light of the past performance of the rainfed sector the
constraints on its potential performance and how the recent policy changes
might relax those constraints
Examination of the production targets in Table shows more14 that
reliance is placed on horizontal expansion than on vertical expansion The
annual growth rates for areas cropped in groundnuts sesame dura and cotton
are roughly twice the growth rates of yields A policy aimed at intensifying
56
Table 14 Rainfed Crop Production Targets
Groundnuts Area (000 fed) Yield (kgfed) Production (000 tons)
Sesame Area (000 fed) Yield (kgfed) Production (000 tons)
Dura Area (000 fed) Yield (kgfed) Production (000 tons)
Cotton Area (000 fed) Yield (Kantarfed)a Production (000 tons)
aKantar = 143 kg
Source Export Action Programme
September 1980
Required1978-1979 annual average 1990 growth rate ()
1976 2950 38 262 328 20 517 967 58
2058 2860 30 104 122 15 214 350 46
6246 9540 39 300 353 15
1846 3370 56
164 530 113 09 20 75
21 150 196
1980-1990 Ministry of National planning
57
the use of areas presently under cultivation would result in growth rates of
yields that significantly exceeded the growth rates of areas cropped Given
the vast areas of arable land not yet under cultivation and the relatively
small amount of capital investment allocated to the rainfed sector over the
next decade a policy that implicitly relies on horizontal expansion to meet
the targets might be reasonable
However infrastructure constraints are more likely to confound such a
policy In particular expanding horizontally will increase the demand for
transportation If the planned extension of the road system is insufficient
to meet future needs it will be a major obstacle to the EAP since most of the
increased production of cotton groundnuts and sesame are intended for the
export market Without an adequate transport system the western markets will
remain isolated from the world market and increased output will only tend to
depress producer prices
Although the EAP does not specify precisely how much expansion is
targeted for each province some of this information is given for sesame
production dura output from mechanized farms and groundnuts production from
traditional farms The results show that cropped areas in Kassala particushy
larly the Gedaref area are expected to increase by 600 thousand feddans or
26 percent over the decade Cropped areas should expand by over 13 million
feddans or 130 percent in the central provinces of the Blue Nile and Whte
Nile A substantial increase of 12 million feddans almost 50 percent is
also anticipated for the western provinces about equally divided between the
Kordofans and the Darfurs
Plans to extend the road system involve all these provinces The highway
from Port Sudan to Khartoum passes through the Gedaref region in addition
58
five feeder roads in the area are under consideration In the Blue Nile the
Wad Medani-Sennar road has been completed and roads from Sennar to Damazin
(an important mechanized farming region) and from Sennar to Kosti are under
construction Of three planned roads in the Kordofans the El Obeid-Dubeibat
road is under construction and the En Nahud-Abu Zabad and Habila-Dubeibat
roads are being negotiated In the Darfurs a road connecting Nyala and El
Fasher has been budgeted A road From Nyala through Kas and Zalingei and
ending northwestern borderat the town of Geneina is currently under conshy
struction Whether these roads will adequately serve the future needs of
these provinces is not known At a minimum however all the roads that have
been budgeted negotiated for or are under construction need to be completed
paoticularly if the targets in the central and western provinces are to be
met
Even if the targeted expansion in cropped areas occurs greater producshy
tivity in the form of increased yields is needed if the output targets for the
rainfed sector are to be achieved Although the Sudan has had an agricultural
research program for several years it has had little impact on rainfed
farmers because extension services are practically nonexistent The current
research program needs to be continued and expanded and much more effort needs
to be made to get research results to Sincethe farmer a major weakness of
the extension service is a shortage of trained personnel a policy initiative
designed to (or train)attract qualified people would seem appropriate An
effective extension service providing the best available information on cultishy
vation techniques and seed varieties is required for sustained improvements in
rainfed sector yields
59
Other policies have been implemented or are under consideration to
improve the structure of incentives in the rainfed sector These incluae the
unification and devaluation of the exchange rates and the removal of the
export duties on cotton and sesame Abolishing the monopoly of the Sudan Oilshy
seeds Company in exports of oilseeds resulted in substantial increases in
groundnuts seeds and oil shipments during the third quarter of 1981 [9]
In the public sector the ABS is being strengthened through the IDAshy
financed Agricultural Services Project which calls for an outlay $300 million
over the rest of the century Under its auspices the ABS will be reorganized
so that it can provide more credit to the rainfed sector as well as more
tractors and spare parts Tax incentives under the Agricultural Investments
Act of 1976 include concessions to private investors who operate huge mechanshy
ized farms (between 250 thousand and 500 thousand feddans) The size of these
farms means that their location must be very carefully considered so that the
already shaky relations between the nomads and the mechanized farmers are not
exacerbated [16] A policy of dubious merit is the government encouragement
of producer cooperatives as the most efficient means of getting credit to
smallholder farmers and to insure greater private control of resources Howshy
ever past experience with cooperatives does not support this optimistic conshy
clusion they usually break down after a few months [16]
The best way of realizing the potential of the rainfed sector still
remains untapped however because of the governments policy of fixing the
purchase prices for rainfed cotton sesame and groundnuts The government
recognizes what a severe disincentive this is it recently doubled the purshy
chase price of rainfed cotton from LS260 per small kantar to LS700 in
belated recognition of the fact that for years the internal price of shortshy
staple cotton has been far below the international price As discussed in
60
Section 33 the production and marketing system operates very effectively
given the tremendous infrastructure constraints it is faced with Commodities
like dura and millet whose prices are relatively free from government intershy
ference move from surplus to deficit areas as reflected in price differenshy
tials both within the country and from the country to the world market Oilshy
seeds and oil exports increased once the Sudan Oilseeds Company was forced to
compete with the private trading sector Removal of government intervention
in market prices would narrow the wedge between producer and world prices
improve producer incomes and realize some of the potential--at little or no
cost--of the rainfed sector
61
SECTION 5 CONCLUSIONS AND RECOMMENDATIONS
In the past 10 years the performance of the agricultural sector
deteriorated especially in the irrigated schemes causing severe problems for
Sudans domestic economy and its foreign exchange reserves Since land is not
the limiting factor it seems reasonable that the productivity levels of the
early 1970s are realizable through an improved structure of incentives with
consequent improvements in the domestic economy and Sudans foreign trade
position Recent experience indicates that the rainfed sector has the
potential and ability to respond to improved incentives
Throughout the 1970s rainfed agriculture was expanding for all annual
crops except cotton through increases in cropped areas Recent rapid
increases in sorghum production which are believed to be a response to an
improving structure of incentives have principally been achieved through area
expansion Yields in sorghum have generally been stagnant at rather low
levels While further area expansion can undoubtedly be realized there
appears now an opportunity for increasing output through the intensification
of production in existing In this research andareas regard agricultural
enhanced availability of modern factors of production could play a key role in
facilitating private farmers abilities to respond to the improved incentives
generated by recent policy initiatives The realization of this potential
would however require effective public sector delivery of research results
and substantial improvements in factor markets
In the latter half of the decade irrigated areas sown to cotton and
other crops decreased absolutely as a result of the disincentive effects of
the joint account system and the reduced revenues of the management boards of
62
the irrigated schemes The experience in the irrigated sector during the
1970s illustrates that it is not sufficient to direct resources towards a
sector without the same theat time providing appropriate incentives for
farmers to make effective use of the publicly-provided resources That is
research infrastructure and agricultural services will not lead to
productivity increases if the incentives facing farmers have the effect of
taxing away the value of the publicly-provided resources
The terms of trade were not the primary cause of the deteriorating
balance of payments situation Rather the growth in value of imports far
outstripped the growth in value ot exports The chief reason is the decline
in cotton output This is not surprising since cotton production faced the
most severe disincentives The motivation for the direct and explicit
taxation of cotton may have been to secure operating revenues for the governshy
mlent and the parastatals but in so doing the disincentives were so severe
that the revenue base was eroded This experience emphasizes needthe for
extensive tax reform in the Sudan
Tax reform is under considerzion and some changes have been made For
example the export duties on cotton and sesame have been removed the removal
of the duties on groundnuts and livestock products is under consideration
Other reform measures should be directed towards increasing the buoyancy and
progressivity of the tax system for example by eliminating specific taxes
Since September 1979 the parallel exchange rate was minimally overshy
valued if not in fact undervalued some of the time By placing many
of the tradeables on the parallel rate in September 1980 the Sudan has
removed one of the most important sources of distortions to the structure of
incentives With the exchange rate Lnification and devaluation of November 9
1981 the potential for aligning the valuation of domestic resources with
63
their international valuation has been created Under this new regime
official price interventions will need to be stated explicitly and fiscal
budget implications clearly identified For example the overvaluation of the
official exchange has tendedrate to mask the economic and budgetary cost of
Sudans cheap bread policy Under the new regime the Sudan may choose to
continue to subsidize the price of bread but the amount and source of the
subsidy will need to be explicitly stated in the fiscal budget In so doing
budget planners will be better able to gauge the opportunity cost of the
resources allocated to the bread subsidy In the past a substantial portion
of the implicit subsidy for bread was borne by domestic wheat producers yet
the accounting figures made it appear as if wheat producers were being
directly subsidized Furthermore with multiple exchange rates for wheat and
sorghum the relative prices for wheat versus sorghum were inverted from their
usual international price relationship In the absence of the special sorghum
export arrangements to Saudi Arabia this condition would have been a serious
distortion and disincentive to both domestic wheat and sorghum production
The other side of exchange rate unification relates to higher factor
costs (petroleum prices) in mechanized agriculture and in the transportation
system This will tend to shift back the supply of agricultural output from
the more modern subsectors Since sorghum has been at the paralleltraded
rate since September it is possible much the1980 that of response to
improved pricing has already been realized Thus major supply increases
should not be expected result from exchange rate unification per se Thisto
policy reform however does create an environment which makes it more
possible for resources to be utilized efficiently This should in turn
create incentives for investment and innovation
64
Indirect estimates of marketing costs for dura in the West suggest that
even if transport links between El Obeid and Khartoum and Port Sudan are
improved the El Obeid market will probably continue supply the westernto
regions rather than becoming a major supolier of the eastern provinces and the
export market This result is important because much has been made of the
need to rehabilitate the rail system and to extend the road systen in the
investments toWest such need be carefully evaluated because the anticipated
flow of produce (dura) may not be forthcoming This is not to say that
enhancement of the transport system may not be warranted but that higher
returns may possibly be obtained from intraregional connections in the West
than from linking the West to the more developed East An important caveat to
be considered in this regard is the thinness and instability of the markets to
the West
The exchange rate unification and devaluation of November 9 1981 has
eliminated the implicit subsidies to petroleum agrochemicils and spare
parts The costs of production in the mechanized farming schemes and the
irrigated sector are expected to rise in proportion to the product of the
devaluation and the share of costs represented by these previously subsidized
factors The devaluation will have little impact in reducing the negative
nominal protection facing the rainfed sector (with the exception of rainfed
cotton)
In the absence of other changes in the structure of incentives output
from this sector is likely to decline at least in the short run To dampen
this potentially deleterious impact a combination of further tax reform (such
as removing all remaining export duties) and public sector initiatives that
enhance the productivity of the sector a whole egas accelerated
agricultural research to increase the productivity of the scarce factors of
65
production (agrochemicals labor and for the irrigated sector water) and
reduction of any technical and economic inefficiencies in the marketing
system Our estimates of nominal protection reveal the likelihood that
marketing margins are high
Low land rents and subsidized credit have resulted in undercapitalization
of the rainfed agricultural sector a poor creditand recovery experience
Raising land rents and tightening up the conditions under which loans are
granted might lead to the adoption of new technology and consequently to more
intensive use of the land Productivity would increase total output might
increase even though fewer farms might be operating and soil conservation
problems would ease Additionally the increased revenues could be invested
in developing the infrastructure which would make the marketing and distrishy
bution systems more efficient as well as enhancing the value of the land
The Sudan should n)t lose the current opportunity to remove an important
distortion in the market for food and realize Treasury and foreign exchange
savings by eliminating the implicit and explicit subsidies on wheat and sugar
Three favorable conditions exist--a bumper crop in domestic sorghum production
depressed international prices for wheat and sugar and substantial concesshy
sionary assistance through the wheat imports from the US under the PL 480
Title III Program--whch minimize the deleterious cost livingof and
nutritional impacts on the urban minority which has become dependent on these
subsidies The long term impacts of removing the subsidies should be
beneficial to the majority of Sudanese that are engaged in agricultural
production
66
Sudan has a clear comparative advantage in cotton production in both the
irrigated and rainfed sectors The sharp decline in rainfed cotton output is
attributable to the governments policy of fixing producer prices at a level
far below the world price of short-staple cotton In dura production the
traditional rainfed sector has a competitive edge over the irrigated sector
the modernized rainfed subsector and the mechanized rainfed sector The
traditional sector also has a comparative advantage relative to the irrigated
sector in the production of groundnuts Both the traditional and mechanized
rainfed subsectors show a comparative advantage in sesame production The
rainfed sector has benefited from recent policy changes These are necessary
conditions but are insufficient to cause major output increases from rainfed
agriculture Much remains to be done in the areas of tax reform agricultural
research and improvements in the marketing system
67
REFERENCES
1 Acharya Shankar N Incentives for Resource Allocation A Case Studyof Sudan World Bank Staff Working Paper No 367 Washington DC December 1979
2 Alibaruho George Prospects for Production and Export of Food in theSudan A Cautionary Note Working Paper 789CGFPI International Food Policy Research Institute Washington DC March 1978
3 Bank of Sudan Annual Reports 1973 1977 1979 Khartoum The Democratic Republic of the Sudan
4 Department of Agricultural Economics Ministry of Agriculture Food andNatural Resources Current Agricultural Statistics Vol 1 No 3 Khartoum June 1979
5 Department of Statistics Ministry of Planning Sudan Foreign Trade Analysis 1970-1979 Khartoum May 1981
6 Arl 1981Internal Trade Statistics and Price Indices 1978 Khartoum April 1981
7 Due John F Rail and Road Transport in the Sudan Faculty WorkingPaper No 423 (Transportation Paper No 15) University of Illinois at Urbana-Champaign July 1977
8 The Tax Structure of the Democratic Republic of Sudan WithEmphasis on the Indirect Taxes and Potential Reforms Parts A and BFaculty Working Papers Nc 419 and 420 University of Illinois at Urbana-Champaign July 1977
9 The Economist Intelligence Unit Ltd Quarterly Economic Review of Sudan4th Quarter 1980 1st Quarter 1981 3rd Quarter 1981 London
10 Food and Agriculture Orgarization of the United Nations Sudan Report of FAO Programming Mission October 1980
11 International Monetary Fund Unpublished data
12 Ministry of National Planning Export Action Programme 1980-1990 Khartoum September 1980
13 Nashashibi K A Supply Framework for Exchange Reform in DevelopingCountries The Experience of budan IMF Staff Papers Vol 27 No 1 March 1980
14 Picks Currency Yearbook Sudanese Pound New York 1979 pp581-586
68
15 Scobie Grant M Investment in International Agricultural Research Some Economic Dimensions World bank Staff Working Paper No 361Washington DC October 1979
16 Simpson IG and Morag C Simpson Alternative Strategies for AgriculturalDevelopment in the Central Rainlands of the Sudan Rural Development StudyNo 3 University of Leeds 1978
17 Sudan Gezira Board Statistical Bulletin No 2 Barakat March 1981
18 Valdes A and P Konandreas Assessing Food Insecurity Based onNational Aggregates in Developing Countries in Food Security forDeveloping Countries ed Alberto Valdes Westview Press 1981
19 The World Bank Accelerated Development in Sub-Saharan Africa An Agenda for Action Washington DC 1981
20 The Basic Economic Progam Address by HE President Gaafar Mohamed Nimeiry November 9 1981
69
--
196970 -- 198081 AREA (000 feddans)
745
690 - 635
N N
580 shy
525
470 -47
Wheat 415
360 shy
305 ~
250 -- Sugar
15shy
6970 70 71 72 73 74 75 76 77 78 79 8081
YEAR Source Food and Agriculture Organization of the United Nations Sudan Report of FAO Prograuing Mission
October 1980
---
Figure 4 AVEPAGE YIELDS OF IMPORT CROPS
196970 -- 198081YIELD (kgfeddan)
3500
3340 -
3200
3060
2920 --
2780 jI
2640 IfIt S I
2500 _ _-Sugar
586 7_ - Z-
Z- - -- Wheat300
1hh I hhh13001 I a m1 I1I I111111I 1 11s1aual I I Irl j
6970 70 71 72 73 74 75 76 77 78 79 8081
YEAR
Source Food and Agriculture Organization of the United Nations Sudan Report of FAO Programming Mission October 1980
for wheat and sugar Because of the government-directed cropping pattern
described above the plantedarea in wheat increased from about 300 thousand
feddans in 196970 to a peak of 700 thousand feddans in 197576 it then fell
to about 450 thousand feddans by 198081 as maintenance problems increased in
the irrigated schemes Over the decade wheat yields improved only slightly
from 400 kgfeddan in 196970 to 500 kgfeddan in 198081 an annual growth
rate of 21 percent As a result of increases in cropped areas and yields
wheat production grew at a rate of 61 percent from 115 thousand metric tons
to 220 thousand metric tons Areas planted in sugar rose from 30 thousand
feddans in 196970 to over 50 thousand feddans in 197980 an annual increase
of 62 percent Yields rose from 25 tonsfeddan in 196970 to around 35
tonsfeddan in the early 1970s then fell off and stabilized at 25
tonsfeddan during the latter part of the 1970s As a result production of
sugar increased over the decade from 75 thousand to 130 thousand metric tons
at an average annual growth rate of 58 percent
Although the production of wheat and sugar rose over the decade primarily
because of an increase in cropped areas it was not nearly enough to satisfy
domestic demand The government policy of import substitution fell far short
of its objective and this level of output was achieved at a cost higher than
would have been incurred had an amount equal to domestic production been
imported Sudans general comparative disadvantage in wheat production has
been central to the recent debates on agricultural policy This will be
discussed inmore detail in Section 4
23 Millet The Nontraded Good
Millet is an important food staple in Western Sudan All of it is proshy
duced in the rainfed sector Very little is exported and none is imported
It is considered a nontraded commodity since the market for it clears domestishy
14
cally The area cropped in millet rose steadily during the early 1970s from
15 million feddans to about 25 million feddans it peaked in 197879 at 3
million feddans but in the last two crop years declined to around 26 million
feddans (Figure 5) Millet yields declined fairly steadily throughout the
first half of the decade from 260 kgfeddan to about 160 kgfeddan since then
they increased erratically to their current level of 190 kgfeddan in 198081
(Figure 6) As a result of these two effects the total output of millet
increased from just under 300 thousand metric tons in 196970 to just under
500 thousand metric tons in 198081 Among the major grains and oilseeds
grown in the Sudan (groundnuts sesame dura wheat) output of millet has
generally ranked third behind dura and groundnuts In terms of areas cropped
only dura exceeded that for millet Thus while it has little value as an
export millet is an important foodgrain and should figure significantly into
any policies designed to achieve food self-sufficiency and improve rural
incomes
Millet sorghum groundnuts and -esame all typify the performance of the
rainfed sector Output increases have been achieved through increases in
areas cropped in the presence of declining or st3gnant yields
15
I~bll --- l~kd1UI
AREA (000 feddans)
3000
2750shy
2500shy
2250shy
2000shy
1750shy
1500-
I II 1 1 111 1 11aI aIi 1
697 70 71 72 73 74 75 76
YEAR Source Food and Agriculture Organization of the United Nations Sudan
October 1980
1 I I I I I III I I11 1I7
77 78 79 8081
Report of FAO Programming Mission
Figure 6 AVERAGE YIELDS OF MILLET
196970 198081 YIELD (kgfeddan)
250
225
200
175
ISOshy
125
100
6970 70 71 72 73 74 75 76 77 78 79 8081
Source YEAR
Food and Agriculture Organization of the United Nations Sudan Otober 1980
Report of FAO Proqramning Mission
SECTION 3 THE STRUCTURE OF INCENTIVES
The structure of incentives comprises the tax system exchange rate
policies prices of agricultural commodities and government intervention in
the markets for agricultural inputs and outputs such as subsidy programs and
parastatal involvement in the production and distribution system This strucshy
ture affects resource allocation decisions in agriculture because it generates
a real price or cost for every input and output to which producers respond
It determines the performance of the sector any problems can best be solved
by changing the structure Although some elements of the incentive structure
are common to all subsectors within agriculture the precise characteristics
vary with the type of production system For example the joint account
system used in the irrigated schemes governed tenants decisions regarding
which crops would receive their time and resources but it did not directly
affect producers in the rainfed sector The purpose of this section is to
examine the structure of incentives in the traditional and mechanized rainfed
sectors
Rainfed agriculture has historically been a part of the private sector
unlike the irrigated schemes While private agriculture can benefit from
increased government support (for example improvements in the infrastructure
and agricultural research) it has been responsive to price incentives
Rainfed producers are more responsive to market forces than producers in irrishy
gated schemes Public sector investment designed to improve the functioning
of provincial markets including the development and dissemination of agrishy
cultural research results and marketing information would capitalize on the
intrinsic strength of the rainfed sector and yield high returns to relatively
small outlays
18
31 The Tax System
Tax revenues have consistently provided at least 80 percent of total censhy
tral government revenue since the mid-1970s [8] Of this amount indirect
taxes have accounted for about 80 percent direct taxes on income and profits
f-r 10-15 percent and export duties for 5-10 percent The heavy reliance on
indirect taxes is unusual for an African country [8] To better understand
how the tax system affects the agricultural sector the discussion in this
section focuses theon incidence of direct and indirect taxes on exports
imports and domestic production (The implicit taxation from exchange rate
overvaluation is discussed in Section 32) It should also be noted that this
discussion is primarily descriptive others have studied the tax system
extensively and made recommendations for its reform and improvement [1 8] A
principal recomnendation includes eliminating specific taxes in favor of ad
valorem taxes to increase both the buoyancy of the tax system and its proshy
gressivity Although some reform would be desirable the present tax system
is not a significant explicit disincentive to producers in the rainfed sector
especially traditional producers
311 Exports
Exports are taxed directly through export duties and indirectly through
the development tax Export duties are ad valorem taxes There are several
rates most between 5 and 15 percent in the past the rate for a specific
commodity has varied widely from year to year The duty on cotton was elishy
minated in 1980 as was the duty on sesame Exports )f dura are currently
taxed at 25 percent millet groundnut cottonseed cottenseed and sesame
cake and vegetable oils are taxed at 15 percent Livestock and livestock
products are taxed at rates of 5 10 14 15 20 and 25 percent A developshy
ment tax of 5 percent (essentially a manufacturers sales tax) currently
19
applies to exports of all commodities Thus for any export there will be a
wedge of at least 5 percent Lp to a maximum of 30 percent between world and
domestic producer prices
312 Imports
Imports are subject to customs duties consumption duties and the
defense tax The combined levies on imports account for about 50 percent of
total tax revenues [8] Customs duties alone generated around 40 percent of
all tax revenues they comprise 25 ad valorem rates (the basic rate is 40
percent) and 16 specific rates Development items are generally taxed at the
lower rates while the highest rates (100 to 900 percent) are applied to
luxury items Consumption duties applied to beer cigarettes matches motor
fuel and lubricating oil are equivalent to the excise taxes levied on
domestic production Prior 1979to the 5 percent development tax applied to
all imports except wheat and flour medicines and milk for babies This was
lifted in 1979 and a 5 percent defense tax took its place In March 1981
the defense tax was increased to 10 percent
The rainfed sector unlike the irrigated sector uses few imported inputs
and is thus relatively immune from the impacts of these taxes Seeds insectishy
cides and agricultural machinery were exempted from customs duties in 1976
Imports of urea and other fertilizers were taxed at 5 percent and sacks and
bags at 12 percent However many of the inputs to the transportation sector
are subject to import dutieF railway rails (10 percent) diesel fuel (15
percent) railway equipment parts (20 percent) freight cars (25 percent)
tires and trucks (30 percent) petroleum and all other railway equipment (40
percent)
Except for millet and sorghum many agricultural commodities are taxed at
rates designed to protect domestic production Wheat and wheat flour are
20
taxed at 25 percent refined sugar at 30 percent rice cottonseed and oil
cake at 40 percent bread at 50 percent groundnuts raw sugar and all other
grains at 70 percent Inexplicably several commodities subject to customs
duties are either directly subsidized (wheat flour sugar bread) or used in
heavily subsidized industries (rail transport) The subsidies on wheat and
sugar are currently being phased out [20]
313 Taxes on Domestic Production
Taxes levied on domestic production include the 5 percent development
tax a complicated system of 33 categories of excise taxes employing both ad
valorem and specific rates and local taxes Specific excise taxes are
applied to the production of wheat flour vegetable oils and sugar the
development tax would only apply to an agricultural commodity if it were
processed--vegetable oils for example Local taxes (ushur) are levied on the
output of mechanized farms in the west and southwest they are an important
source of revenue for the regional governments The amount of the tax varies
from region to region but is usually between 10 and 15 percent Detailed
information on these taxes is not available local taxes are a disincentive
because they drive a wedge between the demand and the supply price and
farmers revenues are generally decreased
32 The Exchange Rate System
Exchange rate policies are a critical factor in the structure of incenshy
tives facing agriculture An overvalued exchange rate has two important
effects First it discourages the production of exportables and import
substitutes because the prices (in domestic currency) received by producers
are below those they would receive if the exchange rate were at its market
equilibrium Second it stimulates the demand for imports by effectively
lowering the prices domestic consumers have to pay
21
321 Exchange Rate History
Prior to March 1972 the official exchange rate at which all commodities
were traded was fixed at $287 = LS1 (LS0348 = $1) In March 1972 a de
facto devaluation of 15 percent was accomplished thro gh an exchange subsidy
for receipts and an exchange tax on payments this established an effective
exchange rate of $250 = LS1 (LSO4 = $1) that applied to all transactions
except exports of cotton and gum arabic In May 1975 gum arabic exports were
moved to the effective rate A second devaluation took place in June 1978
The official rate was fixed at $250 = LS1 and the effective rate was
devalued to $200 = LSl (LSO50 = $1) by increasing the exchange taxsubsidy
rate Cotton remained the only commodity traded at the official rate all
other exports and all imports were converted at the effective rate
In September 1979 a third devaluation occurred The official rate was
fixed at $200 = LS1 (the old effective rate) The exchange taxsubsidy proshy
gram was eliminated and a parallel rate was established in its place at
$125 - LS1 (LS08 = $1) At the same time however the list of comshy
modities and transactions converted at the official rate was expanded to
include government transfers essential imports invisibles and traditional
exports such as cotton groundnuts dura and sesame Only nontraditional
exports (about 8 percent of the total) and imports previously brought in under
the nil value license system (approximately 30 percent of the total) were
traded at the new parallel rate Thus this devaluation did little to
stimulate traditional exports or curb imports
One year later in September 1980 many of the commodities traded at the
official raue were shifted to the parallel rate The official rate still apshy
plied to cotton wheat flour sugar petroleum pharmaceuticals and powdered
milk During the third quarter of 1981 cotton was finally transferred to the
list of commodities traded at the parallel rate
22
On November 9 1981 the two-tiered system of exchange rates was replaced
by a unified system and devalued to $111 = LS1 (LS09 = $1) [20] This
policy change corrected one of the greatest distortions in the structure of
incentives in the agricultural sector by eliminating much of the overvaluation
that characterized the exchanqe rate system in the past This point is
discussed further in the following section
322 Overvaluation of the Exchange Rate
An overvalued exchange rate implicitly taxes exports and subsidizes
imports by an amount equal to the overvaluation This section presents
estimates of the overvaluation of the official and effective (or parallel)
exchange rates results usedThe are in estimating the net protection of
three important rainfed crops (Section 33)
A purchasing-power-parity appr-oach was used to convert nominal exchange
rates to rel rates This iovolved selecting an appropriate base year
obtaining an estimate of the real rate in the base -ear and calculating a set
of deflators The year 1972 was selected as the base because in FY 1973 (1
July 1972 - 30 June 1973) the current account was almost in balance with a
small surplus of LS500 thousand An estimate of the real exchange rate in
1972 was obtained from PicKs Currency Index [14] by averaging the black
market rates for that year The deflator for Each year is the ratio of two
ratios the numerator is the ratio of Sudans CPI for the year of interest to
the CPI in 1972 the denominator is the ratio of the IBRD world inflation
index in the year of interest to the index in 1972 The real exchange rate
for a given year is the product of the deflator for that year and the real
exchange rate in 1972 The amount of overvaluation in each year was calcushy
lated as the percentage difference between the real and nominal exchange rates
The results which are presented in Table 1 should not be interpreted as
23
Table 1 Overvaluation of the Exchange Rates
Official Effective (parallel) Over- Over-
Nominal Real a valuationb Nominal Real a valuationb (LS$) (LS$) (M) (LS$) (LS$) (M)
Pre June 0348 0640 839 0400 0640 600 Post June 0400 0640 600 0500 0640 280
1979
Pre September 0400 0731 828 0500 0731 462 Post September 0500 0731 462 0800 0731 -86
1980 0500 0819 638 0800 0819 24
1981 Pre November 0500 - - 0800 - -Post November 0900 - 0900 -
aThe 1972 black market rate from Picks Currency Index (LS0516=$1) was assumed to
be the real exchange rate in that year Real rates for the remaining years were calculated using the consumer price index for Sudan (1975 = 100) CPI S the IBRD world inflation index (1975 100) CPI W1 and the followiig formula
C CPIW i 72
i 72E -E S W where E is the real exchange rateCP172 CPI 1 in year i
E - E
Overvaluation x 100 where E is the nominal exchange rate in year i E 1
24
estimates of the shadow exchange rate because the prices of traded commodities
are included in the Sudanese and world CPIs in the deflator A shadow
exchange rate would reflect price changes in Sudans home (nontraded) goods
relative to price changes in the home goods of its major trading partner for
example the EEC However such indexes were not available so the estimates
of real exchange rates were used as proxies for shadow exchange rates
The results show that exports traded at the official rate were implicitly
taxed at rates between 40 and 80 percent imports brought in at this rate were
subsidized by equivalent amounts Until September 1979 when the parallel rate
was established the amount of overvaluation ranged from 25 to 60 percent
The parallel rate was slightly undervalued (9 percent) but because most comshy
modities were shifted to the official rate at that time the implicit tax
(subsidy) on exports (imports) was over 40 percent During 1980 the parallel
rate was only slightly overvalued Thus trading many commodities at the
parallel rate removed much of the implicit taxation or subsidization
However the tax rate on cotton and the subsidy rate for wheat flour sugar
petroleum and pharmaceuticals climbed to over 60 percent since these
commodities were traded at the official exchange rate Although price indexes
for 1981 are not available the unification and devaluation of the exchange
rates in November 1981 probably brought the nominal exchange rate closer to
the real price of foreign exchange since inflation in Sudan has reportedly
been higher than the world inflation rate Since all of Sudans exports from
the rainfed sector have been traded at close to the real price of foreign
exchange since September 1980 the November 1981 exchange rate regime will not
significantly boost exports from this sector The major impact will tobe
increase the price of petroleum thereby inflating transportation costs
25
33 Pricing and Marketing of Selected Rainfed Crops
In a perfectly competitive economy agricultural producers would receive
100 percent of the world market price net of an efficient marketing margin
for their output Divergences from this ideal are introduced by exchange rate
overvaluations or undervaluations government taxes and subsidies and inshy
flated marketing margins If the net effect of these factors raises producer
prices above world prices positive protection exists and producers are
effectively subsidized by the amount of the difference between world and
domestic prices If the net effect is to depress producer prices relative to
world prices the protection is negative and producers are effectively taxed
by the amount of the price difference The purpose of this section is to
estimate the net protection of dura sesame and groundnuts in three proshy
vincial markets over time and examine the policy implications of the results
The net protection rate is the difference between the nominal protection
rate (NRP) and the amount of exchange rate overvaluation The NRP for a
commodity captures the effects of government taxes and subsidies on the output
of that commodity it is the percentage difference between the domestic
producer price and the world (border) price adjusted to reflect transport and
marketing costs Estimates of the NRPs are presented in Section 331 In
Section 332 these are combined with the effect of the overvalued exchange
rate (Section 322) to arrive at an estimate of the net protection for the
major rainfed crops
331 Nominal Protection Rates
Four markets in three provinces were selected for analysis The Gedaref
market in Kassala (Eastern Sudan) is one of the largest markets for dura and
sesame El Obeid in Northern Kordofan is a major trading center for Western
26
Sudan dura sesame and groundnuts are among the commodities marketed In
the White Nile Province (Central Sudan) Kosti represents a major market for
dura while large quantities of sesame and groundnuts are traded in Tendelti
All four markets are linked by rail to Khartoum and Port Sudan
Producer prices in these markets for the crop years 197576-197879 are
presented in Table 2 There is considerable variation both across markets in
a given year and across time in a given market In general prices are higher
in the western markets than in the central and eastern markets These
variations reflect differences in transportation costs production costs
demand conditions and levels of marketed surpluses The producer prices of
dura in El Fasher (Northern Darfur) which are significantly higher than the
prices in other markets are also presented to support a conclusion that will
be drawn from the analysis of the NRPs below
The cost of transportation from the market to Port Sudan must be netted
out of the border price of each commodity to determine the border price facing
the producer or the export parity price Ideally other marketing costs
such as storage handling and commissions should also be netted out this
information was not available so the marketing margin is not treated in this
analysis Two sets of transprotation costs were estimated one for road
transport by lorries and one for rail transport (see Table 3A) Rail
transport costs were assumed to be 50 percent of road transport costs no
attempt was made to calculate transportation costs by commodity These costs
which are given in piasters per ton kilometer were multiplied by the distance
of each market from Port Sudan (Table 36) and the result was suotracted from
the border prices of the commodities to determine the export parity prices
The percentage difference between the producer and export parity prices of a
commodity is the nominal protection rate for that commodity these are preshy
27
Table 2
Dura
aPort Sudan (FOB)
Gedaref
El Obeid
Kosti
El Fasher
Sesame
aPort Sudan (FOB)
Gedaref
El Obeid
Tendelti
Groundnuts
Port Sudan (FOB)a
El Obeid
Tendelti
Producer Prices of Selected Rainfed Crops by Provincial Market (LSton)
19751976 19761977 19771978 19781979
434 453 540 885
178 277 356 411
461 527 451 1181
224 210 477 412
733 1365 1097 1255
1841 2037 2601 4040
1112 691 1147 1566
1250 1332 816 1409
1205 857 1292 2079
1371 2176 2091 2827
624 973 805 1079
700 546 765 974
Sources Internal Trade Statistics and Price Indices 1978 Department of Statistics Ministry of Planning April 1981
Sudan Foreign Trade Analysis 1970-1979 Department of Statistics Ministry of Planning May 1981
aExport (border) prices FOB Port Sudan in LSton converted at official exchange rate
28
Table 3A Transportation Costs (ptton km)a
RailbRoad
1976 14 07
1977 20 10
1978 30 15
1979 35 18
Sources John F Due Rail and Road Transport in the Sudan Faculty Working Paper No 423 Universityof Illinois at Urbana-Champaign July 1977 Thurvald Moe World Bank
aRates assumed to be the same for all commodities
bAssumed to be one-half the road transport costs
Table 3B Distances of Markets to Port Sudan (km)
Road Rail
Gedaref (Kassala) 852 800
El Obeid (N Kordofan) 1613 1537
Kosti (White Nile) 1512 1217
Tendelti (White Nile) 1624 1313
29
sented in Table 4 Because not all marketing costs could be identified these
estimates understate positive protection and overstate negative protection
Most of the NRPs for dura marketed in Gedaref are negative Nominal
protection tended to increase (the NRPs became less negative) from 197576
through 197778 but decreased sharply in 197879 However NRPs for dura
marketed in El Obeid and Kosti paint a different picture Both NRP estimates
for the El Obeid market show high levels of positive protection those based
on road transport costs range between 120 and 700 percent while those based
on rail transport costs are between 40 and 90 percent The results for dura
traded in Kosti are mixed the NRPs based on road transport costs are conshy
sistently positive (between 1 and 450 percent) while those based on rail
transport costs are negative for all years (around -37 percent) except
197778 Since a positive NRP implies that the producer is receiving more
than the world market price dura from El Obeid and Kosti could not be
competitive on the export market Saudi Arabia has recently been importing
Sudanese dura at a premium above the world price but this does not account
for the positive NRPs in the earlier years Since there were no explicit
subsidies in these two markets the high positive protection rates could
reflect high marketing costs disarticulated regional markets export markets
other than Port Sudan or all three of these
For example El Obeid dura is competitive in the west Prices in the El
Fasher and Nyala markets in the Darfurs (see Table 2) were significantly above
those in other provincial markets reflecting a high demand for Sudanese dura
in Chad and the Central African Republic to alleviate the food shortages in
these countries Political unrest in the Kordofans and Darfurs kept prices
high as people stockpiled food against possible interruptions in supply The
El Obeid market and possibly the Kosti and Tendelti markets as well
30
Table 4 Nominal Protection Rates for Selected Rainfed Commodities ()a
19751976 19761977 19771978 19781979 NRP NRPc NRP b NRP c NRP b NRP NRP br NRPrd rr rrd rr rd rr rd rr
aNominal protection rate (NRP) = (pproducer pborder) - 1 Producer prices are from Table 2 Border prices taken from Table 2 and adjusted for transport costs from market to Port Sudan from Table 3
bNRPs calculated by netting road transport costs out of tie border price CNRPs calculated by netting rail transport costs out of the border price
supplied these needs El Obeid served the same function for Western Sudan and
its neighbors as Port Sudan did for the world market Thus while El Obeid is
not export competitive because of cost barriers between it and Port Sudan it
is competitive in its own region even given the high costs incurred in shipshy
ping dura to markets further west Even if links between El Obeid and
Khartoum and Port Sudan are improved the El Obeid market will probably
continue to supply the western regions rather than becoming a major supplier
of the eastern provinces and the export market
Sesame is heavily taxed in the Gedaref El Obeid and Tendelti markets
Nominal protection in Gedaref decreased from about -35 percent in 197576 to
between -50 to -65 percent from 197677-197879 In El Obeid the NRPs were
between -20 and -30 percent in 197576 and 197677 then sharply decreased to
-60 percent in 197778 and 197879 Nominal protection for sesame marketed in
Tendelti decreased from -30 percent in 197576 between 40to to 50 percent
from 197677-197879 Thus producers were confronted with greater disincen-
Lives in the last two years of the period since the effective taxation of
their output increased That the nominal protection for sesame is signifishy
cantly less than that for dura in these markets probably had a debilitating
influence on the production of sesame relative to dura The negative protecshy
tion of sesame relative to dura across widely dispersed markets may also help
to account in part for the trend towards the monoculture of dura in rainfed
agriculture and may also indicate a bias in government policies in favor of
food production and against cash crop production Given the relative riski-shy
ness of sesame production and its potential for export earnings a lower level
of taxation would appear warranted
Producers of rainfed groundnuts also faced severe disincentives in the
markets examined The gap between road and rail transport costs made little
32
difference in the El Obeid market NRPs consistently remained around -50
percent from 197576-197879 In Tendelti which is closer to Port Sudan
nominal protection decreased sharply from -40 percent in 197576 to -70
percent in 197677 then increased to about -60 percent in the last two years
of the period These NRPs which are about par with those for sesame and
significantly lower than those for dura lend credence to a pro-food cropantishy
cash crop bias in the structure of incentives in the rainfed sector
332 Net Protection Rates for Selected Rainfed Crops
The analysis of nominal protection rates did not account for the impact
on the producer of overvalued exchange rates Since an overvalued exchange
rate implicitly taxes agricultural production it decreases the nominal proshy
tection If there is negative nominal protection the overvaluation would
make the protection rate moreeven negative thereby adding to the overall
taxation of output This section presents estimates of the netprotection for
rainfed commodities which is defined as the difference between the NRPs
(Section 331) and the overvaluation of the exchange rateofficial (Section
322) The results shown in Table 5are
Since the nominal protection for sesame and groundnuts was negative in
all markets during the period the overvaluation of the exchange rate further
reduced the protection of these crops The net protectioo rates for sesame
and groundnuts were usually between -100 and -130 percent over the period A
brief example will illustrate the effect of protection rates of this magnitude
It is appropriate to use the overvaluation of the official exchange rate even though most rainfed products are traded at the effective or parallel ratebecause all trade statistics from which the border prices were taken are converted at the official rate
33
Table 5 Net Protection of Selected Rainfed Commodities ()a
aNet protection = NRP minus the percent overvaluation of the exchange rate Overvaluation of the officialexchange rate was used in these calculations because all trade statistics (from which tile border priceswere taken) are converted at this rate
bCalculated using the NRP rd entries from Table 4
CCalculated using the NRP entries from Table 4 dweighted average of overvaluations in 1978 to account for the June devaluation
eWeight-d average of overvaluations in 1979 to account for the September devaluation
on producer incomes If the net protection of a crop was -100 percent and the
producer received LS500 for his output theincreasing protection to zero
percent would add LS1000 to his revenue increasing net protection to -50
percent would double his revenue Thus negative net protection rates of this
size not only are a severe disincentive to production but also have signifishy
cant income effects
The net protection of dura marketed in Gedaref arid Kosti is generally
negative regardless of which set of transportation costs are used Although
net protection increases (becomes less negative) in these markets from
197576-197778 it decreased sharply in 197879 (see Table 5) The net
protection rates based on road transport costs for dura marketed in El Obeid
are still positive and range between 60 600 percentand over the period
Those based on rail transport costs oscillate closely about percenta zero
rate over time hence transport costs and the availability of transportashy
tion are a critical determinant in the export competitiveness of dura
34 Subsidies in the Rainfed Sector
The mechanized farming schemes are the principal recipients of subsidies
to rainfed agriculture Because of the nature of traditional farming such as
the way land is allocated (there is no private ownership of land)farm and
cultivation methods the traditional rainfed sector is not subsidized to any
extent The three types of subsidies considered in this section are exchange
rate overvaluation low land rents and credit extension by the Agricultural
Bank of Sudan (ABS)
The overvalued exchange rate implicitly subsidizes imported inputs such
as petroleum agrochemicals tractors spare Thereand parts is an
additional subsidy if the input is traded at the official rather than the
parallel rate as petroleum was Since traditional rainfed agriculture uses
35
very few imported inputs jute sacks being the primary one the mechanized
schemes were the primary beneficiaries of the implicit factar subsidies
However the recent exchange rate unification and devaluation of Noveraber 1981
eliminated this subsidy As a result the cost of production on these schemes
will rise significantly Unless there is a corresponding increase in the
prices of agricultural commodities the more inefficient private mechanized
farms will fail Thus at least in the short run the growth of +his sector
could stagnate
The low annual land rent (5 ptfeddan in 1977) has several Undesirable
effects It is far below the opportunity cost of the land (LS10feddan)
[16] Thus extensive use of the land is encouraged Low land rents are a
disincentive to capital investment in land because there is not incentive to
adopt modern technology that would exploit the land already under cultivation
The fact that horizontal expansion of the mechanized farming sector is encourshy
aged might also contribute to soil conservation problems With land essenshy
tially a free good and currently available at an almost infinitely elastic
supply there is no incentive to save that resource or augment its productivshy
ity This problem is closely related to yet another form of subsidy credit
extended by the ABS
Although not intended to be a subsidy the poor repayment of loans
extended by the ABS has transformed its loan program into a subsidy program
With land underpriced and readily available there is a tendency to use credit
to meet annual operating expenses rather than to invest in capital that would
enhance the productivity of the land A bad harvest will mean the farmer is
unable to repay the loan Since the farmer has not invested in capital
assets the bank cannot recover its money since the farmer has little incenshy
tive to repay
36
Because a primary offactor production is greatly undervalued and the
cost of entry into mechanized farming is relatively low there is little or no
penalty attached to the use of inferior complementary factors of production
such as farm management skills This increases the probability of poor pershy
formance and its consequences abandonment of cleared land that will eventushy
ally be covered by scrub thorn bushes (thereby reducing the value of the land)
and a default on payments with little or no possibility of loan recovery
rhus low land rents and subsidized credit have resulted in undercapitalshy
ization of the rainfed agricultural sector and a poor credit recovery
experience Raising land rents and tightening up the conditions under which
loans are granted might lead to thA adoption of new technology and consequentshy
ly to more intensive use of the land Productivity would increase total
output might increase even though fewer farms might be operating and soil
conservation problems would ease Additionally the increased -evenues could
be invested in developing the infrastructure which would make the marketing
and distribution systems more efficient as well as enhancing the value of the
land
35 Comparative Advantage in the Irrigated and Rainfed Sectors
In view of the current condition of the agricultural sector and Sudans
financial crisis it is important that any investments designed to rehabilishy
tate or to develop this sector be directed towards those areas and activitieshy
that will generate the largest returns A first step in this process is to
determine in which crops Sudan has a comparative advantage The domestic
resource cost (DRC) of producing a particular agricultural commodity is a good
measure of comparative advantage The DRC for an exportable good measures the
amount of foreign exchange earned when a unit of domestic resources is
37
committed to its production for an import substitute it gives the amount of
foreign exchange saved when a unit of domestic resources is used to produce
that good Since domestic resources are measured in units of local currency
and foreign exchange earnings or savings in foreign currencies the DRC for a
good is an exchaiige rate that applies to the production of that good When it
is divided by the shadow price of foreign exchange the DRC becomes a unitless
number If it is less than one the country or region has a comparative
advantage in its production because it can exchange domestic resources for
foreign exchange at a rate below that at which the economy as a whole converts
domestic resources into foreign exchange a DRC greater than one means that a
comparative disadvantage exists
Table 6 presents the DRCs of the four major export crops and the two
import substitutes in the irrigated and rainfed sectors DRCs of irrigated
crops are given for two crop years 197273 and 197677 The results show
that Sudan clearly has had a comparative advantage in the production of longshy
and medium-staple cotton and sugar Production of wheat shows a comparative
disadvantage the Sudan would have saved foreign exchange if less wheat had
been domestically produced The Sudan moved from a comparative disadvantage
in the production of irrigated dura to a competitively neutral position The
competitiveness of irrigated groundnuts also improved over the period The
DRCs of traditional and mechanized rainfed crops are also given for the
198081 crop year (with the exception of groundnuts) For each subsector
DRCs were calculated under two yield assumptions The high yield assumption
is more optimistic the low yield was assumed to be 75 percent of the high
yield in each case and better reflects past experience
The DRCs for the traditional subsector apply to crops grown in the
Nuba Mountains of Southern Kordofan This region has a strong comparative
38
--
-- ---- --
-- __
-- -- --
-- --
__
Table 6 Domestic Resource Costs of Selected Crops=
Rainfed (198081)
Traditional Traditionalb MechanizedIrriqated Modernized(Nuba Mountains Mechanized private d
State farms(Nuba Mountains)197273 197677 (Eastern Sudan)Low Yield High Yield (Eastern Sudan)Low Yield High Yield Low Yield High Yield Low Yield High Yield
aDomestic resource cost (DRC) is tile value of domestic resourc s (infeddan divided by the Sudanese pounds) committed to is a unitless number
value 3dded in world prices (US dollars) This result is the production of output from one
A value less than one then divided by the real exchange rateindicates a coaparative advantage the result a value greater than onedisadvantage indicates a comparative
Daafrom K NashashibiVol 27 No A Supply Framework1 March 1980 Tables 3 and 4 for Exchange RenrnReal exchange rates in Developing Countiesor [S050 = $1 Ihe Experience of Sudonfor 1973 and LS061 IMFStaff apers= $1 for 1977 were used asfor the shadow exchange rate proxiesin those years CData from Sudanese Consulting Bureau adapted by Sigma One Corp exceptdData fom Sudanese Consulting Bureau adapted by Sigma One Corp
for groundnuts High yields taken from SCB data low yields are 75 percent of high yields
advantage in the production of short-staple cotton dura and sesame under
both yield assumptions The modernized traditional schemes DRCs(the are
given in parentheses in Table 6) however do not fare as well low dura
yields place these schemes at a comparative disadvantage Groundnuts producshy
tion also enjoys a comparative advantage although not as great as that of
sesame dura and cotton at lower yields
The DRCs for the mechanized rainfed sector apply production in theto
province of Kassala (Eastern Sudan) Results are shown for both private farms
and state-run farms (numbers in parentheses) Both private and state-owned
mechanized schemes are competitive in the production of cotton and sesame
under both yield assumptions The state-run farms are at a comparative disadshy
vantage in dura production at both yield levels Private tenancies are compeshy
titively neutral in dura production when yields are low but have a comparashy
tive advantage at higher yields
In summary Sudan has a clear comparative advantage in cotton production
in both the irrigated and rainfed sectors The sharp decline in rainfed cotshy
ton output is attributable to the governments policy of fixing producer
prices at a level far below the world price of short-staple cotton In dura
production the traditional rainfed sector has a competitive edge over the
irrigated sector the modernized rainfed subsector and the mechanized rainfed
sector The traditional sector also has a comparative advantage relative to
the irrigated in thesector production of groundnuts Both the traditional
and mechanized rainfed subsectors show a comparative advantage in sesame proshy
duction The rainfed sector has benefited from recent policy changes These
are necessary conditions but are not sufficient to elicit major output
increases from this sector Much remains to be done in the areas of tax
reform agricultural research and improvements in the marketing system
40
SECTION 4 IMPACTS OF THE STRUCTURE OF INCENTIVES ON
FOREIGN TRADE AND THE DOMESTIC ECONOMY
The structure of incentives in the agricultural sector has directly
contributed to problems in Sudans domestic economy and in its foreign trade
position This section analyzes the recent performance of foreign trade
(Section 41) and certain aspects of the domestic economy (Section 42) The
deterioration of the economy has been caused by distortions in the structure
of incentives thus solutions to these problems are best achieved by
eliminating these distortions Section 43 examines the likelihood of meeting
the objectives set out for rainfed agriculture in the Export Action Program
given recent changes in the incentive structure
41 Recent Foreign Trade Performance
Sudans balance of payments position deteriorated drastically during the
1970s mainly as a result of a steadily worsening balance of trade In FY
1973 exports of goods and services exceeded imports by $50 million In FY
1974 there was a deficit of $280 million because of the increase in world oil
prices The trade balance continued to decline until by FY 1981 imports were
close to $2 billion while exports were just over $1 billion Much of the
deterioration in Sudans trade balance occurred because the volume of exports
declined erratically from 1974 on while import volumes were generally higher
than their 1970 level (see Table 7) Table 7 also shows that the terms of
trade contributed to the declining trade balance but were not the primary
cause The net effect of the volume and price changes was that the nominal
value of exports more than doubled from 1970 through 1979 while the nominal
value of imports more than tripled
41
Table 7 Foreign Trade Indexes
Export Indexes Import Indexes Terms of Value Volume Price Value Volume Price Trade
1970 1000 1000 1000 1000 1000 1000 1000
1971 1817 1417 1282 1179 1057 1115 1150
1972 1217 1127 1080 1088 949 1146 942
1973 1425 1118 1275 1544 1098 1406 907
1974 1518 679 2236 2291 1004 2282 980
1975 1542 781 1974 3253 1158 2809 703
1976 1808 1031 1754 3496 1249 2799 627
1977 1722 778 2214 3253 1171 2778 797
1978 2534 864 2933 3564 1089 3273 894
1979 2372 758 3129 3551 968 3668 853
Source Sudan Foreign Trade Analysis 1970-1979 Dept of Statistics Ministry of Planning May 1981
42
411 Exports
Table 8 shows the contribution of the major export crops to the total
value of exports for selected years Although the export mix has varied from
year to year cotton has always been the major export crop accounting for 50
to 60 percent of the total value of exports Groundnuts and sesame have
generally been the second and third largest contributors although in 1979
sorghum was the second largest export crop of valuein terms The irrigated
sector produced almost all the cotton that was exported while the rainfed
sector accounted for all the sorghum and sesame each sector generated roughly
equal amounts of the export value of groundnuts
As can be seen the irrigated sector alone accounted for over half the
total value of exports with the production of a single commodity cotton The
rainfed sector generated about 40 percent oF total export earnings about 15
percent of this amount was in the four major crops While its relative conshy
tribution in these crops may be small exports from the rainfed sector proshy
vided diversification in the export mix a policy objective that the governshy
ment tried to achieve in the irrigated sector with little success
The reason behind the decrease in total export volumes can be seen by
examining the export volumes of selected commodities (Table 9) The decline
over the 1970-1979 period of long-staple cotton exports from the irrigated
sector to 50 percent of their 1970 volume is the chief reason Groundnuts and
sesame exports which had been fairly strong through the late 1970s suddenly
fell off in 1979 because of production difficulties nd government policies
restricting the exports of oil Asseeds a result their contribution to the
total value of exports decreased from 23 percent in 1977 to 8 percent in 1979
(see Table 8) Dura exports grew at a phenomenal rate in 1979 the volume
was over 100 times that in 1970 This growth is attributable to a special
43
Table 8 Composition of Exports (percent of total export value)
1971 1973 1975 1977 Irrigated 1979 Rainfed Total
Cotton
Sorghurr
Groundnuts
61
1
8
55
2
9
46
2
23
57
3
13
55
-
2
2
7
3
57
7
5
Sesame 7 8 8 10 - 3 3
Cake and meal
Other a
4
19
5
21
3
18
3
14
2
-
3
23
5
23
aIncludes gum arabic livestock and all other exports
Source Export Action Program 1980-1990 Ministry of National Planning September 1980
44
Table 9 Volume Indexes for Selected Exports
Long-staple Total Cotton Dura Groundnuts Sesame Exports
1970 1000 1000 1000 1000 1000
1971 1111 19040 2060 1176 1417
1972 1111 30380 1949 1057 1127
1973 980 52164 2357 1279 1118
1974 399 49945 2208 1317 679
1975 620 24434 3496 692 781
1976 850 47744 5201 1264 1031
1977 683 67864 2725 1335 778
1978 433 32337 1665 826 864
1979 526 100143 780 215 758
Source Sudan Foreign Trade Analysis 1970-1979 Dept of Statistics Ministry of Planning May 1981
45
trade agreement with the Government of Saudi Arabia which pays a premium over
the world price for Sudanese dura Recently sorghum output has continued to
expand in response to the Saudi market and the fact that since September 1980
it has been traded at the parallel rate The 1981 sorghum crop is reported to
be a record 28 million tons 55 percent more than 1980 Even so the contrishy
bution of dura to the total value of exports only increased from 1 to 7 pershy
cent from 1971 to 1979 primarily because dura is a low value commodity
compared with cotton groundnuts and sesame Even if all the additional outshy
put for 1981 were exported the increase in the volume of dura exports could
not offset the poor export performance of other agricultural commodities The
experience with dura does however illustrate the potential of the rainfed
sector to respond to price incentives
412 Imports
Table 7 showed that the index of the value of imports increased steadily
over the 1970s rising to 35 times its 1970 level by 1979 This resulted
from increases in both the volume and prices of imports as the indexes show
Historically Sudan has spent much of its available foreign exchange on intershy
mediate goods and capital equipment which were used to develop the manufacturshy
ing sector of the economy Another important use of foreign exchange has been
to purchase food primarily wheat flour and sugar
One reason for the crop diversification program undertaken in the irrishy
gated sector in the mid 1970s was to reduce the reliance of the economy on
food imports the ultimate objective was to become a net exporter of food
From 1972 to 1974 the proportion of total export earnings spent on food
imports increased from 18 percent to 30 percent (Table 10) food imports as a
percent of total import expenditures were fairly constant at 23 percent From
1974 to 1979 foreign exchange earnings spent on food eased from 30 percent to
46
Table 10 Food Imports and Supply of Foreign Exchdnge
Total export Food imports as Food imports asFood imports earning5 percent of export percent of total
(106 $)a (106 $) earnings importsc
1972 669 3781 177 235
1973 996 4851 205 223
1974 1406 4717 298 228
1975 1524 5597 272 168
1976 1025 7284 141 133
1977 872 8437 103 95
1978 1235 8231 150 122
1979 1148 8488 135 125
aIncludes imports uf unmilled wheat rice wheat flour sugar coffee and tea Sudanese pounds converted to current US dollars at official exchange rate
bExport earnings are the sum of exports of goods and services and private and official unrequited transfers
cFrom Bank of Sudan Annual Reports 1973 1977 1979
47
14 percent of the total food declined from 23 percent to 13 percent of the
total import bill over this period This level of dependence on food imports
is high in comparison to other sub-Saharan African countries particularly
since the official statistics may not include all food aid The average ratio
of food imports to foreign exchange earnings for six other sub-Saharan African
countries over the 1965-1976 period ranged from 2 percent to 12 percent 5 out
of 6 were between 2 and 7 percent [18]
4122 Wheat and Sugar Imports The quantity price ard value indexes
for wheat and sugar inorts (the bulk of ood imports) show why expenditures
on food claimed a high proportion of the total supply of foreign exchange
(Table 11) Although the volume of wheat and flour imports declined throughshy
out most of the 1970s then increased in 1978 and 1979 to close to their 1970
levels the price rose to more than twice its 1970 in 1974level remained
there through 1978 and quadrupled in 1979 Since 1979 wheat imports have
continued to grow to a level in excess of half a million metric tons per year
Of this concessionary sales from the United States represent almost a third
The volume of sugar imports was almost 70 percent higher in 1979 than itwas
in 1970 Sugar prices peaked at 6 to 7 times their 1970 level in 1974 and
1975 then fell off to over three times the 1970 level by 1979 As a result
during the period 1973-1975 when food imports accounted for 20 to 30 percent
of total export earnings the value of wheat and flour imports was over 15
times the 1970 level while that for sugar was 4 to 7 times its 1970 level
Including concessional imports ($45 million) the 19801981 import bill for
wheat and sugar was in excess of $250 million US Even at these high levels
of wheat imports and increasing domestic output the price subsidy scheme that
maintains the price of bread artificially low has created excess demands A
48
Table 11 Import Indexes for Wheat and Sugar
Wheat and flour Sugar
Value Volume Price Value Volume Price
1970 1000 1000 1000 1000 1000 1000
1971 944 833 1133 1797 1585 1134
1972 961 961 10C0 1827 1062 1720
1973 1570 868 1809 3558 1635 2176
1974 1506 504 2988 5798 962 6027
1975 1620 610 2656 7428 1051 7068
1976 1420 551 2577 4133 1142 3619
1977 1226 598 2050 2379 1348 1765
1978 1644 753 2183 4424 1822 2428
1979 3780 951 3975 5467 1689 3237
Source Sudan Foreign Trade Analysis 1970-1979 Dept of Statistics Ministry of Planning May 1981
49
factor that has contributed to this is that wheat aiJ sugar were traded at the
overvalued exchange rate which helped maintain the prices of these commodities
at the artifically low levels
4122 Bread Price Policy Bread provides approximately one-third of
the calorie requirements for the population of the greater Khartoum conurbashy
tion Per capita consumption of wheat has been rising rapidly in the last few
years with about a third of the officially marketed wheat being consumed in
the Khartoum conurbation This increase cannot be explained by increased
incomes and growing urbanization It must in large part be attributable to an
explicit cheap bread policy for the urban dwellers Table 2 presents the
budget shares for bread for different income groups in Khartoum Even for the
lowest income group bread represents only 111 percent of food expenditures
and less than 7 percent of total expenditures Even if these figures exclude
food away from home for workers bread represents a high zhare of nutrients
and in relation to this a rather low share of food costs
Exchange rate unification the PL480-III Agreement with the United States
and negotiations with international lenders have placed pressure on the
government to raise the price of bread If import parity pricing were to be
applied to wheat and flour the price of bread would need to be increased by
about 80 percent Reportedly the government intends to raise the price of
bread by close to this amount (66 percent)
This has undoubtedly been a politically difficult decision but its real
impact should not be as great as the current political manifestations would
suggest if the demand for bread is totally inelastic in the short run the
The material sectionin this touches on several issues that will be more thoroughly analyzed in the forthcoming wheat pricing study being conducted by Sigma One Corporation
50
Table 12 Budget Shares of Bread
Income group Share of
Food expenditures Share of
Total expenditures
() ()
Urban Khartoum (3 towns)
All Groups 1061 620
lt 500 LS 1107 689
500-1000 1072 672
1000-2000 1106 678
2000-3000 1045 571
3000+ 854 400
Rural i oum
All Groups 406 274
lt 500 LS 410 313
500-1000 453 312
1000-2000 432 208
2000-3000 NA NA
3000+ 075 053
Source Department of Statistics Ministry of Planning Household Budget Survey 1979
51
cost of living impact will be about 5 percent in real terms for the lowest
income strata in Khartoum If bread is somewhat price elastic the cost of
living impacts are even lower In this case the consumption impacts would
reduce calorie intake by approximately 10 percent for consumers at the FAO
requirements and less for those above it Since there is little indication
that urban Khartoum h-s serious nutritional problems (save for the refugee
population) the deleterious impacts on human nutrition are likely to be
small
The timing for these actions is fortuitous in that Sudan has experienced
a bumper crop in dura and world wheat prices are depressed With exchange
rate unification and import parity pricing the domestic producer price of
LS16750 per ton will not change much This should enable significant savings
in treasury costs ($50 to $60 million) by eliminating the so-called producers
subsidy It is also reasonable to expect substitution of wheat demand for
dura consumption With these policy changes the growth in import demand for
wheat should be slowed The USAID PL480 Title III Program which was supportshy
ing the implicit subsidy can under the new policy regime facilitate the
transition to lower reliance on food imports by continuing the supply without
requiring an increase in the foreign exchange allocations to food imports
42 Fiscal and Monetary Impacts
Much of the impact of the structure of incentives on fiscal problems and
excessive growth of the money supply has occurred through the performance of
parastatal or public entities The poor performance of these state-run corshy
Concern for consumption and nutritional impacts on low-income and othershywise at-risk populations could be more effectively addressed through alternashytives such as the CRS Title II program
52
porations over the past several years created a growing demand for public
sector credit thereby exacerbating the governments budgetary problems and
forcing it to turn increasingly to external sources of credit to finance the
resulting deficits
Table 13 contains a breakdown of the money supply for FY 1975-FY 1980
The supply of money increased from LS277 million in 1975 to over LS1 billion
in 1980 at a compounded growth rate of 29 percent per year This is a primary
factor underlying the high rate of inflation Net claims on the public secshy
tor which comprises the central government local and provincial councils
and parastatal entities was the primary reason from LS250 million in 1975
they grew at an annual rate of 31 percent to over LS970 million in 1980 The
parastatals which include the agricultural and industrial entities and the
public utilities accounted for a substantial portion of the net claims on the
public sector The claims against these bodies increased from LS105 milshy
lion in 1975 to over LS240 million in 1980 growing at 20 percent perover
year Since their growth rate was lower than that of the money supply the
proportion of net claims on the parastatals to the money supply declined from
38 percent to 24 percent over the period Besides being inflationary public
sector borrowing of this magnitude crowds out private borrowing and thereby
inhibits the capitalization of the private sector
Of the parastatal entities the agi-icultural corporations and boards
receive the largest share of bank credit with the public utilities and the
industrial boards a distant second and third respectiely The boards conshy
trolling the irrigation schemes accounted for most of the credit extended to
agriculture by the banking sector Of LS140 million in 1977 these boards
received about LS120 million in 1980 they received LS205 million in credit
against a total of LS215 million [11] On the other hand credit extended to
53
aTable 13 Components of the Money Supply (LS millions)
1975 1976 1977 1978 1979 1980
Net foreign -10716 -19265 -19176 -21805 -20126 -28890 assets
Net claims on private sector 17569 23900 26447 31837 40724 52590
Net claims on public sector 25001 35773 51735 65826 84935 97160
Central government and local and proshyvincial councils 14512 24064 41339 54824 65973 72820
Total money supply b 27656 33233 46579 60667 82098 100250
Net claims on parashystatals as percentof money supply 379 352 223 181 231 243
aAll figures apply to end of the fiscal year (June 30)
bSum of net foreign assets net claims on private sector net claims on public sector and other items
Sources Bank of Sudan Annual Report 1977 1979 IMF Sudan-Recent Economic Developments SM8170 March 1981
54
the Mechanized Farming Corporation the only parastatal body directly involved
in rainfed crop agriculture increased from LS10 million in FY 1977 to
LS26 million in FY 1980
Rainfed agriculture is relatively isolated from the publiL sector
course it benefits (or suffers) from the performance of the largest public
utility Sudan Railways And most of the loans granted by the Agricultural
Bank of Sudan a government-controlled financial entity go to the rainfed
sector Thus any policy changes affecting the organization or financial
status of the parastatals would affect this sector primarily through its
credit availability and its marketing and distribution system Policy changes
would not be likely to directly affect the viability or productivity of the
sector as a whole as would changes in the boards operating the irrigation
schemes
As discussed above the subsidies on wheat and sugar are a drain on the
Treasury It is estimated that eliminating them would save between $50 and
$60 million per year This would reduce the budget deficit and consequently
ease inflationary pressures A smaller deficit would also mean less public
sector borrowing which would help the private sector by allowing more private
borrowing
43 The Export Action Program Potential of the Rainfed Sector
The Export Action Program (EAP) of 1980 outlines an ambitious program to
promote exports from the irrigated and rainfed sectors over the next 10 years
thereby increasing foreign exchange earnings and eventually solving Sudans
balance of payments problems The proposed program for the rainfed sector is
not as detailed or extensive as the one for the irrigated sector which in the
main calls for rehabilitating the existing schemes It is forthrightly
55
admitted that the specific constraints to raising productivity in the rainfed
sector have not yet been identified and that it is not known whether the conshy
straints once identified can be overcome [12] The plan recognizes that
labor constraints in the rainfed sector mean that more capital investment is
needed if the 1990 targets are to be met However the capital requirements
are small compared with those for the irrigated sector Public sector investshy
ment of LS160 million is planned over the next 5 to 7 years most of this
outlay will be directed towards agricultural research and pilot projects In
addition the EAP recognizes the rainfed sectors need for improved infrashy
structure in particular adequate transport and marketing facilities as well
as adequate supplies of good seeds and credit
The EAP lists projects and policies undertaken or planned for the benefit
of rainfed agriculture and then gives the 1990 export target for each of
the major rainfed products These targets are actually estimates of export
availabilities which were derived by setting production targets and netting
out estimates of increased consumption seed waste etc The production
targets for the major rainfed crops except gum arabic are presented in Table
14 along with the targeted increases in cropped areas and yields that would
enable the targets to be met This section analyzes the feasibility of the
targets in light of the past performance of the rainfed sector the
constraints on its potential performance and how the recent policy changes
might relax those constraints
Examination of the production targets in Table shows more14 that
reliance is placed on horizontal expansion than on vertical expansion The
annual growth rates for areas cropped in groundnuts sesame dura and cotton
are roughly twice the growth rates of yields A policy aimed at intensifying
56
Table 14 Rainfed Crop Production Targets
Groundnuts Area (000 fed) Yield (kgfed) Production (000 tons)
Sesame Area (000 fed) Yield (kgfed) Production (000 tons)
Dura Area (000 fed) Yield (kgfed) Production (000 tons)
Cotton Area (000 fed) Yield (Kantarfed)a Production (000 tons)
aKantar = 143 kg
Source Export Action Programme
September 1980
Required1978-1979 annual average 1990 growth rate ()
1976 2950 38 262 328 20 517 967 58
2058 2860 30 104 122 15 214 350 46
6246 9540 39 300 353 15
1846 3370 56
164 530 113 09 20 75
21 150 196
1980-1990 Ministry of National planning
57
the use of areas presently under cultivation would result in growth rates of
yields that significantly exceeded the growth rates of areas cropped Given
the vast areas of arable land not yet under cultivation and the relatively
small amount of capital investment allocated to the rainfed sector over the
next decade a policy that implicitly relies on horizontal expansion to meet
the targets might be reasonable
However infrastructure constraints are more likely to confound such a
policy In particular expanding horizontally will increase the demand for
transportation If the planned extension of the road system is insufficient
to meet future needs it will be a major obstacle to the EAP since most of the
increased production of cotton groundnuts and sesame are intended for the
export market Without an adequate transport system the western markets will
remain isolated from the world market and increased output will only tend to
depress producer prices
Although the EAP does not specify precisely how much expansion is
targeted for each province some of this information is given for sesame
production dura output from mechanized farms and groundnuts production from
traditional farms The results show that cropped areas in Kassala particushy
larly the Gedaref area are expected to increase by 600 thousand feddans or
26 percent over the decade Cropped areas should expand by over 13 million
feddans or 130 percent in the central provinces of the Blue Nile and Whte
Nile A substantial increase of 12 million feddans almost 50 percent is
also anticipated for the western provinces about equally divided between the
Kordofans and the Darfurs
Plans to extend the road system involve all these provinces The highway
from Port Sudan to Khartoum passes through the Gedaref region in addition
58
five feeder roads in the area are under consideration In the Blue Nile the
Wad Medani-Sennar road has been completed and roads from Sennar to Damazin
(an important mechanized farming region) and from Sennar to Kosti are under
construction Of three planned roads in the Kordofans the El Obeid-Dubeibat
road is under construction and the En Nahud-Abu Zabad and Habila-Dubeibat
roads are being negotiated In the Darfurs a road connecting Nyala and El
Fasher has been budgeted A road From Nyala through Kas and Zalingei and
ending northwestern borderat the town of Geneina is currently under conshy
struction Whether these roads will adequately serve the future needs of
these provinces is not known At a minimum however all the roads that have
been budgeted negotiated for or are under construction need to be completed
paoticularly if the targets in the central and western provinces are to be
met
Even if the targeted expansion in cropped areas occurs greater producshy
tivity in the form of increased yields is needed if the output targets for the
rainfed sector are to be achieved Although the Sudan has had an agricultural
research program for several years it has had little impact on rainfed
farmers because extension services are practically nonexistent The current
research program needs to be continued and expanded and much more effort needs
to be made to get research results to Sincethe farmer a major weakness of
the extension service is a shortage of trained personnel a policy initiative
designed to (or train)attract qualified people would seem appropriate An
effective extension service providing the best available information on cultishy
vation techniques and seed varieties is required for sustained improvements in
rainfed sector yields
59
Other policies have been implemented or are under consideration to
improve the structure of incentives in the rainfed sector These incluae the
unification and devaluation of the exchange rates and the removal of the
export duties on cotton and sesame Abolishing the monopoly of the Sudan Oilshy
seeds Company in exports of oilseeds resulted in substantial increases in
groundnuts seeds and oil shipments during the third quarter of 1981 [9]
In the public sector the ABS is being strengthened through the IDAshy
financed Agricultural Services Project which calls for an outlay $300 million
over the rest of the century Under its auspices the ABS will be reorganized
so that it can provide more credit to the rainfed sector as well as more
tractors and spare parts Tax incentives under the Agricultural Investments
Act of 1976 include concessions to private investors who operate huge mechanshy
ized farms (between 250 thousand and 500 thousand feddans) The size of these
farms means that their location must be very carefully considered so that the
already shaky relations between the nomads and the mechanized farmers are not
exacerbated [16] A policy of dubious merit is the government encouragement
of producer cooperatives as the most efficient means of getting credit to
smallholder farmers and to insure greater private control of resources Howshy
ever past experience with cooperatives does not support this optimistic conshy
clusion they usually break down after a few months [16]
The best way of realizing the potential of the rainfed sector still
remains untapped however because of the governments policy of fixing the
purchase prices for rainfed cotton sesame and groundnuts The government
recognizes what a severe disincentive this is it recently doubled the purshy
chase price of rainfed cotton from LS260 per small kantar to LS700 in
belated recognition of the fact that for years the internal price of shortshy
staple cotton has been far below the international price As discussed in
60
Section 33 the production and marketing system operates very effectively
given the tremendous infrastructure constraints it is faced with Commodities
like dura and millet whose prices are relatively free from government intershy
ference move from surplus to deficit areas as reflected in price differenshy
tials both within the country and from the country to the world market Oilshy
seeds and oil exports increased once the Sudan Oilseeds Company was forced to
compete with the private trading sector Removal of government intervention
in market prices would narrow the wedge between producer and world prices
improve producer incomes and realize some of the potential--at little or no
cost--of the rainfed sector
61
SECTION 5 CONCLUSIONS AND RECOMMENDATIONS
In the past 10 years the performance of the agricultural sector
deteriorated especially in the irrigated schemes causing severe problems for
Sudans domestic economy and its foreign exchange reserves Since land is not
the limiting factor it seems reasonable that the productivity levels of the
early 1970s are realizable through an improved structure of incentives with
consequent improvements in the domestic economy and Sudans foreign trade
position Recent experience indicates that the rainfed sector has the
potential and ability to respond to improved incentives
Throughout the 1970s rainfed agriculture was expanding for all annual
crops except cotton through increases in cropped areas Recent rapid
increases in sorghum production which are believed to be a response to an
improving structure of incentives have principally been achieved through area
expansion Yields in sorghum have generally been stagnant at rather low
levels While further area expansion can undoubtedly be realized there
appears now an opportunity for increasing output through the intensification
of production in existing In this research andareas regard agricultural
enhanced availability of modern factors of production could play a key role in
facilitating private farmers abilities to respond to the improved incentives
generated by recent policy initiatives The realization of this potential
would however require effective public sector delivery of research results
and substantial improvements in factor markets
In the latter half of the decade irrigated areas sown to cotton and
other crops decreased absolutely as a result of the disincentive effects of
the joint account system and the reduced revenues of the management boards of
62
the irrigated schemes The experience in the irrigated sector during the
1970s illustrates that it is not sufficient to direct resources towards a
sector without the same theat time providing appropriate incentives for
farmers to make effective use of the publicly-provided resources That is
research infrastructure and agricultural services will not lead to
productivity increases if the incentives facing farmers have the effect of
taxing away the value of the publicly-provided resources
The terms of trade were not the primary cause of the deteriorating
balance of payments situation Rather the growth in value of imports far
outstripped the growth in value ot exports The chief reason is the decline
in cotton output This is not surprising since cotton production faced the
most severe disincentives The motivation for the direct and explicit
taxation of cotton may have been to secure operating revenues for the governshy
mlent and the parastatals but in so doing the disincentives were so severe
that the revenue base was eroded This experience emphasizes needthe for
extensive tax reform in the Sudan
Tax reform is under considerzion and some changes have been made For
example the export duties on cotton and sesame have been removed the removal
of the duties on groundnuts and livestock products is under consideration
Other reform measures should be directed towards increasing the buoyancy and
progressivity of the tax system for example by eliminating specific taxes
Since September 1979 the parallel exchange rate was minimally overshy
valued if not in fact undervalued some of the time By placing many
of the tradeables on the parallel rate in September 1980 the Sudan has
removed one of the most important sources of distortions to the structure of
incentives With the exchange rate Lnification and devaluation of November 9
1981 the potential for aligning the valuation of domestic resources with
63
their international valuation has been created Under this new regime
official price interventions will need to be stated explicitly and fiscal
budget implications clearly identified For example the overvaluation of the
official exchange has tendedrate to mask the economic and budgetary cost of
Sudans cheap bread policy Under the new regime the Sudan may choose to
continue to subsidize the price of bread but the amount and source of the
subsidy will need to be explicitly stated in the fiscal budget In so doing
budget planners will be better able to gauge the opportunity cost of the
resources allocated to the bread subsidy In the past a substantial portion
of the implicit subsidy for bread was borne by domestic wheat producers yet
the accounting figures made it appear as if wheat producers were being
directly subsidized Furthermore with multiple exchange rates for wheat and
sorghum the relative prices for wheat versus sorghum were inverted from their
usual international price relationship In the absence of the special sorghum
export arrangements to Saudi Arabia this condition would have been a serious
distortion and disincentive to both domestic wheat and sorghum production
The other side of exchange rate unification relates to higher factor
costs (petroleum prices) in mechanized agriculture and in the transportation
system This will tend to shift back the supply of agricultural output from
the more modern subsectors Since sorghum has been at the paralleltraded
rate since September it is possible much the1980 that of response to
improved pricing has already been realized Thus major supply increases
should not be expected result from exchange rate unification per se Thisto
policy reform however does create an environment which makes it more
possible for resources to be utilized efficiently This should in turn
create incentives for investment and innovation
64
Indirect estimates of marketing costs for dura in the West suggest that
even if transport links between El Obeid and Khartoum and Port Sudan are
improved the El Obeid market will probably continue supply the westernto
regions rather than becoming a major supolier of the eastern provinces and the
export market This result is important because much has been made of the
need to rehabilitate the rail system and to extend the road systen in the
investments toWest such need be carefully evaluated because the anticipated
flow of produce (dura) may not be forthcoming This is not to say that
enhancement of the transport system may not be warranted but that higher
returns may possibly be obtained from intraregional connections in the West
than from linking the West to the more developed East An important caveat to
be considered in this regard is the thinness and instability of the markets to
the West
The exchange rate unification and devaluation of November 9 1981 has
eliminated the implicit subsidies to petroleum agrochemicils and spare
parts The costs of production in the mechanized farming schemes and the
irrigated sector are expected to rise in proportion to the product of the
devaluation and the share of costs represented by these previously subsidized
factors The devaluation will have little impact in reducing the negative
nominal protection facing the rainfed sector (with the exception of rainfed
cotton)
In the absence of other changes in the structure of incentives output
from this sector is likely to decline at least in the short run To dampen
this potentially deleterious impact a combination of further tax reform (such
as removing all remaining export duties) and public sector initiatives that
enhance the productivity of the sector a whole egas accelerated
agricultural research to increase the productivity of the scarce factors of
65
production (agrochemicals labor and for the irrigated sector water) and
reduction of any technical and economic inefficiencies in the marketing
system Our estimates of nominal protection reveal the likelihood that
marketing margins are high
Low land rents and subsidized credit have resulted in undercapitalization
of the rainfed agricultural sector a poor creditand recovery experience
Raising land rents and tightening up the conditions under which loans are
granted might lead to the adoption of new technology and consequently to more
intensive use of the land Productivity would increase total output might
increase even though fewer farms might be operating and soil conservation
problems would ease Additionally the increased revenues could be invested
in developing the infrastructure which would make the marketing and distrishy
bution systems more efficient as well as enhancing the value of the land
The Sudan should n)t lose the current opportunity to remove an important
distortion in the market for food and realize Treasury and foreign exchange
savings by eliminating the implicit and explicit subsidies on wheat and sugar
Three favorable conditions exist--a bumper crop in domestic sorghum production
depressed international prices for wheat and sugar and substantial concesshy
sionary assistance through the wheat imports from the US under the PL 480
Title III Program--whch minimize the deleterious cost livingof and
nutritional impacts on the urban minority which has become dependent on these
subsidies The long term impacts of removing the subsidies should be
beneficial to the majority of Sudanese that are engaged in agricultural
production
66
Sudan has a clear comparative advantage in cotton production in both the
irrigated and rainfed sectors The sharp decline in rainfed cotton output is
attributable to the governments policy of fixing producer prices at a level
far below the world price of short-staple cotton In dura production the
traditional rainfed sector has a competitive edge over the irrigated sector
the modernized rainfed subsector and the mechanized rainfed sector The
traditional sector also has a comparative advantage relative to the irrigated
sector in the production of groundnuts Both the traditional and mechanized
rainfed subsectors show a comparative advantage in sesame production The
rainfed sector has benefited from recent policy changes These are necessary
conditions but are insufficient to cause major output increases from rainfed
agriculture Much remains to be done in the areas of tax reform agricultural
research and improvements in the marketing system
67
REFERENCES
1 Acharya Shankar N Incentives for Resource Allocation A Case Studyof Sudan World Bank Staff Working Paper No 367 Washington DC December 1979
2 Alibaruho George Prospects for Production and Export of Food in theSudan A Cautionary Note Working Paper 789CGFPI International Food Policy Research Institute Washington DC March 1978
3 Bank of Sudan Annual Reports 1973 1977 1979 Khartoum The Democratic Republic of the Sudan
4 Department of Agricultural Economics Ministry of Agriculture Food andNatural Resources Current Agricultural Statistics Vol 1 No 3 Khartoum June 1979
5 Department of Statistics Ministry of Planning Sudan Foreign Trade Analysis 1970-1979 Khartoum May 1981
6 Arl 1981Internal Trade Statistics and Price Indices 1978 Khartoum April 1981
7 Due John F Rail and Road Transport in the Sudan Faculty WorkingPaper No 423 (Transportation Paper No 15) University of Illinois at Urbana-Champaign July 1977
8 The Tax Structure of the Democratic Republic of Sudan WithEmphasis on the Indirect Taxes and Potential Reforms Parts A and BFaculty Working Papers Nc 419 and 420 University of Illinois at Urbana-Champaign July 1977
9 The Economist Intelligence Unit Ltd Quarterly Economic Review of Sudan4th Quarter 1980 1st Quarter 1981 3rd Quarter 1981 London
10 Food and Agriculture Orgarization of the United Nations Sudan Report of FAO Programming Mission October 1980
11 International Monetary Fund Unpublished data
12 Ministry of National Planning Export Action Programme 1980-1990 Khartoum September 1980
13 Nashashibi K A Supply Framework for Exchange Reform in DevelopingCountries The Experience of budan IMF Staff Papers Vol 27 No 1 March 1980
14 Picks Currency Yearbook Sudanese Pound New York 1979 pp581-586
68
15 Scobie Grant M Investment in International Agricultural Research Some Economic Dimensions World bank Staff Working Paper No 361Washington DC October 1979
16 Simpson IG and Morag C Simpson Alternative Strategies for AgriculturalDevelopment in the Central Rainlands of the Sudan Rural Development StudyNo 3 University of Leeds 1978
17 Sudan Gezira Board Statistical Bulletin No 2 Barakat March 1981
18 Valdes A and P Konandreas Assessing Food Insecurity Based onNational Aggregates in Developing Countries in Food Security forDeveloping Countries ed Alberto Valdes Westview Press 1981
19 The World Bank Accelerated Development in Sub-Saharan Africa An Agenda for Action Washington DC 1981
20 The Basic Economic Progam Address by HE President Gaafar Mohamed Nimeiry November 9 1981