THE SYSTEM OF AUTOMATIC LASER PLUMB-LINE FOR MONITORING A HEAVY DAM WALL Henryk Bryś Faculty of Environmental Engineering, Cracow University of Technology e-mail: [email protected]Kazimierz Ćmielewski Piotr Gołuch Institute of Geodesy and Geoinformatics, Wroclaw University of Environmental and Life Sciences e-mail: [email protected]e-mail: [email protected]Krzysztof Kowalski Regional Water Management Board in Wroclaw SUMMARY While carrying out and exploiting dams we can notice displacements and stable or elastic deformations of the object itself, the area of placement, slopes, slopes of valleys, mazer bottom and even the areas closest to the reservoir. The real behaviour of the building and changes into its geometry is only possible to state with help of systematically performed geodesy measurement of deformations and dislocations. Monitoring of a wall of a dam shaft is used to control safety of a barrage both in real time and long period registration of results of the greatest dislocations and expected misshaping. A number of measuring and controlling devices are used to grade the behaviour of the water dam. They can be divided in two groups. In the first group are gauges which bring telemetrical information about the dam safety state. Instruments for overall measurements related to the systems outside the building are also in this group. In the second group we can notice measurement instruments for relative dislocations of the building and its elements in time. Monitoring of walls is carried out, at existing dams, with use of physical pendulums: straight, vertical and reverse and those which are in the prototype versions of laser plumb-lines, to those which use different physical occurrences (for example Hall’s physical occurrence or those of mutual magnetic induction). In the paper we can see a set of vertical laser plumb-lines for monitoring of a dam’s wall with the use of a loosely hung laser transmitter and measurement receivers which allow marking the changes in the curving of the dam’s walls and local leaning of the walls segments. In the pictures are presented in details the building of components of
Transcript
THE SYSTEM OF AUTOMATIC LASER PLUMB-LINE FOR MONITORING A HEAVY DAM WALL
Henryk Bryś
Faculty of Environmental Engineering, Cracow University of Technology e-mail: [email protected]
Kazimierz Ćmielewski
Piotr Gołuch Institute of Geodesy and Geoinformatics,
Wroclaw University of Environmental and Life Sciences e-mail: [email protected]
Krzysztof Kowalski Regional Water Management Board in Wroclaw
SUMMARY While carrying out and exploiting dams we can notice displacements and stable or elastic deformations of the object itself, the area of placement, slopes, slopes of valleys, mazer bottom and even the areas closest to the reservoir. The real behaviour of the building and changes into its geometry is only possible to state with help of systematically performed geodesy measurement of deformations and dislocations. Monitoring of a wall of a dam shaft is used to control safety of a barrage both in real time and long period registration of results of the greatest dislocations and expected misshaping. A number of measuring and controlling devices are used to grade the behaviour of the water dam. They can be divided in two groups. In the first group are gauges which bring telemetrical information about the dam safety state. Instruments for overall measurements related to the systems outside the building are also in this group. In the second group we can notice measurement instruments for relative dislocations of the building and its elements in time. Monitoring of walls is carried out, at existing dams, with use of physical pendulums: straight, vertical and reverse and those which are in the prototype versions of laser plumb-lines, to those which use different physical occurrences (for example Hall’s physical occurrence or those of mutual magnetic induction). In the paper we can see a set of vertical laser plumb-lines for monitoring of a dam’s wall with the use of a loosely hung laser transmitter and measurement receivers which allow marking the changes in the curving of the dam’s walls and local leaning of the walls segments. In the pictures are presented in details the building of components of
– 42 –
the set principles of operation and functional connections for marking curving of the wall and local leaning. Also initial test and laboratory research results for defining the set precision of measurement. 1. INTRODUCTION
Monitoring of behaviour of the dam in the time of its exploitation has both applied and scientifically significance. Registered observations allow: disclosure of failures in production and design of dams, signalize occurrence of changes of geometry witching the building and signalize exceeding of allowed border values of deformation. The most vital forces and reasons causing movements and deformation of the building is the weight of concrete and ground buildings which cause subsidence, water pressure onto a concrete dam which causes leaning of its body. And sometimes movement of the foot of the dam, internal pressures which are caused by the influence of the temperature onto concrete, fluctuation of the surface of accumulated water which resulting in differences in ground load. To gain reliable picture of existing deformations caused by physical reasons, geodesic surveillance should be run at strictly defined times of a day and year and in determined periods of time according to GPOiP schedule. 2. PROJECT OF AUTOMATIC LASER SET
The basic methods of control and measurements at water dams includes plumb-lining method which uses physical pendulums together with the use of automatic, telemetric, multi-gauge measurement systems which were described in the work (Bryś, Przewłocki, 1998). The measurement situation of the plumb-line (a wire, a string) can happen by transformator line transducers or by the means of prototype sets of leser plumb-line (Bryś at al., 2009), and also halotron gauges of line dislocations (Mirek, 2003). The dam’s wall deformations which occure during many years of object exploitation can be also defined by exchanging traditional physical plumb-lines which are situated at the crown of the dam with a laser set SAPL in a measurement shaft which is schematically presented in figure 1. and in detail in figure 2. Value of current dislocations on separate measurement levels Uiw are defined by formulas below (1, 2): αtghaaU ii
Wi ⋅−Δ−Δ= 0 (1)
and αtghU i
Pi ⋅= (2)
where: a0 = a0' – a0 ai = ai’ – ai a0 a1, a2,... ai – readings of measurement receivers in the moment t0 a0’, a1', a2',... ai’ – readings of measurement receivers in the moment ti – angle of leaning of the base of a block of concrete section is defined by
wedgemeter or by liquid (hydrostatic) leveller hi – height of installation of receivers over the level of reference
– 43 –
Fig. 1. The rule of defining the curve line of the shaft wall with use of a laser aliniometer
SAPL.
Fig. 2. Placement of elements of a laser alinometer in the measurement shaft of a dam. To allow possibility of simultaneous multi-point observation of the dam wall’s behaviour, after the laser transmiter is loosely hung under the crown of the dam (fig. 3),
– 44 –
it is advised to set in defined places measurement receivers (fig. 4) which are equipped in optical elements produced in a form of glass plate flat-parallel of a slight thickness. Optical elements with appropriate geometrical setting in reference to emitted laser beam let the laser beam through at the same time reflecting it directing it to the screen of a CCD matrix (fig. 3 and 4). The angle of placement of the surface of the plate to the promoted laser beam should be 45 degrees. Then the measured dislocations of the receiver towards the beam are not burdened with a scale fault and registered quantities of the shift of spots are the same as a real value (scale 1:1).
Fig. 3. Build of a singular transmitter.
Fig. 4. Build of a singular receiver.
– 45 –
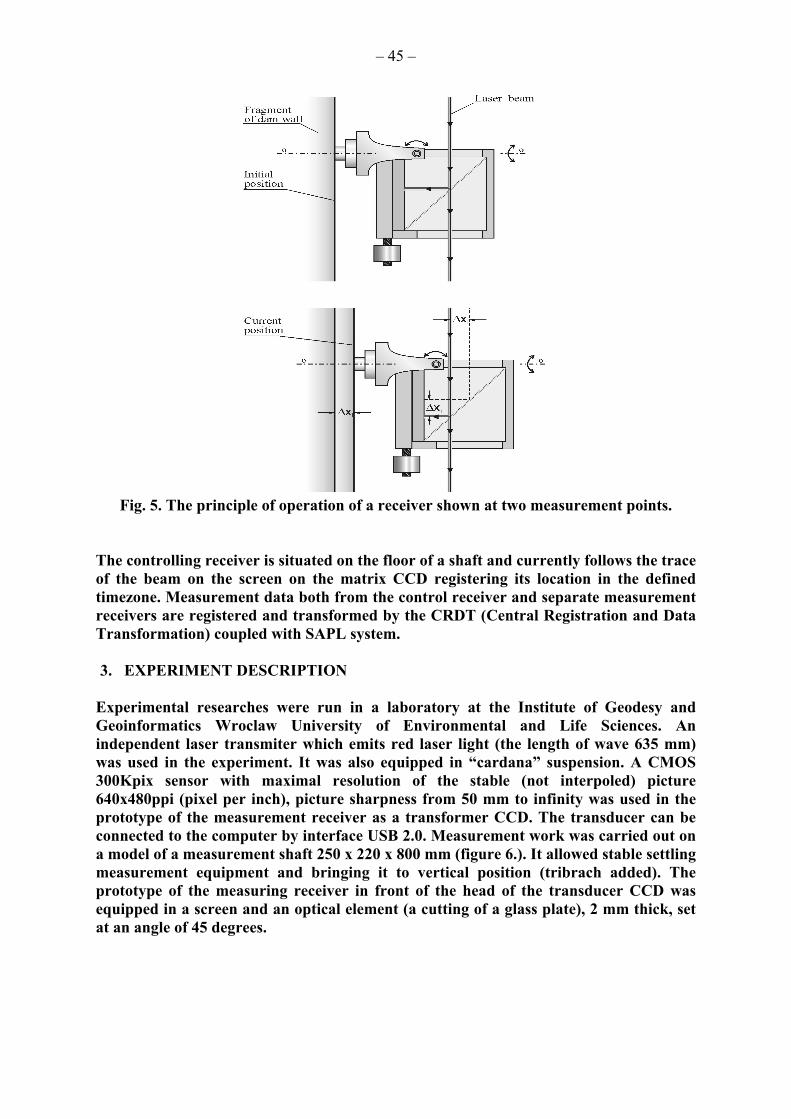
Fig. 5. The principle of operation of a receiver shown at two measurement points.
The controlling receiver is situated on the floor of a shaft and currently follows the trace of the beam on the screen on the matrix CCD registering its location in the defined timezone. Measurement data both from the control receiver and separate measurement receivers are registered and transformed by the CRDT (Central Registration and Data Transformation) coupled with SAPL system. 3. EXPERIMENT DESCRIPTION
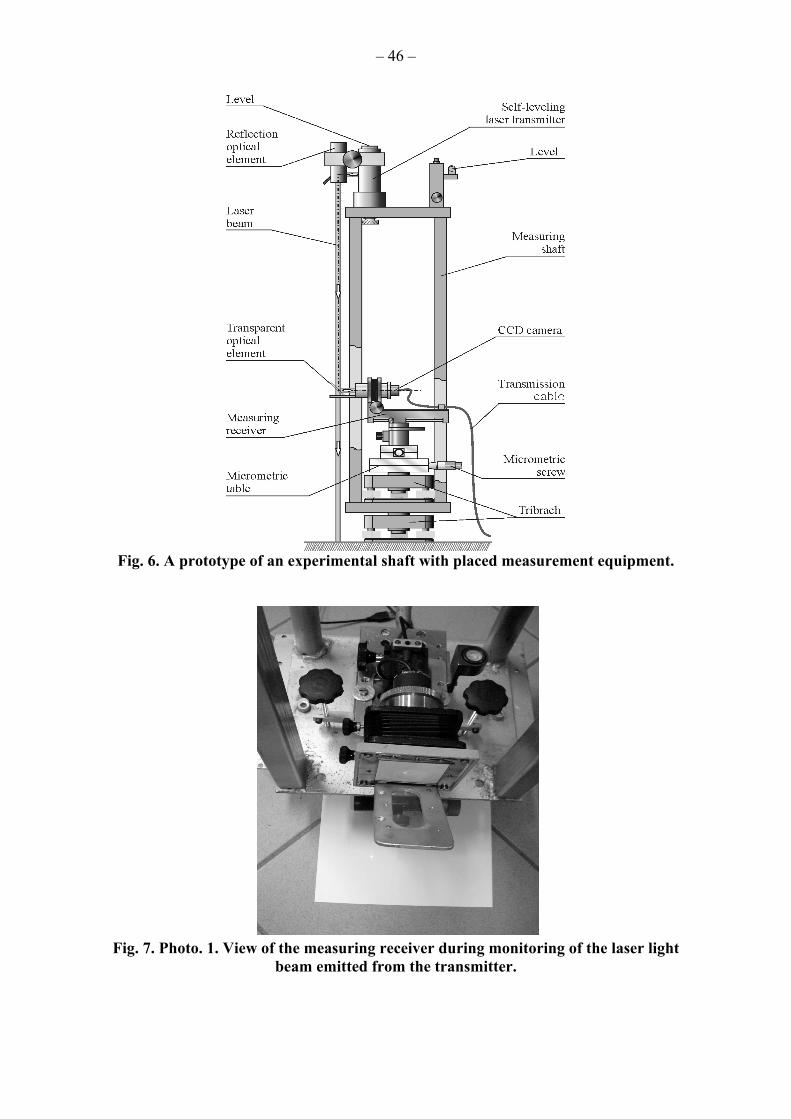
Experimental researches were run in a laboratory at the Institute of Geodesy and Geoinformatics Wroclaw University of Environmental and Life Sciences. An independent laser transmiter which emits red laser light (the length of wave 635 mm) was used in the experiment. It was also equipped in “cardana” suspension. A CMOS 300Kpix sensor with maximal resolution of the stable (not interpoled) picture 640x480ppi (pixel per inch), picture sharpness from 50 mm to infinity was used in the prototype of the measurement receiver as a transformer CCD. The transducer can be connected to the computer by interface USB 2.0. Measurement work was carried out on a model of a measurement shaft 250 x 220 x 800 mm (figure 6.). It allowed stable settling measurement equipment and bringing it to vertical position (tribrach added). The prototype of the measuring receiver in front of the head of the transducer CCD was equipped in a screen and an optical element (a cutting of a glass plate), 2 mm thick, set at an angle of 45 degrees.
– 46 –
Fig. 6. A prototype of an experimental shaft with placed measurement equipment.
Fig. 7. Photo. 1. View of the measuring receiver during monitoring of the laser light
beam emitted from the transmitter.
– 47 –
Fig. 8. A laser transmiter which allows additionall propagation of clipping laser plane.
Table 1. A table of registered coordinates of centres of laser flecks based on the research
of stability of the laser beam
Ordinal Registered coordinates of centres of laser flecks
Introductory works included research of stability of the promoted beam in the shaft in a measurement series of 41 monitorings every 30 seconds. Separate pictures were read by transductor CCD and registered in the computer and next, by the means of possessed software, energetic centres of each speck were defined. The results are presented in table 1. The other kind of experiment included checking, by micrometric screw, the precision of monitoring of the laser speck. During the experiment, another movements every 1 mm with precision of 0,01 mm were made. The results are presented in table 2.
Table 2. Comparison of simulated movements registered during the experiment
Fig. 9. Picture of a registered fleck for measurement receiver movement of +8 mm from initial setting.
– 49 –
Fig. 10. Picture of a registered fleck for measurement receiver movement of -8 mm from initial setting.
4. CONCLUSION
Using optical-electronical technique for geodesic monitoring of concrete dams, especially the most vital element – a dam’s wall can enrich measurements which are run on dams with automatic monitoring from many measurement points. The project of SAPL aliniometer was partialy researched on a model of a shaft. Positive results were reached for directing the following researches and experiments connected with appliance of laser technique, especially laser beam as a substitute for a physical plumb-line and using a CCD transducer for monitoring and registration of the movement of a concrete dam. Researches of stability of a laser beam show that the error of location in direction of X axis was 0,015 mm, and in direction of Y axis - 0,021 mm. Basing on the pairs of observations from the simulated movements to registered movements we defined a mean error of a movement registration which was 0,035 mm.
Wydawnictwo Naukowe PWN, Warszawa. Mirek G., 2003: Projekt czujnika przemieszczeń liniowych i jego zastosowanie do wyznaczania
zmian położenia wahadła fizycznego. XVIII Konferencji Katedr i Zakładów Geodezji na Wydziałach Niegeodezyjnych pt.: Współczesna geodezja w rozwoju nauk technicznych, przyrodniczych i ekonomicznych, str.181 - 188, Warszawa-Rogów 4-6.09.2003 r.
Bryś H., Ćmielewski K., Kowalski K., 2009: Innovatives Fernmesssystem zur Bestimmung der Geometrie der vertikalen Biegungslinie von Staumauern. VDVmagazine 1/09.