A Forrester Total Economic Impact™ Study Commissioned By SAP Hybris June 2017 The Total Economic Impact ™ Of SAP Hybris Cloud For Customer (Sales) Cost Savings And Business Benefits Enabled By SAP Hybris Cloud For Customer
Transcript
A Forrester Total Economic Impact™
Study Commissioned By SAP Hybris
June 2017
The Total Economic Impact™ Of SAP Hybris Cloud For Customer (Sales)
Cost Savings And Business Benefits Enabled By SAP Hybris Cloud For Customer
Table Of Contents Executive Summary 1
Key Findings 1
TEI Framework And Methodology 4
The Customer Journey With SAP Hybris Cloud For Customer 5
Interviewed Organizations 5
Key Challenges 6
Solution Requirements 6
Key Results 7
Composite Organization 7
Financial Analysis 9
Increased Productivity And Efficiency Of The Sales Team 9
Increased Income 11
Reduced IT Operations And Integration Costs 13
Reduced Time To Generate Forecasts And Reports 14
Flexibility 15
License Fees 16
Initial Implementation Costs 16
Ongoing Costs 17
Financial Summary 18
Product Overview 19
SAP Hybris Cloud for Customer 19
About SAP Hybris Solutions 19
Appendix A: Total Economic Impact 20
Project Director:
Elizabeth Witherspoon
June 2017
ABOUT FORRESTER CONSULTING
Forrester Consulting provides independent and objective research-based
consulting to help leaders succeed in their organizations. Ranging in scope from a
short strategy session to custom projects, Forrester’s Consulting services connect
you directly with research analysts who apply expert insight to your specific
business challenges. For more information, visit forrester.com/consulting.
is strictly prohibited. Information is based on best available resources.
Opinions reflect judgment at the time and are subject to change. Forrester®,
Technographics®, Forrester Wave, RoleView, TechRadar, and Total Economic
Impact are trademarks of Forrester Research, Inc. All other trademarks are the
property of their respective companies. For additional information, go to
forrester.com
1 | The Total Economic Impact™ Of SAP SAP Hybris Cloud for Customer
Executive Summary
SAP provides a software-as-a-service (SaaS)-based sales force
automation solution that gives sales professionals, managers, and
executives instant access to customer information, real-time analytics, and
selling tools while mobile to close larger deals, faster. SAP commissioned
Forrester Consulting to conduct a Total Economic Impact™ (TEI) study
and examine the potential return on investment (ROI) enterprises may
realize by deploying SAP Hybris Cloud for Customer (Sales).1 The
purpose of this study is to provide readers with a framework to evaluate
the potential financial impact of the sales application on their
organizations.
To better understand the benefits, costs, and risks associated with this
investment, Forrester interviewed four customers and surveyed 30 with
years of experience using Cloud for Customer. The majority of the
organizations are global and have more than 5,000 employees. Prior to
using Cloud for Customer, they were using a combination of CRM
products, including SAP CRM, other cloud CRM platforms, and
homegrown systems. They lacked a consolidated view of the sales and
marketing funnel at the company, region, and management level, which
led to sales inefficiencies. Company leaders struggled to connect systems
to get a single, high-level view of sales, forecasting, and pipeline data in
one place. And sales team members could not access customer or
product information from back-office systems while in the field to get a
360-degree view of their accounts. This changed with Cloud for Customer.
Key Findings
Quantified benefits. The following risk-adjusted quantified benefits are
representative of those experienced by the four in-depth customer
interviews and 30 survey respondents:
› Increased sales team productivity and efficiency by 35%. The
customers reported a significant increase in sales team productivity,
driven by the reduction in steps in the sales process and improved
access to CRM data while mobile. Because Cloud for Customer is
mobile-first and easy to access online and offline via multiple devices,
adoption of the application increased compared with prior CRM systems,
resulting in improved productivity.
› Increased average deal size by 28%. Organizations improved their
upsell and cross-sell success and increased average deal size by 28%,
leading to additional income. This totaled $4 million (present value) over
three years, driven by improved access to customer information and
sales tools to make better recommendations.
› Reduced IT operations and integration costs by 28%. With the switch
to Cloud for Customer, customers had fewer CRM systems to manage
and reported a 28% decrease in labor to manage them. Because
integration with SAP back-office systems was simplified, they reduced
the labor or outsource costs associated with integration work.
1 SAP Hybris Cloud for Customer (Sales) represents the implementation of the sales
capabilities of SAP Hybris Cloud for Customer. Throughout the rest of the document, we will refer to it as “Cloud for Customer.”
Benefits And Costs
Return on investment:
437%
Increased income:
$4 million (present
value)
Sales productivity savings:
$16.2 million (present
value)
› Cut the time to generate forecasts and reports in half. Organizations
reduced reliance on internal sales support teams to create reports for
salespeople, saving 18,000 hours annually. Managers created better
forecasts more easily and with greater accuracy. Forecasts could be
rolled up to an enterprise level or be viewed by region.
Unquantified benefits. The interviewed organizations experienced the
following benefits, which are not quantified for this study:
› Improved linkages to ERP, service, and other systems and
applications. Because of Cloud for Customer’s native integration with
existing SAP systems and its linkages to other internal and external
applications such as email and sales lead tools, customers could enable
their sales teams to work more efficiently throughout the customer life
cycle. To match this level of integration, they would have had to spend
thousands of dollars with competitors offering cloud CRM.
› A single, enterprisewide view of customer, product, and sales data.
Cloud for Customer gives customers a single view of sales data around
the globe. This means that managers and executives can see sales and
deal data in a view that matters to them and helps them make business
decisions — whether that’s rolled up by geographic region, by product
area, by customer segment, or companywide for an enterprise-level view
of sales data.
› Improved customer experiences. Fifty-three percent of survey
respondents reported that the implementation of Cloud For Customer
improved their customers’ experiences. Sales reps benefited from
enhanced mobile capabilities and could prepare more accurate,
customized sales materials for meetings with customers, increasing
satisfaction with the overall process.
Costs. The interviewed and surveyed organizations experienced the
following risk-adjusted costs. Note that these costs are based on a
composite of customers interviewed. Please see page 8 for more detail.
› License fees of about $103 per user per month. These license fees
are calculated on a per user, per month annually recurring basis. Note
that this is list pricing; licensing and pricing agreements vary across
industries.
› Initial implementation costs of $479,000. These costs represent the
professional services and training costs required to begin using the
application effectively. Implementation costs vary and are based on a
composite organization from interviews and a survey. The composite
organization integrated Cloud for Customer with other systems and
applications, leading to a higher implementation cost than if it had
implemented it as a standalone application.
› Ongoing costs of $300,000 over three years. These costs, based on a
composite organization, include the ongoing professional services and
training needed in years 2 and 3 of the implementation.
Forrester’s four interviews and survey of 30 existing SAP Hybris Cloud for
Customer users and subsequent financial analysis found that a composite
organization based on these interviewed organizations experienced
benefits of $23.2 million over three years versus costs of $4.3 million,
adding up to a net present value (NPV) of $18.9 million and an ROI of
437%.
Increased sales team productivity
35%
Reduced time to generate forecasts and reports
50%
Net present value
$18.9 million
TEI Framework And Methodology
From the information provided in the interviews, Forrester has constructed
a Total Economic Impact™ (TEI) framework for organizations considering
implementing Cloud for Customer.
The objective of the framework is to identify the cost, benefit, flexibility, and
risk factors that affect the investment decision. Forrester took a multistep
approach to evaluate the impact that Cloud for Customer can have on an
organization:
DUE DILIGENCE
Interviewed SAP stakeholders and Forrester analysts to gather data relative to SAP Hybris Cloud for Customer.
CUSTOMER INTERVIEWS
Interviewed 34 organizations using Cloud for Customer to obtain data with respect to costs, benefits, and risks.
COMPOSITE ORGANIZATION
Designed a composite organization based on characteristics of the interviewed organizations.
FINANCIAL MODEL FRAMEWORK
Constructed a financial model representative of the interviews using the TEI methodology and risk-adjusted the financial model based on issues and concerns of the interviewed organizations.
CASE STUDY
Employed four fundamental elements of TEI in modeling Cloud for Customer’s impact: benefits, costs, flexibility, and risks. Given the increasing sophistication that enterprises have regarding ROI analyses related to IT investments, Forrester’s TEI methodology serves to provide a complete picture of the total economic impact of purchase decisions. Please see Appendix A for additional information on the TEI methodology.
The TEI methodology
helps companies
demonstrate, justify, and
realize the tangible value
of IT initiatives to both
senior management and
other key business
stakeholders.
DISCLOSURES
Readers should be aware of the following:
This study is commissioned by SAP and delivered by Forrester Consulting. It is
not meant to be used as a competitive analysis.
Forrester makes no assumptions as to the potential ROI that other
organizations will receive. Forrester strongly advises that readers use their own
estimates within the framework provided in the report to determine the
appropriateness of an investment in SAP Hybris Cloud for Customer.
SAP reviewed and provided feedback to Forrester, but Forrester maintains
editorial control over the study and its findings and does not accept changes to
the study that contradict Forrester’s findings or obscure the meaning of the
study.
SAP provided the customer names for the interviews but did not participate in
the interviews.
Base: 30 SAP Hybris Cloud for Customer decision-makers Source: A commissioned study conducted by Forrester Consulting on behalf of SAP, March 2017
Canada,
17%
US,
47%
Germany, …
13%
UK,
10%
France,
13%
The Customer Journey With SAP Hybris
Cloud For Customer
BEFORE AND AFTER THE CLOUD FOR CUSTOMER INVESTMENT
Interviewed Organizations
For this study, Forrester conducted four in-depth interviews with
customers using the sales functionality of SAP Hybris Cloud for
Customer. Interviewed customers include the following:
INDUSTRY REGION INTERVIEWEE SALES CHALLENGES
A privately owned US company specializing in plumbing valves and fixtures
Headquartered in Illinois
CIO
There was no system for the partner sales reps to share leads.
There was no way for marketing to direct the sales team to tracked leads.
Accounts, activities, and leads were tracked manually.
There was no mobile access.
Reports were manually deployed to the field, with no BI analytics.
A privately owned manufacturer and distributer of dietary supplements
Headquartered in Wisconsin
Senior CRM business analyst
Customer touchpoints were captured, but inconsistently.
Processes were complicated and siloed.
Gaps in processes left “black holes.”
There was inconsistent data in back-end systems.
There was no lead tracking and leads were frequently dropped.
It lacked a good mobile option.
Updated sales content was not easily accessible.
A European industrial company with $11 billion in revenue
Headquartered in Sweden
Project leader, CRM business transformation
The organization used more than four different CRM systems.
It used different fields within the CRM in different parts of the world, leading to inconsistent data collection.
It relied on central resources for reporting increasing costs.
A software development company that serves the engineering, architecture, and construction space
Headquartered in Pennsylvania
Sales technology lead
The CRM system had a poor response time.
There was no effective mobile solution.
The existing CRM tool had a poor user interface.
Key Challenges
Customers involved in this study shared these challenges:
› Multiple CRM systems used across the global organization. They
had multiple CRM systems with no single approach to the sales
process or one central location for sales data. Said one CRM business
transformation leader: “We wanted to simplify the number of CRM
implementations and standardize the sales process around the world.
Our vision and strategy was to have our CRM integrate with our ERP.
Our former cloud provider had no quoting system, and its level of
interface with ERP was not a strong point.”
› Greater need for integration with internal SAP applications. They
used SAP back-office applications and struggled to integrate them
cost-effectively with the multiple CRM systems in place. These CRM
systems included more than one competitor cloud and on-premises
product.
› Low adoption and rigor with existing CRM systems. Sales team
members were dissatisfied with the interface of existing CRM systems
or ignored them because they required a VPN or had no mobile
access.
› Limited ability to access and update customer records while
mobile. Sales representatives, often out in the field visiting and
servicing customers, did not have the ability to use tablets and
smartphones to access or update customer sales records.
Solution Requirements
The interviewed organizations searched for a solution that could:
› Centralize all sales activities across a global organization.
› Improve the efficiency of sales team members.
› Increase the lead-to-close ratio for new business and upsell
opportunities.
› Improve sales forecasting and reporting.
› Integrate and access customer and supplier information in other SAP
back-end systems.
› Improve mobile access and productivity for sales employees.
The composite organization was using several CRM systems
companywide, including SAP CRM. The organization consulted with
industry analysts and conducted a competitive evaluation process with
Cloud for Customer and two other cloud CRM providers, both of which
were already used within the organization in at least one area of the
business. It chose Cloud for Customer because of its ease of use, mobile
capability, and low effort and cost to integrate with existing back-office
systems and external applications. Implementation unfolded as follows:
› The composite organization partnered with a professional services
organization to assist with the implementation and integration of Cloud
for Customer. One primary stakeholder, a CRM process leader, did not
have the technical resources or dedicated internal IT staff to assist in
the implementation. To save time, it contracted with partners.
“We embrace a cloud-first
approach and have been a
cloud vendor for more than 10
years. This, along with the
mobile solution and ease of
integration, were key drivers
for us to implement SAP
Hybris Cloud for Customer.”
Sales technology lead, software
development company
› The composite organization implemented over a six- to eight-month
period and began with a phased rollout of the product. It began with
500 sales users in Year 1, increasing to 1,500 users in years 2 and 3.
› Once the product was set up and tested for use, the composite
organization brought the sales teams onsite for training and followed
up with webinars and online tutorials.
Key Results
The interviews revealed that key results from the SAP Hybris Cloud for
Customer investment include:
› Improved adoption and use of CRM, leading to increased sales
productivity. Customers noticed a significant increase in sales team
productivity when they switched to Cloud for Customer. Sales team
members were properly trained on the application and readily used it
because of its mobile access and integration with existing SAP
systems. It cut down many steps in the sales process.
› Better leads and customer targeting, contributing to increased
income. Cloud for Customer enabled marketing and sales to use a
common, central location to share leads and identify and target
customers for upsell and cross-sell. Sales could access more customer
data prior to sales meetings, increasing deal size.
› Savings on labor and outsource costs for integration and
maintenance. Customers could cut down on the labor costs to run
multiple CRM systems. They were able to reduce their reliance on
outside partners for assistance with integration because Cloud for
Customer was developed with integration to SAP back-office systems
in mind. They required less help testing integrations during upgrade
periods.
› Improved sales forecasting and reporting efficiency. Customers
could reduce their reliance on internal sales support teams to create
reports for salespeople. Managers could create better forecasts that
were more reliable. Product and business owners could see sales
information grouped according to rolled-up views that mattered to the
business.
› Extension of benefits to partner sales organizations. Several of the
customers interviewed garnered a large share of their sales through
partner sales teams. Cloud for Customer gave them a means to
include them in the lead-to-order process. Said one sales technology
lead of a software development company: “The platform also gives us
room for innovation — we extended the cloud platform to channel
partners by piloting with 30 channel partners, and we have 100 to go.”
Composite Organization
Based on the interviews, Forrester constructed a TEI framework, a
composite company, and an associated ROI analysis that illustrates the
areas financially affected. The composite organization is representative
of the 34 companies that Forrester interviewed and surveyed and is used
to present the aggregate financial analysis in the next section. The
composite organization that Forrester synthesized from the customer
interviews has the following characteristics:
“We’re profiting from the
benefits of SAP Hybris Cloud
for Customer. It has opened
the door to a level of reporting
that was never possible
before. Now at our business
review meeting with each
sales organization, we report
on the same key performance
indicators (KPIs). It’s the first
time that the same data and
language used by a
salesperson are also being
used by the president of a
division or regional manager.
And we get very positive
reviews from the salespeople.”
Project leader, CRM business
transformation, industrial
manufacturing
“SAP Hybris Cloud for
Customer is very user-friendly
and works offline. It has HANA
and cloud integration, whereas
competitors had to send us to
a third-party integrator. We
met with those competitors
and realized we’d have to add
people and a programmer. In
the end, everyone agreed on
SAP Hybris Cloud for
Customer. It was a lot cheaper
— almost three times less
expensive when you consider
the consulting and third-party
software required with the
competition.”
CIO, plumbing parts
manufacturer
Description of composite. A global organization with 10,000
employees, 15% of whom are on the sales team. The organization has
more than $1 billion in revenue and an average order size of $10,000.
The organization sells directly and through partner sales teams. About
5% of the sales organization is made up of sales support staff. Sales
teams are geographically dispersed and sell many different product
lines.
Key assumptions
10,000 employees
1,500 sales personnel
Average deal size:
$10,000
70%
three-year benefit PV
$16.2 million
Financial Analysis
QUANTIFIED BENEFIT AND COST DATA AS APPLIED TO THE COMPOSITE
ORGANIZATION
Increased Productivity And Efficiency Of The
Sales Team
Customers interviewed and surveyed for this study noted a significant
increase in productivity of their sales team members. These
productivity gains were driven by several factors:
› A reduction in steps to complete the sales process. Prior to
Cloud for Customer, customers had as many as 50% more steps from
lead to order within the legacy CRM system. The interface was often
difficult to use. Large organizations had multiple CRM systems that
were customized for the region or the nuance of the business unit in
which they were implemented. They had no consistent means of
capturing leads or customer information and closing deals across the
global organization. Small and medium-size organizations often had a
paper-and-pencil system for lead and order capture, which resulted in
many lost leads, inefficient lead-to-revenue processes, and a
significant amount of time required by direct and partner sales teams to
communicate vital sales updates.
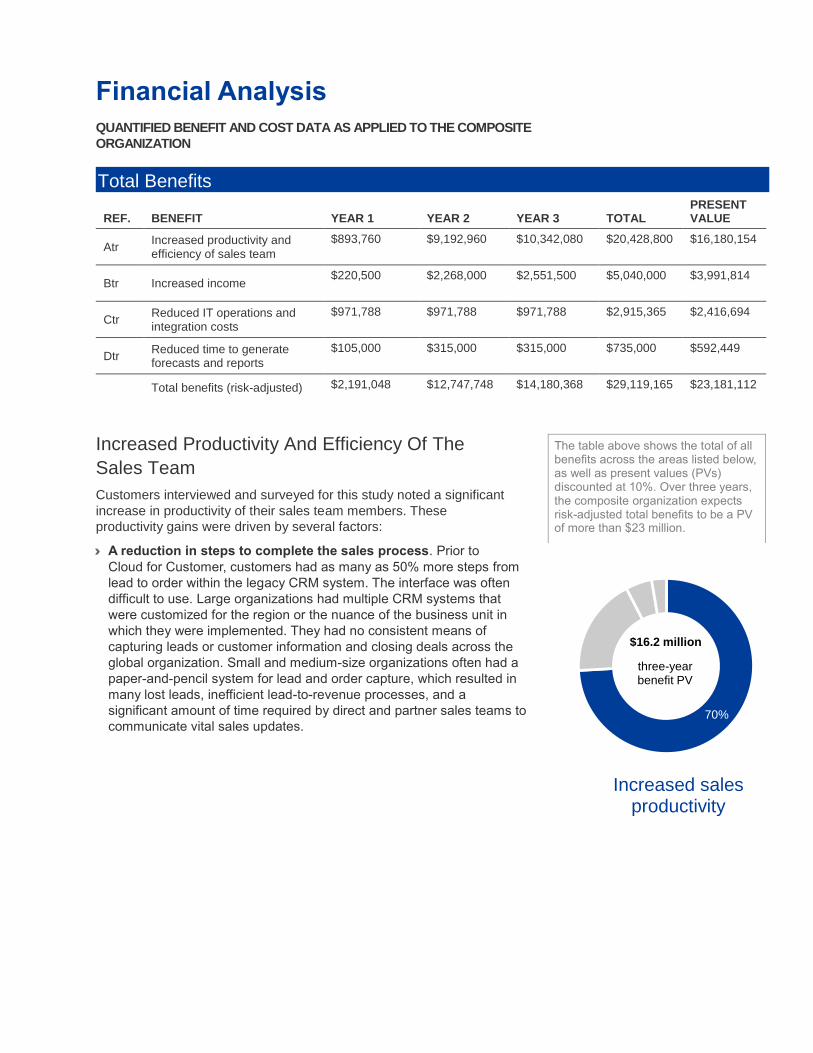
The table above shows the total of all benefits across the areas listed below, as well as present values (PVs) discounted at 10%. Over three years, the composite organization expects risk-adjusted total benefits to be a PV of more than $23 million.
Total Benefits
REF. BENEFIT YEAR 1 YEAR 2 YEAR 3 TOTAL PRESENT VALUE
Atr Increased productivity and efficiency of sales team
Btr Increased income $220,500 $2,268,000 $2,551,500 $5,040,000 $3,991,814
Ctr Reduced IT operations and integration costs
$971,788 $971,788 $971,788 $2,915,365 $2,416,694
Dtr Reduced time to generate forecasts and reports
$105,000 $315,000 $315,000 $735,000 $592,449
Total benefits (risk-adjusted) $2,191,048 $12,747,748 $14,180,368 $29,119,165 $23,181,112
Increased sales productivity
› An effective mobile solution. Customers cited Cloud for Customer’s
mobile access (tablet and smartphone) as a key contributor to
increased sales productivity. It reduced the time to access client
information and sales materials. Mobile access enabled them to
prepare for meetings, conduct meetings, and close deals without
having to go through their desktop computer or VPN. Even when the
mobile access was offline, they were still able to access critical
customer and product information to respond to client questions and
prepare orders. Said one senior CRM business analyst: “Our field
sales reps are untethered, and mobile is the biggest win for them.
Before, they had to access the network to get to sales documents —
presentations and reports. They’d save forms to their desktops and
wouldn’t have the most updated ones. Now they can go into the library,
bring up forms, fill them out, and bring up presentations for promotions.
All the tools they need to get inside the sales process can be accessed
while mobile and doesn’t require them to be on the network or VPN.”
› Increase in adoption of the CRM system. Past CRM systems were
not uniformly adopted within the companies interviewed for this study.
The lack of adoption led to inconsistencies in the sales process and
slowed the end-to-end lead-to-order process. Customers who relied
heavily on partner or distributor sales teams had no means of
giving those partners access to a cloud-based tool to enter sales
information. The customers also took careful and deliberate steps
to invest enough time and money to adequately train sales team
members to bolster the adoption of the application.
Prior to Cloud for Customer, sales reps spent an average of 10 hours
weekly on sales process-related activities, either manually or within
an existing CRM system. A survey of 30 Cloud for Customer
customers indicated a 35% increase in sales process efficiency after
implementing the application. The composite organization was able
to save an average of 3.5 hours per week per sales rep, totaling
216,000 hours over one year across the sales organization once fully
rolled out. However, even with great training and effective
implementation, 100% adoption may not be possible. The model
accounts for a 70% adoption rate in Year 1, 80% in Year 2, and 90%
in Year 3. A 50% productivity captured metric was applied to the
model to account for the fact that all time saved may not be able to
be used productively. Furthermore, the model accounts for the
implementation period of eight months, with only 500 sales users,
and begins calculating the benefit received in the last four months of
Year 1 and then a full 12-month benefit in years 2 and 3.
The sales productivity benefit may be subject to the following risks:
› The training and rollout processes are rushed or incomplete,
leading to a lower adoption rate for the application.
› Partners or distributors make up a significant portion of the sales
team, and because they are commissioned rather than salaried
employees, their increased efficiency would not contribute to the
bottom-line savings of the composite organization.
› The mobile functionality is not fully deployed.
To account for these risks, Forrester adjusted this benefit downward by
5%, yielding a three-year risk-adjusted total PV of $16,180,154.
“We needed a real-time
system that could operate
offline if we were not on
the network. With SAP
Hybris Cloud for
Customer, salespeople
could still enter leads even
if they weren’t on a cell
network.”
— CIO, manufacturing
Impact risk is the risk that the business or technology needs of the organization may not be met by the investment, resulting in lower overall total benefits. The greater the uncertainty, the wider the potential range of outcomes for benefit estimates.
“The user interface and
response time of SAP Hybris
Cloud for Customer have
reduced the cycle time from
lead to order. In our old CRM
system, there was a wheel of
death we encountered waiting
for it to return a result. Now
the response time is in
milliseconds. The lead to
quote turnaround time has
substantially decreased —
more than 50%.”
Sales technology lead, software
development company
17%
three-year benefit PV
$4.0 million
Increased Income
Customers interviewed and surveyed for the study replaced their legacy
CRM systems with the intention of increasing income. Many felt certain
that they were dropping many valuable leads because of an ineffective
lead-to-order process. Others cited the lack of integration with back-
office systems as an inhibitor to selling the maximum amount of product
to the customer at the right time. Some sales reps were unable to meet
with all of their customers in a regular and timely manner with accurate,
customized sales materials because they had to spend time driving back
and forth to the office to access customer data while on the road. With
Cloud for Customer, customers experienced:
› Better leads flowing from marketing to sales. Customers were able
to receive more quality and timely leads from various sources. Sales
reps did not have to spend time trying to identify a “quality” lead from a
wide variety of sources (many of them low quality).
› Improved customer product and purchase history information
feeding into the sales process. Sales reps reported spending more
time with customers and the ability to provide the most accurate, up-to-
date product offer in front of them because of the tight integration with
back-office SAP systems and external applications, such as sales
intelligence platforms. They could better upsell and cross-sell products
that fit their specific needs and existing contracts. Many customers
from industries related to manufacturing worked with suppliers and
partners and had missed critical opportunities to get large orders from
them because they had no effective online order capture process.
Increased Productivity And Efficiency Of The Sales Team: Calculation Table
REF. METRIC CALC. YEAR 1 YEAR 2 YEAR 3
A1 Number of sales reps and support staff Composite
500 1,500 1,500
A2 Average number of hours spent weekly on sales process activities — before SAP Cloud for Customer
10 10 10
A3 Average number of hours spent weekly on sales activities — after SAP Cloud for Customer
35% reduction Source: customer survey
6.5 6.5 6.5
A4 Average hourly salary of a sales rep (fully loaded)
Source: composite $96 $96 $96
A5 Adoption of Cloud for Customer platform
70% 80% 90%
A6 Productivity captured 50% 50% 50%
A7 Number of months of the year the benefit can be realized
4 12 12
At Increased productivity and efficiency of sales team
A1*(A2-A3)*A4*48*A5*A6*(A7/12)
$940,800 $9,676,800 $10,886,400
Risk adjustment ↓5%
Atr Increased productivity and efficiency of sales team (risk-adjusted)
$893,760 $9,192,960 $10,342,080
“Salespeople are getting more
good leads rather than a
mishmash from 15 different
emails. Before, they didn’t
follow up on leads and had no
idea how many leads were
dropped. It didn’t filter and
they had to pick through the
garbage to find them. Now
there are parameters around
those steps. Leads have to
reach a score to go to sales.”
Senior CRM business analyst,
dietary supplement manufacturer
Increased income
For the composite organization, Forrester assumes that:
› Quota-carrying sales representatives close about 45,000 deals
combined in one year (15,000 in Year 1 among 500 sales users). Using
Cloud for Customer, average deal size increased by 28%, or about
$2,800 per deal. This increase in income totals millions of dollars over
three years. The calculation also accounts for a 5% profit margin that is
typical of the types of organizations interviewed and surveyed for this
study. The application adoption rate cited in the first benefit was also
applied to this benefit and is 70% in Year 1, 80% in Year 2, and 90% in
Year 3. Furthermore, the model accounts for the implementation period
of eight months and begins calculating the benefit received in the last
four months of Year 1 among 33% of the sales staff and then a full 12-
month benefit in years 2 and 3.
The increase in income will vary with:
› The number of deals closed annually and average deal size.
› The percentage of sales representatives who meet their quota.
› The level of integration the company achieves with other systems.
To account for these risks, Forrester adjusted this benefit downward by
10%, yielding a three-year risk-adjusted total PV of $3,991,814.
Increased Income: Calculation Table
REF. METRIC CALC. YEAR 1 YEAR 2 YEAR 3
B1 Number of deals closed annually that are facilitated by Cloud for Customer
15,000 45,000 45,000
B2 Average deal size before Cloud for Customer
$10,000 $10,000 $10,000
B3 Average deal size after Cloud for Customer
28% increase Source: customer survey
$12,800 $12,800 $12,800
B4 Income margin
5% 5% 5%
B5 Adoption of the Cloud for Customer platform
70% 80% 90%
B6 Percentage of income that can be attributed to Cloud for Customer
50% 50% 50%
B7 Number of months of year in which the benefit can be realized
4 12 12
Bt Increased income B1*(B3-B2)*B4*B5*B6*(B7/12)
$245,000 $2,520,000 $2,835,000
Risk adjustment ↓10%
Btr Increased income (risk-adjusted) $220,500 $2,268,000 $2,551,500
“We want the salesperson in
the car outside the customer's
office to have a tablet and see
open orders and tickets in the
system. We want them
walking in to see customers
completely armed and
knowledgeable to deal with the
issues at their fingertips.”
CIO, plumbing parts manufacturer
10%
three-year benefit PV
$2.4 million
Reduced IT Operations And Integration Costs
Organizations reported that Cloud for Customer reduced their IT
operations and integration costs in the following ways:
› Fewer legacy systems to maintain. Customers from global
organizations typically had multiple CRM systems in use throughout
the company. This required IT professionals to administer the CRM
systems in a decentralized way, with multiple administrators owning
the systems. Because different CRMs have unique programming and
administrative requirements, the effort was duplicated across the
organization. This effort was consolidated and reduced with Cloud for
Customer.
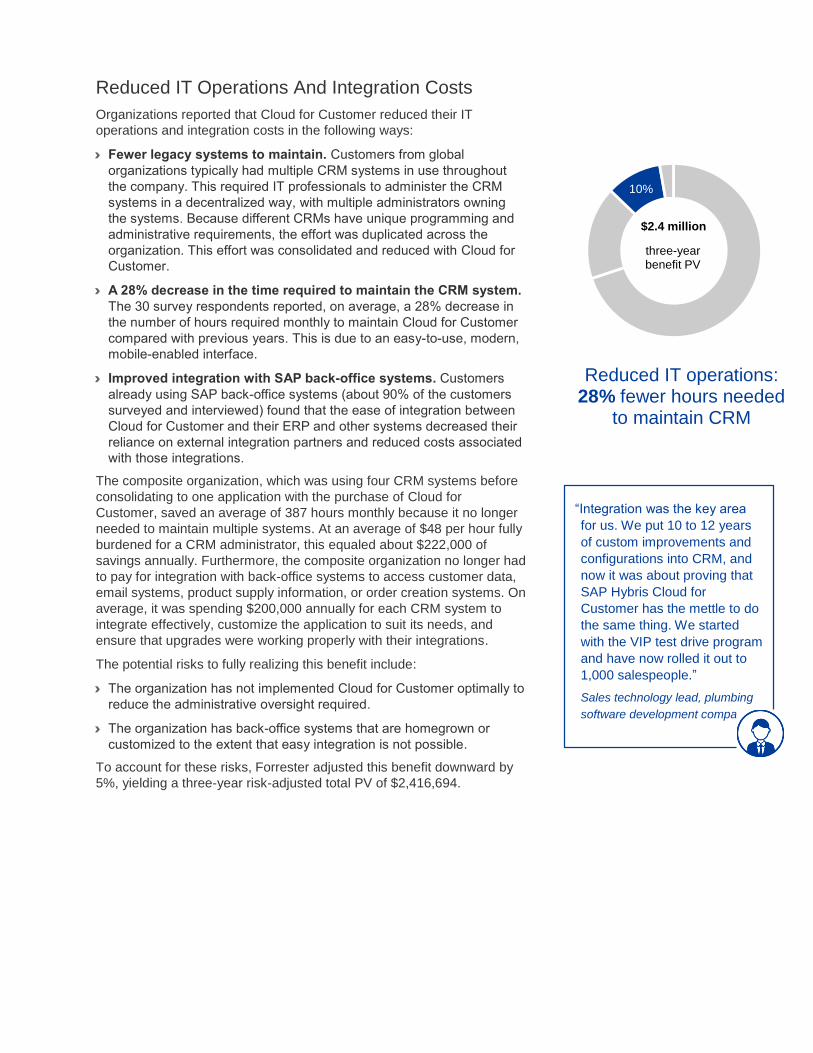
› A 28% decrease in the time required to maintain the CRM system.
The 30 survey respondents reported, on average, a 28% decrease in
the number of hours required monthly to maintain Cloud for Customer
compared with previous years. This is due to an easy-to-use, modern,
mobile-enabled interface.
› Improved integration with SAP back-office systems. Customers
already using SAP back-office systems (about 90% of the customers
surveyed and interviewed) found that the ease of integration between
Cloud for Customer and their ERP and other systems decreased their
reliance on external integration partners and reduced costs associated
with those integrations.
The composite organization, which was using four CRM systems before
consolidating to one application with the purchase of Cloud for
Customer, saved an average of 387 hours monthly because it no longer
needed to maintain multiple systems. At an average of $48 per hour fully
burdened for a CRM administrator, this equaled about $222,000 of
savings annually. Furthermore, the composite organization no longer had
to pay for integration with back-office systems to access customer data,
email systems, product supply information, or order creation systems. On
average, it was spending $200,000 annually for each CRM system to
integrate effectively, customize the application to suit its needs, and
ensure that upgrades were working properly with their integrations.
The potential risks to fully realizing this benefit include:
› The organization has not implemented Cloud for Customer optimally to
reduce the administrative oversight required.
› The organization has back-office systems that are homegrown or
customized to the extent that easy integration is not possible.
To account for these risks, Forrester adjusted this benefit downward by
5%, yielding a three-year risk-adjusted total PV of $2,416,694.
Reduced IT operations: 28% fewer hours needed
to maintain CRM
“Integration was the key area
for us. We put 10 to 12 years
of custom improvements and
configurations into CRM, and
now it was about proving that
SAP Hybris Cloud for
Customer has the mettle to do
the same thing. We started
with the VIP test drive program
and have now rolled it out to
1,000 salespeople.”
Sales technology lead, plumbing
software development company
3%
three-year benefit PV
$592,449
Reduced Time To Generate Forecasts And Reports
Cloud for Customer also helped organizations save time on forecast and
report creation. Previously, all information for various reports was kept in
different areas, and it was a labor-intensive process to gather together all
of the information for any given type of report. Sales reps typically called
into a central sales support organization to have them pull reports and
proposals while on the road. Sales managers could not easily forecast
sales data across segments, and the forecast did not roll up into one
enterprisewide view. With Cloud for Customer, all of the information is in
one area, and the sales organization can easily pull data to track sales
cycles, revenue trends, and other reports configured to the specific need
of the sales organization. The dashboards and business intelligence built
into the application makes it easy to view information to make decisions.
Cloud for Customer helps the sales organization get the right information
in front of the right people faster so that each team member’s forecast
can be used more effectively to improve the bottom line.
The model estimates that 5% of the composite organization’s sales personnel are sales support, including sales operations pros who assist sales reps in their day-to-day sales reporting needs and sales managers who need to forecast sales data to their managers. The model calculates a 5-hour weekly time savings related to report and forecast creation once Cloud for Customer is implemented. The average fully burdened salary of those two groups is estimated at $35 per hour. The model accounts for the implementation period of eight months and begins calculating the benefit received in the last four months of Year 1 and then a full 12-month benefit in years 2 and 3.
Reduced IT Operations And Integration Costs: Calculation Table
REF. METRIC CALC. YEAR 1 YEAR 2 YEAR 3
C1 Number of CRM systems managed before Cloud for Customer Source: composite
4 4 4
C2 Number of CRM systems managed after Cloud for Customer
1 1 1
C3 Average number of hours monthly to maintain CRM before Cloud for Customer
118 118 118
C4 Average number of hours monthly to maintain CRM after Cloud for Customer 28% improvement
85 85 85
C5 Average hourly salary of CRM administrators Based on $100,000
annual salary (fully burdened)
$48 $48 $48
C6 Reduced integration, customization, and upgrade costs
$200,000 $200,000 $200,000
Ct Reduced IT operations and integration costs
((C1*C3)-(C2*C4)*12*C5)+(C6*C1)
$1,022,935 $1,022,935 $1,022,935
Risk adjustment ↓5%
Ctr Reduced IT operations and integration costs (risk-adjusted)
$971,788 $971,788 $971,788
Improved reporting and forecasting
The present value of the total benefits over three years for the reduced
time to generate forecasts and reports is $592,449.
Flexibility
The value of flexibility is clearly unique to each customer, and the
measure of its value varies from organization to organization. There
are multiple scenarios in which a customer might choose to
implement the sales capabilities of Cloud for Customer and later
realize additional uses and business opportunities, including:
› Adding customer service features in Cloud for Customer.
Several customers interviewed and surveyed for this study were
already using or planning to use features for their call center agents
and onsite technicians. Because Cloud for Customer is the same
platform for both sales and customer service, it is very easy for
organizations to add licenses for customer service functionality. The
combined platforms offer centralized access to customer and
product data and enable sales team members to take into account
customer service issues or inquiries underway when selling to their
customers and prospects.
› Adding SAP Hybris Marketing and Commerce Cloud.
Customers interviewed and surveyed for this study were already
using or planning to use SAP Hybris Marketing Cloud and/or SAP
Hybris Commerce Cloud. Those that add these solutions to their
suite of applications benefit by gaining holistic view of their
customers not only from sales perspective but also in their
interactions with the marketing and commerce organizations.
Flexibility would also be quantified when evaluated as part of a specific
project (described in more detail in Appendix A).
40% of surveyed
customers who use Cloud
for Customer for sales
also license the customer
service features.
Flexibility, as defined by TEI, represents an investment in additional capacity or capability that could be turned into business benefit for a future additional investment. This gives an organization the “right” or ability to engage in future initiatives but not the obligation to do so.
Reduced Time To Generate Forecasts And Reports: Calculation Table
REF. METRIC CALC. YEAR 1 YEAR 2 YEAR 3
D1 Number of sales support professionals Estimated at 5% of sales staff
75 75 75
D2 Hours saved weekly for generating reports, forecasts, and general sales operations
5 5 5
D3 Average hourly salary of sales support professionals (fully burdened)
$35 $35 $35
D4 Productivity captured
50% 50% 50%
D5 Number of months of year in which the benefit can be realized
4 12 12
Dt Reduced time to generate forecasts and reports D1*D2*48*D3*D4*(D5/12)
$105,000 $315,000 $315,000
Risk adjustment 0%
Dtr Reduced time to generate forecasts and reports (risk-adjusted)
$105,000 $315,000 $315,000
7%
three-year cost PV
$579,000
License Fees
The composite organization incurs a monthly fee of $103.33 per
license. Note that this is the list pricing, and licensing and pricing
agreements vary across industries.
The composite organization, after an initial rollout of 500 sales user
licenses, chose to roll the licenses out to its entire sales force of 1,500
in years 2 and 3 for a total license fee of $4,339,860. The three-year
total licensing fee is a present value of $3,498,159.
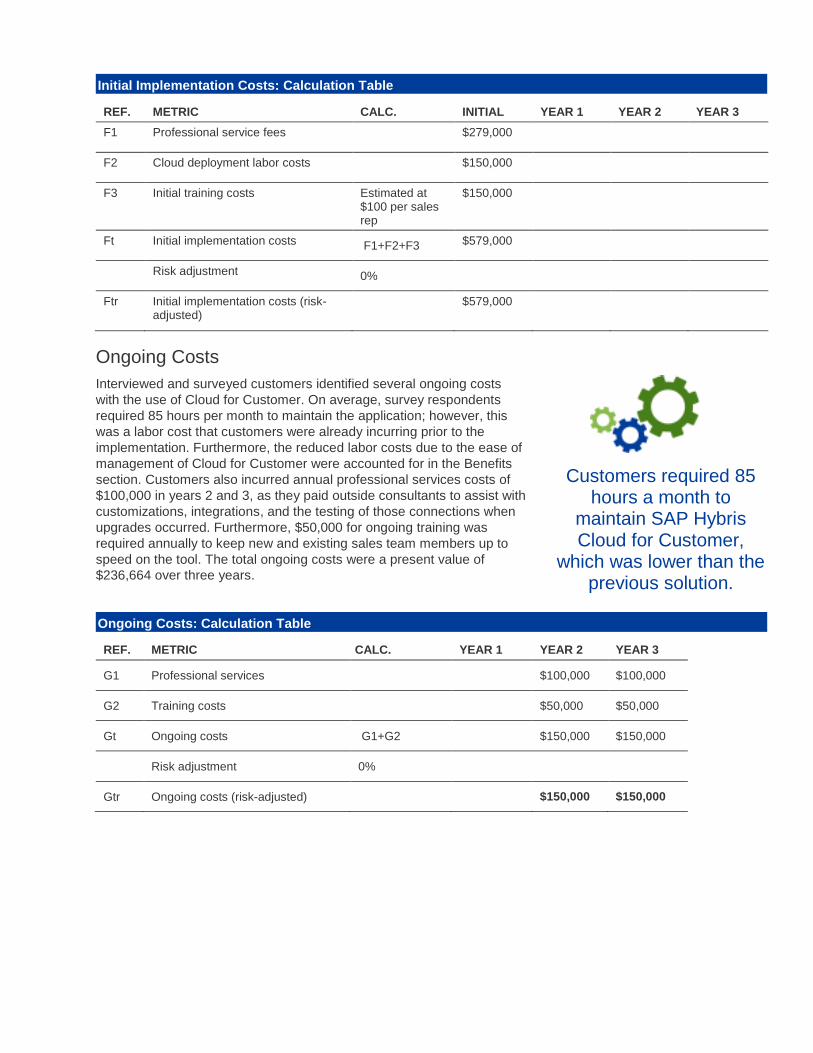
Initial Implementation Costs
Customers interviewed and surveyed for this study reported initial
implementation costs for the effective rollout of Cloud for Customer. The
average initial professional services fee paid to an implementation
partner or to SAP was $279,000. This cost went to the effective
integration of Cloud for Customer with other back-office and external
applications. It also included the customization, testing, and rollout of the
application companywide. In addition, the composite organization
incurred an average of $150,000 in cloud deployment costs, as it fully
moved from multiple CRM systems (some on-premises) to the cloud. It
also trained all 1,500 sales personnel, including support staff, at a cost of
about $100 per sales team member. Note: Some customers chose to
invest very heavily in in-person training and invested in flying sales
personnel to a specific location for hands-on training; others preferred to
conduct training through videoconferencing equipment and online
tutorials. The total initial implementation cost was $579,000.
Total Costs
The table above shows the total of all costs across the areas listed below, as well as present values (PVs) discounted at 10%. Over three years, the composite organization expects risk-adjusted total costs to be a PV of more than $4.3 million.
REF. COST INITIAL YEAR 1 YEAR 2 YEAR 3 TOTAL PRESENT VALUE
The financial results calculated in the Benefits and Costs sections can be used to determine the ROI and NPV for the composite organization’s investment. Forrester assumes a yearly discount rate of 10% for this analysis.
These risk-adjusted ROI
and NPV values are
determined by applying
risk-adjustment factors to
the unadjusted results in
each Benefit and Cost
section.
Cash Flow Table (Risk-Adjusted)
INITIAL YEAR 1 YEAR 2 YEAR 3 TOTAL PRESENT VALUE
Total costs ($579,000) ($619,980) ($2,009,940) ($2,009,940) ($5,218,860) ($4,313,823)
Total benefits $0 $2,191,048 $12,747,748 $14,180,368 $29,119,165 $23,181,112
Net benefits ($579,000) $1,571,068 $10,737,808 $12,170,428 $23,900,305 $18,867,289
ROI 437%
Product Overview
The following information is provided by SAP Hybris. Forrester has not validated any claims and does not
endorse SAP Hybris or its offerings.
SAP Hybris Cloud for Customer
Meet today’s sales challenges head-on and sell
more with SAP Hybris Cloud for Customer and
deliver exceptional customer experiences. Built
on maximizing sales productivity, it’s an easy-to-
use, cloud sales application that goes beyond
the traditional approach to CRM. Empower your
high performing sales organizations to sell
smarter, act faster and be relevant, from
anywhere.
MOBILITY. The ability to sell anytime, anywhere,
on any device and be productive, even when you’re offline. Spend less time on chasing down information and
more time with your customer
ACCOUNT and OPPORTUNITY MANAGEMENT AND INTELLIGENCE. Make fast account updates, get
complete customer and business insight and keep everyone in the loop so that you and your team are delivering
the right impact in every customer conversation. Accelerate sales wins by rapidly tracking activities, collaborating
with internal teams, customers and partners, submitting quotes and sales orders Work more efficiently leveraging
office productivity tools you use every day. Integration with Microsoft Outlook, Google Gmail, Lotus Notes and
Evernote, means no double data entry and key customer information and notes stay automatically in sync.
REAL-TIME/PREDICTIVE ANALYTICS AND MACHINE LEARNING. With out of the box interactive dashboards,
embedded reports with real-time content, and advanced analysis tools, gain access to real-time customer
analytics and sales data in the context of their accounts and opportunities to help them engage and connect with
customers in a personal, relevant way. Track your performance in real-time and proactively drive the right
opportunities to close while steering clear of unwanted surprises. Forecast with ease and perform what-if
analysis to learn where to focus. Discover new leads and uncover new opportunities in existing accounts with
real-time predictive deal and opportunity scoring and quickly identify top account influencers based on past wins.
SALES PERFORMANCE MANAGEMENT. Turn sales strategy into action by guiding and coaching sellers with
ways to increase revenue, and exceed goals and objectives. Ensure optimal coverage with territory and pipeline
management, forecasting, quota planning and reporting capabilities. Onboard, train and coach sales from day
one with easy integration to SAP SuccessFactors and SAP Jam Collaboration solutions
EASY, INSTANT ACCESS TO BACK-OFFICE INFORMATION. With native SAP ERP and SAP CRM integration
and business application mash-ups, you’re always effortlessly up-to-speed on your accounts and gain a
complete customer view and flexibility to create orders, quotes and service tickets on-site.
About SAP Hybris Solutions
SAP Hybris solutions provide omnichannel customer engagement and commerce software that allows
organizations to build up a contextual understanding of their customers in real time, deliver a more impactful,
relevant customer experience, and sell more goods, services and digital content across every touch point,
channel and device. Through customer data management, context driven marketing tools and unified commerce
processes, SAP Hybris solutions have helped some of the world’s leading organizations to attract, retain and
grow a profitable customer base. SAP Hybris software for customer engagement and commerce provides
organizations with the foundation, framework and business tools to create a holistic customer view across
channels, simplify customer engagement and solve complex business problems. For more information, visit
www.hybris.com.
Appendix A: Total Economic Impact
Total Economic Impact is a methodology developed by Forrester
Research that enhances a company’s technology decision-making
processes and assists vendors in communicating the value proposition
of their products and services to clients. The TEI methodology helps
companies demonstrate, justify, and realize the tangible value of IT
initiatives to both senior management and other key business
stakeholders.
Total Economic Impact Approach
Benefits represent the value delivered to the business by the
product. The TEI methodology places equal weight on the
measure of benefits and the measure of costs, allowing for a
full examination of the effect of the technology on the entire
organization.
Costs consider all expenses necessary to deliver the
proposed value, or benefits, of the product. The cost category
within TEI captures incremental costs over the existing
environment for ongoing costs associated with the solution.
Flexibility represents the strategic value that can be
obtained for some future additional investment building on
top of the initial investment already made. Having the ability
to capture that benefit has a PV that can be estimated.
Risks measure the uncertainty of benefit and cost estimates
given: 1) the likelihood that estimates will meet original
projections and 2) the likelihood that estimates will be
tracked over time. TEI risk factors are based on “triangular
distribution.”
The initial investment column contains costs incurred at “time 0” or at the
beginning of Year 1 that are not discounted. All other cash flows are discounted
using the discount rate at the end of the year. PV calculations are calculated for
each total cost and benefit estimate. NPV calculations in the summary tables are
the sum of the initial investment and the discounted cash flows in each year.
Sums and present value calculations of the Total Benefits, Total Costs, and
Cash Flow tables may not exactly add up, as some rounding may occur.
PRESENT VALUE (PV)
The present or current value of (discounted) cost and benefit estimates given at an interest rate (the discount rate). The PV of costs and benefits feed into the total NPV of cash flows.
NET PRESENT VALUE (NPV)
The present or current value of (discounted) future net cash flows given an interest rate (the discount rate). A positive project NPV normally indicates that the investment should be made, unless other projects have higher NPVs.
RETURN ON INVESTMENT (ROI)
A project’s expected return in percentage terms. ROI is calculated by dividing net benefits (benefits less costs) by costs.
DISCOUNT RATE
The interest rate used in cash flow analysis to take into account the time value of money. Organizations typically use discount rates between 8% and 16%.
PAYBACK PERIOD
The breakeven point for an investment. This is the point in time at which net benefits (benefits minus costs) equal initial investment or cost.