56
ihs.com © 2015 IHS US Economic Outlook IHS The US Economic Outlook 17 December 2015 Patrick Newport, Director of Long Term Forecasting +1 781 301 9125, [email protected] ECONOMICS

ihs.com
© 2015 IHS
US Economic Outlook
IHS
The US Economic Outlook 17 December 2015
Patrick Newport, Director of Long Term Forecasting
+1 781 301 9125, [email protected]
ECONOMICS

© 2015 IHS
The US economy on a moderate growth path
• Real GDP growth will pick up from 2.5% in 2015 to 2.7% in 2016.
• Consumer spending is supported by solid gains in employment, real
disposable income, and housing asset values.
• Housing construction will steadily recover in response to rising
employment, easing credit, and a higher household formation rate.
• Business investment in equipment, software, and commercial
structures will post robust growth.
• A two-year federal budget agreement and suspension of the debt
ceiling boosts near-term spending and reduces policy uncertainty.
• Interest rates will gradually increase from late 2015 through 2018 as
monetary accommodation is withdrawn.
2
US Economic Outlook / December 2015
© 2015 IHS
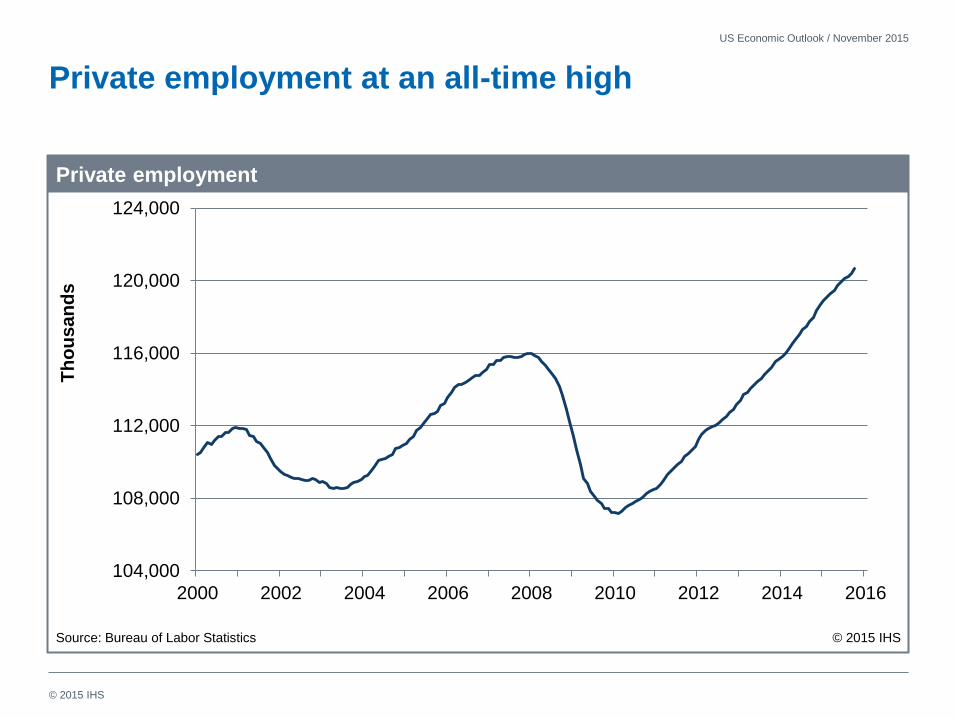
Private employment at an all-time high
US Economic Outlook / November 2015
104,000
108,000
112,000
116,000
120,000
124,000
2000 2002 2004 2006 2008 2010 2012 2014 2016
Private employment
Source: Bureau of Labor Statistics © 2015 IHS
Th
ou
sa
nd
s

© 2015 IHS
Jobs!
Indiana Presentation / December 2015
-8
-6
-4
-2
0
2
4
2000 2002 2004 2006 2008 2010 2012 2014
United States Indiana
Payroll employment growth
Source: Bureau of Labor Statistics © 2015 IHS
Y/y
pe
rce
nt
ch
an
ge
© 2015 IHS
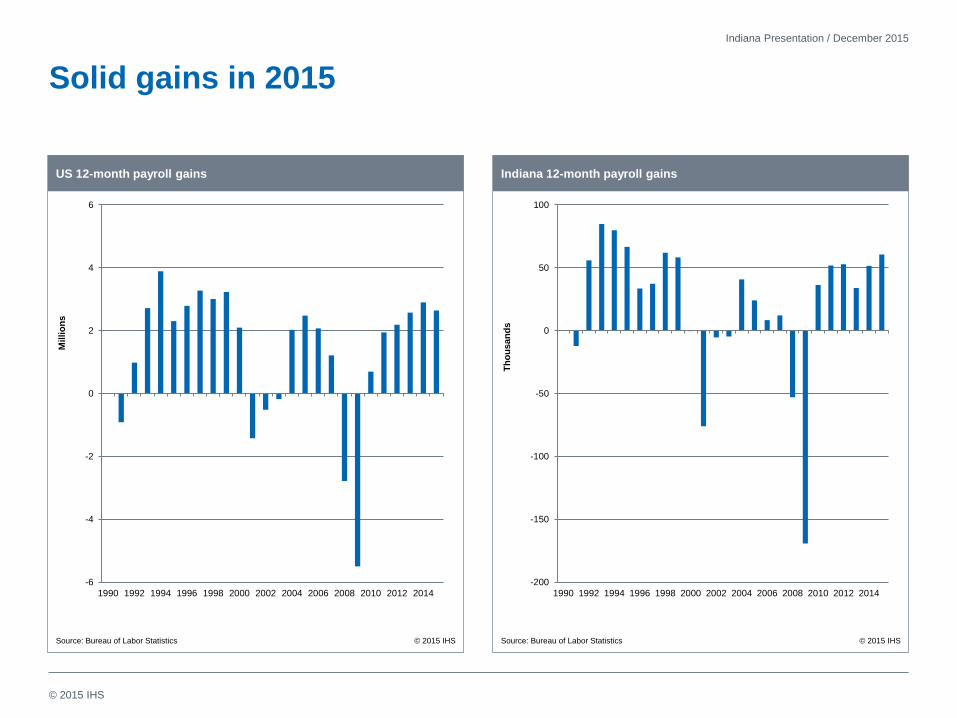
Solid gains in 2015
Indiana Presentation / December 2015
-6
-4
-2
0
2
4
6
1990 1992 1994 1996 1998 2000 2002 2004 2006 2008 2010 2012 2014
US 12-month payroll gains
Source: Bureau of Labor Statistics © 2015 IHS
Millio
ns
-200
-150
-100
-50
0
50
100
1990 1992 1994 1996 1998 2000 2002 2004 2006 2008 2010 2012 2014
Indiana 12-month payroll gains
Source: Bureau of Labor Statistics © 2015 IHS
Th
ou
san
ds

© 2015 IHS
Close to full employment!!!
Indiana Presentation / December 2015
2
3
4
5
6
7
8
9
10
11
2000 2002 2004 2006 2008 2010 2012 2014
United States Indiana
Unemployment rate
Source: Bureau of Labor Statistics © 2015 IHS
Pe
rce
nt

© 2015 IHS
Participation rate: at 1978 levels
US Economic Outlook / November 2015
62
63
64
65
66
67
68
2000 2002 2004 2006 2008 2010 2012 2014 2016
Labor force paticipation rate
Source: Bureau of Labor Statistics © 2015 IHS
Pe
rce
nt

© 2015 IHS
Little Wage inflation
US Economic Outlook / November 2015
1.0
1.5
2.0
2.5
3.0
3.5
4.0
4.5
2000 2002 2004 2006 2008 2010 2012 2014 2016
Employment cost index, wages and salaries
Source: Bureau of Labor Statistics © 2015 IHS
Year-
ove
r-ye
ar
pe
rce
nt
ch
an
ge

© 2015 IHS
Stagnant productivity growth
US Economic Outlook / November 2015
-1
0
1
2
3
4
5
6
2000 2002 2004 2006 2008 2010 2012 2014 2016
Nonfarm business output per hour
Source: Bureau of Labor Statistics © 2015 IHS
Year-
ove
r-ye
ar
pe
rce
nt
ch
an
ge
© 2015 IHS
-150 0 150 300 450 600 750
Mining & logging
Utilities
Federal government
State government
Information
Manufacturing
Local government
Other services
Education
Wholesale trade
Transport & warehousing
Financial services
Construction
Retail trade
Leisure & hospitality
Health & social services
Prof. & business services
10
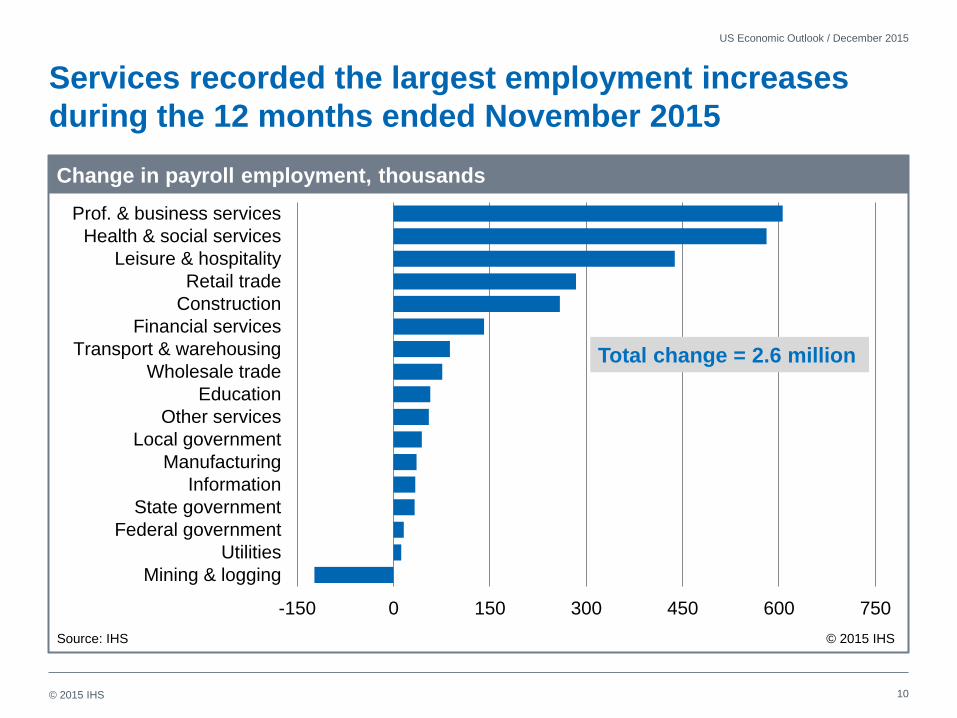
Services recorded the largest employment increases
during the 12 months ended November 2015
US Economic Outlook / December 2015
Change in payroll employment, thousands
Total change = 2.6 million
Source: IHS © 2015 IHS

© 2015 IHS 11
The dollar’s real exchange value is appreciating,
reaching a 12-year high against major currencies
US Economic Outlook / November 2015
Real trade-weighted dollar index
0.6
0.8
1.0
1.2
1.4
1.6
1980 1984 1988 1992 1996 2000 2004 2008 2012 2016 2020
Ind
ex,
2009 =
1.0
Major trading partners Other important trading partners
Source: IHS © 2015 IHS

© 2015 IHS 12
The Institute for Supply Management’s indexes signal a
stall in manufacturing and moderate growth in services
US Economic Outlook / December 2015
30
35
40
45
50
55
60
65
2000 2002 2004 2006 2008 2010 2012 2014
Ove
r 5
0 i
nd
ica
tes
ex
pa
ns
ion
Manufacturing index Nonmanufacturing index
ISM indexes
Source: Institute for Supply Management (ISM) © 2015 IHS
© 2015 IHS 13
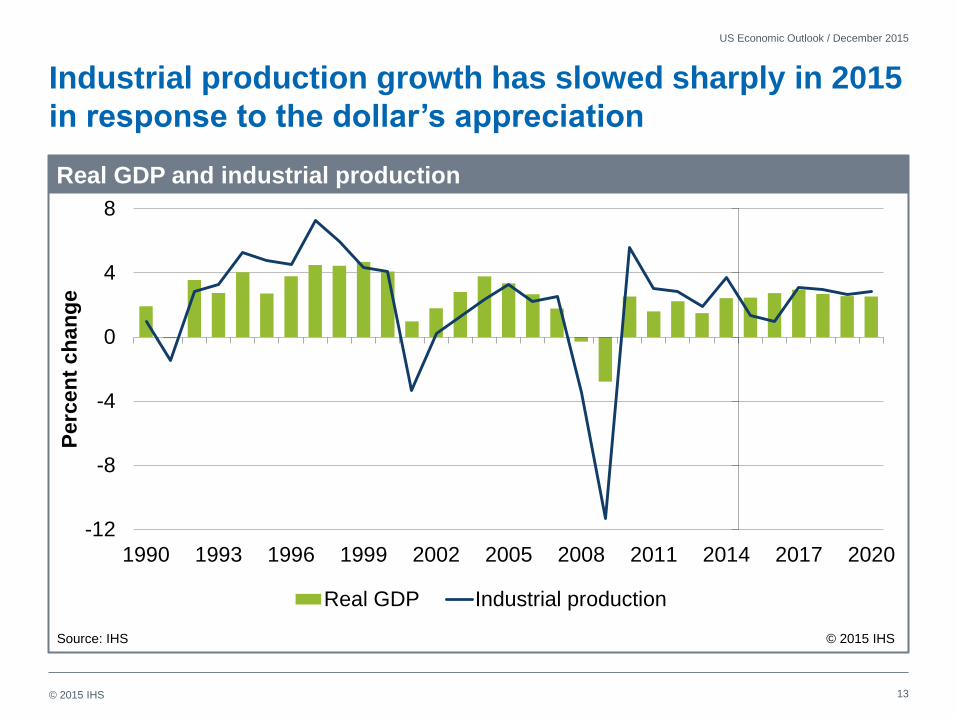
Industrial production growth has slowed sharply in 2015
in response to the dollar’s appreciation
US Economic Outlook / December 2015
Real GDP and industrial production
-12
-8
-4
0
4
8
1990 1993 1996 1999 2002 2005 2008 2011 2014 2017 2020
Perc
en
t ch
an
ge
Real GDP Industrial production
Source: IHS © 2015 IHS

© 2015 IHS 14
Sources of growth in US real GDP
US Webcast / November 2015
-1
0
1
2
3
4
2012 2013 2014 2015 2016 2017 2018
Real GDP Consumer spending Nonresidential investmentResidential investment Inventories ExportsImports Government Domestic demand
Perc
en
tag
e p
oin
ts
Contribution to real GDP growth
Source: IHS © 2015 IHS

© 2015 IHS 15
US economic growth by sector
US Economic Outlook / December 2015
Real GDP and its components
Percent change 2014 2015 2016 2017
Real GDP 2.4 2.5 2.7 3.0
Consumption 2.7 3.1 3.1 3.2
Residential investment 1.8 8.4 9.0 10.3
Business fixed investment 6.2 3.3 5.3 5.1
Federal government -2.4 -0.4 3.6 -0.8
State & local government 0.6 1.5 1.4 1.2
Exports 3.4 1.0 2.5 5.4
Imports 3.8 4.8 4.8 7.5

© 2015 IHS 16
The US economy is near full employment: Real GDP
growth and the unemployment rate
US Economic Outlook / November 2015
Real GDP and unemployment
4
5
6
7
8
9
10
-10.0
-7.5
-5.0
-2.5
0.0
2.5
5.0
2007 2009 2011 2013 2015 2017
Perc
en
t o
f la
bo
r fo
rce
An
nu
al
perc
en
t ch
an
ge
Real GDP growth (Left scale) Unemployment rate (Right scale)
Source: IHS © 2015 IHS
© 2015 IHS 17
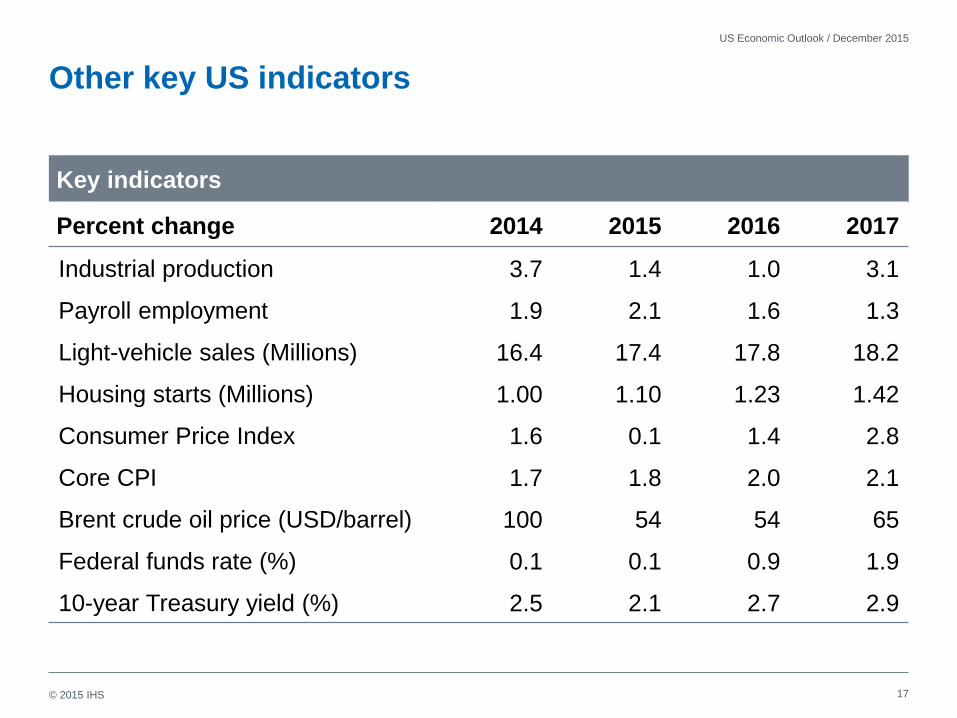
Other key US indicators
US Economic Outlook / December 2015
Key indicators
Percent change 2014 2015 2016 2017
Industrial production 3.7 1.4 1.0 3.1
Payroll employment 1.9 2.1 1.6 1.3
Light-vehicle sales (Millions) 16.4 17.4 17.8 18.2
Housing starts (Millions) 1.00 1.10 1.23 1.42
Consumer Price Index 1.6 0.1 1.4 2.8
Core CPI 1.7 1.8 2.0 2.1
Brent crude oil price (USD/barrel) 100 54 54 65
Federal funds rate (%) 0.1 0.1 0.9 1.9
10-year Treasury yield (%) 2.5 2.1 2.7 2.9
© 2015 IHS 18
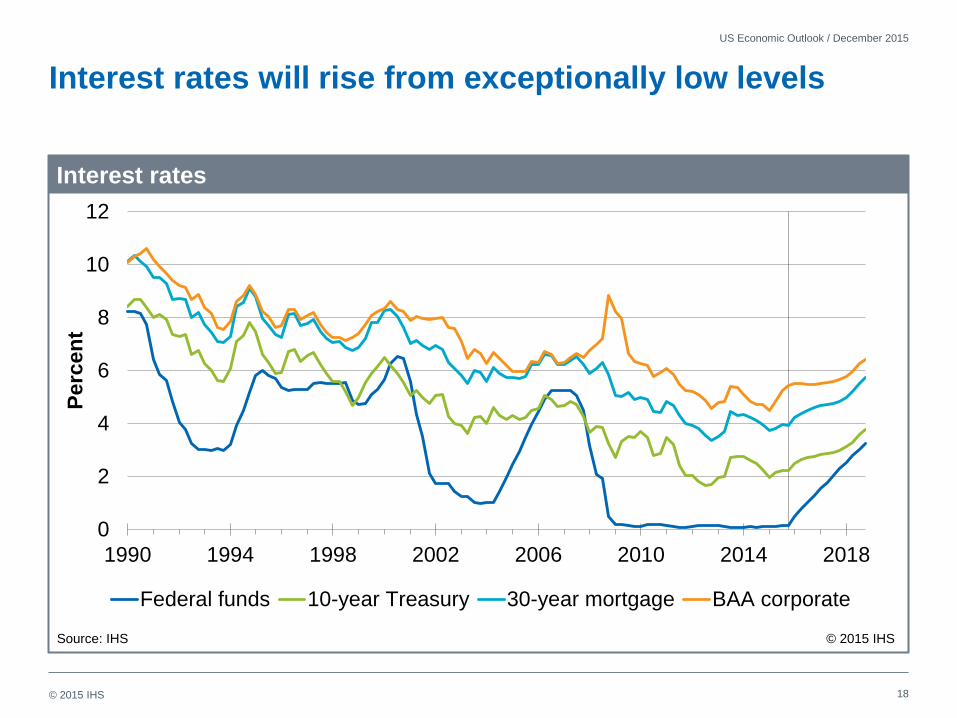
Interest rates will rise from exceptionally low levels
US Economic Outlook / December 2015
Interest rates
0
2
4
6
8
10
12
1990 1994 1998 2002 2006 2010 2014 2018
Pe
rce
nt
Federal funds 10-year Treasury 30-year mortgage BAA corporate
Source: IHS © 2015 IHS

© 2015 IHS 19
Job growth will slow as the US economy approaches full
employment
US Economic Outlook / November 2015
Payroll employment
-8
-6
-4
-2
0
2
4
2000 2002 2004 2006 2008 2010 2012 2014 2016 2018
Perc
en
t ch
an
ge,
an
nu
al
rate
Source: IHS © 2015 IHS

© 2015 IHS 20
After an inventory correction in late 2015 and early 2016,
manufacturing production growth will rebound
US Economic Outlook / December 2015
Industrial production and real GDP
-4
-2
0
2
4
6
8
2011 2012 2013 2014 2015 2016 2017 2018
Year-
over-
year
perc
en
t ch
an
ge
All manufacturing Excluding information technologies Real GDP
Source: IHS © 2015 IHS

© 2015 IHS 21
US industrial production growth
US Economic Outlook / November 2015
Industrial production
Percent change 2014 2015 2016 2017
All manufacturing 2.8 2.1 2.2 3.2
Motor vehicles & parts 10.4 9.2 6.5 3.6
Computers & electronics 2.9 1.4 3.8 6.6
Electrical equip. & appliances 2.1 3.6 2.5 3.3
Machinery 4.7 -0.3 -1.7 4.7
Textiles 3.4 -0.6 0.0 -1.3
Furniture 6.5 3.6 2.1 3.7
Chemicals 1.8 3.4 2.1 4.2

© 2015 IHS 22
Consumer price inflation will pick up as commodity
prices recover
US Economic Outlook / December 2015
Inflation rates
-2
-1
0
1
2
3
4
5
6
2000 2002 2004 2006 2008 2010 2012 2014 2016 2018 2020
Year-
over-
year
perc
en
t ch
an
ge
All-urban CPI Core CPI (excluding food and energy)
Source: IHS © 2015 IHS

© 2015 IHS 23
Worker compensation will accelerate as labor markets
tighten and the Affordable Care Act is implemented
US Economic Outlook / December 2015
Labor compensation
0
1
2
3
4
5
6
7
8
2000 2002 2004 2006 2008 2010 2012 2014 2016 2018 2020
Year-
over-
year
perc
en
t ch
an
ge
Total compensation Wages & salaries Benefits
Source: IHS © 2015 IHS
© 2015 IHS 24
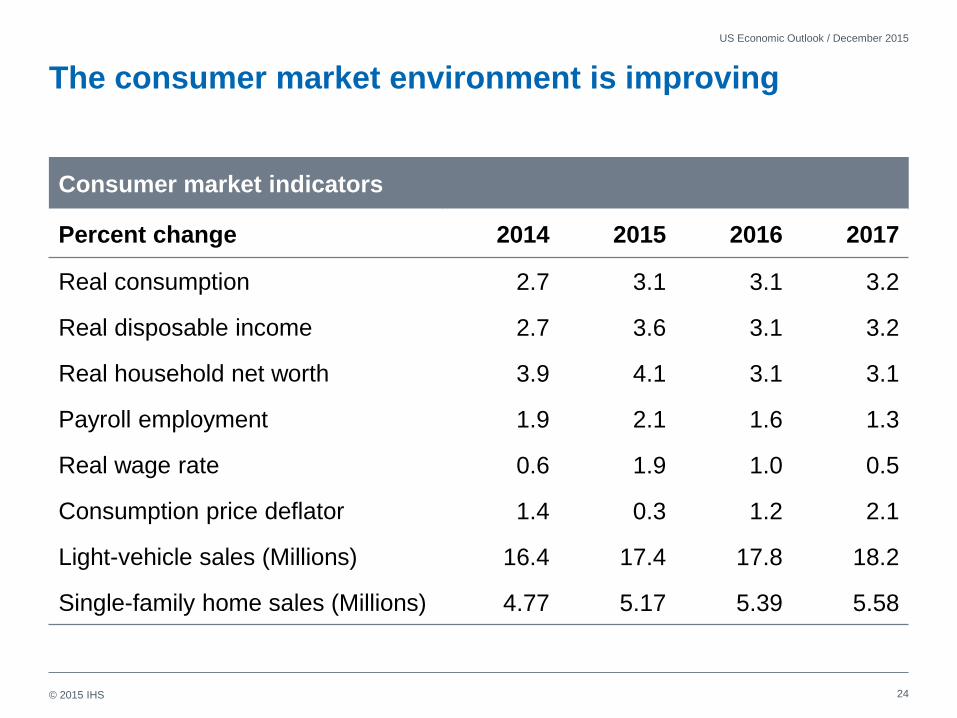
The consumer market environment is improving
US Economic Outlook / December 2015
Consumer market indicators
Percent change 2014 2015 2016 2017
Real consumption 2.7 3.1 3.1 3.2
Real disposable income 2.7 3.6 3.1 3.2
Real household net worth 3.9 4.1 3.1 3.1
Payroll employment 1.9 2.1 1.6 1.3
Real wage rate 0.6 1.9 1.0 0.5
Consumption price deflator 1.4 0.3 1.2 2.1
Light-vehicle sales (Millions) 16.4 17.4 17.8 18.2
Single-family home sales (Millions) 4.77 5.17 5.39 5.58
© 2015 IHS 25
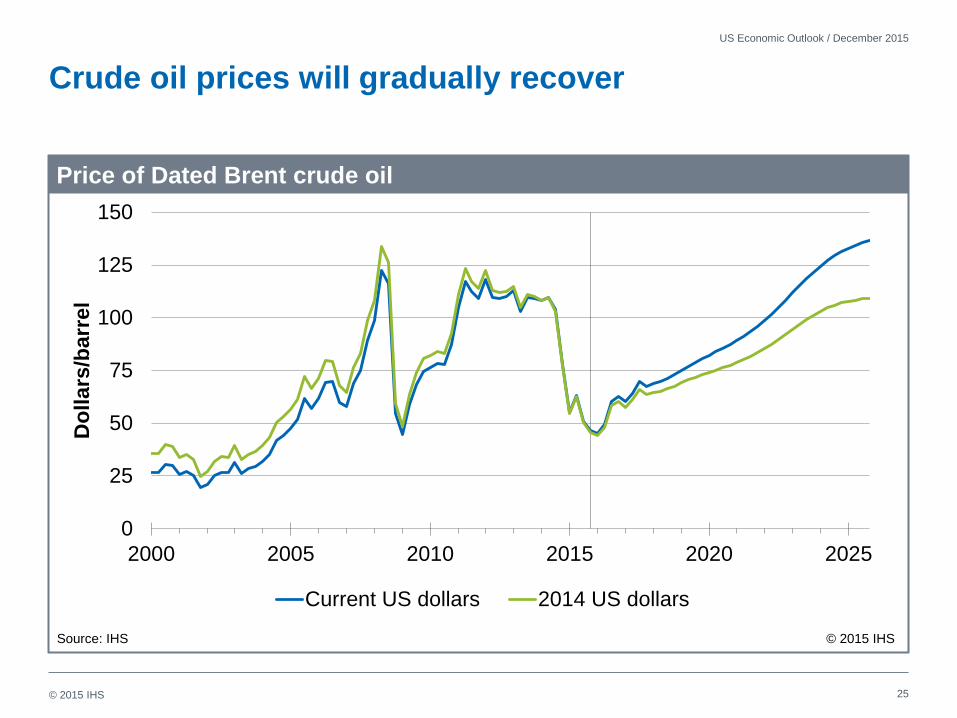
Crude oil prices will gradually recover
US Economic Outlook / December 2015
0
25
50
75
100
125
150
2000 2005 2010 2015 2020 2025
Do
llars
/barr
el
Current US dollars 2014 US dollars
Price of Dated Brent crude oil
Source: IHS © 2015 IHS

© 2015 IHS 26
Consumer spending growth depends on disposable
income growth, which has strengthened in 2015
US Economic Outlook / November 2015
Real consumer spending and disposable income
-2
0
2
4
6
2000 2002 2004 2006 2008 2010 2012 2014 2016 2018
Perc
en
t ch
an
ge
Real consumer spending Real disposable income
Tax increases under-
mined growth in 2013
Source: IHS © 2015 IHS
© 2015 IHS 27
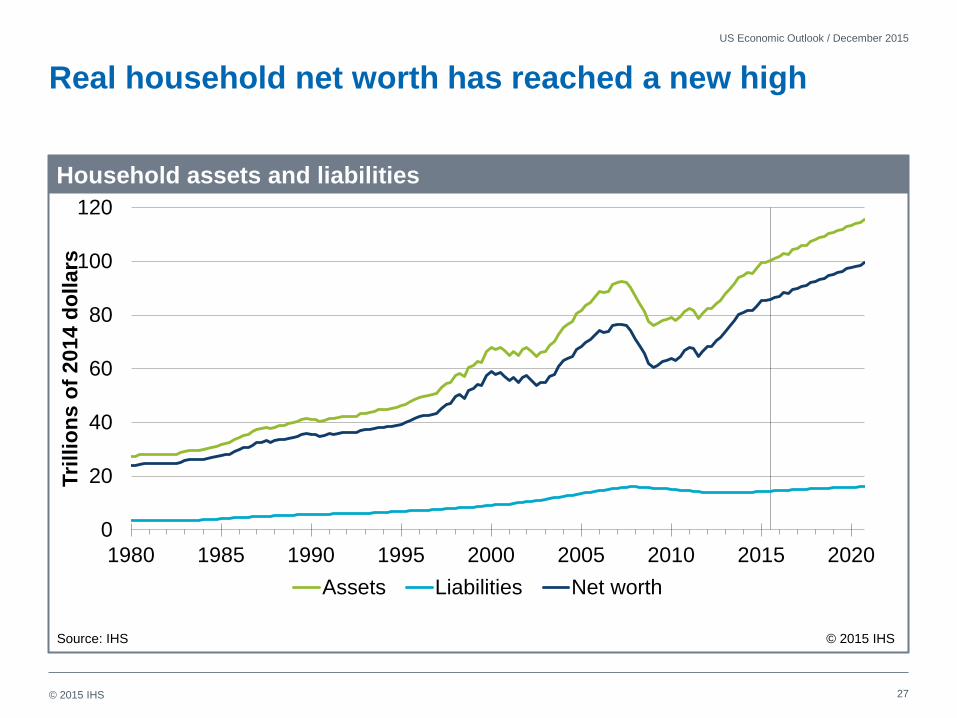
Real household net worth has reached a new high
US Economic Outlook / December 2015
Household assets and liabilities
0
20
40
60
80
100
120
1980 1985 1990 1995 2000 2005 2010 2015 2020
Tri
llio
ns
of
20
14
do
llars
Assets Liabilities Net worth
Source: IHS © 2015 IHS

© 2015 IHS 28
Light-vehicle sales will peak in 2017; low gasoline prices
boost demand for light trucks
US Economic Outlook / December 2015
Light-vehicle sales
0
4
8
12
16
20
1980 1985 1990 1995 2000 2005 2010 2015 2020
Millio
ns o
f u
nit
s,
an
nu
al
rate
s
Total Cars Light trucks
Source: IHS © 2015 IHS

© 2015 IHS
The recovery in housing markets is gaining momentum
• Sustained job growth will support increases in housing demand.
• Credit availability is improving for home buyers and builders.
• Supplies of new and existing homes are tight, driving up prices.
• Multifamily units will account for about one-third of housing starts.
• Young adults have postponed homeownership, resulting in pent-up
demand.
• Sales to first-time buyers are rising rapidly.
• Baby boomers are starting to downsize.
29
US Economic Outlook / December 2015

© 2015 IHS 30
A recovery in household formation will support further
gains in housing starts
US Economic Outlook / December 2015
Housing starts and formation
0.0
0.3
0.6
0.9
1.2
1.5
1.8
2.1
1980 1985 1990 1995 2000 2005 2010 2015 2020 2025
Mil
lio
ns
Housing starts Household formation
Source: IHS © 2015 IHS

© 2015 IHS 31
Single-family home sales and construction are not
expected to regain 2005 peaks
US Economic Outlook / December 2015
Single-family housing starts and sales
1
2
3
4
5
6
7
8
0.25
0.50
0.75
1.00
1.25
1.50
1.75
2.00
1970 1975 1980 1985 1990 1995 2000 2005 2010 2015 2020
Millio
ns o
f u
nit
s
Millio
ns o
f u
nit
s
Housing starts (Left scale) Home sales (Right scale)
Source: IHS © 2015 IHS

© 2015 IHS
Nonresidential fixed investment has slowed
• Most companies are investing at steady rates
• However, companies exposed to foreign competition (manufacturing),
low oil and gas prices, and falling agricultural prices have cut capital
spending sharply
• Agricultural machinery is down 48% year-over-year, due to falling agricultural
prices
• Mining and oilfield machinery equipment is down 48% year-over-year—blame
low oil prices
• Railroad equipment is down 56% year-over-year
• Special industrial machinery is down 20% year-over-year, thanks to the
strong dollar
• Mine and well structures are down 44% year-over-year
US Webcast / November 2015
32
© 2015 IHS
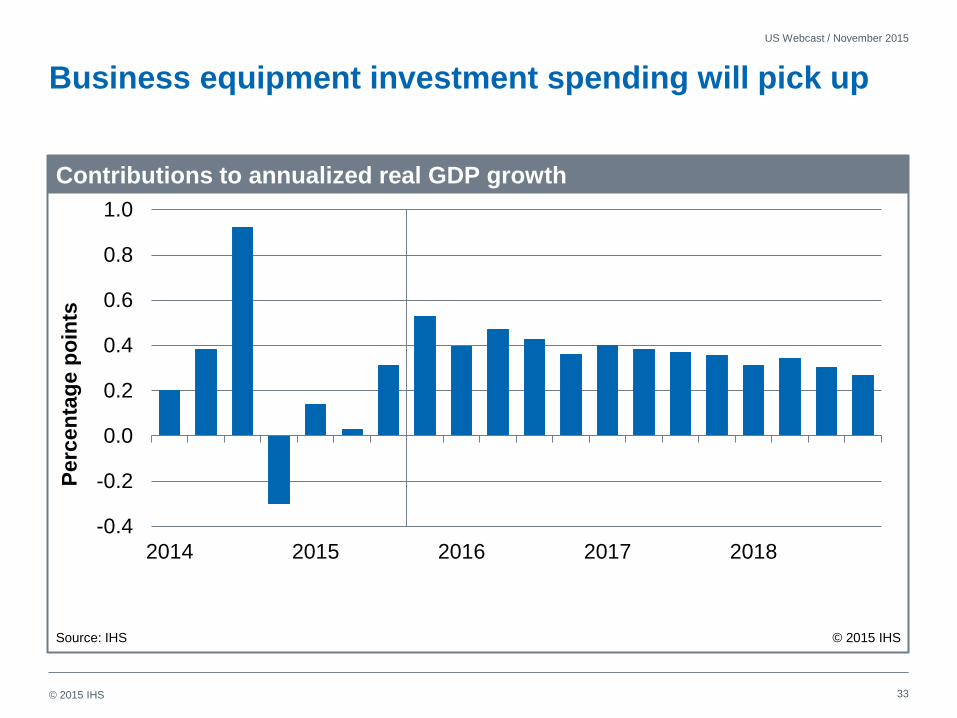
Business equipment investment spending will pick up
-0.4
-0.2
0.0
0.2
0.4
0.6
0.8
1.0
2014 2015 2016 2017 2018
Contributions to annualized real GDP growth
Source: IHS © 2015 IHS
Perc
en
tag
e p
oin
ts
US Webcast / November 2015
33
© 2015 IHS
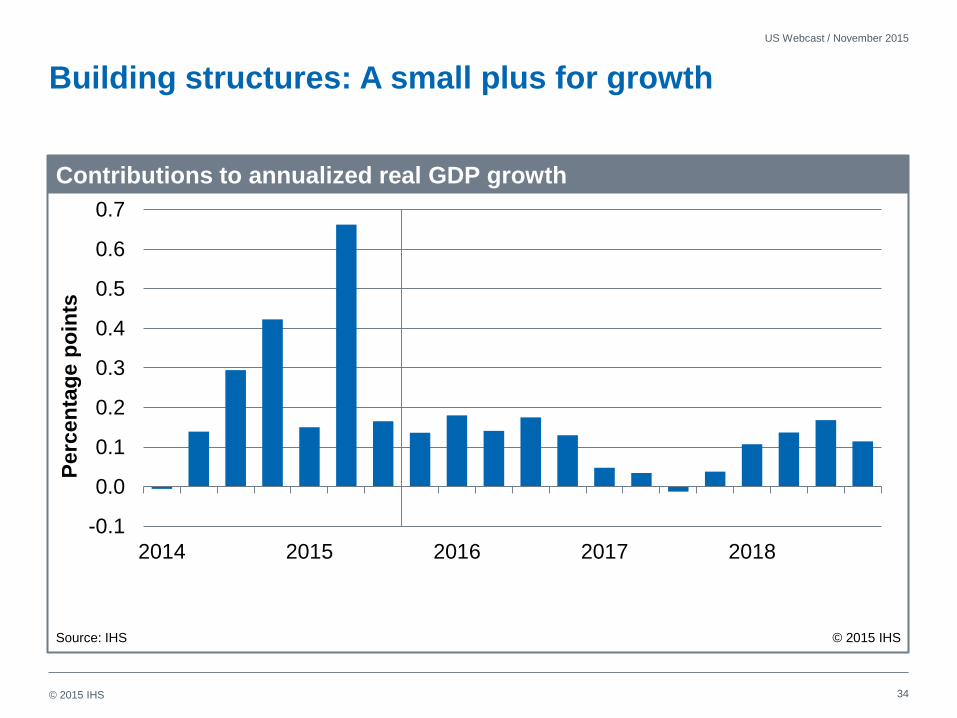
Building structures: A small plus for growth
-0.1
0.0
0.1
0.2
0.3
0.4
0.5
0.6
0.7
2014 2015 2016 2017 2018
Contributions to annualized real GDP growth
Source: IHS © 2015 IHS
Perc
en
tag
e p
oin
ts
US Webcast / November 2015
34
© 2015 IHS
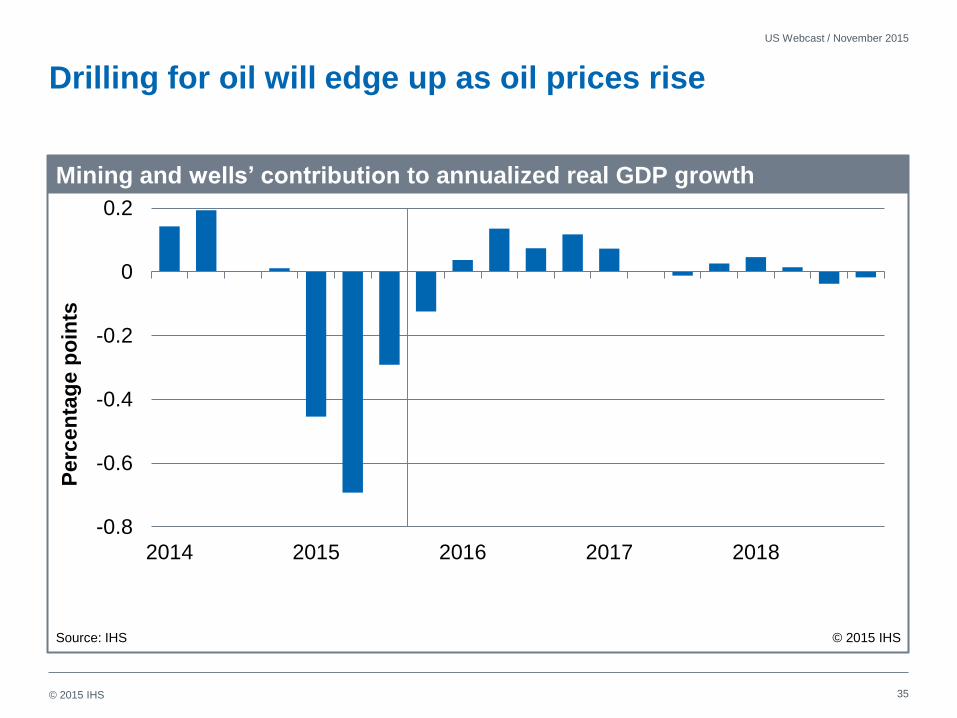
Drilling for oil will edge up as oil prices rise
-0.8
-0.6
-0.4
-0.2
0
0.2
2014 2015 2016 2017 2018
Mining and wells’ contribution to annualized real GDP growth
Source: IHS © 2015 IHS
Perc
en
tag
e p
oin
ts
US Webcast / November 2015
35
© 2015 IHS 36
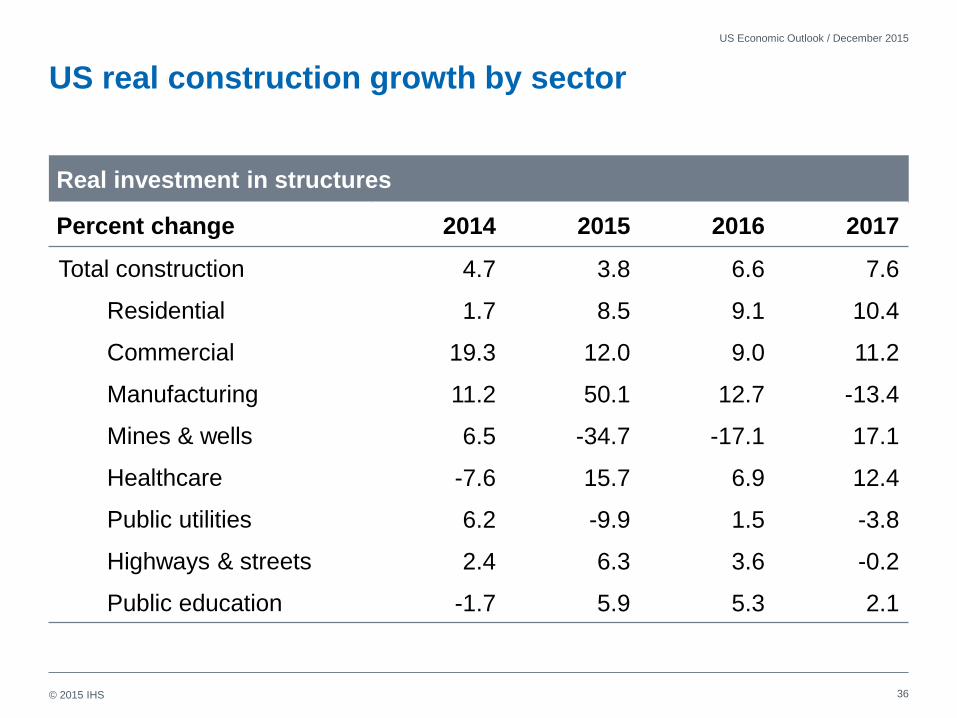
US real construction growth by sector
US Economic Outlook / December 2015
Real investment in structures
Percent change 2014 2015 2016 2017
Total construction 4.7 3.8 6.6 7.6
Residential 1.7 8.5 9.1 10.4
Commercial 19.3 12.0 9.0 11.2
Manufacturing 11.2 50.1 12.7 -13.4
Mines & wells 6.5 -34.7 -17.1 17.1
Healthcare -7.6 15.7 6.9 12.4
Public utilities 6.2 -9.9 1.5 -3.8
Highways & streets 2.4 6.3 3.6 -0.2
Public education -1.7 5.9 5.3 2.1
© 2015 IHS
The Bipartisan Budget Act of 2015 brings some clarity to
federal fiscal policy
• The federal debt ceiling is suspended through March 2017.
• The federal government is funded through September 2017.
• Budget authority is increased by $50 billion in fiscal 2016 and $30 billion in
fiscal 2017 from previous budget caps.
• These increments are divided equally between defense and nondefense
discretionary spending.
• An omnibus appropriations bill must still be enacted by 11 December.
• Consistent with Congressional Budget Office estimates, we assume that
outlays are increased by $30 billion in both 2016 and 2017, and the
remainder is spread through 2021.
• The agreement is expected to raise the level of real GDP by 0.2% in
2016 and 0.1% in 2017.
37
US Economic Outlook / November 2015

© 2015 IHS 38
The US federal budget will remain in deficit
US Economic Outlook / November 2015
US federal budget balance
-12
-9
-6
-3
0
3
-2,000
-1,500
-1,000
-500
0
500
1980 1985 1990 1995 2000 2005 2010 2015 2020 2025
Billio
ns o
f U
SD
, fi
scal
years
Unified budget balance (Left scale) Balance as percent of GDP (Right scale)
Source: IHS © 2015 IHS

© 2015 IHS 39
The gap between federal expenditures and revenues will
stay in the 2–3% range of GDP
US Economic Outlook / November 2015
Federal revenues and expenditures*
14
16
18
20
22
24
26
1970 1975 1980 1985 1990 1995 2000 2005 2010 2015 2020 2025
Perc
en
t o
f G
DP
Federal revenues Federal expenditures
* Fiscal years, unified budget
Source: IHS © 2015 IHS
© 2015 IHS
A gradual acceleration in the global economy
• The world economy remains in low gear; only a modest pickup in
growth is expected in 2016.
• Eurozone growth will improve slightly, aided by monetary stimulus,
currency depreciation, and pent-up demand.
• China’s economic growth will slow further in 2016 because of
imbalances in credit, housing, and industrial markets.
• The plunge in materials prices is restraining growth in the commodity-
exporting countries of the Americas, Africa, and Asia-Pacific.
• Prospects for emerging markets depend on structural reforms that raise
productivity and allocate capital more efficiently.
40
US Economic Outlook / December 2015

© 2015 IHS
-1
0
1
2
3
4
5
6
NAFTA OtherAmericas
WesternEurope
EmergingEurope
Mideast-N. Africa
Sub-Saharan
Africa
Japan OtherAsia-
Pacific
An
nu
al
perc
en
t ch
an
ge
2014 2015 2016 2017 2018-22
41
Asia-Pacific (excluding Japan) will achieve the fastest
growth in real GDP
US Economic Outlook / December 2015
Real GDP
Source: IHS © 2015 IHS

© 2015 IHS 42
The US current account will remain in deficit
US Economic Outlook / December 2015
Current-account balance
-7.5
-6.0
-4.5
-3.0
-1.5
0.0
1.5
-1,250
-1,000
-750
-500
-250
0
250
1980 1985 1990 1995 2000 2005 2010 2015 2020 2025
Current-account balance (Left scale, billion US dollars)
Balance as percent of GDP (Right scale)
Source: IHS © 2015 IHS
© 2015 IHS
Bottom line for the US economy
• Consumer spending will be supported by gains in employment, real
disposable income, and household net worth.
• Homebuilding will rise as credit availability improves and demand from
young adults strengthens.
• Foreign trade will be a drag on US economic growth through 2018, due
to a strong dollar and sluggish growth in major export markets.
• Real business fixed investment will post solid gains, led by information
technology equipment and commercial structures.
• The Federal Reserve will likely begin to raise the federal funds rate in
December; it will reach an equilibrium at 3.25% in late 2018.
• Core inflation will edge upward to the central bank’s 2% target.
• Forecast risks are weighted to the downside.
43
US Economic Outlook / December 2015

© 2015 IHS
Regional and Indiana Economic Outlook
44 Indiana Economic Outlook / December 2015

© 2015 IHS
U.S. Regional Outlook
• States in the West and Sunbelt will continue to growth fastest.
• These states saw the worst housing busts.
• Population growth fastest in these regions.
• People go where the jobs are, but jobs also go where the people are.
• Weaker service-sector growth in states with low population growth.
• Manufacturing gains, especially from the auto sector supply chain, have
been a key to the improving Midwestern economy.
• Drop in oil prices, combined with weakness in natural gas and coal, has
slammed the brakes on natural resource and mining sector.
• Demand for steel pipe, machinery, transportation, construction cut.
45
Indiana Economic Outlook / December 2015

© 2015 IHS 46
Indiana Economic Outlook / December 2015
2015 jobs growth concentrated in West, Southeast Resource-heavy states in a struggle; Indiana ranks 13th
Percent
-1.1 to 0.9
1.0 to 1.5
1.6 to 2.2
2.3 to 3.9
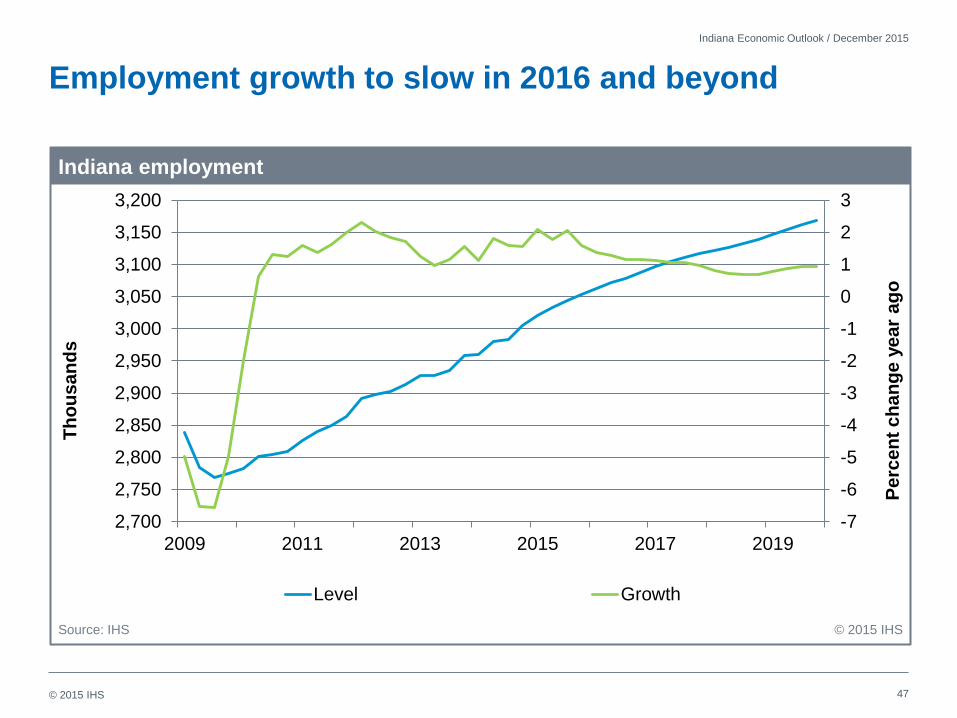
© 2015 IHS 47
Indiana Economic Outlook / December 2015
Employment growth to slow in 2016 and beyond
-7
-6
-5
-4
-3
-2
-1
0
1
2
3
2,700
2,750
2,800
2,850
2,900
2,950
3,000
3,050
3,100
3,150
3,200
2009 2011 2013 2015 2017 2019
Level Growth
Indiana employment
Source: IHS © 2015 IHS
Th
ou
sa
nd
s
Pe
rce
nt
ch
an
ge
ye
ar
ag
o
© 2015 IHS 48
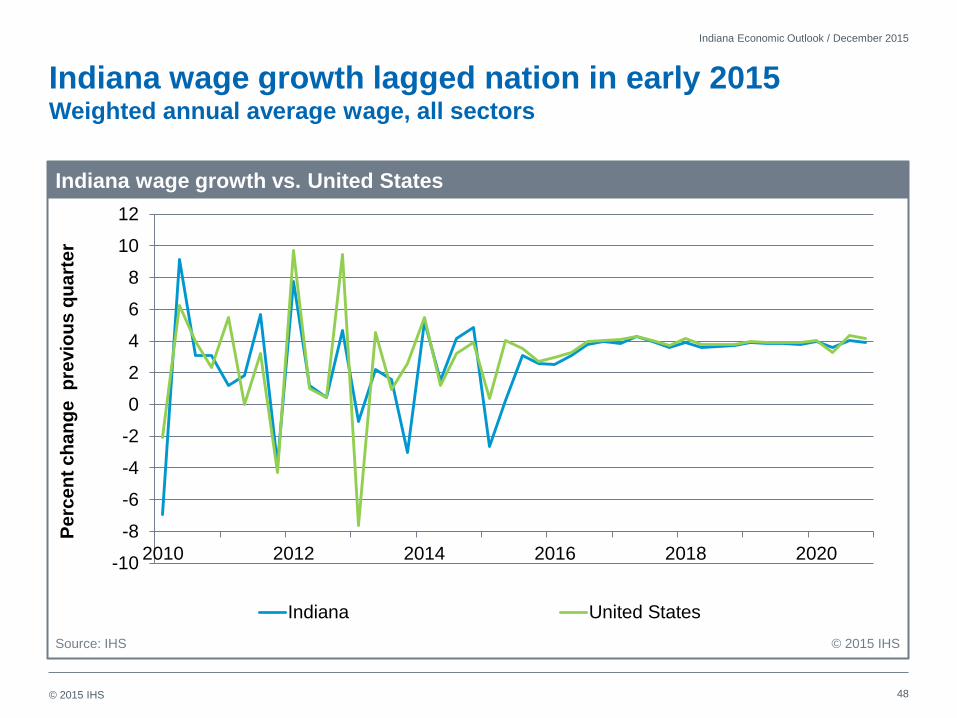
Indiana Economic Outlook / December 2015
Indiana wage growth lagged nation in early 2015 Weighted annual average wage, all sectors
-10
-8
-6
-4
-2
0
2
4
6
8
10
12
2010 2012 2014 2016 2018 2020
Indiana United States
Indiana wage growth vs. United States
Source: IHS © 2015 IHS
Pe
rce
nt
ch
an
ge
p
revio
us
qu
art
er

© 2015 IHS 49
Indiana Economic Outlook / December 2015
Indiana housing starts will increase in 2016 and beyond Auto sales growth to slow as recovery matures
0
5
10
15
20
25
30
0
50
100
150
200
250
300
2010 2012 2014 2016 2018 2020
New car registrations, left axis Total housing starts, right axis
Indiana total housing starts and new car registrations
Source: IHS © 2015 IHS
Th
ou
sa
nd
Th
ou
sa
nd
Pre-recession peak was
40,000 starts in 2003.
© 2015 IHS
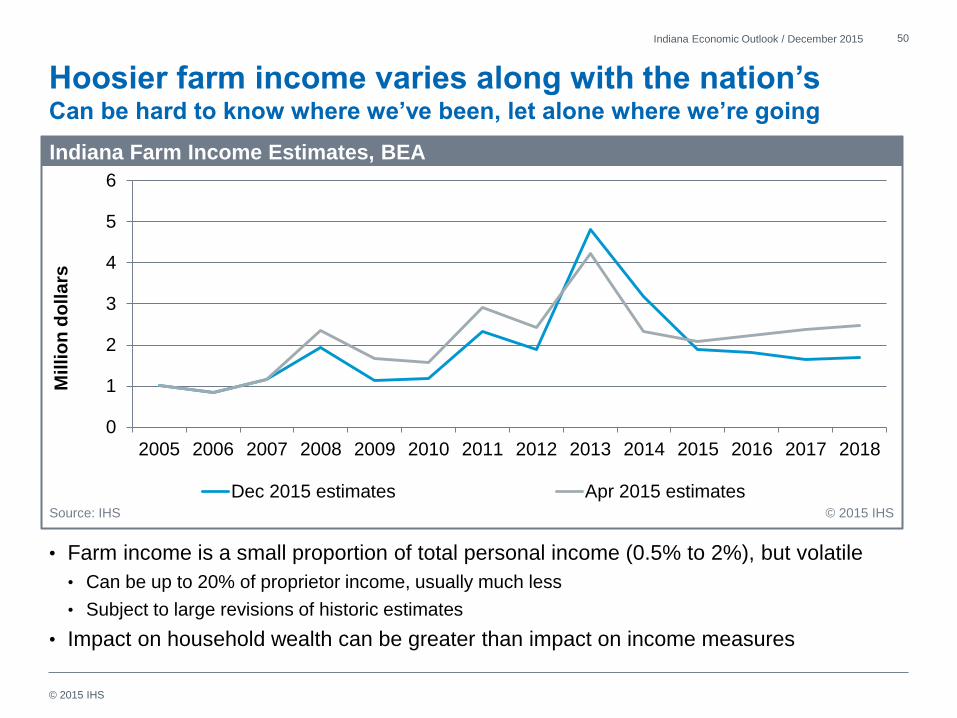
Hoosier farm income varies along with the nation’s Can be hard to know where we’ve been, let alone where we’re going
• Farm income is a small proportion of total personal income (0.5% to 2%), but volatile
• Can be up to 20% of proprietor income, usually much less
• Subject to large revisions of historic estimates
• Impact on household wealth can be greater than impact on income measures
50 Indiana Economic Outlook / December 2015
0
1
2
3
4
5
6
2005 2006 2007 2008 2009 2010 2011 2012 2013 2014 2015 2016 2017 2018
Dec 2015 estimates Apr 2015 estimates
Indiana Farm Income Estimates, BEA
Source: IHS © 2015 IHS
Millio
n d
oll
ars
© 2015 IHS 51
Indiana Economic Outlook / December 2015
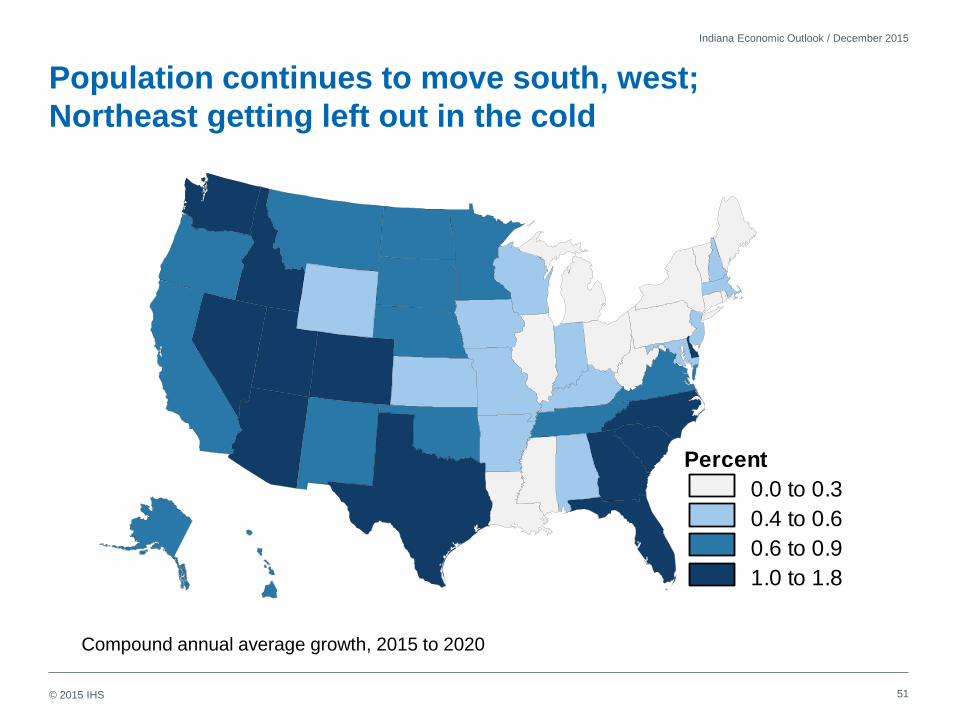
Population continues to move south, west;
Northeast getting left out in the cold
Compound annual average growth, 2015 to 2020
Percent
0.0 to 0.3
0.4 to 0.6
0.6 to 0.9
1.0 to 1.8

© 2015 IHS
Indiana Forecast Summary
52
Indiana Economic Outlook / December 2015
Key indicators
Percent change 2014 2015 2016 2017
Total employment 1.5 2.2 1.5 1.2
Unemployment rate (%) 5.9 5.0 4.5 4.5
Real personal Income 2.3 3.6 2.9 2.8
Real gross state product 0.4 1.5 2.5 2.8
Personal consumption
expenditures 3.1 2.9 4.1 5.4
Housing starts (Thousands) 17.5 15.9 19.8 23.8
Share of multi-family (%) 28.5 22.8 22.6 18.8

© 2015 IHS
IHS Forecast Track Record
• Income estimate for 2015 and beyond lowered slightly by lower expected wages
• Largely due to revisions in BLS data in early 2015
• Transportation, manufacturing, construction most affected
53 Indiana Economic Outlook / December 2015
U.S. GDP
Indiana
Employment
Indiana
Income
Percent change
Forecast
Date
2014
2015
2014
2015
2014
2015
Dec 2013 2.4 3.2 1.6 1.7 4.4 4.6
Dec 2014 2.2 2.7 1.8 1.7 2.1 4.0
Apr 2015 2.4 2.8 1.5 1.9 2.5 4.0
Dec 2015 2.4 2.5 1.5 2.2 3.8 3.8

© 2015 IHS
Bottom line for the Indiana economy
• Near-term economic growth will continue to be favorable.
• Manufacturing, especially related to the transportation sector, has
spurred Indiana’s economic recovery over the past five years.
• Manufacturing provides 17% of state’s payroll jobs, first in the nation.
• National average is 9%.
• Sales of cars and light trucks a huge factor; demand from oil and gas industry
for steel pipe, machinery, etc., has also helped.
• Domestic demand maturing, strong dollar reduces competitiveness.
• Expanding service employment is key to long-run economic growth.
• High-tech area is where value is being added.
• Requires ongoing investment in education, R&D, infrastructure.
• Long-term slow population growth a potential drag on economy.
54
Indiana Economic Outlook / December 2015

IHS Customer Care:
• Americas: +1 800 IHS CARE (+1 800 447 2273); [email protected]
• Europe, Middle East, and Africa: +44 (0) 1344 328 300; [email protected]
• Asia and the Pacific Rim: +604 291 3600; [email protected]
© 2014 IHS. No portion of this report may be reproduced, reused, or otherwise distributed in any form without prior written consent, with the exception of any internal client distribution as may be permitted in the license agreement between client and IHS.
Content reproduced or redistributed with IHS permission must display IHS legal notices and attributions of authorship. The information contained herein is from sources considered reliable but its accuracy and completeness are not warranted, nor are the
opinions and analyses which are based upon it, and to the extent permitted by law, IHS shall not be liable for any errors or omissions or any loss, damage or expense incurred by reliance on information or any statement contained herein. For more
information, please contact IHS at Customer Care (see phone numbers and email addresses above). All products, company names or other marks appearing in this publication are the trademarks and property of IHS or their respective owners.
Thank you!

IHSTM
COPYRIGHT NOTICE AND DISCLAIMER © 2015 IHS. For internal use of IHS clients only.
No portion of this report may be reproduced, reused, or otherwise distributed in any form without prior written consent, with the exception of any internal client distribution as may be permitted in the license agreement between client and IHS. Content
reproduced or redistributed with IHS permission must display IHS legal notices and attributions of authorship. The information contained herein is from sources considered reliable, but its accuracy and completeness are not warranted, nor are the
opinions and analyses that are based upon it, and to the extent permitted by law, IHS shall not be liable for any errors or omissions or any loss, damage, or expense incurred by reliance on information or any statement contained herein. In particular,
please note that no representation or warranty is given as to the achievement or reasonableness of, and no reliance should be placed on, any projections, forecasts, estimates, or assumptions, and, due to various risks and uncertainties, actual events
and results may differ materially from forecasts and statements of belief noted herein. This report is not to be construed as legal or financial advice, and use of or reliance on any information in this publication is entirely at client’s own risk. IHS and the
IHS logo are trademarks of IHS.
IHS Customer Care:
Americas: +1 800 IHS CARE (+1 800 447 2273); [email protected]
Europe, Middle East, and Africa: +44 (0) 1344 328 300; [email protected]
Asia and the Pacific Rim: +604 291 3600; [email protected]
ECONOMICS


