THE USE OF PROPORTIONAL MARKET SHARES AS ESTIMATES OF DIVERSION RATIOS IN MERGER ANALYSIS Andrew P. Vassallo * ABSTRACT In this article, I employ a linear differentiated demand model to demonstrate the risks associated with using market shares as a proxy for diversion ratios when calculating the unilateral effects of a merger. In particular, when pro-rata market shares are not adjusted for recapture rates, the estimated diversion ratios are significantly higher than the true diversion ratios. As a result, the estimated unilateral effects price increase is much higher than the actual unilateral effects price increase. Even when recapture rates are introduced, problems arise with nested demand structures and inaccurate market definition. In each case, the use of market share based estimates of diversion ratios can both underestimate and overestimate the actual diversion ratio. This result calls into question the usefulness of proportional market shares as a proxy for actual diversion ratios. JEL: D43; K21; L13; L41 I. INTRODUCTION In May 2011, Sprint Nextel Corporation filed a motion to deny with the Federal Communications Commission with respect to the proposed merger between AT&T and T-Mobile. 1 In their calculation of the upward pricing pressure created by the merger, Sprint Nextel uses proportional diversion, based on market shares, to approximate diversion ratios. 2 These calculations implicitly assume that the marginal consumers who stop purchasing from AT&T or T-Mobile after a price increase will be reallocated to the other firms in the market in proportion to the other firms’ market shares. The diversion ratios are adjusted using different measures for the recapture rate. This rate will measure the percentage of lost customers who switch to a competing firm rather than exit the market altogether. In this article, I examine the use of pro-rata market shares as a proxy for diversion ratios. I show that their use can call into question the results of unilateral effects analysis in merger cases. The 2010 Horizontal Merger Guidelines outline a methodology for evaluating the unilateral effects of a merger. 3 In this analysis, the ratio of sales diverted from one product of a merging firm to a product of the other merging firm (the diversion ratio) is used to calculate the value of diverted sales. The value of diverted sales is the product of the diversion ratio and the per unit margin for the product that the sales are diverted to. The Guidelines say that if the value of diverted sales is small enough, then significant unilateral price effects are unlikely. 4 The value of diverted sales is typically scaled by dividing it by the premerger price of the product whose price is being increased in the exercise. 5 This resulting measure is typically referred to as the Gross Upward Pricing Pressure Index, or GUPPI. 6 If the GUPPI is substantially small, usually * Senior Consultant, Criterion Economics. Email: [email protected]. 1 Petition to Deny of Sprint Nextel Corporation, In the Matter of Applications of AT&T Inc. and Deutsche Telekom AG for Consent to Assign or Transfer Control of Licenses and Authorizations, WT Dkt. No. 11-65 (filed with the FCC May 31, 2011). 2 Id. at 76, ¶ 152. 3 U.S. DEP’T OF JUSTICE & FED. TRADE COMM’N, HORIZONTAL MERGER GUIDELINES (Aug. 2010), available at http://www.justice.gov/atr/public/guidelines/hmg-2010.html. 4 Id. § 6.1. 5 Id. 6 See, e.g., Joseph Farrell & Carl Shapiro, Antitrust Evaluation of Horizontal Mergers: An Economic Alternative to Market Definition, 10 B.E. J. THEORETICAL ECON.: POLICIES & PERSP. (2010); Serge Moresi, The Use of Upward Pricing Pressure Indices in Merger Analysis, 9 ANTITRUST SOURCE (2010).
Transcript
THE USE OF PROPORTIONAL MARKET SHARES AS ESTIMATES OF DIVERSION RATIOS IN MERGER ANALYSIS
Andrew P. Vassallo*
ABSTRACT In this article, I employ a linear differentiated demand model to demonstrate the risks associated with using market shares as a proxy for diversion ratios when calculating the unilateral effects of a merger. In particular, when pro-rata market shares are not adjusted for recapture rates, the estimated diversion ratios are significantly higher than the true diversion ratios. As a result, the estimated unilateral effects price increase is much higher than the actual unilateral effects price increase. Even when recapture rates are introduced, problems arise with nested demand structures and inaccurate market definition. In each case, the use of market share based estimates of diversion ratios can both underestimate and overestimate the actual diversion ratio. This result calls into question the usefulness of proportional market shares as a proxy for actual diversion ratios.
JEL: D43; K21; L13; L41
I. INTRODUCTION In May 2011, Sprint Nextel Corporation filed a motion to deny with the Federal Communications Commission with respect to the proposed merger between AT&T and T-Mobile.1 In their calculation of the upward pricing pressure created by the merger, Sprint Nextel uses proportional diversion, based on market shares, to approximate diversion ratios.2 These calculations implicitly assume that the marginal consumers who stop purchasing from AT&T or T-Mobile after a price increase will be reallocated to the other firms in the market in proportion to the other firms’ market shares. The diversion ratios are adjusted using different measures for the recapture rate. This rate will measure the percentage of lost customers who switch to a competing firm rather than exit the market altogether. In this article, I examine the use of pro-rata market shares as a proxy for diversion ratios. I show that their use can call into question the results of unilateral effects analysis in merger cases.
The 2010 Horizontal Merger Guidelines outline a methodology for evaluating the unilateral effects of a merger.3 In this analysis, the ratio of sales diverted from one product of a merging firm to a product of the other merging firm (the diversion ratio) is used to calculate the value of diverted sales. The value of diverted sales is the product of the diversion ratio and the per unit margin for the product that the sales are diverted to. The Guidelines say that if the value of diverted sales is small enough, then significant unilateral price effects are unlikely.4 The value of diverted sales is typically scaled by dividing it by the premerger price of the product whose price is being increased in the exercise.5 This resulting measure is typically referred to as the Gross Upward Pricing Pressure Index, or GUPPI.6 If the GUPPI is substantially small, usually
* Senior Consultant, Criterion Economics. Email: [email protected]. 1 Petition to Deny of Sprint Nextel Corporation, In the Matter of Applications of AT&T Inc. and Deutsche Telekom AG
for Consent to Assign or Transfer Control of Licenses and Authorizations, WT Dkt. No. 11-65 (filed with the FCC May 31, 2011).
2 Id. at 76, ¶ 152. 3 U.S. DEP’T OF JUSTICE & FED. TRADE COMM’N, HORIZONTAL MERGER GUIDELINES (Aug. 2010), available at
http://www.justice.gov/atr/public/guidelines/hmg-2010.html. 4 Id. § 6.1. 5 Id. 6 See, e.g., Joseph Farrell & Carl Shapiro, Antitrust Evaluation of Horizontal Mergers: An Economic Alternative to
Market Definition, 10 B.E. J. THEORETICAL ECON.: POLICIES & PERSP. (2010); Serge Moresi, The Use of Upward Pricing Pressure Indices in Merger Analysis, 9 ANTITRUST SOURCE (2010).
2
interpreted to mean less than 0.05, then the merger usually is assumed to not have significant upward pricing pressure.7
GUPPI is a gross measure, and while a sufficiently low value for GUPPI may represent a safe harbor for the merging firms, a high value of GUPPI does not necessarily condemn the attempted merger. The gross upward pricing pressure is then compared to the downward pricing pressure, typically the efficiencies that may result from the merger. If the agencies feel that the downward pricing pressure is sufficient to offset the upward pricing pressure, the merger may be allowed to proceed despite a high value for the GUPPI.
Unilateral effects analysis focuses on the actions of the merging firms, typically not considering the strategic interaction between these firms and their competitors outside the merger. It is useful to the agencies because it does not require market definition, which can be a difficult exercise in industries with differentiated products. Many articles argue about the proper methodology of market definition, and it can often be the most contentious aspect of merger litigation.8 By looking at the incentives for the merging firms to raise or lower price without regard to the structure of the market, unilateral effects analysis allows policy makers to directly assess the impact of the merger on consumer prices without having to define markets.
At the same time, unilateral effects and the calculation of GUPPI require data that may not always be available. Joseph Farrell and Carl Shapiro acknowledge that the calculation of upward pricing pressure may not always be possible given the data needed to carry it out.9 In the Sprint Nextel petition, Sprint did not have access to the data necessary to know the diversion ratios between AT&T and T-Mobile.10
In some settings, the use of proportional market share data as a proxy for diversion ratios can be reasonably accepted in the calculation of upward pricing pressure. Gregory Werden and Luke Froeb and Roy Epstein and Daniel Rubinfeld develop merger calibration models in which market share is an accurate estimate for diversion ratios.11 In the logit and PCAIDS (proportionally calibrated almost ideal demand system) demand models that they use, market shares are proportional to diversion ratios.12 However, Robert Willig warns against using market shares to make inferences on the cross-price elasticities, especially with differentiated products.13 He points out that market share data is not enough to characterize cross elasticities of demand if a nested logit demand model is used.14
Farrell and Shapiro introduce the basic framework for upward pricing pressure analysis.15 Although the framework had existed prior, the authors’ positions at the Federal Trade Commission and the Antitrust Division of the U.S. Department of Justice, respectively, brought more weight to the analysis and foreshadowed its introduction into the Guidelines. Roy Epstein and Daniel Rubinfeld categorize upward pricing pressure as closely related to merger simulation models.16 However, in a reply, Farrell and Shapiro are careful to point out that upward pricing pressure
7 Carl Shapiro, The 2010 Horizontal Merger Guidelines: From Hedgehog to Fox in Forty Years (Working Paper, Sept.
2010), available at http://ssrn.com/abstract=1675210. 8 See, e.g., Malcolm B. Coate & Jeffrey H. Fischer, Critical Loss: Implementing the Hypothetical Monopolist Test, 4
GLOBAL COMPETITION POL’Y MAG. (2008); Malcolm B. Coate & Jeffrey H. Fischer, A Practical Guide to the Hypothetical Monopolist Test for Market Definition, 4 J. COMPETITION L. & ECON. 1031 (2008); Kenneth G. Elzinga & Thomas F. Hogarty, The Problem of Geographic Market Delineation in Antimerger Suits, 18 ANTITRUST BULL. 45 (1973); Barry C. Harris & Joseph J. Simons, Focusing Market Definition: How Much Substitution Is Necessary, 12 RES. L. & ECON. 207 (1989); Kevin M. Murphy & Robert H. Topel, Critical Loss Analysis in the Whole Foods Case, 3 GLOBAL COMPETITION POL’Y MAG. (2008); George J. Stigler & Robert A. Sherwin, The Extent of the Market, 28 J.L. & ECON. 555 (1985).
9 Farrell & Shapiro, supra note 6. 10 Sprint Nextel Corp., Petition to Deny, supra note 1. 11 Gregory J. Werden & Luke M. Froeb, The Effects of Mergers in Differentiated Products Industries: Logit Demand and
Merger Policy, 10 J.L., ECON. & ORG. 407 (1994); Roy J. Epstein & Daniel L. Rubinfeld, Merger Simulation: A Simplified Approach with New Applications, 69 ANTITRUST L.J. 883 (2001).
12 Id. 13 Robert D. Willig, Merger Analysis, Industrial Organization Theory, and Merger Guidelines, 1991 BROOKINGS PAPERS
ON ECON. ACTIVITY: MICROECON. 281 (1991). 14 Id. 15 Farrell & Shapiro, supra note 6. 16 Roy J. Epstein & Daniel L. Rubinfeld, Understanding UPP, 10 B.E. J. THEORETICAL ECON.: POLICIES & PERSP. (2010).
3
analysis is not a form of merger simulation.17 They note that upward pricing pressure analysis does not try to characterize the magnitude of price changes in response to a merger. Instead, it only characterizes the direction of a price change. In addition, they point out that upward pricing pressure analysis requires less data than full merger simulation. They note that market shares, if used in combination with market wide recapture rates, can shed some insight on diversion ratios.18
Lars Mathiesen, Øivind Nilsen, and Lars Sørgard use the example of local grocers in Norway to show the difference between merger simulation using market shares as proxies for diversion ratios and using actual diversion ratios.19 They find that the market share proxies tend to overstate the price increases in merger simulation models.20 In this article, I examine the use of pro-rata market shares as a proxy for diversion ratios. Here, I employ a linear differentiated demand model to show that without an adjustment for recapture rates, the use of market shares as a proxy for diversion ratios overstates the upward pricing pressure that results from a merger. I also show that even when recapture rates are introduced, market share based diversion ratios can both overestimate and underestimate the price effects of a merger if consumers have a nested demand structure or if errors occur in defining the relevant product market.
II. THE USE OF PRO-RATA MARKET SHARE BASED DIVERSION RATIOS A significant advantage of using upward pricing pressure to analyze mergers is that the process sidesteps the need to define markets. Since the introduction of the hypothetical monopolist test (also known as the SSNIP test) in the 1982 Horizontal Merger Guidelines, many articles have been written proposing different methodologies for implementing the test, criticizing existing methodologies, or questioning the underlying value of the test itself.21 When proportional market shares are used to approximate diversion ratios, this advantage disappears. Before the diversion ratios can be calculated, the relevant product market must be defined. There are two problems associated with defining the relevant product market. First, if upward pricing pressure requires market definition as a prior step, this greatly increases the data necessary to calculate the unilateral effects of a merger. With the need to define markets, unilateral effects analysis requires the same, if not more, data as coordinated effects. Nonetheless, unilateral effects analysis has benefits beyond only needing limited data input. Specifically, unilateral effects analysis addresses post-merger changes in prices much more directly than coordinated effects analysis. The post-merger price changes are directly related to post-merger changes in consumer welfare, more so than changes in market concentration. Even if unilateral effects analysis requires more data than expected to calculate, it still has an important role in determining the welfare impact of a merger.
The second problem with defining markets prior to calculating unilateral effects is that the most common method for defining a relevant product market, the hypothetical monopolist test, is difficult to implement and subject to errors. Later in this article, I will show how errors in defining the relevant product market prior to the calculation of market share based diversion ratios bias the diversion ratios and distort the expected post-merger price changes.
Even without the two above problems, the use of market share based diversion ratios can have serious shortcomings. While some models of merger simulation are consistent with diversion 17 Joseph Farrell &Carl Shapiro, Upward Pricing Pressure in Horizontal Merger Analysis: Reply to Epstein and Rubinfeld,
10 B.E. J. THEORETICAL ECON.: POLICIES & PERSP. (2010). 18 See also Richard Schmalensee, Should New Merger Guidelines Give UPP Market Definition?, 12 COMPETITION POL’Y
INT’L ANTITRUST CHRON. (2009) (supporting the use of UPP in merger analysis and suggesting an improvement in the calculation).
19 Lars Mathiesen, Øivind Anti Nilsen & Lars Sørgard, Merger Simulations with Observed Diversion Ratios, 31 INT’L REV. L. & ECON. 83 (2011).
20 Id. 21 See, e.g., Murphy & Topel, supra note 8; Andrew Vassallo, A Critical Analysis of the Hypothetical Monopolist Test
(Working Paper, Oct. 2011), available at http://econweb.rutgers.edu/avassallo/HMT.pdf; Gregory J. Werden, The 1982 Merger Guidelines and the Ascent of the Hypothetic Monopolist Paradigm, 71 ANTITRUST L.J. 253 (2003). See also Gregory J. Werden, A Robust Test for Consumer Welfare Enhancing Mergers Among Sellers of Differentiated Products, 44 J. INDUS. ECON. 409 (1996); Gregory J. Werden, Simulating the Effects of Differentiated Products Mergers: A Practical Alternative to Structural Merger Policy, 5 GEO. MASON L. REV. 363 (1997) (proposing simulation-based alternatives to market definition).
4
ratios being proportional to market shares, in general this will not be the case. With differentiated products, it is highly unlikely that proportional market shares and diversion ratios will be equivalent. To address the shortcomings of pro-rata market share based diversion ratios and give an example of the effect of these shortcomings, consider the following linear differentiated demand model. I use this model elsewhere to show how the hypothetical monopolist test underestimates the relevant product market.22 Here, I will use this model to characterize price increases of mergers and later to demonstrate the impact of errors in market definition on estimated diversion ratios. III. MODEL Consider an industry with n identical products. For each product, the firm that produces the product has constant average and marginal cost of production, c. Demand is characterized by the linear differentiated model where the inverse demand for product j is given by
Pj (x1, x2,..., xn ) = a− bjx j − djixii≠ j∑ .
Here, xi is the output of firm i and dji is a measure of the substitutability between products j and i. In order to construct the clearest illustration, assume that the products are symmetric, that is bi = b and dji = d for all products. Thus, all products are equal substitutes for all other products. When b = d, the products are homogeneous because the price will depend only on the total output of all firms. Here, assume that b > d, assuring that the products are differentiated. The products are substitutes for one another because the last term of the inverse demand function ensures that the willingness to pay for a particular product decreases as the consumption of other products increases.
With symmetry, the demand function for product j will be
])1()[(
])2([)(),...,,( 21 dnbdb
pdpdnbadbpppx ij ijnj −+−
+−+−−=
∑ ≠ .
In the Appendix, the equilibrium is calculated where the producers of m products jointly maximize profits. If m is the number of products produced by the merging firms, then this equilibrium will characterize post-merger prices. Assume that each non-merging firm produces a single product. If non-merging firms produce multiple products, then the analysis will remain similar, with two or more sets of products being priced to maximize joint profit over those products. Let pr be the price charged by merging firms for each of their products and let pn be the price charged for all products outside the merger. In equilibrium, prices are given by:
The products in this market are symmetric, so the premerger market share of each product is equal to . A proportional market share based diversion ratio (MSDR) from product i to product j is equal to:
The actual diversion ratio (DR) is equal to:
The two diversion ratios are equal if and only if b = d. If b = d, then the products are homogeneous, and a merger will not allow the post-merger firm to increase the price of either of the merged products. With symmetry, all products will have an equal pre-merger price, p, and have equal price-cost margins. So, if i and j are the products of the merging firms, the GUPPI for the merging products is equal to:
Carl Shapiro calculates the relationship between GUPPI and unilateral price increases.23 With symmetric products and linear demand, the price increase due to the unilateral effects of the merger is equal to:
The term p* denotes the post-merger price that results from the unilateral effects of the merger. The term p* will be less than pr because the unilateral effects of the merger do not include the strategic interaction between the merging firms and the firms outside the merger. In a Bertrand price setting model, prices are strategic compliments. If the producer of one product raises its price, other firms will respond by increasing the prices of their own products. The merging firms will include this price reaction in their price setting decisions, so the post-merger price will be higher than the price predicted purely by the unilateral effects.
To illustrate the difference between the unilateral price effect predicted by the actual diversion ratio, the unilateral price effect predicted by the market share based diversion ratio, and the actual price increase, consider the following example. Let a = 50, b = 3, c = 10, and d = 1. Let GUPPI represent the actual GUPPI based on the full data, and MSGUPPI represent the GUPPI based only
23 Carl Shapiro, Unilateral Effects Calculations (Oct. 2010), available at
http://faculty.haas.berkeley.edu/shapiro/unilateral.pdf; see also Jerry Hausman, Serge Moresi & Mark Rainey, Unilateral Effects of Mergers with General Linear Demand, 111 ECON. LETTERS 119 (2010).
6
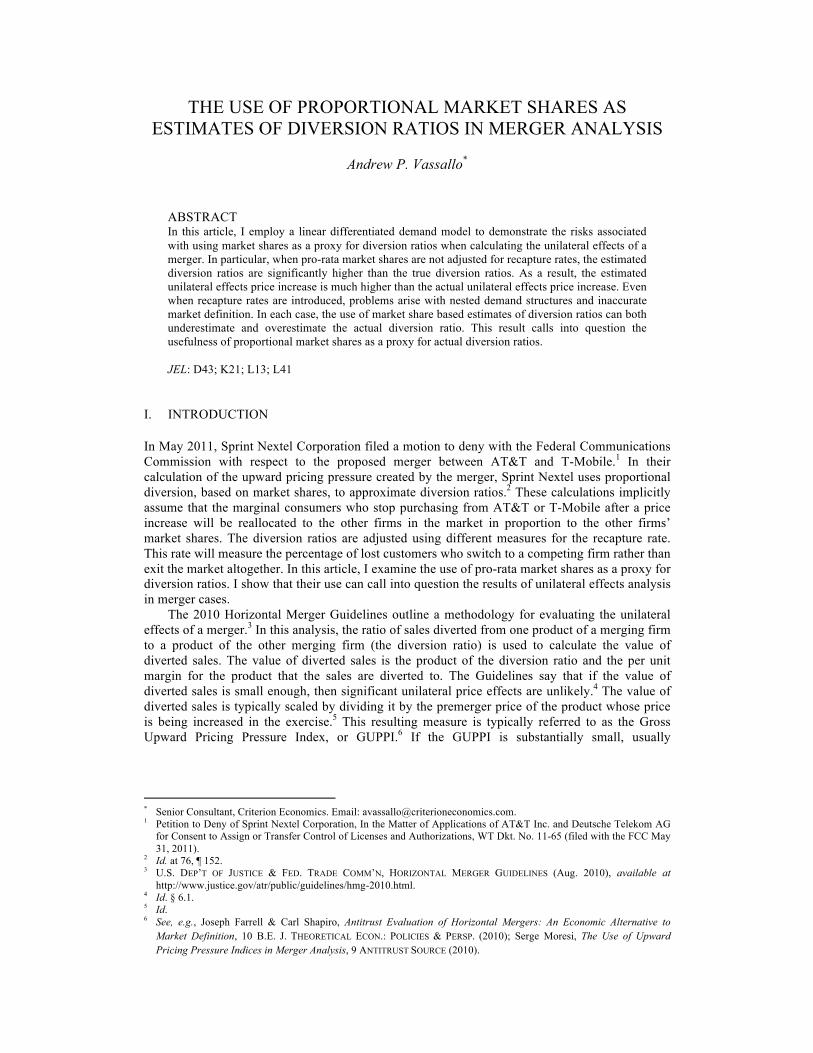
on pro-rata market share diversion ratios. Also, let UEG denote the unilateral effects price increase using the actual diversion ratios and UEMS denote the unilateral effects price increase using market share based diversion ratios. Table 1 shows the diversion ratios, GUPPIs, and unilateral effects of a merger using both the actual data produced by the model and data based on pro-rata market shares.
Table 1. Diversion ratios, GUPPIs, and unilateral effects price increases using market shares and actual data
Market Size and Prices Using Actual Data Using MS based DR Unilateral Effects Price Increase
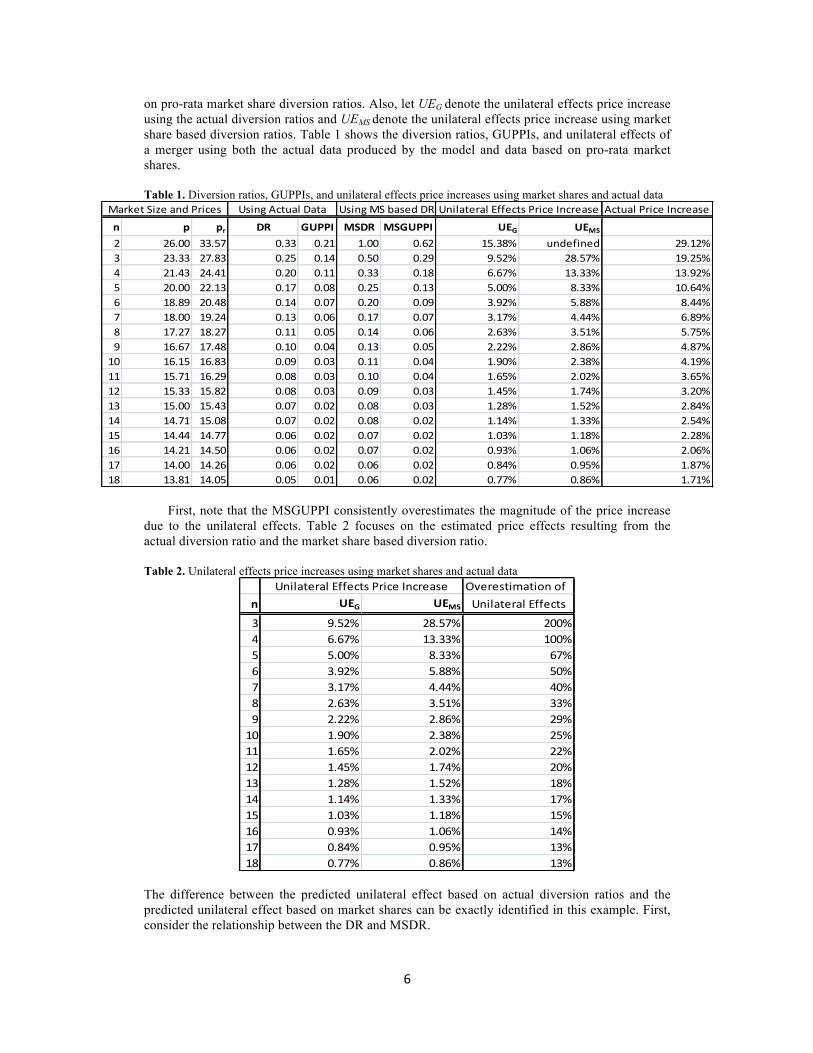
First, note that the MSGUPPI consistently overestimates the magnitude of the price increase
due to the unilateral effects. Table 2 focuses on the estimated price effects resulting from the actual diversion ratio and the market share based diversion ratio.
Table 2. Unilateral effects price increases using market shares and actual data
The difference between the predicted unilateral effect based on actual diversion ratios and the predicted unilateral effect based on market shares can be exactly identified in this example. First, consider the relationship between the DR and MSDR.
7
Then the difference between the two measures is:
Dividing by DR, in order to characterize the increase in the diversion ratio as a percentage of the original DR, we obtain:
In this example, with b = 3 and d = 1, this increase becomes:
The increase in the diversion ratio that results from using pro-rata market share rather than the true market share is very large with small values of n. For n = 3, the MSDR is double the actual DR. Even for a larger market, there is still a significant difference. For a market with 10 firms, the MSDR will be 22 percent greater than the actual DR.
To translate the difference in diversion ratios into differences in unilateral effects, let γ denote the premerger price-cost markup. Because the premerger markup is the same without regard to the diversion ratios, we can use γ as a place-holder without having to include the cumbersome expression for pre-merger price in the equations. Then:
Using the formula for the unilateral effects price increase, we obtain:
Calculating the difference and normalizing by the actual unilateral effects, the margin between the market share based unilateral effect and the actual unilateral effect is:
With b = 3 and d = 1, this margin is equal to:
8
These markups are the values reported in the third column of Table 2. As with the diversion ratios, for small values of n, the unilateral effects of the merger are greatly overstated when market shares are used instead of actual diversion ratios. Now the overstatement is even greater, compared to the overstatement of diversion ratios, with triple the actual unilateral effect for n = 3 and a 25 percent overstatement for n = 10.
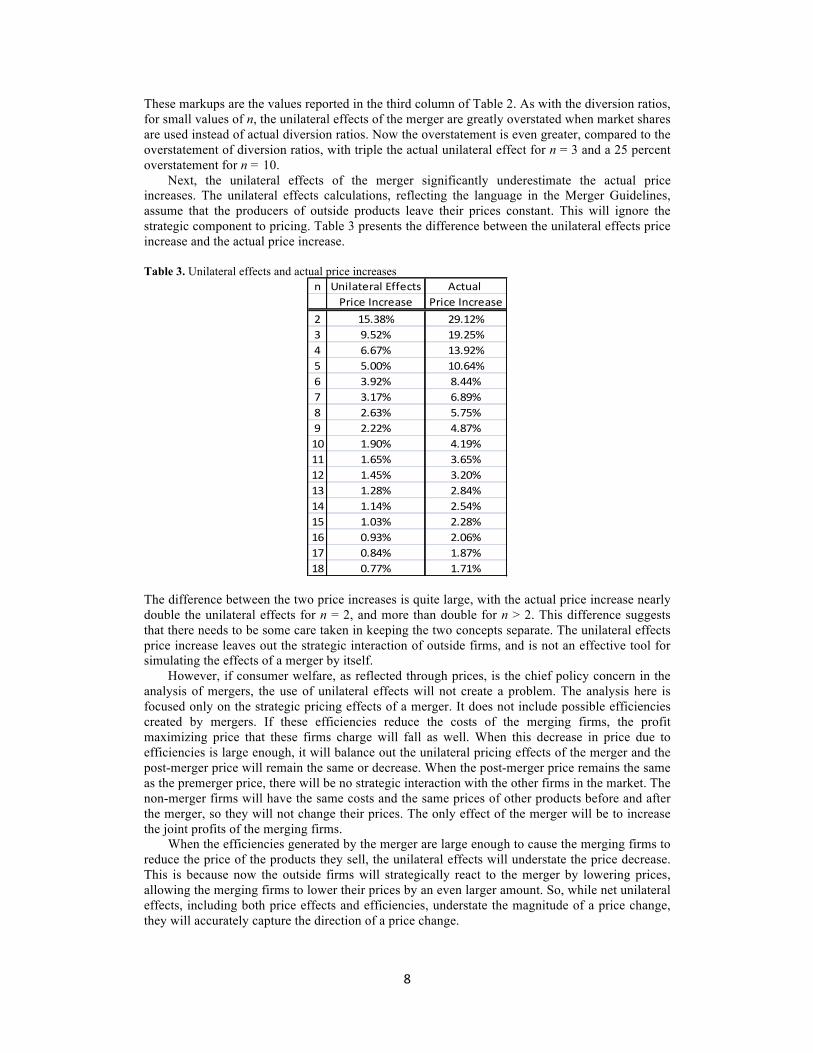
Next, the unilateral effects of the merger significantly underestimate the actual price increases. The unilateral effects calculations, reflecting the language in the Merger Guidelines, assume that the producers of outside products leave their prices constant. This will ignore the strategic component to pricing. Table 3 presents the difference between the unilateral effects price increase and the actual price increase.
Table 3. Unilateral effects and actual price increases
n Unilateral Effects Actual Price Increase Price Increase
The difference between the two price increases is quite large, with the actual price increase nearly double the unilateral effects for n = 2, and more than double for n > 2. This difference suggests that there needs to be some care taken in keeping the two concepts separate. The unilateral effects price increase leaves out the strategic interaction of outside firms, and is not an effective tool for simulating the effects of a merger by itself.
However, if consumer welfare, as reflected through prices, is the chief policy concern in the analysis of mergers, the use of unilateral effects will not create a problem. The analysis here is focused only on the strategic pricing effects of a merger. It does not include possible efficiencies created by mergers. If these efficiencies reduce the costs of the merging firms, the profit maximizing price that these firms charge will fall as well. When this decrease in price due to efficiencies is large enough, it will balance out the unilateral pricing effects of the merger and the post-merger price will remain the same or decrease. When the post-merger price remains the same as the premerger price, there will be no strategic interaction with the other firms in the market. The non-merger firms will have the same costs and the same prices of other products before and after the merger, so they will not change their prices. The only effect of the merger will be to increase the joint profits of the merging firms.
When the efficiencies generated by the merger are large enough to cause the merging firms to reduce the price of the products they sell, the unilateral effects will understate the price decrease. This is because now the outside firms will strategically react to the merger by lowering prices, allowing the merging firms to lower their prices by an even larger amount. So, while net unilateral effects, including both price effects and efficiencies, understate the magnitude of a price change, they will accurately capture the direction of a price change.
9
Assume that the primary metric for evaluating whether a merger should be allowed or challenged is the price of the products being sold. Then, unilateral effects plus efficiencies will be an effective tool for evaluating mergers despite not including strategic interaction with outside firms. When the unilateral effects (net of efficiencies) are positive, the price of the products of the merging firms, along with the prices of outside products, will increase. When the net unilateral effects are negative, the prices of all goods will fall. Finally, if the net unilateral effect is to hold price constant, the prices of all goods will remain constant. So the impact of unilateral effects understating actual price changes is minimal.
Returning to the difference between using DR and using MSDR to calculate unilateral effects, the primary difference in this model is that MSDR implicitly assumes a recapture rate of 100 percent for the lost sales of the merging product after a price increase. That is, MSDR assumes that if the price of a product is increased all of the lost sales of that product are transferred to substitute products. However, in a differentiated product setting, this will never be the case. As long as the producer of the product in question has some market power (defined as the ability to increase price without losing all of the sales of the product), then the recapture rate will be less than 100 percent.
In the linear differentiated example, the recapture rate will only be equal to 100 percent when b = d. For any value of b greater than d, the recapture rate will be lower. The lower recapture rate reflects that when the price of a differentiated good is increased, some of the lost consumers will not shift their consumption to a substitute product. For these consumers, the opportunity cost of consuming the product in question is less than the utility of that particular good, but greater than the utility of outside goods at premerger prices. When the price of their preferred product is increased, the opportunity cost of consuming it will increase until the consumers do not prefer to purchase and consume the product. When this happens, their opportunity costs and utilities associated with outside products will not necessarily change. So, they will not switch to a substitute product. They will simply stop consuming products from this market altogether.
In the only case where the recapture rate is 100 percent, b = d. However, in this case, the products are homogeneous. In the homogeneous case, the merging firms cannot increase price without losing all of the sales of their products. As such, any merger analysis is trivial. The merging firms will not be able to increase price and will only merge if the merger reduces costs. If two firms in a market for a homogeneous product decide to merge, then the merger cannot have a negative short-run impact on consumer welfare. The only scenario where the merger could have a negative long-run impact would be if the efficiencies created by the merger are large enough to allow the merged firm to reduce price enough to drive other firms from the market and charge monopoly prices in the long run. This is a special case of the linear differentiated demand model, and I will now turn back to the scenario where products are heterogeneous and the recapture rate is less than 100 percent.
With linear differentiated demand, the recapture rate will be a function of the ratio of b to d. Assume that b = x·d. Then the recapture rate is equal to:
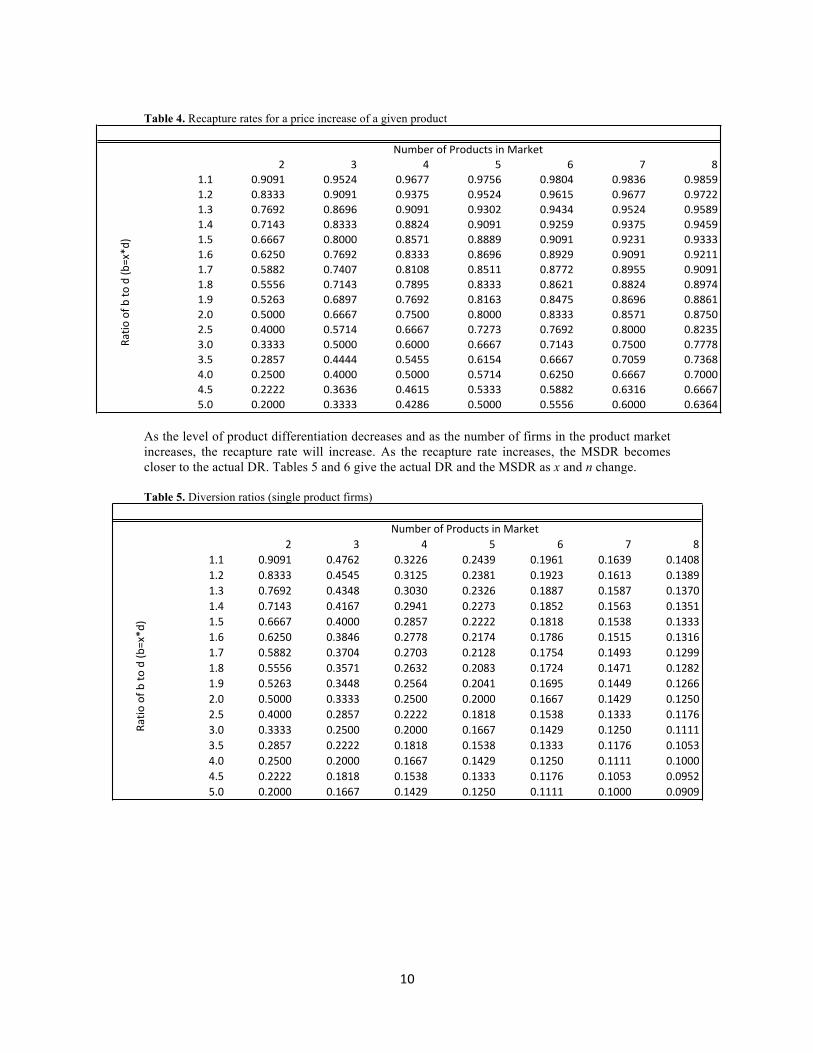
This rate is equal to the diversion ratio multiplied by the number of firms that demand can be diverted to. For various values of x and n, Table 4 gives the recapture rate for a price increase of a given product.
10
Table 4. Recapture rates for a price increase of a given product
As the level of product differentiation decreases and as the number of firms in the product market increases, the recapture rate will increase. As the recapture rate increases, the MSDR becomes closer to the actual DR. Tables 5 and 6 give the actual DR and the MSDR as x and n change. Table 5. Diversion ratios (single product firms)
With lower recapture rates, the MSDR are less accurate. As the number of firms falls or the degree of product differentiation increases, the MSDR perform worse as a proxy for the actual DR. In the symmetric model, the actual DR are equal to the MSDR multiplied by the recapture rate. This relationship allows for a little bit of freedom in the data requirements for calculating diversion ratios and unilateral effects. It could be the case that data about consumer decisions is not detailed enough to appropriately calculate diversion ratios. However, less data would be needed to calculate recapture rates than diversion ratios. If market share data is accurate, then the product of pro-rata market shares and the recapture rate can be a reasonable proxy to diversion ratios. There are two potential problems with using pro-rata market shares in combination with recapture rates as a proxy for actual diversion ratios. First, this method depends on an accurate definition of the relevant product market. Second, this method is heavily dependent upon symmetry in the demand functions. In the next two parts of this article, I will examine the accuracy of market share based diversion ratios with asymmetric demand and with errors in market definition. IV. ASYMMETRIC DEMAND Now, consider the case of 4 firms producing a single product each. Demand is structured as before:
∑≠
−−=ji
ijijjnj xdxbaxxxP .),...,,( 21
Instead of fully symmetric demand, assume now that d12 = d21 = d34 = d43 = 1.5d13 = 1.5d14 =
1.5d23 = 1.5d24 = 1.5d31 = 1.5d32 = 1.5d41 = 1.5d42. Now products 1 and 2 are closer substitutes for
each other than for products 3 and 4. Likewise, products 3 and 4 are closer substitutes for each
other than for products 1 and 2. Assume the d’s for two products from separate groups (such as
product 1 and product 3) are equal to 1. Then the d’s for products within the same group will be
12
equal to 1.5. In this situation, market share based diversion ratios can both overstate and
understate the unilateral effects of a merger.24
Consider the case where a = 100, b = 2, and c = 10 for each firm. The d’s are defined as in the
previous paragraph. In a Nash equilibrium, each firm sets its price equal to $21.74. Each firm also
has a market share of 25 percent. The MSDR between any two products will be equal to 1/3. If the
MSDR is adjusted using the recapture rate of 85 percent, then the adjusted MSDR = 0.2823.
Suppose firm 1 and firm 2 merge. The actual diversion ratio here is 0.65. So, with products 1
and 2 within the same demand group, the MSDR significantly underestimates the actual DR.
When the MSDR is scaled using the recapture rate, the understatement is only exacerbated.
Calculating the GUPPI, the actual value is 0.3510, which predicts a unilateral effects price
increase of 50.14 percent. For the MSGUPPI, the value is 0.1800, which predicts the unilateral
effects price increase of 13.50 percent. After the merger, the actual price increase will be 52.35
percent.
Repeating the exercise, but with a now equal to 50, the results are similar. The DR and the
MSDR will remain the same, 0.65 and 0.33 respectively. The actual GUPPI is 0.2226, which
indicates a unilateral effects price increase of 31.80 percent. MSGUPPI is 0.1141, which predicts a
unilateral effects price increase of 8.55 percent. The actual price increase will be 33.27 percent for
products 1 and 2.
Compared to the symmetric case, the unilateral effect is closer to the total price increase. This
is because consumers do not associate the products of the non-merging parties with the products of
the merged firms as closely as they associate the merged products with each other. The demand
for products 3 and 4 are less responsive to changes in the prices of products 1 and 2 relative to the
symmetric case. Then, firms 3 and 4 do not have an incentive to respond as strongly as a firm in
the symmetric case when the prices of products 1 and 2 increase following a merger.
In this example, the equilibrium is symmetric in prices and quantities, so it hides the fact that
products 1 and 2 and products 3 and 4 are grouped together by consumers. Using equilibrium
market shares as a proxy for the diversion ratio will underestimate the GUPPI and the unilateral
effects when two firms within the same group merge. Conversely, when two firms from separate
groups merge, the MSDR greatly overestimates the GUPPI and the unilateral effects. With the
grouped demand structure, the MSDR continues to inaccurately estimate the DR even when the
24 With the four products, the demand function for product i is:
.
Here products i and j are within the same group and products k1 and k2 are in the other group. The denominator is suppressed as it will not enter into the profit maximization decision. In a four firm equilibrium, with dik normalized to 1, the price for each product will be:
13
pre-merger equilibrium is asymmetric. In addition, with an asymmetric pre-merger equilibrium,
the MSDR can both understate and overstate the actual DR.
Assume that a = 100, b = 2, c1 = c2 = 10 and c3 = c4 = 12. The d’s remain as previously
defined. With the cost asymmetry, firms 3 and 4 will set a higher equilibrium prices for their
products and will have a smaller market share than firms 1 and 2 in the premerger Nash
equilibrium. In equilibrium, firms 1 and 2 sell their products for a price of $15.44 and have an
output level of 6.60. Firms 3 and 4 sell their products for a price of $16.73 and have an output
level of 5.74.
Assume firms 1 and 2 merge. For the diversion from product 1 to product 2 and vice versa,
MSDR will be equal to 0.37. This will lead to an MSGUPPI of 0.1286, which predicts a unilateral
effect price increase of 10.21 percent. The actual DR is 0.65, which produces a GUPPI of 0.2290.
The unilateral effects of the merger result in a price increase of 32.71 percent. The actual price
increase is 34.20 percent. So, even with the asymmetry to help identify a difference between
products 1 and 2 and products 3 and 4, the MSDR did not improve significantly. In this situation,
using market shares understates the unilateral effects of the merger. However, with a grouped
demand structure, the use of market shares as a proxy for diversion ratios can overstate the
unilateral effects as well.
Consider a model parameterized exactly as the preceding model, except that consumers have
a lower willingness to pay for products 3 and 4. Before, products 3 and 4 had higher cost of
production, but consumers valued consumption of all four goods equivalently. Now let a = 50 for
products 1 and 2 and let a = 35 for products 3 and 4. In the premerger equilibrium, firms 1 and 2
will set price equal to $17.12 and have output levels of 8.64 units. Firms 3 and 4 will sell their
products for $13.09 and each will have an output level of 1.32.
Suppose firm 1 and firm 2 merge. After the merger, they will sell their products at a price of
$24.03, an increase of 40.36 percent. The diversion ratio between products 1 and 2 is 0.65. The
GUPPI of the merger is 0.2703, predicting a unilateral effects price increase of 38.61 percent.
However, because the market shares of products 3 and 4 are so low, the MSDR between products
1 and 2 is 0.77. Now the MSGUPPI is 0.3186. This predicts a unilateral effects price increase of
69.26 percent. So, in this case the use of pro-rata market shares in place of actual diversion ratios
will overstate the unilateral effects of the merger.
Because market shares do not capture whether or not consumers group certain products
together, the use of market share based diversion ratios can either understate or overstate the
unilateral effects of a merger. Even if market share based diversion ratios can be adjusted using
the recapture rate, this problem will continue to persist with nested demand models. While
simulation models can easily adjust for a nested demand structure, a real world investigator of a
proposed merger will never have as much information as the designer of a merger simulation
model.
14
V. ERRORS IN MARKET DEFINITION
Even if market shares can be adjusted to exactly measure diversion ratios, their use still faces a
significant hurdle. Before market shares can be calculated, the relevant product market must be
defined. I have shown that in a linear differentiated demand model, the Hypothetical Monopolist
test consistently captures less than the full set of products in a clearly defined market.25 Returning
to the symmetric model, with equilibrium calculated in the appendix, there are only two
possibilities for what the actual product market could be. In the first case, if d = 0, then each
product would be its own market and each firm would be a monopolist over that product. In this
setting, horizontal merger analysis is irrelevant because the merging firms would not compete with
one another.
In the second case, the product market must include all n products. If the product market were
to include any number of substitutes greater than one and less than n, then it would consist of an
arbitrary subset of the n products. Any number of firms could be swapped in or out of the product
market without changing the market definition calculations. As long as d > 0, the only logical
product market is the market including all n products. Yet, when properly applied to this model,
the Hypothetical Monopolist Test will consistently define a product market with less than n
products. Even if the market share based diversion ratios are accurately adjusted by the recapture
rates for the product market, if the product market is incorrect, the MSDR will be incorrect as
well.
Unadjusted MSDR will overstate the amount of lost sales of a given product that will be
captured by competing products. When not all relevant products are included in the product
market, the market shares for the included products will be higher than their true value and the
overstatement will be greater. In the correct product market for the symmetric case, when the
MSDR are multiplied by the recapture rate, the actual DR results. However, even with correct
market shares this will present a problem. Recapture rates fall as the number of products in the
market falls. If the market is defined overly narrowly, then the recapture rates will be too low and
the adjusted MSDR will also be too low. To some degree the two problems will offset each other.
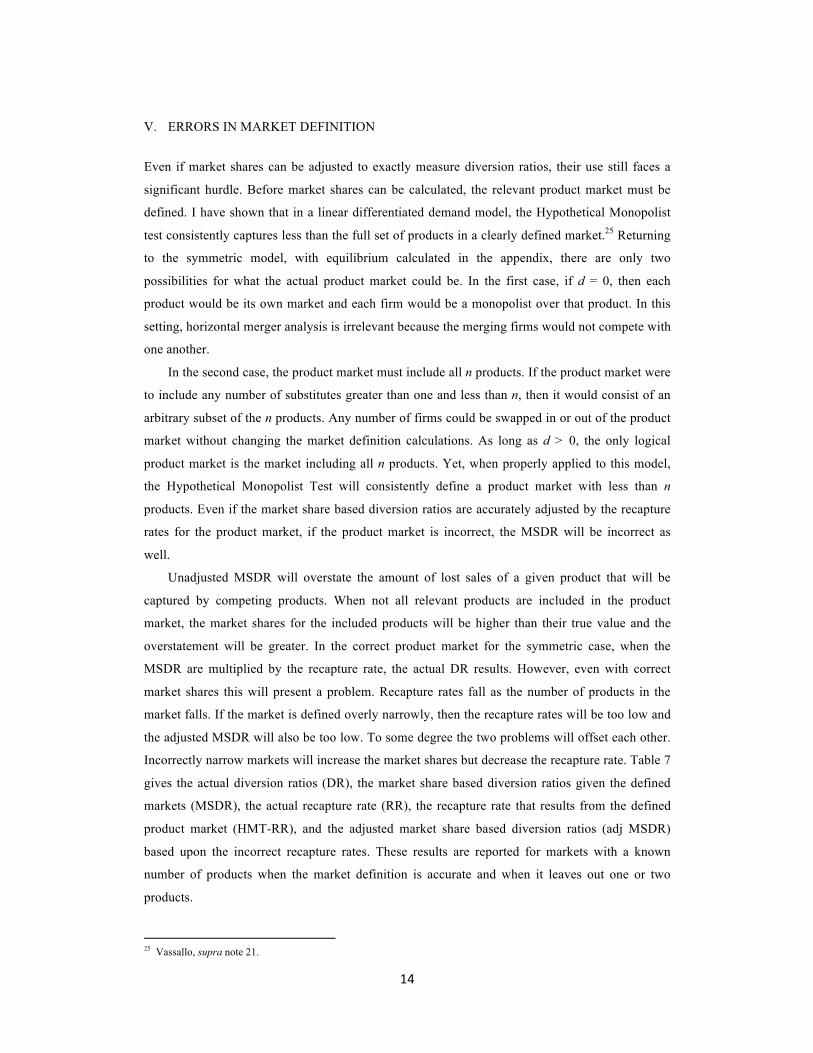
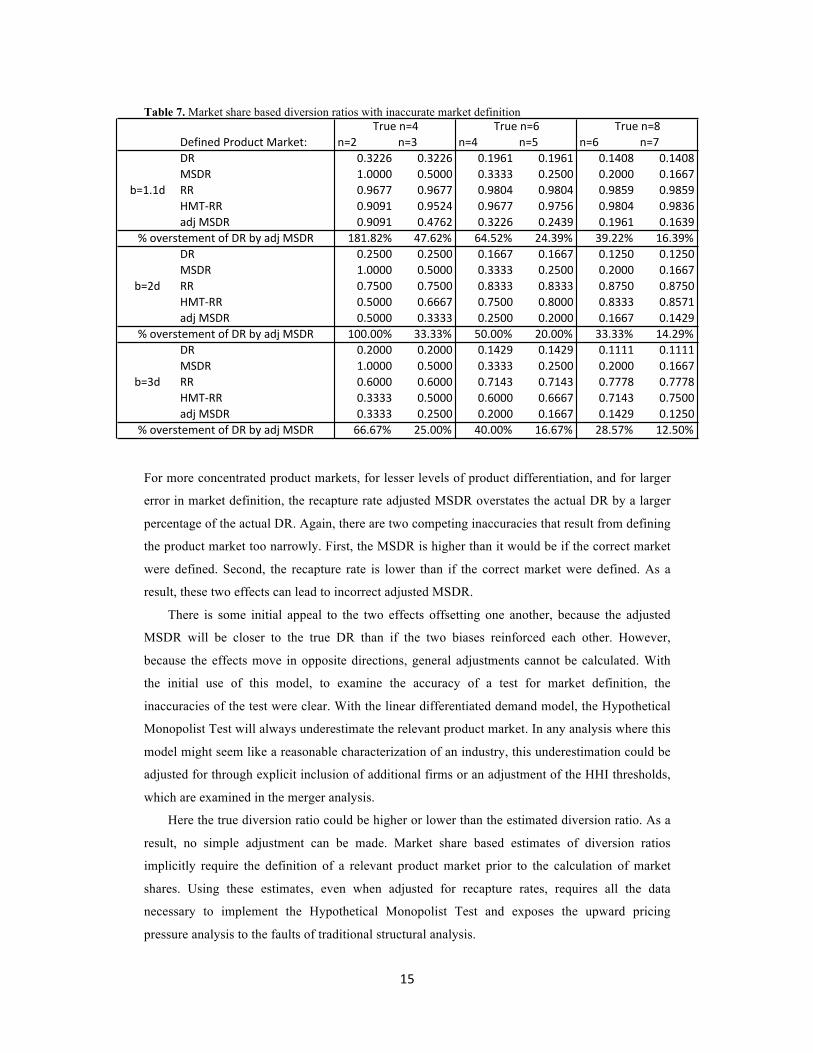
Incorrectly narrow markets will increase the market shares but decrease the recapture rate. Table 7
gives the actual diversion ratios (DR), the market share based diversion ratios given the defined
markets (MSDR), the actual recapture rate (RR), the recapture rate that results from the defined
product market (HMT-RR), and the adjusted market share based diversion ratios (adj MSDR)
based upon the incorrect recapture rates. These results are reported for markets with a known
number of products when the market definition is accurate and when it leaves out one or two
products.
25 Vassallo, supra note 21.
15
Table 7. Market share based diversion ratios with inaccurate market definition
For more concentrated product markets, for lesser levels of product differentiation, and for larger
error in market definition, the recapture rate adjusted MSDR overstates the actual DR by a larger
percentage of the actual DR. Again, there are two competing inaccuracies that result from defining
the product market too narrowly. First, the MSDR is higher than it would be if the correct market
were defined. Second, the recapture rate is lower than if the correct market were defined. As a
result, these two effects can lead to incorrect adjusted MSDR.
There is some initial appeal to the two effects offsetting one another, because the adjusted
MSDR will be closer to the true DR than if the two biases reinforced each other. However,
because the effects move in opposite directions, general adjustments cannot be calculated. With
the initial use of this model, to examine the accuracy of a test for market definition, the
inaccuracies of the test were clear. With the linear differentiated demand model, the Hypothetical
Monopolist Test will always underestimate the relevant product market. In any analysis where this
model might seem like a reasonable characterization of an industry, this underestimation could be
adjusted for through explicit inclusion of additional firms or an adjustment of the HHI thresholds,
which are examined in the merger analysis.
Here the true diversion ratio could be higher or lower than the estimated diversion ratio. As a
result, no simple adjustment can be made. Market share based estimates of diversion ratios
implicitly require the definition of a relevant product market prior to the calculation of market
shares. Using these estimates, even when adjusted for recapture rates, requires all the data
necessary to implement the Hypothetical Monopolist Test and exposes the upward pricing
pressure analysis to the faults of traditional structural analysis.
16
VI. CONCLUSION The use of pro-rata market shares in the place of diversion ratios in unilateral effects analysis of
mergers has two primary problems. First, even when adjusted for recapture rates, pro-rata market
shares do not contain enough information to allow for the treatment of nested demand. This
shortcoming can lead to the overestimation or underestimation of unilateral price effects when the
merging products are within the same demand nest.
Second, the use of pro-rata market shares requires product market definition before market
shares can be calculated. This requires significantly more data to calculate and subjects the
analysis to all of the errors that can occur in the market definition process. Incorrectly defined
markets (those which do not include all of the relevant products) will lead to the overestimation of
the unilateral effects of a merger if no adjustment for recapture rates is made. In addition, overly
narrow product markets will bias downward the recapture rates, and if an adjustment is made
based on the estimated product market, the resulting unilateral price effects may be higher or
lower than the actual price effects.
The issues surrounding pro-rata market shares as a proxy for diversion ratios can lead to type
I and type II errors in merger analysis. If the diversion ratios are incorrectly high, a procompetitive
merger could be found anticompetitive and prevented from proceeding. If the diversions ratios are
incorrectly low, an anticompetitive merger may be allowed to proceed. Both of these errors
impose a cost on economic efficiency. Prohibiting a procompetitive merger can prevent an
industry from becoming more efficient and increase long run prices for consumers. Allowing an
anticompetitive merger can stifle future competition in a market and increase long run prices for
consumers.
In addition, the uncertainty regarding unilateral effects generated by the potential errors from
using pro-rata market shares will increase the uncertainty about the ultimate outcome of any
proposed merger. This will increase the transactions costs associated with a potential merger and
have the effect of chilling merger activity. Because mergers require approval by the agencies or
the courts, firms are likely to propose a merger only if they have a reasonable belief that it will be
allowed to continue. As such, in most mergers it will be the case that the merging parties, those
individuals with the most information about the industry in which they compete, believe that the
potential efficiencies generated by the merger are significant enough to appear to balance out any
anticompetitive effects. Otherwise, the probability that the merger would be stopped by the
government would make the transactions costs associated with the proposed merger too high for
the parties to proceed. If this argument has any merit, then there is a likely selection bias in which
mergers are proposed toward mergers that are procompetitive. Therefore, the potential chilling
effect of ambiguity in the merger review process, which would be generated by frequent use of
17
pro-rata market shares as a proxy for diversion ratios, will likely have a negative impact on
economic efficiency and consumer prices.
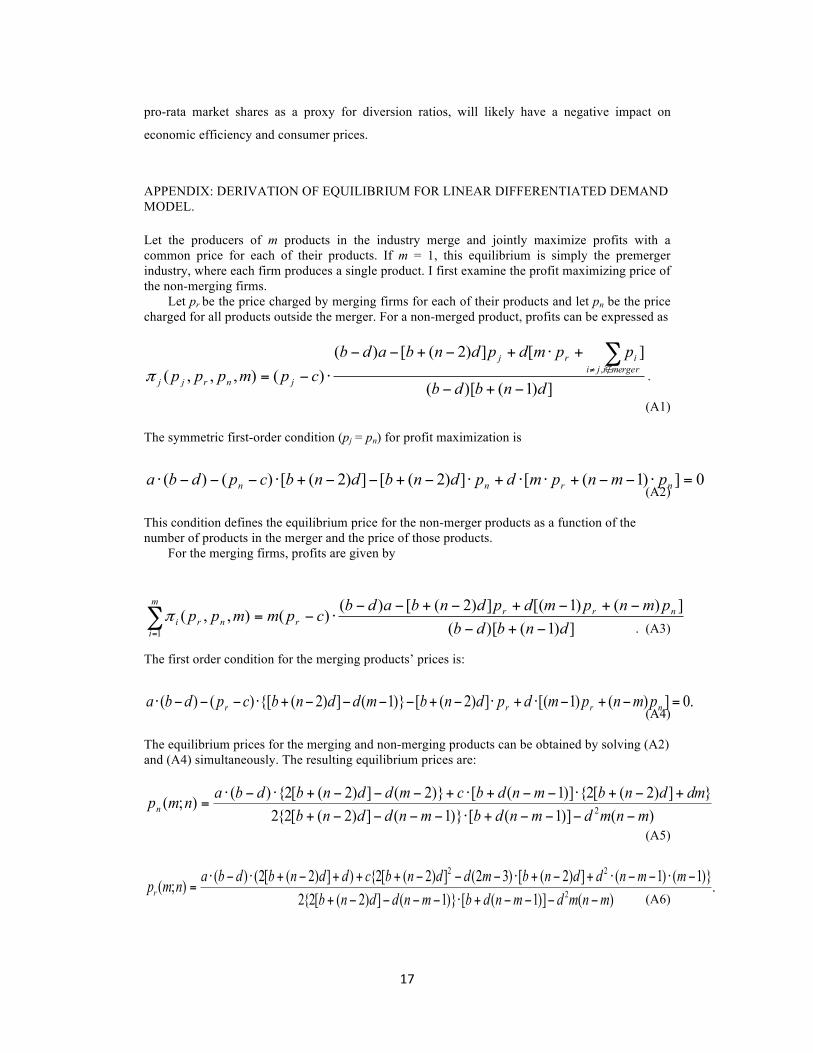
APPENDIX: DERIVATION OF EQUILIBRIUM FOR LINEAR DIFFERENTIATED DEMAND MODEL. Let the producers of m products in the industry merge and jointly maximize profits with a common price for each of their products. If m = 1, this equilibrium is simply the premerger industry, where each firm produces a single product. I first examine the profit maximizing price of the non-merging firms.
Let pr be the price charged by merging firms for each of their products and let pn be the price charged for all products outside the merger. For a non-merged product, profits can be expressed as
])1()[(
][])2([)()(),,,( ,
dnbdb
ppmdpdnbadbcpmppp mergeriji
irj
jnrjj −+−
+⋅+−+−−
⋅−=∑∉≠π .
(A1) The symmetric first-order condition (pj = pn) for profit maximization is
This condition defines the equilibrium price for the non-merger products as a function of the number of products in the merger and the price of those products. For the merging firms, profits are given by
])1()[(])()1[(])2([)(
)(),,(1 dnbdb
pmnpmdpdnbadbcpmmpp nrr
r
m
inri −+−
−+−+−+−−⋅−=∑
=
π. (A3)
The first order condition for the merging products’ prices is:
The equilibrium prices for the merging and non-merging products can be obtained by solving (A2) and (A4) simultaneously. The resulting equilibrium prices are:
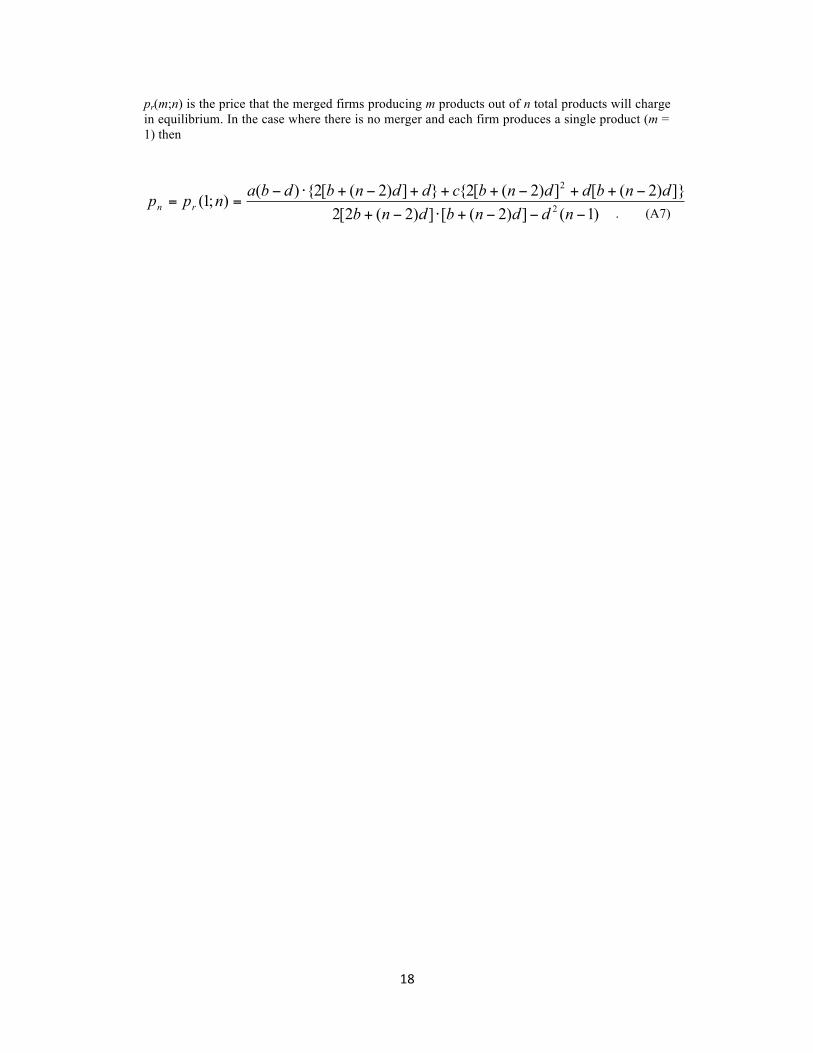
pr(m;n) is the price that the merged firms producing m products out of n total products will charge in equilibrium. In the case where there is no merger and each firm produces a single product (m = 1) then