Germinal Seeds Limited terms and conditions apply. Copies available on request. VoG–2105–UK–001 germinal.com o C n a e G . t s e u q e n r e o l b a l i a s av e i p o . y l p p a s n o iti d n o c d n s m r e t d e t mi i L s d e e S al n mi r e m o .c l na i m r e g 1 0 0 – K 5–U 0 1 2 – G o V germinal.com The Value of Grass A guide to the nutritional composition of grazed and ensiled grass m o c l. a min r e g
Transcript
Germinal Seeds Limited termsand conditions apply.
Copies available on request.
Vo
G–2
105
–U
K–
001
germinal.com
oC
naeG
.tseuqen re olbalias aveipo
.ylpp asnoitidno cdnsmre tdetmii Lsdee Salnmire
mo.clnaimreg
100
–K
5–
U012–
Go
V
germinal.com
The Valueof Grass
A guide to the nutritional composition of grazed and ensiled grass
mocl.aminreg
2 3
ContentsIntroduction:Grass - and the ability to grow it successfully for a large part of theyear – offers UK livestock farming the potential for significantlylower costs.
As grazing or silage, grass is the mainstay for the vast majority offorage-based systems. It is the cheapest source of ruminant feedand the most important factor in modern dairy, beef and sheepfarming profitability.
To take full advantage of grass, however, livestock farmers need to maintain sward quality and productivity, and manage intakesthrough effective grazing and winter feeding strategies. It is alsovital to have a good understanding of the nutritional qualities ofgrass. If the full feed value of grass is not known, there is everychance it will either be under-utilised or inaccuratelysupplemented – its full potential lost.
In this guide we aim to help livestock farmers gain a betterunderstanding of the nutritional composition of grass. We provide simple definitions and highlight the importance ofdifferent components for maximum livestock performance. We also provide pointers on how to attain the best results.
Whilst effective as a stand-alone crop, grass is also commonlygrown with companion species, so we include references whereapplicable to the nutritional contribution of white and red clover as well as a section on the increasingly popular perennial chicory for grazing.
Paul Billings
Agricultural Director, Germinal
Introduction
Dry matter (DM)
D-value and Metabolisable Energy (ME)
Water soluble carbohydrate
Aber High Sugar Grass
Protein
Fibre
Lipids (oil)
Minerals and vitamins
Puna II perennial chicory
Grazing management
Silage making
Silage analysis
Further information
3
4-5
6-7
8-9
10-13
14-15
16-17
18-19
20
21
22-23
24-25
26
27
THE CLOVER EFFECT
Pointers on Dry matter
Overall dry matter yield from a mixed grazing sward with optimum white clovercontent is broadly compatible with a straight ryegrass sward, assuming averageUK nitrogen fertiliser applications.
When red clover is included in silage leys, only use light conditioning on the mower (e.g. rubber roller or flails fully open).
Red clover content will be higher in later cuts, so a longer wilt is required toachieve comparable dry matter content in the silage.
4 5
Why is dry matter in grass important?
The dry matter (DM) content of forage (measured as apercentage) is the proportion of total components (fibres,proteins, ash, water soluble carbohydrates, lipids, etc)remaining after water has been removed.
Knowing the dry matter percentage of forage is important. Thelower the dry matter content, the higher the freshweight offorage required to achieve a target nutrient intake, whetherthis is grazed grass or conserved forage.
Dry matter is also used as a term to measure yield. Recorded askgDM/ha, this is used as a measure of sward carrying capacity(stocking rate) and is an essential element of effective grazingmanagement. It is also used to measure silage crop yields.
The range of dry matter in grass
In terms of dry matter content, field and weather conditionswill cause significant variation, and there are also inherentdifferences between diploid and tetraploid varieties. All otherfactors being equal, diploids have higher dry matter content(typically 18-26% DM) than tetraploids (15 – 20% DM), due todiploids having smaller cells and a lower cell wall to cellcontents ratio. This means ruminants fed entirely on atetraploid sward will need to consume as much as one-thirdmore fresh grass per day to achieve the same nutritional intakeas from a purely diploid sward.
Looking at dry matter yield, modern ryegrasses have beenbred for maximum production. The best rated perennialryegrass varieties on the Recommended List are now capableof grazing or conservation yields in excess of 11 tDM/ha whilstweed grasses (e.g. creeping bent or annual meadow grass) canyield as little as 2 tDM/ha. Production from ryegrasses over aseason follows the classic growth curve, peaking at around 120kgDM/ha/day in May/June and typically dipping to aroundone-third of peak levels by early autumn.
Making the most of dry matter
In grazing terms, the aim should be to present grazing thatoffers the ideal balance of fresh nutritious growth with theappropriate fibre content for optimal rumen passage. Thisbalance is best achieved by using a grazing rotation of 18-25days in peak season. Poor sward management will increase theproportion of dead and dying plant material, resulting in asignificant decline in forage quality and intake potential.
When making silage, the aim should be to cut at 16-20% drymatter and ensile at 30 – 35% dry matter (for clamp silage) and35 – 40% (baled). This will ensure a good fermentation andoptimum intakes, and minimum risk of aerobic instability.
Comparative grass and clover growth curves
kg/ha/day
Apr May June Jul Aug Sept Oct
120
100
80
60
40
20
0
GrassGrass - clover
Factor in grazing and/or cutting DM yield when selecting the best varieties fromthe Recommended List
Diploids generally aid grazing efficiency whilst tetraploids are typically moresuited to cutting
Consider pre-cutting grazing swards as a means of increasing dry matter intakes
Remember that livestock on wet pasture will require more fresh weight of forageper day
Delaying cutting for silage increases yield but decreases quality
The higher the dry matter of grass, thelower the required intake to provide agiven level of energy.
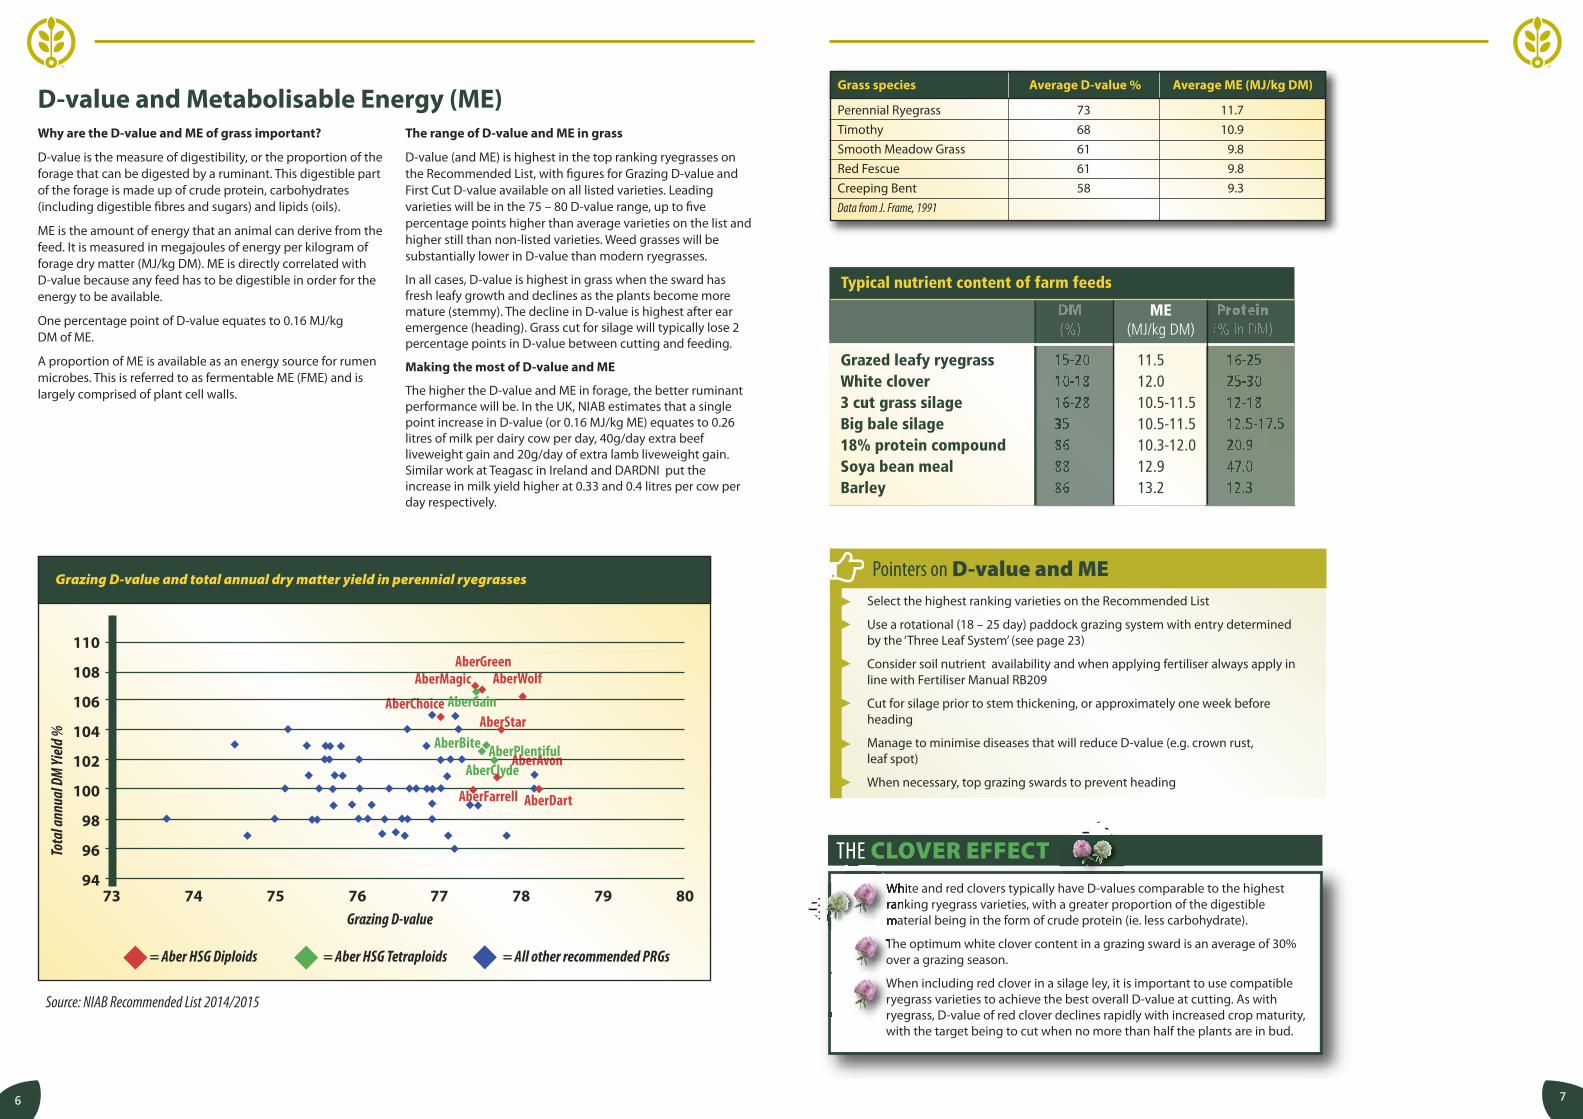
Grazing D-value and total annual dry matter yield in perennial ryegrasses
Grazing D-value73 74 75 76 77 78 79 80
110
108
106
104
102
100
98
96
94
AberBite
AberGreenAberMagic
AberChoiceAberStar
AberAvon
AberDart
AberClyde
AberWolf
Source: NIAB Recommended List 2014/2015
Tota
l ann
ual D
M Yi
eld %
= Aber HSG Diploids = Aber HSG Tetraploids = All other recommended PRGs
6 7
THE CLOVER EFFECT
Pointers on D-value and ME
Why are the D-value and ME of grass important?
D-value is the measure of digestibility, or the proportion of theforage that can be digested by a ruminant. This digestible partof the forage is made up of crude protein, carbohydrates(including digestible fibres and sugars) and lipids (oils).
ME is the amount of energy that an animal can derive from thefeed. It is measured in megajoules of energy per kilogram offorage dry matter (MJ/kg DM). ME is directly correlated with D-value because any feed has to be digestible in order for theenergy to be available.
One percentage point of D-value equates to 0.16 MJ/kg DM of ME.
A proportion of ME is available as an energy source for rumenmicrobes. This is referred to as fermentable ME (FME) and islargely comprised of plant cell walls.
The range of D-value and ME in grass
D-value (and ME) is highest in the top ranking ryegrasses onthe Recommended List, with figures for Grazing D-value andFirst Cut D-value available on all listed varieties. Leadingvarieties will be in the 75 – 80 D-value range, up to fivepercentage points higher than average varieties on the list andhigher still than non-listed varieties. Weed grasses will besubstantially lower in D-value than modern ryegrasses.
In all cases, D-value is highest in grass when the sward hasfresh leafy growth and declines as the plants become moremature (stemmy). The decline in D-value is highest after earemergence (heading). Grass cut for silage will typically lose 2percentage points in D-value between cutting and feeding.
Making the most of D-value and ME
The higher the D-value and ME in forage, the better ruminantperformance will be. In the UK, NIAB estimates that a singlepoint increase in D-value (or 0.16 MJ/kg ME) equates to 0.26litres of milk per dairy cow per day, 40g/day extra beefliveweight gain and 20g/day of extra lamb liveweight gain.Similar work at Teagasc in Ireland and DARDNI put theincrease in milk yield higher at 0.33 and 0.4 litres per cow perday respectively.
Grass species Average D-value % Average ME (MJ/kg DM)
Perennial Ryegrass 73 11.7
Timothy 68 10.9
Smooth Meadow Grass 61 9.8
Red Fescue 61 9.8
Creeping Bent 58 9.3
Data from J. Frame, 1991
Select the highest ranking varieties on the Recommended List
Use a rotational (18 – 25 day) paddock grazing system with entry determinedby the ‘Three Leaf System’ (see page 23)
Consider soil nutrient availability and when applying fertiliser always apply inline with Fertiliser Manual RB209
Cut for silage prior to stem thickening, or approximately one week beforeheading
Manage to minimise diseases that will reduce D-value (e.g. crown rust, leaf spot)
When necessary, top grazing swards to prevent heading
White and red clovers typically have D-values comparable to the highestranking ryegrass varieties, with a greater proportion of the digestiblematerial being in the form of crude protein (ie. less carbohydrate).
The optimum white clover content in a grazing sward is an average of 30%over a grazing season.
When including red clover in a silage ley, it is important to use compatibleryegrass varieties to achieve the best overall D-value at cutting. As withryegrass, D-value of red clover declines rapidly with increased crop maturity,with the target being to cut when no more than half the plants are in bud.
White clover is generally lower in WSC and higher in protein, so it important tomaintain the target of 30% white clover sward content over a grazing season foroptimum performance.
Red clover is generally lower in WSC than ryegrass, so growing it in combinationwith Aber HSG varieties is beneficial for the silage fermentation process.
Aim for a minimum dry matter of 30% when ensiling red clover and ryegrass toincrease the concentration of WSC in the forage.
8 9
Why is water soluble carbohydrate (WSC) in grassimportant?
Water soluble carbohydrates are the soluble sugars that arequickly released from grass within the rumen. These sugarsprovide a readily available source of energy for the rumenmicrobes that are responsible for digesting forage.
These sugars also provide the fuel for silage fermentation. The higher the sugar, the better the silage is preserved and thehigher the feed value for the animal.
The range of WSC in grass
Higher WSC is a major differentiating factor in modernryegrasses bred at IBERS Aberystwyth University over 30 years.Varieties higher in WSC than conventional varieties are nowavailable as Aber High Sugar Grass. The Aber HSG range nowincludes intermediate and late heading diploid and tetraploidperennial ryegrasses and hybrid ryegrasses.
Relative differences in WSC are maintained between ryegrassvarieties even though the content typically rises and falls overa season, with varying weather conditions and even over theperiod of a day. On a warm sunny summer day, WSC contentcan be as high as 35% of dry matter, whilst on a cool cloudyautumn day it can be as low as 10%, but at either end of thespectrum differences between varieties are maintained.
Making the most of WSC
A high WSC will generally mean forage composition is closer tothe 2:1 WSC-to-crude protein ratio that animal models suggestis the target for optimum nitrogen use efficiency in the rumen.This means that more of the feed is converted into milk andmeat, with less going to waste in urine (and methane). Underideal growing conditions, modern Aber HSG ryegrasses willachieve the optimum ratio of 2:1 for WSC-to-protein.
Average WSC over five years
Normal varietiesAberHSG varieties + 17.3%
WSC
g/kg
DM
Apr May June Jul Aug Sept Oct Mean
300
250
200
150
100
Select and sow grass and silage mixtures that are 100% Aber HSG to maximise WSC
Avoid over-use of fertiliser by following RB209 guidelines
Cut for silage late in the afternoon to maximise the WSC content
Avoid making overly wet silage (below 28% DM) as this may result in sugar losses inthe effluent and increases the effluent; wet silage also has increased need forsugars to create a good fermentation and stable silage
WSC generally peaks 3 – 5 weeks after grazing or cutting
Manage swards to avoid diseases that will reduce WSC (e.g. crown rust, leaf spot)
200180160140120100
806040200
22.3 24.3 28 35.8
Dry Matter (g/KG FM)
WSCg/kg DM Homofermentative
InoculantUntreated
Effect of DM at ensiling on WSC content of silage as a result of fermentation
Water soluble carbohydrate
THE CLOVER EFFECT
Wetter silage ultimately usesup more sugar to achieve astable fermentation, leavingless for the animal.
10 11
The development of Aber High Sugar GrassesExtensive research over 30 years has shown how high water solublecarbohydrate content in Aber High Sugar Grass varieties improvesperformance and profitability in milk, beef and lamb production.Early research included:
Grazing trials on commercial dairy and beef farms over two seasons
Sheep studies at two research farms over three grazing seasons
More recent research with improved varieties that combine thehigh WSC trait with good disease resistance and high yields includes:
Zero grazing studies to investigate the potential benefits of feedingAber HSG to dairy and beef cattle on productivity andenvironmental impact
Studies to investigate the digestive mechanisms that allowruminants to utilise Aber HSG varieties more efficiently than otherrecommended grass varieties
Field-scale grazing studies to investigate animal performance onAber HSG swards
Studies on the reduction of methane emissions from ruminantsgrazing Aber HSG ryegrasses
Variety developmentSince proof of principle research established the value of a higher WSCcontent, a breeding programme has been on-going to develop AberHSG ryegrasses. Following the first Recommended List variety AberDartHSG in 2000, new varieties have continued onto the Recommended List,with higher and higher levels of WSC and – as a result – continuallyimproved performance potential.
Water soluble carbohydrate variation in High Sugar Grasses (averaged between 2007 and 2009)
Ongoing Aber HSG researchResearch to improve the quality of grass continues at IBERS AberystwythUniversity, with a focus on animal performance and increasing emphasison the environmental benefits.In addition to WSC, other quality traits including improvement of thefibre and lipid components of grass, are now included in projectobjectives.
Reducing nitrogen excretion in ruminantsEnabling ruminants to convert more of the nitrogen in their feed intomilk and meat improves production efficiency. It is also very positive forthe environment in terms of reducing greenhouse gas emissions(ammonia and nitrous oxide) and urea (in urine). Feeding ryegrasseswith higher WSC content leads to improved rumen efficiency (allowingincreased protein synthesis) and evidence shows this results in reducednitrogen losses.
Award winning ryegrassesAber High Sugar Grass varieties are proven performers in terms of drymatter yield, D-value and ME yield, boosting not only production fromforage but the environmental credentials for farming too. This has beenrecognised with a string of prestigious awards, beginning in 2003 whenthe first Aber High Sugar Grass, AberDart HSG, became the first (and stillonly) grass to win the NIAB Variety Cup. In subsequent years, the plantbreeders behind this breakthrough technology have collectedinnovation and technology awards from RASE and the BGS, and with theQueen’s Anniversary Prize and the recent Times Higher Education Awardthey have received accolades beyond the agricultural industry.
*Sponsored by Defra through the Sustainable Livestock Production (SLP) LINK Programme in association with IBERS (AberystwythUniversity), Germinal Holdings Limited, British Grassland Society (BGS), DairyCo, EBLEX, Hybu Cig Cymru (HCC), Livestock and MeatCommission of Northern Ireland (LMCNI) and Quality Meat Scotland (QMS).
High Sugar Grasses reduce methane emissions per lamb
Cattle and sheep are inefficient at converting grass proteininto milk and meat. When grazing conventional grass,livestock use only about 20% of protein from the herbagefor production – most of the rest is wasted in urine. This isnot only a waste of money, but it is detrimental to theenvironment.
A major reason for these losses is the imbalance betweenreadily available energy and protein within the grass. Proteinsare rapidly broken down when feed enters the rumen but,when the diet lacks readily available energy, rumen microbesare able to use less of the nitrogen released from the feed. Thisresults in a large proportion of the nitrogen being absorbed asammonia and eventually excreted.
Grass cell walls consist of complex carbohydrates calledcellulose, hemicellulose and lignin. Although these componentscan be broken down to provide energy, this is a relatively slowprocess and often out of balance with the breakdown of protein.
Water soluble carbohydrates in grass are the sugars foundinside the plant cells, rather than in the cell walls themselves.Unlike the carbohydrate in the cells walls, these sugars are asource of readily available energy soon after forage enters therumen, fuelling the rumen microbes to process more of thegrass protein. This protein can then be used in the productionof milk and meat, rather than being excreted.
This is why livestock perform better off forage with higher sugar levels.
Research at IBERS Aberystwyth University has shown that AberHSG varieties have consistently higher levels of sugars thanstandard varieties, throughout any grass growing season. WSClevels up to 50% higher than controls have been recorded insome Aber HSG varieties. Results from trials are summarisedlater in this section.
The science behind Aber High Sugar Grasses
Pictured with the IBERS awards are Paul Billings and John Gilbert fromGerminal and seated (L to R) Dr Alan Lovatt, Dr Pete Wilkins and Dr AtholeMarshall, past and present members of the IBERS forage grass breeding team.
Aber High Sugar Grass for beef production
12 13
Results of several studies conducted on commercial dairyfarms and by IBERS at its dairy unit near Aberystwyth, show that grass protein is used more efficiently for milkproduction when extra energy is provided by feeding Aber HSG varieties.
Animals were fed either an experimental Aber HSG or arecommended control ryegrass variety. Both grazing and zero-grazing techniques were used in the assessments.
The main advantages of feeding Aber HSG varieties were found to be:
Milk yield increased substantially In an early study that looked at Italian ryegrass across sixcommercial dairy farms, animals averaged 6% more milk percow over the grazing season.
In recent zero grazing trials with perennial ryegrass, the averagemilk yield of animals fed Aber HSG increased by 2.3kg/day inearly lactation and by 2.7kg/day in late lactation, without adetrimental effect on milk quality.
Dry matter intakes improved significantlyZero grazing trials at IBERS completed in 2000 found that drymatter intakes rose by around 2kg/head per day. This isparticularly important in low input farming systems whereproducers want animals to obtain as much of their nutrients aspossible from grazed grass.
Diet digestibility increasedIn the same trial, a 3% improvement in diet digestibility wasrecorded with Aber HSG. The dry matter digestibility of the Aber HSG variety was found to be consistently higher than the recommended control variety throughout spring, summer and autumn.
6% more milk percow over grazing season
Dry matter intakes upby 2kg/head per day
3% improvement indiet digestibility
24% less feed nitrogenlost in urine
The amount of feed nitrogen lost in urine is significantly reduced
In three zero-grazing trials involving early, mid and late lactation animals, theamount of feed nitrogen lost in the urine was reduced by up to 24% from animalsfed the Aber HSG variety. This has important implications for the environment in terms of nitrogen pollution.
Grazing trials and a companion zero-grazing study run by IBERSat Aberystwyth have shown that when extra energy is providedto beef cattle by feeding Aber HSG varieties, grass protein isused more efficiently and animal performance is enhanced.
Research involved beef steers offered either an Aber HSGvariety or a recommended control ryegrass variety. No extraadditional feed was given, and grass intakes and liveweightgains were monitored regularly.
l Dry matter intakes of animals fed Aber HSG increased byaround 25%, compared with those fed the control variety.
l Greater intake was achieved because the Aber HSG varietywas highly palatable. Additionally, Aber HSG was utilised moreefficiently by rumen microbes and passed more quicklythrough the rumen.
l Animals grazing Aber HSG recorded average daily liveweightgains of 0.997kg/head per day, which was 20% higher than thegain of cattle fed the recommended control variety.
Performance of Charolais cross steers in grazing trials at Aberystwyth, Summer 2000
l In a separate zero grazing trial, animals fed an Aber HSGvariety recorded high levels of growth performance, with anaverage liveweight gain of 1.3kg/head per day.
l This bonus from Aber HSG was the result of higher forageintakes and greater efficiency of grass utilisation.
l The growth rates of Aber HSG fed animals were enhanced, sothey reached slaughter weights more quickly than those fed thecontrol variety.
Aber High Sugar Grass for lamb production
Grazing period
Live
wei
ght g
ain
(g/d
ay) 300
250
200
150
100
50
0
Lamb production on High Sugar Grass variety
WSC
(%)
350
12
10
8
6
4
2
0
14
16
1 2
s
s
s
High Sugar Grass variety
Control variety
High Sugar Grass variety
Control variety
HSG
Upland
Lamb production
(Kg/ha 2 yearmean)
950
850
750
650
550
450
350CONTROL HSG CONTROL
Lowland
Lamb production comparingHigh Sugar Grass with an
ordinary ryegrass
In both upland and lowland situations, IBERS’ grazing trials haveshown Aber HSG varieties to be superior in terms of animalperformance, when compared with standard ryegrass swards.
l Initial studies on upland and lowland IBERS research farmsshowed that an early experimental Aber HSG variety supportedsignificantly higher lamb growth rates.
l In recent trials with Welsh Halfbred ewes and lambs, the liveweight gain of lambs was 20% higher where animals weregrazing the Aber HSG variety.
l In the same study, the carrying capacity (stocking rate) of theAber HSG sward was 20% higher than the standard ryegrass sward.
l Ad lib forage intake of grazing lambs was higher on the Aber HSG sward.
Dry matter intakes increased by around 25%
Improved palatability
20% higher daily liveweight gains
Slaughter weights reached more quickly
Higher forage intakes
20% higher liveweight gains
20% higher carrying capacity of Aber HSGsward
Aber High Sugar Grass for milk production
Pointers on Protein
14 15
Why is protein in grass important?
Protein is a large and expensive component of livestockrations, and reliance on imported sources (e.g. soya) leavesbusinesses vulnerable to price volatility and supply. Greateruse of homegrown protein is therefore desirable.
Protein in grass is generally reported as total crude protein(CP), which is 6.25 times the nitrogen content. Typicallyaround 80% of the crude protein in fresh grass is trueprotein. The remaining fraction is often referred to as non-protein nitrogen. Both types of nitrogen can be used by theanimal but the true protein is used more efficiently for meatand milk production. A larger part of the non-proteinnitrogen is used inefficiently and is excreted by the animal.
Crude protein can be split into effective rumen degradableprotein (ERDP) and digestible undegradable protein (DUP).ERDP, which is by far the biggest part of fresh forageprotein, can be broken down by rumen microbes andconverted into microbial protein that is digested later. DUPpasses through the rumen intact and can be broken downand digested in the small intestine.
Protein range in grass
Crude protein content can vary within single varieties andbetween varieties and is influenced by management factorssuch as nitrogen fertiliser applications and crop maturity.
The proportion of the crude protein that is available as trueprotein is lowest in the period after nitrogen fertiliser isapplied, but rises as the grass grows and converts non-protein nitrogen into true protein.
In silage, the proportion of crude protein that is available astrue protein is affected by the fermentation. A betterfermentation results in more of the crude protein remainingas true protein.
Grazed grass provides the bestsource of true protein. Good ensilingpractice will preserve more of thetrue protein in silage.
Making the most of protein in grass
Animal research has shown that typically only about 20% of protein consumed by ruminants is used (tomaintain the animal and produce meat or milk); the rest is lost in waste products. A better balance ofprotein and energy supply to the rumen will improve the proportion of protein that is used. Feedingforage (as grazed grass or silage) with a higher sugar (WSC) content has been shown to improve proteinutilisation in ruminants.
Given the optimum balance of protein and energy sources, dietary crude protein concentrations canroutinely be as low as 12 - 14% of dry matter without any detriment to livestock productivity (14% formilk production).
Aber HSG varieties are bred for improved protein-to-energy balance
Apply fertiliser in line with the Fertiliser Manual RB209, and 2 – 3 days aftergrazing or cutting
Avoid making overly wet silage (below 28% DM) as this may result in solubleprotein losses in the effluent
Optimum protein concentrations occur 3 – 5 days after cutting or grazing
100
80
60
40
20
0
Grass
15% Crude protein
Good silage
Poor silage
Ammonia
Other N products
Free amino acids
True protein
THE CLOVER EFFECTWhite clover is generally higher in protein than ryegrass; it is important tomaintain an optimum balance in grazing swards of an average 30% of drymatter over the season.
Red clover is a high protein forage (typically 22% crude protein). It contains anenzyme (PPO) that in silage helps to maintain the proportion of true protein.
Fibre content of grass rises with the presence of reproductive stems (seed heads) so management should, wherever possible, aim to maintain the grazing sward in a vegetative state.
Cutting grass after it has gone to head will increase thefibre content to the detriment of feed quality in silage.
Rotational grazing (18 – 25 day) using the Three Leaf System to determinewhen to graze will optimise both NDF and dNDF levels in grass
Topping will remove stemmy growth and stimulate fresh growth (and avoidNDF being too high) but good grazing management should ideally avoid theneed for topping
Take silage cuts before grass goes to head to avoid NDF rising too high
Manage grazing and cutting swards to avoid diseases (e.g. crown rust, leafspot) that will increase NDF at the expense of overall quality
Why is fibre important in grass?
Fibre is essential in the ruminant ration to provide the ‘scratchfactor’ essential to stimulate rumen function. There is animportant balance to be achieved in all rations for optimum performance.
Fibre is measured as NDF (neutral detergent fibre), this beingthe insoluble fibre fraction (cellulose, hemicellulose, pectin and lignin) that remains after boiling in a neutral detergent solution.
Carbohydrates within NDF are not as readily accessible asthose in the WSC component of ryegrasses. However, NDFcontent is important for predicting ruminant voluntary intake.
The proportion of NDF that can be digested by ruminants is referred to as dNDF. This is a secondary source of slowlyreleased carbohydrates that provides a useful source offermentable energy for ruminants within the rumen and hind gut.
The range of fibre in grass
Grass fibre concentration can vary greatly during the growingseason. It is at its highest (and the grass least digestible) whenthe sward is producing reproductive seed heads rather thanvegetative leaves. Conversely, during the early spring whenfresh growth is at its peak, fibre content is typically at its lowest(grass is most digestible).
Making the most of fibre in grass
The principle target with fibre is to maximise animal voluntaryintake whilst ensuring sufficient rumen digestion time. For grazing, the optimum NDF content of grass should be inthe range of 30 – 40% of total dry matter, with dNDF around20-30% of total dry matter, or roughly 60-75% of the total fibre content in a digestible form.
When grass fibre content falls below these optimum levels (e.g. early spring flush) supplementary feeding of fibre may be necessary to prevent grass passing through the rumen too rapidly.
When making silage, it is important to cut before grassbecomes too mature (pre-heading) to avoid a significantreduction in digestibility.
THE CLOVER EFFECT
The clover concentration of white and red clover is lower than that of ryegrassand can have the potential to increase voluntary intake.
The physical form of fibre in clovers typically breaks down in the rumen morequickly than the fibre in ryegrass.
Fibre Fibre
1615141312111098
Grass fibre and DM intake
Grass DM intake, kg/d
Grass NDF, g/kg DM425 475 525 575 625
Source: Morby et al
19
Why are lipids important in grass?
Lipids in forage grasses contain a high proportion ofpolyunsaturated fatty acids (PUFA). These are the ‘good’ fattyacids, better known as Omega 3 and Omega 9, which havepositive human health effects.
From an animal production perspective, increased PUFAsupply has been shown to improve animal fertility and result inpositive effects on meat quality (longer shelf life and a moredesirable colour). There is also evidence of reduced methaneemissions from ruminants consuming high PUFA diets, aneffect that is positive for the environment.
The range of lipids in grass
Early data suggests total fatty acid content of grass varies fromabout 2.5 to 5% of forage dry matter, with the PUFAcomponent making up 65 – 78% of the total lipid content.
Making the most of lipids in grass
Lipids have approximately twice the energy content ofcarbohydrates (WSC and fibre) and are an important source ofenergy for livestock. Ruminant diets are frequentlysupplemented with high lipid feeds as a means of increasingthe energy content of the diet.
Current and future grass breeding programmes at IBERSAberystwyth University have identified lipid concentration andfatty acid profile as important objectives.
Grass fed livestock will naturallyconsume more polyunsaturatedfatty acids (Omega 3 andOmega 9) which is believed toimprove the colour of agedmeat and potentially extendshelf life.
THE CLOVER EFFECT
Pointers on LipidsFresh grass provides a better PUFA profile than many dry feeds
Forage-based systems have the potential to produce better quality human food due to the favourable PUFA profile in grass
When silage making, rapid wilting will increase the level of lipids retained in the forage
White clover lipid content is generally reported to be slightly lower than thatof ryegrass, with a range of 2 – 4.4% of forage dry matter.
Red clover is generally reported to be higher in polyunsaturated fats than ryegrass.
Lipids (Oil) Lipids (Oil)
18
Improving the lipidcontent and profile ingrass is a new breedingobjective at IBERSAberystwyth University.
Concentrate fedForage fed
20 21
Why are minerals and vitamins important in grass?
Minerals include various elements like calcium, selenium andiron. These basic elements, like the more complex vitamins,have important roles in the health and performance oflivestock. Understanding the mineral and vitamin content ofgrass is important in the context of any additionalsupplementation that may or may not be required.
The range of minerals and vitamins in grass
The mineral content of a sward will depend largely upon themineral availability in the soil and the pH (see table).
Mineral and vitamin content will not usually change in silage,though in very wet crops some losses may occur in effluent.
Whilst many vitamins are synthesised by rumen microbes,some lipid soluble vitamins must be obtained from feed(vitamins A, D and E) and all vitamins provided by feeds can be a useful addition to the ruminant’s diet.
Making the most of mineral and vitamins in grass
Accurately managing a sward for minerals and vitaminscontent will require soil analysis for each paddock. Where anymineral is found to be deficient, provision of supplemental licksor mineral boluses can overcome most deficiencies.
When turning stock into lush pastures of rapidly growing grass,particularly in the spring, it is advisable to monitor them tofurther reduce the risk of staggers. Supplement rations withminerals in line with silage analysis.
4.0 4.5 5.0 5.5 6.0 6.5 7.0 7.5 8.0 8.5 9.0Nitrogen NA SA MA MA HA HA HA HA MA MA SAPhosphorus NA NA SA MA HA HA HA MA MA SA MAPotassium NA SA MA MA HA HA HA HA MA MA MASulphur NA SA MA MA HA HA HA HA MA MA MACalcium NA NA SA MA MA MA HA HA HA HA MAMagnesium NA SA SA HA HA HA HA HA MA MA MAIron HA HA HA HA HA MA MA SA SA SA SAManganese HA HA HA HA HA MA MA SA SA SA SABoron MA MA HA HA HA HA HA MA SA SA MACopper NA SA MA HA HA HA HA MA SA SA SAZinc HA HA HA HA HA MA MA SA SA SA SAMolybdenum NA NA SA SA MA MA HA HA HA HA HA
Optimum pH Zone for Soil
NA = Not available
Soil pH
Nutrient availability chart
Nutrients
Acidic Basic
SA = Slightly available MA = Moderately available HA = Highly available
Perennial chicory has become a popular new grazing forageoption on UK livestock farms since the introduction of newvarieties bred in New Zealand.
Puna II is the leading perennial chicory variety, selectedthrough a long term breeding programme for its nutritivevalue, productivity, palatability and persistency. Perennialchicory has proven anthelmintic properties and will reduceworm burdens in grazing livestock.
It is a broad-leaved perennial forage crop that can be grown inthe UK as a pure stand or as a key part of mixed swards withclover, or grass and clover, for medium-long term rotational
grazing (2-5 year persistency). Perennial chicory should not beconfused with short-lived common chicory grownunsuccessfully previously.
Selection strategy in breeding Puna II has included tolerance tothe fungal disease Sclerotinia, which causes plant death, andan erect growth habit to improve compatibility with ryegrass.
As a pure stand, Puna II typically yields up to 15tDM/ha in aseason, with crude protein up to 25% and at a D-value of 70-80. It is deep rooting and hence very drought tolerant withhigh mineral content.
Source: K. Harrington, Institute of Natural Resources, Massey University, New Zealand
Macronutrients in perennial ryegrass, white clover and perennial chicory (% of DM)
Pointers on Minerals and VitaminsTest soils to determine any mineral deficiencies
Provide licks or mineral boluses to overcome deficiencies detected
Avoid making overly wet silage (below 28% DM) as this may result in minerallosses in the effluent
Inclusion of Puna II perennial chicory in a sward increases forage mineral supplyand profile
Always be vigilant about the risk of grass staggers when stock are grazing freshspring grass
Check phosphorous status of soil before reseeding with clovers
White clover is typically richer in calcium, magnesium, iron, manganese, copper,cobalt, molybdenum, boron and selenium than ryegrass.
Red clover is typically richer in copper and cobalt than ryegrass.
Minerals and Vitamins Puna II Perennial Chicory
22 23
In order to maximise the nutritional value of grass it isimportant to manage grazing effectively. This means ensuringthe optimum balance between sward quality and quantity,thereby maximising intakes when the grass is in the bestnutritional condition.
Regardless of whether livestock are set-stocked or rotationallygrazed, the key is to assess pastures regularly (at least weekly)
in order to establish when grass is at the right stage for grazingand when it is time to close an area to allow re-growth.Methods to assess the condition of a sward for grazing includemeasuring sward height to establish the cover (kgDM/ha),either with a calibrated sward stick or more simple aids, orusing a rising plate meter. Guidelines on the optimum cover forgrazing and closing up pastures are well-established. (See tables).
Structure of a ryegrass tiller
Blade of youngest leaf (1)Blade of leaf 2
Blade of leaf 3
Sheath of leaf 2
Decaying leaf 4
Growing point
Roots
Whilst good and recommended practices, sward sticks and platemeters are primarily measurements of quantity whereasnutritional value is more related to quality. The establishedqualitative method of sward assessment is the Three-Leaf System.
This method is based on the understanding that a ryegrass tillertypically supports three green leaves.
As shown by the diagram, the typical ryegrass tiller structureincludes the youngest green leaf (leaf 1) growing at the top; twofurther green leaves (leaf 2 and leaf 3) that are no longer growing;and a dead and decaying leaf (leaf 4).
Monitoring the emergence of these leaves is commonlyconsidered to be the best way to gauge the optimum pre- andpost-grazing points in grazing swards, and planning the time thata given area will support grazing of the highest quality.
• The optimum pre-grazing stage is when the ryegrass tillers haveat least two and a half and preferably three fresh leaves.
• Grazing when there are less than two fresh leaves reduces plantvigour and re-growth potential.
• Grazing when there are more than three leaves results inreduced sward productivity and reduced nutritional value as theproportion of dead and decaying material rises. In mixed swards,clover may be impeded due to excessive shading.
S 10-14 5-6 5-6( June - July 12-15 7-8 7-9 8-9 7-9
G 10-12 5-6 5-6f June - July 10-14 6-7 6-7 7-8 7-8
Class of Grazing Continuousstock period Pre-graze (cm) Post-graze (cm)
Ewes & Turn out - April 8-10 4-5 4lambs May - Weaning 8-10 4-6 4-6
Pre- Sept - Nov 8-10 4-5 6-8tupping
Weaned July - Sept 10-12 5-7 6-8lamb for finish
Rotational/Aftermath grazing
Using the Three-Leaf SystemAssessments should be made at least weekly prior to grazing,with more frequent counts in the spring when grass isgrowing most rapidly and less often in late-autumn.
Select a suitable ryegrass tiller• Identify ryegrass from the red stem base• Only use vegetative tillers (avoid anything with seed heads)• Use the main parent tiller (as opposed to a daughter tiller)
Identify the remnant leaf• The youngest growing leaf when the grass was last grazed(near the base of the tiller, likely to have a blunt end)• Assess the length of the remnant leaf in relation to the freshun-grazed leaf above it• If the remnant is more than half the length of the first freshleaf, count it as 0.5 – 1, but if not it should not be counted• If there is no remnant leaf, do not include this tiller in theassessment• If there is more than one remnant leaf (because the swardwas under-grazed previously) counting should start with theyoungest remnant
Count the fresh leaves• Start with the remnant leaf (as above)• Each of the next full leaves count as 1.0• The youngest (top) leaf may only be partly grown and shouldbe assessed by its size relative to the previous leaf (this topleaf may not be immediately obvious but is often close to theprevious leaf and can be revealed by opening the evident leafby rolling it between thumb and forefinger)
Count up to 10 tillers• Select up to 10 tillers randomly across the field• Calculate an average to create an accurate assessment• An evenly grazed area will have most of the tillers assessedwithin a half leaf stage of each other
Grazing management Using the Three-Leaf System
24 25
This quick reference guide to silage making assumes that soils are free from compaction and have optimumnutrient status. It is a prompt to seek further information if required.
Mixture selection
Important considerations when selecting a grass mixture forsilage making should include:
• Planned duration of the ley
• Number and timing of cuts in a season
• Silage only or dual purpose
• Quantity and quality
• Clover or no clover
• Is drought tolerance required
Addressing these points will help ensure that the type ofmixture is fit for purpose. Mixtures for silage production willcontain a number of ryegrass varieties (perennial, hybrid orItalian), with the possible addition of an alternative grassspecies, such as Timothy, and white or red clover.
To ensure you have the best mixture for your purpose:
• Ensure all varieties are high ranking on the latestRecommended List
• Consider the relative merits of diploid and tetraploid varieties
° Diploids are more persistent and create a densersward, better suited to wetter conditions and wherelong term grazing is also required
° Tetraploids have a more upright growth habit andcan be faster establishing
• Ensure the heading date range within the mixture is as tightas possible (1 week optimum) and coincides with target cuttingdates in order to maximise quality
Timing of harvest
When making silage, it is usually the case that as quantityincreases, quality decreases. This is because the more mature(and higher yielding) crop will have lower nutritional value, forreasons explained earlier in this guide.
There is therefore an inevitable compromise, with decisions onwhen to cut best determined by the class of livestock to be fedand stock performance tagets.
For maximum yield without significant compromise of quality, most crops are best cut approximately one week before heading.
Wilting
Wilting to achieve an optimum silage dry matter of 30-35%(clamp) and 35-40% (bale) should ideally be quick and short, soa maximum of 24 – 36 hours.
• Using a mower conditioner will increase the speed of wiltingand reduce losses of sugar, protein and dry matter
• Leaf pores only remain open for two hours after cutting, whenspeed of moisture loss is five times greater than after poresclose – so spread the crop quickly after cutting
• Spread the crop over 100% of the field area, again to increasethe speed of wilting
Quality grass silage can be made in both clamps and bales,and both systems have their place on modern livestockfarms. The choice depends on individual farmcircumstances and a range of variables. Silage additiveswill not salvage poor quality forage, but when the rightproduct is selected for the right purpose they may helpmake good silage even better.
Making good silage in clamps
• Ensure the forage harvester is blowing all chopped materialinto the trailer
• Set forage harvester chop length according to grass drymatter content
• Sheet the clamp side walls
• Consider using a ‘clingfilm’ as a second topsheet to reduceoxygen ingress
• Ensure all machinery entering the silage pit have clean wheels
• Fill the clamp quickly in thin layers whilst ensuring sufficientcompaction
• Sheet down quickly after finishing
• Weigh down the top sheet sufficiently
Making good silage in bales
• Create a box-shaped swath and use a baler (round or square)to form uniform bales with ‘square’ edges
• Use a baler with a chopping function to produce denser baleswith less oxygen trapped inside; chopping also releases sugarsto assist a rapid fermentation
• Wrap bales as soon after baling as possible
• Use good quality wrap and an effective wrapper to apply atleast six layers
• Move bales for stacking as soon after wrapping as possible
• Stack bales on a level surface free from sharp objects and atleast 10m from a water course; bales are best stacked on theirsides and no more than three high (or four if over 35% DM)
• Protect bales from bird and rodent damage
Making quality silage Making quality silage
Understanding a silage analysisFind out more
26 27
Whether clamped or baled, conserved forage will often make up a large proportion of ruminantdiets. It is important, therefore, to understand the nutritional value through a representativesilage analysis.
Obtaining a representative sample
For clamps
• Cored sample in a diagonal line across the top of the clamp
• At least four samples per clamp
• Mix samples well, seal in an air-tight bag, and send for analysis without delay
For bales
• Three cored samples per bale, each taken from top to bottom
• Or, sample at feedout (when bales are mixed and chopped)
• Mix samples well, seal in an air-tight bag, and send for analysis without delay
Your silage analysis will include values for all of the main nutritional components. Review thesevalues against target levels and adjust feed supplementation accordingly. As highlighted below,different parameters are related to crop quality in the field, success of fermentation, or both. By understanding which parameter relates to which part of the process, steps can be taken toimprove methods in future years.
Indications of both crop and fermentation quality – Dry Matter, pH, WSC
Analysis Abbreviation Units Range Target value **
Dry matter DM g/kg 150-500 280-350D-value D % 55-75 >68Metabolisable energy ME MJ/kgDM 8.8-12.0 >11Neutral detergent fibre NDF g/kgDM 500-650 500-550Acid detergent fibre ADF g/kgDM 230-350 300Ash g/kgDM 60-200 <80Crude protein CP g/kgDM 100-200 150-175pH 3.5-5.5 Depends on DMAmmonia N NH3N g/kg N 20-300 <80Total fermentable acids TFA g/kgDM 20-200 <100 (depends on DM)Volatile fatty acids VFA g/kgDM 10-90 %TFA 25% (as low as possible)Lactic acid* g/kgDM 20-200 80-120Acetic acid g/kgDM 20-80 <25Butyric acid g/kgDM 0-20 <5Residual sugars g/kgDM 0-150 100 (as high as possible)
*For well fermented silage lactic acid as the proportion as the total acids should be >75%. **Different analytical companies use different units for expressing the values. This example shows g/kg DM to convert to % divide the value by 10.
Indications of fermentation quality – Lactic Acid, Acetic Acid, Butyric Acid, Ammonia N, VFAs
Aber® and are Registered Trademarks of Germinal Holdings Ltd.
This leaflet summarises some results of work including initial findings from a LINK sustainable livestock production project at IBERS,sponsored by Defra through the Sustainable Livestock Production (SLP) LINK Programme in association with IBERS (AberystwythUniversity), Germinal Holdings Limited, British Grassland Society (BGS), DairyCo, EBLEX, Hybu Cig Cymru (HCC), Livestock and MeatCommission of Northern Ireland (LMCNI) and Quality Meat Scotland (QMS).