The Welfare Loss of Excess Health Insurance Martin S. Feldstein The Journal of Political Economy, Vol. 81, No. 2, Part 1. (Mar. - Apr., 1973), pp. 251-280. Stable URL: http://links.jstor.org/sici?sici=0022-3808%28197303%2F04%2981%3A2%3C251%3ATWLOEH%3E2.0.CO%3B2-1 The Journal of Political Economy is currently published by The University of Chicago Press. Your use of the JSTOR archive indicates your acceptance of JSTOR's Terms and Conditions of Use, available at http://www.jstor.org/about/terms.html. JSTOR's Terms and Conditions of Use provides, in part, that unless you have obtained prior permission, you may not download an entire issue of a journal or multiple copies of articles, and you may use content in the JSTOR archive only for your personal, non-commercial use. Please contact the publisher regarding any further use of this work. Publisher contact information may be obtained at http://www.jstor.org/journals/ucpress.html. Each copy of any part of a JSTOR transmission must contain the same copyright notice that appears on the screen or printed page of such transmission. The JSTOR Archive is a trusted digital repository providing for long-term preservation and access to leading academic journals and scholarly literature from around the world. The Archive is supported by libraries, scholarly societies, publishers, and foundations. It is an initiative of JSTOR, a not-for-profit organization with a mission to help the scholarly community take advantage of advances in technology. For more information regarding JSTOR, please contact [email protected]. http://www.jstor.org Mon Dec 3 13:40:01 2007
Transcript
The Welfare Loss of Excess Health Insurance
Martin S. Feldstein
The Journal of Political Economy, Vol. 81, No. 2, Part 1. (Mar. - Apr., 1973), pp. 251-280.
The Journal of Political Economy is currently published by The University of Chicago Press.
Your use of the JSTOR archive indicates your acceptance of JSTOR's Terms and Conditions of Use, available athttp://www.jstor.org/about/terms.html. JSTOR's Terms and Conditions of Use provides, in part, that unless you have obtainedprior permission, you may not download an entire issue of a journal or multiple copies of articles, and you may use content inthe JSTOR archive only for your personal, non-commercial use.
Please contact the publisher regarding any further use of this work. Publisher contact information may be obtained athttp://www.jstor.org/journals/ucpress.html.
Each copy of any part of a JSTOR transmission must contain the same copyright notice that appears on the screen or printedpage of such transmission.
The JSTOR Archive is a trusted digital repository providing for long-term preservation and access to leading academicjournals and scholarly literature from around the world. The Archive is supported by libraries, scholarly societies, publishers,and foundations. It is an initiative of JSTOR, a not-for-profit organization with a mission to help the scholarly community takeadvantage of advances in technology. For more information regarding JSTOR, please contact [email protected].
American families are in general overinsured against health expenses. If insurance coverage were reduced, the utility loss from increased risk would be more than outweighed by the gain due to lower prices and the reduced purchase of excess care. The first part of the paper develops and estimates a structural equation for the demand for health care and then examines the dynamic interaction between the purchase of insur- ance and the demand and supply for health care. The second part esti- mates the welfare gains that would result from decreasing insurance by raising the average coinsurance rate from 0.33 to 0.50 and 0.67 percent. The most likely values imply net gains in excess of $4 billion.
This paper will show that American families are in general overinsured against health expenses. If insurance coverage were reduced, the utility loss from increased risk would be more than outweighed by the gain due to lower costs and the reduced purchase of excess care. Moreover, the estimated net gain from even a one-third reduction in insurance is quite large, probably exceeding several billion dollars per year.
The economics of health insurance is of particular importance today. Health insurance has become a major issue of public policy. Some form of national health insurance is very likely to be enacted within the next few years. Government health insurance payments under Medicare and Medic- aid already exceed $8 billion. Private health insurance, encouraged by favorable tax treatment, has increased rapidly; premiums in 1970 exceeded $1 7 billion. Private insurance and government programs together accounted
Received for publication October 21, 1971. Final version received February 2, 1972.
I am grateful to Dr. Bernard Friedman for assistance and for discussions about this research and to my wife Kathleen for comments on a previous draft. The study was financed by a grant from the National Center for Health Services Research and De- velopment, U.S. Department of Health, Education, and Welfare.
252 JOURNAL OF POLITICAL ECONOMY
for over 59 percent of personal health expenditures and nearly 87 percent of hospital bills.
Let us consider briefly the basic reasons why too much health insurance can actually reduce welfare. At first this seems contrary to much of the recent literature on the economics of insurance.l I t is well known that if certain conditions are satisfied, it is optimal for individuals to insure com- pletely against all uncertain expenses. hforeover, these personally optimal decisions are also Pareto optimal for the community as a whole by exten- sion of the usual welfare analysis to Arrow-Debreu contingent commodi- ties (Arrow 1964). For health care, however, the usually assumed conditions are not satisfied. In particular, the level of expenditure on health care is not a purely exogenous random variable. Even if the occurrence of illness is beyond the individual's control, his demand for care (given any illness) is to some extent a discretionary decision. Insurance against expenditure for health services therefore increases the consumption of those services unless demand is completely price inelastic. This destroys the optimality of complete insurance. The welfare loss due to the distortion of demand must be balanced against the welfare gain of risk spreading. The individual's optimal insurance policy therefore involves some degree of risk sharing or "coin~urance."~
Health insurance also introduces a quite different distortion because of the special character of the health-care market. The price and type of health services that are available to any individual reflect the extent of health insurance among other members of the community. A previous study (Feldstein 1970) showed that physicians raise their fees (and may improve their services) when insurance becomes more extensive. Nonprofit hospitals also respond to the growth of insurance by increasing the sophis- tication and price of their product (Feldstein 1971b). Thus, even the un- insured individual will find that his expenditure on health services is affected by the insurance of others. Moreover, the higher price of physician and hospital services encourages more extensive use of insurance. For the community as a whole, therefore, the spread of insurance causes higher prices and more sophisticated services which in turn cause a further in- crease in insurance. People spend more on health because they are insured and buy more insurance because of the high cost of health care.3
1 See, e.g., Arrow (1963, 1965), Pashigian, Schkade, and Menefee (1966), Borch (1968), Mossin (1968), Smith (1968), and Gould (1969).
2 This point was made by Pauly (1968) in a comment on Arrow (1963). The basic problem has long been referred to in the insurance literature as "moral hazard." The welfare loss due to price distortion has received extensive analysis in relation to taxes and public pricing (e.g., Hotelling 1938; and Harberger 1964). This reason for a deductible or coinsurance is of course quite different from the case considered by Arrow (1963), Pashigian et al. (1966), and Smith (1968) in which risk is truly random but the insurance company does not sell actuarially fair policies.
3 Richard Rosett has called my attention to the similarity of this situation to the prisoners' dilemma problem.
WELFARE LOSS O F HEALTH INSURANCE 2 5 3
The purpose of this paper is to analyze the economics of health insurance in greater detail and to provide estimates of the relevant magnitudes. The first two sections develop a more specific analysis of the demand for health insurance and its dependence on the price of health services: the third shows how insurance raises the price of hospital care: and the fourth, derives specific estimates of the potential welfare gain from reduced price distortion and the potential welfare loss from reduced risk avoidance. A final section summarizes the analysis and suggests a way out of the current dilemma.
The Demand for Health Insurance
The demand for insurance is not like the demand for most goods and services. Health insurance is purchased not as a final consumption good but as a means of paying for the future stochastic purchases of health services. The influences of both price and income are therefore different from their usual roles in demand analysis. A number of special institutional features must also be taken into account in analyzing the demand for health insurance.
Before discussing the determinants of demand in detail, a measure of the "quantity" of insurance that an individual purchases must be provided. Actual insurance policies are characterized by a complex mixture of co-insurance rates, deductibles, exclusions, ceilings, and special schedules. T o reduce this to a single parametric measure of the quantity of insurance, I shall assume that an insured person pays a fixed fraction of all health expenditures with that fraction depending on the insurance policy chosen. In insurance terminology. this is equal to the coinsurance rate. A useful simple measure of the quantity of insurance is the inverse of the average coinsurance rate in the population: this varies from one in the absence of insurance to infinity when there is complete insurance.
Consider now the role of price in determining the demand for insurance. The premium for a given quantity of insurance actually reflects two dif- ferent prices: the price of insurance per se and the price of health services. The price of insurance per se can be measured by the ratio of the premium charged to the expected benefits. I t reflects the administrative costs and profits of the insurance companies. The higher the ratio of premiums to benefits, the smaller is the family's optimal quantity of insurance.Wver the past 20 years, changes in the premiumlbenefit ratio have been small relative to changes in the total premium cost for a given quantity of insur- ance and have, to a substantial extent, been a reflection of the growth of group coverage. Moreover, because of the relatively high variance in family
'See Arrow (1963), Pashigian ct a1 (1966), Smith (1968), and Fricdman (1971) for a formal analysis of this tqpe of problem This of course assumes that the sub- stitution effect dominates the income effect.
2 54 JOURNAL O F POLITICAL ECONOMY
health expenditures, the insurance buyer's uncertainty about the expected benefits probably outweighs the relatively small changes in the premium/ benefit ratio.
The effect of changes in the price of health services on the demand for insurance is both more important and more complex. I n the likely case in which the elasticity of demand for services is between zero and minus one. an increase in the price of health services increases the total expenditure on them. This, in effect, increases the expenditure risk against which the individual insures and therefore raises the demand for i n ~ u r a n c e . ~
Income also affects the demand for health insurance in unusual ways. For a given probability distribution of health expenses, higher income tends to make families more willing to assume risk, which in turn reduces their demand for i n s ~ r a n c e . ~ Against this must be balanced three ways in which higher income tends to raise the demand for insurance. First, fami- lies with higher incomes are likely to spend more for health services at any net price. I n a sense, therefore, they have greater expenditure risk against which to insure. Moreover, insurance premiums are generally not higher for families with higher incomes. This effectively lowers the ratio of premiums to expected benefits and may even make it less than one. Second, higher-income fanlilies can benefit more from the tax rule that employer payments for health insurance are not part of taxable income. This tax treatment is often sufficient to make the net cost of the premium less than the expected value of benefits (Feldstein and Allison 1 9 7 2 ) . Third, low-income families have generally been eligible for medical care a t public expense, even before the introduction of Medicaid. For them, the value of private insurance is substantially reduced. The net effect of income on the demand for insurance is therefore indeterminate.
A variety of other factors influence the demand for health services and. therefore, for health insurance. A previous study (Feldstein 1 9 7 1 b ) showed that a greater local availability of hospital beds increases the quantity of
I t is interesting to compare this relation with the usual concept of complementarity. Health insurance might be called an "expenditure complement" of health services because its demand falls when a rise in the price of health services reduces the espendi- ture and not merely the quantity purchased. An increase in the price o i insurance per se lowers the demand for health services, not because of the usual complementarity effect but because the resulting decrease in the quantity of insurance raises the effec- tive price of health services at the time of illness. Alternatively, if one ignores the two facets of premium and treats the premium as the price of insurance, health insurance may behave like a Giffen good.
GThis need not be true if the utility function is not characterized by decreasing absolute risk aversion (Prat t 1964; Arrow 1965). Moreover, even this substantially simplifies the problem by considering a utility function whose only argument is net wealth. .4 satisfactory theory would include a measure of health as well. The effect of wealth on insurance would then depend on the way in which the two arguments of the utility function were interrelated. For an analysis of these problems and an explicit model of the choice among insurance options, see Friedman (1971). For a dis- cussion of further complexities, see Schelling (1968).
WELFARE LOSS O F HEALTH INSURANCE *55
hospital services demanded directly as well as through a lower price. More general practitioners in an area reduce the demand for hospital care while more specialists increase it. Population density and other demographic factors also influence the demand for care.i Factors that raise the demand for services increase the expenditure risk and thus increase the demand for insurance. At the same time, the factors that increase the use of services also have an effect that tends to reduce the demand for insurance. Recall that the households' optimal quantity of insurance reflects a balancing of the gain from additional risk spreading against the loss of consuming additional care whose value is less than its actuarial cost. Factors (such as the availability of hospital beds) that increase the use of services lower the value of the marginal unit of care and thus reduce the optimal quantity of insurance.
The most important institutional feature of the health insurance market is that most insurance is purchased by groups rather than by individuals. The most common type of group is the employees of a firm or the associ- ated labor union. Such groups are much more common in manufacturing and government services than in industries such as agriculture, retail distribution, and construction. The purchase of health insurance is often compulsory or highly subsidized for members of such groups. An individ- ual's type of employment is therefore likely to have a substantial effect on his probability of being insured. illoreover, there are several reasons why the quantity of insurance per insured person is also likely to be greater in group policies than in policies purchased by individuals. Groups enjoy much lower premiumlbenefit ratios: this reflects both economies of scale in administration and a general absence of adverse selection. The tax rule that excludes employer payments for health insurance from taxable income encourages employees to forego money income for more comprehensive insurance. I t is also likely that employees assume that employer payments for health insurance do not result in a corresponding decrease in money income. This encourages the tendency of both unions and employers to provide relatively comprehensive benefit^.^
Finally, an empirical analysis of the demand for health insurance should recognize the habitual character of the demand for insurance services. The importance of group purchases of insurance reinforces this tendency for the frequency and quantity of insurance coverage to change s l o ~ l y . ~
7 Much less is known about the demand for physicians' services. Feldstein (1970) concludes that excess demand prevails in the market for physicians' services and that the parameters oi a demand function cannot be estimated. The empirical analysis of the following sections deals primarily with insurance for hospital services.
8 Their desire that these benefits be clearly visible to employees may explain the tendency to insure against relatively small expenses (including drugs and physicians' iees) while "castastrophic" expenses of very low probability are left uninsured.
V received a copy of the interesting paper by Ehrlich and Becker (1972) too late to incorporate their insights on "self-insurance" and "self-protection" in the current
2 ~ 6 JOURNAL OF POLITICAL ECONOMY
Estimated Demand Equations
The previous section provides a basis for specifying an empirical demand function for hospital insurance and, in particular, for estimating the effect of the price of hospital services on the demand for insurance. The data used in the study are a cross section of time series for individual stateslo for the years 1959-65. Comparable data on insurance coverage are not available before 1959. The introduction of Medicare and Medicaid in 1966 creates problems of the substitution of public for private insurance that cannot be studied until more disaggregated data become available.
Measurement and Specification
Two measures of the demand for hospital insurance will be used: ENRit is the proportion of the population in state i in year t that is enrolled for health insurance;ll QINSit is a measure of the "quantity" of insurance as described above. More specifically, if the average coinsurance rate among those who are insured is denoted COINS," the quantity of insurance is measured by
QINS = [ ( I - E N R ) +ENR.COIlVS] -I. (11
This implies that if the entire population were insured ( E N R = 11, the value of QIh7S would equal the inverse of the coinsurance rate as suggested above. More generally, aQINS/dENR > 0 and dQINS/dCOINS < 0.
Although the proportions of the population in each state and year who have insurance are available (Health Insurance Institute 1959-681, the corresponding values of COINS are not. Because of the data limitations, i t was necessary to assume that COINS varied from year to year but not among the states. The annual values of COINS were calculated by a method similar to that described in Feldstein ( 1971b ) .I3
analysis. The extensive use of health insurance, its provision by employers and the government, and the fact that the individual's premium is generally independent of his own behavior may tend to reduce self-protection (e.g., preventive care and good health habits) and self-insurance (e.g., early treatment and the reduction of work activities that exacerbate an illness). The effect is unclear, however, because some of the self-protection and self-insurance activities in relation to expensive serious illness are actually insured (e.g., preventive care and early treatment) while others are not (e.g., good diet and reduction of work activities). A full analysis would require an extension of the Ehrlich-Becker binary event model to multiple conditional risks.
10 Because of the special character of the Washington, D.C., area, a composite unit of Washington, Virginia, and Maryland was created.
11Each enrollment proportion was actually adjusted for the age-sex composition of the state's population by dividing the raw enrollment proportion by an age index number. This index number is a weighted average of the proportions of the state population in eight age-sex groups, weighting by the relative national insurance coverage rates in those groups.
12This variable is thus different from INS as used in Feldstein (1970, 1971b) ; i t does not reflect the price paid by uninsured patients.
13The current estimates represent a slight improvement because 3 years of survey
WELFARE LOSS O F HEALTH INSURANCE 2 5 7
The price of insurance services (PINS) was estimated for each state and year as the ratio of total health insurance premiums to benefits. Be- cause the premium/benefit ratio is lower for hospital insurance than for other forms of health insurance, P INS overestimates the true value in a way which varies among observations depending on their mix of insurance coverage. Separate state data for hospital insurance benefits and premiums is not available. A regression of P INS on the mix of health insurance proportions (hospital, medical, and surgical) was therefore used to derive an adjusted premium/benefit ratio (PINSA ) .
The price of hospital care (PCARE) was measured by the average cost per patient day in short-term general hospitals (American Hospital Asso- ciation 1959-65) deflated by the consumer price index for that year.
Two measures of the state's income distribution were studied. The first is the mean per capita income deflated by the annual value of the CPI; this is denoted INC.' The second measure is an attempt to derive a single variable summary of the state's income distribution that is more relevant to the demand for insurance. I t is essentially a weighted average of the household incomes in the state, weighting each income by an estimate of the national proportion of persons with that income who are insured. A more specific description of this variable, denoted INSINC, is given in the Appendix.
The impact of other factors that affect hospital use was taken into account in a way that utilizes the information found in a previous study of the demand for hospital services (Feldstein 1971 b ) . I t was shown there that the number of patient days demanded ( P D D ) could be represented by a function of the form:14
P D D = k PCAREVl INS-71 INC72 11X;O', ( 2 ) j>2
where I N S measures the effect of both private insurance and other pro- grams that reduce the price of care to uninsured persons and the Xjs in- clude demographic factors, availability, etc.
The constraint that the coefficients of PCARE and I N S are of equal absolute value implies that patients' demand responds to the the net price that they pay. The effect on demand of the Xjs is therefore proportional to P D D . (PCARE/INS) -71 INC-72. This composite term, calculated using the estimated values = -0.67 and $jz = 0.29 from the previous demand study, will be referred to as USEX.
The employment variable used to represent the effect of group purchase was defined as the proportion of employees in the state who worked in manufacturing or government services. I t will be denoted GROUP.
data were employed, and relative utilization rates were related to the changing relative prices. The survey data are from Andersen and Anderson (1967).
14 See n. 12.
2 ~ 8 JOURNAL OF POLITICAL ECONOMY
Finally, the habitual nature of insurance demand has been represented by a proportional adjustment model. For the enrollment equation this specification is:
where ENRit*, the long-run equilibrium enrollment proportion correspond- ing to the current values of the explanatory variables, is defined by the relation (using lowercase symbols to represent the logarithms of the corre- sponding uppercase variables) :
Although it would in principle have been desirable to examine more general lag structures to represent habitual behavior,15 the short time series avail- able for each state contains too little information to be useful for this.
The final estimation equations for ENR and QIKS are thus of the form:
Estimation
Equation (5 ) is part of a complete model of the health-care sector.16 The explanatory variables pins, pcare, and usex are endogenous. The equation was estimated by an instrumental variable procedure that yields consistent parameter estimates. More specifically, the set of instruments contains the current and lagged exogenous variables of the equation (group and inc) as well as exogenous variables from other equations of the model. A full two- stage least-squares estimator could not be used because the complete model has not yet been fully specified.
Although a separate constant term for each state is not included, the lagged dependent variable is treated as endogenous, that is, it is not in- cluded in the instrument set. This maintains the consistency of the param- eter estimates even if the disturbances contain a systematic "state effect" or are otherwise serially correlated.17
Parameter Estimates
Table 1 presents parameter estimates for both the proportional enrollment ( E N R ) and quantity of insurance (QINS) equations. The estimates show
15 See Houthakker and Taylor (1966) for a variety of habit-adjustment equations. 16 For an earlier discussion of this project and estimates of other parts of the model,
see Feldstein (1968, 1971a, 1971b) . 17See Balestra and Nerlove ( 1 9 6 6 ) .
Dependent Lagged Eq. Variable P C A R E U S E X PIA%'SA G R O U P I N C INSZNC Dep. Var. R2 SE
NOTE.-Standard errors are shown in parentheses. Long-run elasticities are shown immediately below the standard errors in square brackets. All variables are logarithms.The constant term for each equation is not shown. Estimates are for 1960-65. Estimation is by instrumental variables. The RZ must therefore be interpreted with caution. The final column presents the estimated standard error of the regression.
2 60 JOURNAL OF POLITICAL ECONOMY
that, despite the offsetting factors that influence the effect of each variable, most of the variables identified in the previous section have a determinate impact.
The most important of the coefficients for the general analysis of this paper is the elasticity with respect to the price of care. The estimated values indicate a substantial and significant positive elasticity of both QINS and E N R with respect to PCARE. A rise in the price of hospital services causes an increase in the proportion enrolled and in the total quantity of insurance. The effect of increased expenditure risk thus more than outweighs the tendency to purchase less care (and therefore less insurance) as price rises.
The coefficients of USEX, the variable that measures the "location of the demand curve" (i.e., the total effect of the factors other than PCARE and insurance that influence the quantity of hospital care demanded), are significantly positive and, in the QINS equation, approximately equal the coefficients of PCARE. This supports the hypothesis that the demand for insurance reflects the expenditure risk, that is, that QINS responds to changes in the product of price and quantity.ls More generally, this posi- tive elasticity indicates that a rise in any of the factors that increases the demand for hospital care (e.g., the relative number of medical specialists in the area) causes an increase in insurance and thus in the price of care.lQ
The coefficients of the adjusted price of insurance (PINSA) have the expected sign but are insignificant. Using the unadjusted variable (PINS) also yields insignificant coefficients. The reason for this is not clear. I t may well be that most of the variation in the ratio of premiums to benefits is due to differences in the extent of group coverage and to differences in the relative importance of service benefit contracts ( the Blue Cross type) and indemnity contracts (offered by commercial insurers).
The GROUP variable is significantly positive, showing that the premium and tax advantages associated with group coverage do increase the demand for insurance. Both measures of the income effect are insignificant in the E N R and QINS equations. This probably reflects the balancing of positive and negative income effects noted in the first section. I t is not incompatible with the survey evidence20 that higher-income families are more likely to be insured since the I N C and INSINC coefficients show the net effect of income after the effect of the type of employment (GROUP) and the local price and use of care are taken into account; all three of these variables are positively correlated with income.
18Exact equality is not to be expected because higher price would reduce the demand for care (and therefore insurance) and higher U S E X would, by reducing the marginal value of additional care, reduce the demand for insurance. I t is a coincidence that both of these reductions are approximately equal.
1 V h i s is in addition to its direct effect (i.e., through increasing the equilibrating price with a fixed quantity of insurance) as discussed in Feldstein (19716).
20 See Appendix.
WELFARE LOSS OF HEALTH INSURANCE 261
The lagged dependent variables show that the demand for insurance adjusts quite slowly to changes in the explanatory variables. As might be expected, enrollment adjusts even more slowly than the quantity of insur- ance. The long-run elasticities are approximately six times the short-run elasticities in the EiVR equations and three times the short-run elasticities in the QINS equations.
The Interdependence between Insurance and the Price of Care
The previous section established the important impact of the price of care on the demand for insurance. lye continue our analysis of this interdepen- dent relation by examining the effect of insurance on the price of care.
The effect of insurance on the price of hospital care has been studied in some detail in a previous paper (Feldstein 1971b ) ." The mechanism dis- cussed there by which increased insurance raises the price of hospital care is summarized briefly by figure 1.
Quadrant I shows the number of bed days of care demanded ( B D D ) as a function of the price per patient day charged by the hospital (P) when quantity of insurance is fixed. Since the hospital is a nonprofit or-ganization," this price is equal to the average cost per patient day (C) minus whatever deficit the hospital can incur because of charitable contri-
BDS
"1 Although this section discusses hospital prices and insurance only, the same general point applies to physicians' services. Feldstein (1970) discusses the effect of insurance on the price of physicians' services.
'2 The analysis would have to be modified to deal with municipal hospitals and the small number of proprietary hospitals. The market is dominated, however, by the nonprofit institutions.
2 6 2 JOURNAL OF POLITICAL ECONOMY
butions and income from endowments.'"his is shown in the second quadrant. The cost that a hospital can incur per patient day determines the staff and facilities that it can employ. The hospital's decision makers select the input mix that maximizes the quality of care as they perceive it.24 This relation between cost and quality as perceived by the hospital (QH) is shown in the third quadrant. Finally, quadrant I V shows the set of feasible combinations of patient days ( B D D ) and quality ( Q H ) . The curve QB that bounds this set is, in effect, an opportunity locus or "budget constraint" for the hospital's long-run planning. The hospital selects its quantity and quality of services subject to this constraint. The chosen point on the opportunity locus reflects the particular preferences of the hospital decision makers, represented here by the indifference curve U'.25
The effect of an increase in insurance is to raise the demand curve for hospital services to a curve such as D'D' in figure 2 . At every price charged by the hospital, the net price paid by the patient is lowered by the increase in insurance, and the quantity demanded is therefore increased. This shift of the demand curve has the effect of shifting the QB opportunity locus further away from the origin (to Q'B'), permitting an increase in both quantity and quality. If both quantity and quality are "normal goods" in the preferences of the hospital, an increase in insurance raises both the price of care and quantity provided. Note that this does not depend on the usual mechanism by which increased demand raises price through
BDS
23 Deficits (and surpluses) are generally small and are considered here as exogenous except in the very short run.
24 I t is important to note that this is the quality of care as perceived by the hospital. I t need not have a comparable effect on patients' health or their perception of quality.
25 See Feldstein (1971b) for a number of clarifications and qualifications of this analysis. See also Klarman (1969) and Feldstein (1971d).
WELFARE LOSS OF HEALTH INSURANCE 263
higher profits and higher input costs. I t is primarily by inducing a change in the hospital's product that insurance raises its price.26
Figures 3a and 36 combine this relation of price as a function of insur- ance (the PP curve) with the relation of insurance as a function of price ( the I I curve) discussed in the previous two sections. Recall that the measure of the quantity of insurance, Q I X S as defined by equation ( I ) , can range between one for no insurance and infinity for complete insurance. I n figure 3a, the equilibrium elasticity of price with respect to insurance is less than the inverse of the elasticity of insurance with respect to price. The opposite is true in figure 3b. In both cases, the level of price that prevails in equilibrium exceeds the price that would have prevailed if there were no insurance.
Other properties of the system, including its dynamic stability and the qualitative effects on P and I of shifts in either of the functions, depend on a more precise specification. The dynamic version of the 11curve that
PCARE I
OiNS INSURANCE
L OlNS INSURANCE
26 See Feldstein (1971d) for a discussion of the effect on the wages of hospital employees.
2 64 JOURNAL OF POLITICAL ECONOMY
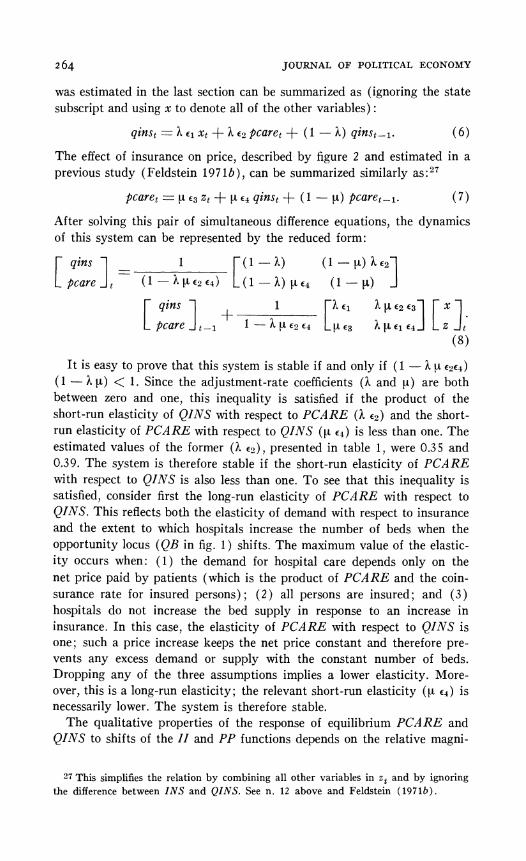
was estimated in the last section can be summarized as (ignoring the state subscript and using x to denote all of the other variables) :
ginst = 2. el xt + h cz pcare, + ( 1 - h ) ginstpl. ( 6 )
The effect of insurance on price, described by figure 2 and estimated in a previous study (Feldstein 197 1 b ), can be summarized similarly as:2T
After solving this pair of simultaneous difference equations, the dynamics of this system can be represented by the reduced form:
I t is easy to prove that this system is stable if and only if ( 1 - h p € 2 ~ 4 )
( I - h p ) < 1. Since the adjustment-rate coefficients ( I . and p) are both between zero and one, this inequality is satisfied if the product of the short-run elasticity of QINS with respect to PCARE (h €2) and the short- run elasticity of PCARE with respect to QINS (u €+) is less than one. The estimated values of the former (?, a ) ,presented in table 1, were 0.35 and 0.39. The system is therefore stable if the short-run elasticity of PCARE with respect to QINS is also less than one. To see that this inequality is satisfied, consider first the long-run elasticity of PCARE with respect to QINS. This reflects both the elasticity of demand with respect to insurance and the extent to which hospitals increase the number of beds when the opportunity locus ( Q B in fig. 1 ) shifts. The maximum value of the elastic- ity occurs when: (1 ) the demand for hospital care depends only on the net price paid by patients (which is the product of PCARE and the coin- surance rate for insured persons) ; ( 2 ) all persons are insured; and (3) hospitals do not increase the bed supply in response to an increase in insurance. In this case, the elasticity of PCARE with respect to QINS is one; such a price increase keeps the net price constant and therefore pre- vents any excess demand or supply with the constant number of beds. Dropping any of the three assumptions implies a lower elasticity. More- over, this is a long-run elasticity; the relevant short-run elasticity (u €4 ) is necessarily lower. The system is therefore stable.
The qualitative properties of the response of equilibrium PCARE and QINS to shifts of the ZI and PP functions depends on the relative magni-
27 This simplifies the relation by combining all other variables in z t and by ignoring the difference between INS and QINS. See n. 1 2 above and Feldstein (1971b).
WELFARE LOSS O F HEALTH INSURANCE 2 6 ~
tudes of the long-run elasticities of QINS with respect to PCARE and PCARE with respect to QINS. Equations (6) and ( 7 ) imply that figure 3a is relevant if c2 c4 < 1, that is, if the long-run elasticity of QINS with re- spect to PCARE is less than the inverse of the long-run elasticity of PCARE with respect to QINS. Table 1 shows that the estimated value of the former (Q)is approximately 1.2.28 The maximum value of €4 is one, but the most likely value is substantially less. For example, since all per- sons are not insured, a decrease in the coinsurance rate raises demand less than proportionately. The increased number of hospital beds as demand increases also lowers €4. Finally, there is evidence that the demand for care may be less sensitive to changes in insurance than to changes in the gross price of care. These three factors are likely to make €1 substantially less than one. I n figure 3a a change in any of the exogenous factors that raises the demand for insurance shifts the I I curve down and to the right. The effect of this is to raise the price of care and therefore to increase the quantity of insurance even more. Similarly, any factor that raises the demand for hospital services or that shifts the PP curve up for any other reason (e.g., a rise in the wages of hospital employees) induces an increase in QINS and therefore magnifies the effect on price.
Precise estimates of the extent to which interdependence magnifies these effects would require the full reduced-form equations for the health-care system. Lye can however obtain a useful approximation on the basis of our current analysis. Equation (8 ) implies that the equilibrium reduced-form PCARE equation is:
If a rise in PCARE did not induce an increase in insurance (i.e., ~2 = O), a 1 percent increase in z would cause PCARE to rise €3 percent. The inter- dependence of price and insurance causes PCARE to rise by ~ / ( 1 - €2 €4) percent. Even an estimate of E? as low as2W0.25 implies that the inter- dependence increases the price "multipliers," (i.e., the equilibrium reduced- form coefficients of the price equation) by more than 30 percent. A more likely value of c2 t4 > 0.5 implies that these multipliers are more than doubled.
Finally note that equation ( 9 ) implies that the interdependence of price and insurance raises the level of hospital prices directly (by way of the term cA cl x > 0) as well as by increasing the price multipliers.
28 Since the stability of the system actually depends on the relation between PC.4RE and INS (i.e., the ratio of price to net price which reflects the fact that the uninsured generally pay less than the full price) rather than QINS, the estimated value oi E ,
exceeds the relevant elasticity. This makes it more likely that figure 3a is appropriate. 29 See the previous paragraph.
266 JOURNAL OF POLITICAL ECONOMY
Assessment of the Welfare Effects of Reducing Insurance
This section derives a number of alternative estimates of the net welfare effect of reductions in the general level of health insurance. The welfare of a typical household would be lowered by its increased risk bearing, but i t would also be raised by the reduced distortion of prices (i.e., the artifically low price to patients and the inflated gross cost of care). To simplify the calculation of the net welfare effect, the gross gain from reduced price distortion is calculated first without regard to the uncertainty of expendi- ture. The gross loss of increased risk bearing is then calculated. The anal- ysis shows that the net effect of reduced insurance would most probably be a substantial gain.
The Gross Gain from Reduced Price Distortion3*
I t is clearest to begin by deriving an explicit measure of the welfare loss due to price distortion a t the current level of health insurance. The gain from partial reductions of the insurance can then be calculated.
The welfare loss due to price distortion is similar to the excess burden of an excise tax. However, the effect of insurance on the price and quality of care makes the analysis more complex. If we ignore these complexities, the calculation of the welfare loss is illustrated by figure 4. Point A identifies the equilibrium in the absence of insurance. Price Po is charged by hospitals
PRICE
I \
I I I I I o x i O U A N T T Y
30See Harberger (1964, 1971) for an explanation and defense of the types of assumption implicit in this analysis. I t is assumed in particular that the demand curves, which reflect the individual's preferences and his physician's advice, are appro-priate valuations of hospital care. Although health care has often been referred to as a merit good, with the implication that demand curves undervalue care, there is evidence that, even in the absence of insurance, patients would demand too much medical care because of a combination of uncertainty, fear, faith in science, and the advice of self-interested physicians. See Dubos (1959) for some important insights on this issue.
WELFARE LOSS O F HEALTH INSURANCE ~ 6 7
and paid by patients: the quantity (patient days) consumed is Xu. In- surance lowers the net price to @ Po and increases the quantity to XI.^^ The welfare loss is the shaded area, 112 (Po-@Po) ( X I -X o ) , repre- senting the difference between the cost of the additional care [Po (XI -XO)] and its value to consumers [ 1/2 ( X I -X,,) (Po +@Po)1 . A simple expression for the loss in terms of the elasticity of demand with respect to net price ( 1 1 ) and the total cost in the absence of insurance (Po Xo) can be derived as32
This analysis exaggerates the loss due to the increased quantity of pa- tient days of care consumed. Because insurance raises the gross price per patient day, the demand does not increase as much as it would if the gross price remained Po. The resulting change in the quality of care may, how- ever, shift the demand curve and partly offset the higher price. Moreover, the increased quality in itself also reduces the welfare loss. This more general analysis is shown in figure 5 .
Before the introduction of insurance, the price is Po, and the quantity is X,,.The introduction of insurance raises the equilibrium gross price to P I while the net price falls to 0 PI. The increased gross price (i.e., cost) per
"Thus 0 is the coinsurance rate and QI.VS = 8-1. "Mark Pauly has called my attention to an earlier paper of his (Pauly 1969) in
which an equation similar to (10) was used to estimate the gross welfare cost of health insurance. Tha t analysis did not consider either the effects of insurance on the price of care or the risk-reduction value of the insurance.
2 68 JOURNAL OF POLITICAL ECONOMY
patient day provides a service that is of higher quality as perceived by the hospital. If it is also of higher quality as perceived by the patients, the demand curve shifts upward. I n figure 5 the demand curve shifts from DD to D'D'. The price that patients would pay for the original number of patient days, ( X o )of the new and higher quality product is P2. At the price O PI, the equilibrium quantity is XI .
The shift to the post insurance equilibrium implies an extra cost of ( P I- Po) Xo +P1 ( X I - X,) . The extra benefit of this shift is (P2-Po) XU+ 10 PI + 1 ' 2 (P--@ P I ) ] ( X I -X o ) . The welfare loss is therefore33
L = ( P I- P,) X o + [PI ( 1 - 0 ) - 1/2 ( P , ! - - O P I ) ] ( X I - X o ) . ( 1 1 )
To derive a parametric expression suitable for calculating the welfare loss associated with different values of 0, we introduce the following nota- tion: let n = P1/Po measure the gross price change resulting from the introduction of insurance and a = ( P 2-P o ) / ( P 1-P o ) reflect the increase in quality as perceived by patients and as measured by the change in their willingness to pay for the original quantity of patient days relative to the change in cost. I t is clear from the analysis of the third section above that II > 1 and a < 1. Moreover, the small increase in patient days that has accompanied the great growth of insurance during the last 2 decades implies that the relevant values of II and a are such that the change in quantity is relatively small even when O becomes relatively low. Using the price elasticity 11 = (d X / d O P ) (0P / X ) evaluated a t Pa and the fact that ( X I-X , , )= - (P2 - O P1) ( a X / d O P ) , equation ( 1 1 ) can be written as:
This expresses the loss in terms of the unknown expenditure in the absence of insurance Po Xi) . I t will be convenient to replace Po Xi, by an expression in terms of the current actual expenditure, P, X,:
where the subscripts on II, and 0, indicate that these are the current
33 This calculation assumes that the demand function is linear.
WELFARE LOSS OF HEALTH INSURANCE 2 69
actual values. Although H, is uncertain, using equations (12 and (13) permits making a consistent assumption about the relation of II and 0.
To evaluate the potential gain from reduced insurance coverage, we now compare the loss associated with the current value of @ = 0.3334 to the losses with higher coinsurance rates of 0 = 0.50 and 0.67.35 TOassess the sensitivity of these estimates to the assumption about the behavioral param- eters (rl, a , and I I ) , the calculations will be presented for several values of each of these parameters. The price elasticity of demand will take the conservative values )11/= 0.4 and ill/ = 0.8.36 The demand shift parameter, a, will be assigned values over the very wide range: 0, 0.33, and 0.67. The value of II, that is, the ratio of gross price with insurance to gross price without insurance, will exceed one and will vary inversely with the coin- surance rate @. In the special case in which gross price varies so as to keep net price constant,3i II =0- ' . A more conservative estimate of the sensitivity of the welfare loss to the extent of insurance will also be calcu- lated by using II = 0 - I / < If the value of II is written 0-p, there are a total of 12 different combinations of q, a , and 0 for which the welfare comparisons have been calculated.
The results are presented in table 2. The dollar losses are based on 1969 private expenditure for hospital services ( P , X,) of $12.6 billion.3R Note that there is a substantial gross welfare loss, between $2.4 billion and $3.7 billion, even if a = 0.67. For a = 0.33, the loss is larger: between $4 billion and $6 billion, depending on the particular value of rl and fi.
The final columns of table 2 show the gain from raising (3 from its current value of 0.33 to values of 0.50 and 0.67. Using moderate and relatively conservative values of a between 0.33 and 0.67 implies that raising the coinsurance rate to 0.50 produces a gain of between $1.2 billion and $3.4 billion. If the coinsurance is raised to 0.67, the gain is between $1.9 billion and $4.8 billion.
54 In 1969 , private insurance paid 7 0 percent of the private expenditure for hospital care.
35 Raising the coinsurance rate is probably a suboptimal way of reducing insurance coverage. A greater net welfare gain could be achieved by the use of deductibles, varying coinsurance rates, and payments that are disease specific (see Zeckhauser 1970 , Feldstein 1971c , and Pauly 1 9 7 1 ) .
36The hospital demand study (Feldstein 1 9 7 1 b ) estimated Iql = 0 . 6 7 . This may be an underestimate because the higher net price observations probably correspond to higher gross price and therefore higher quality.
3 iThis has in iact been approximately true for the past 2 0 years. If net price is expressed in constant dollars, it rose by 4 percent between 1 9 5 0 and 1968 , from $12.20 to $12.64.
38Total hospital expenditures in 1969 were approximately $24 billion. Federal, state, and local governments pay approximately half of these costs. Although some of this is for mental hospitals and other special long-stay programs, a substantial amount is for general hospital care. The calculations therefore understate the welfare loss by ignoring the excess cost of government programs. Moreover, only the distortive effects of private insurance are taken into account.
JOURNAL OF POLITICAL ECONOMY
TABLE 2
WELFAREGAINSFROM REDUCEDPRICEDISTORTION
Loss FOR GAIN*FROM 0 EQUALTO RAISING0 TO
0.33 0.50 0.67 0.50 0.67 lrll a P ($ Millions) ($ Millions)
Based on 1969 private hospital expenditure of $12.6 billion
The Gross Loss from Increased Risk Bearing
We now derive a measure of the welfare loss due to the increased risk that the household bears if the coinsurance rate rises from 0.33 to 0.50 and to 0.67. An increase in the coinsurance rate actually has two effects on the household's risk. For a given probability distribution of expenditure, the risk is obviously increased. But the higher average coinsurance rate implies a lower gross price and a smaller quantity of services purchased. These reduce the risk. Although the net effect is likely to be an increase in risk bearing, this need not be so. Our analysis will estimate the effect on risk bearing for the different parameter combinations of y , a, and 0 that were considered in the preceding section. The estimated effect on risk bearing will therefore be directly comparable with the price distortion effects of table 2.
The difference in a household's risk bearing between two different coin-surance rates can be expressed in terms of the maximum premiums that they would pay to avoid this risk. More specifically, let the expected utility of a household with income3QY and uncertain medical expenditure 2 be
N
E [ U ( Y -X)] .40 An insurance policy with premium qi %nd coinsurance rate Oiraises the expected utility to E [L7 ( Y - qi-04 Xi)1.
The "cost of risk bearing" with coinsurance rate Oimay be defined as
39 I t would in principle be preferable to use wealth (including current income) or to use a multiperiod framework. This would reduce the value of insurance for any utility function with decreasing risk aversion.
40 This ignores the problem that the utility of income may be a function of the state of health. See n. 6 above.
WELFARE LOSS O F HEALTH INSURANCE 2 7 1
the maximum premium (9,") that the household would pay to avoid the uncertain expenditure. That is, q," is defined by:
N
U ( Y - 9 , - 9 , " ) = E [ U ( I 7 - 9 , - O X , ) ] . ( 1 4 )
Note that in defining q? i t is assumed that the uncertain expenditure is X, . that is, the hypothetical complete insurance is a mental experiment and does not change the actual gross expenditure. The "net cost of r$k bearing" with coinsurance rate 0,may then be defined as q,* -E ( @ ,X,), that is, the excess of the maximum premium over the actuarial value. The value of the loss from increased risk bearing when the coinsurance rate rises from 0 , to 0, is the difference between net cost of risk bearing with 0, and the net cost of risk bearing with O,,
V = q * - Q,* -E 0,2,+ E 0,2,. (15)
The utility function ~ i t h constant absolute risk aversion,"l U ( Y )= e-RF, is convenient for analyzing this problem. Substituting into equation (14) implies that qtx is defined by
e-R(Y-r i l -~ t ' ) = E[e-R(Y-ri,-€l Y ,v
t ' l , ( 1 6 ) or
ex qt* = EeR 0 xl. ,.,
( 1 7 )
The household's gross welfare loss ( V ) due to increasing the coinsurance rate from Oi to Oj therefore satisfies
To calculate these expected values, we require a model of the stochastic behavior of annual household expenditure for hospital care, conditional on each of the two values of the coinsurance rate. Above, it was suggested that the relation between the price of care, the coinsurance rate, and the price in the absence of insurance ( P o ) be represented by
where the maximum value of is 1 and the most likely values lie between 0.5 and 1.0. The average quantity of care, that is, the average number of patient days per family (D) , is:
where Do is the average days of care in the absence of insurance.42 The average expenditure is therefore:
41 The parameter R is a measure of the absolute risk aversion (see Pratt 1964 and Arrow 1965).
42 Neither Po nor Do is actually required in the calculations that follow.
2 7 2 JOURNAL OF POLITICAL ECONOMY
The actual number of patient days in a family depends on the number of times that household members are hospitalized and the duration of stay on each of these occasions. The poissonNprocess provides a reasonable model for the number of hospitalizations, Ni.43 The durations of stay on these
N
occasions, S,, will be assumed to follow independent gamma distribution^.^^ Together these assumptions imply that
The probability of N hospitalizations is given by HAT= e c M i M,"/N! where M i is the mean number of hospitalizations per household with co-insurance rate Oi. Since the durations of stay are inde~endent?~
The expectation on the right-hand side of equation (23) is the moment- generating function of the gamma variabIe ? and may therefore be written:
where the mean of 3 equals yi 6 j and the variance of S N
equals yi2 6i. If changes in insurance alter the mean and variance but not the relative vari- ance of the distribution (i.e., if stays are increased proportionately as they would with constant elasticity), the value of 6 is not a function of the co- insurance rate. This assumption will be used in the analysis that follows.
Equations (24) and (22) yield
The expected expenditure can be written in terms of the parameters of the stochastic process as:
43For previous applications of the poisson process to hospital admissions, see Bailey (1957) and Rosenthal (1964). Its use in the current context ignores intrafamily and intertemporal correlations. Both are unlikely to have more than a small effect when the time interval is a year.
"The y distribution can provide a good approximation to the highly skewed distribution of stays. The assumption of independence is obviously reasonable for stays of different individuals. For the same individual on different occasions, inde-pendence is more likely for unrelated illness than for related illnesses.
45Equation ( 2 2 ) also reflects the fact that SO is identically zero.
WELFARE LOSS OF HEALTH INSURANCE 273
Substituting (25) and (26) into (18) and taking logarithms yields an expression for the welfare loss of increased risk bearing:46
We need to evaluate equation (27) for Oi equal to the current value (0.33) and O j equal to 0.50 and 0.67. The current values of Pi,Mz, yi, and 6 can be estimated from available data in a way to be described below. The value of Pi can be calculated from Pi with equation (19). Equation (20) permits the calculation of the product Mjyj6 (i.e., the mean number of days of hospital care if @ = O j ) from the observed Miyi but does not provide separate estimates of M j and y j . A previous study of the price elasticity of demand for hospital care (Feldstein 1971b) found that the elasticity of the admissions rate with respect to price is approximately twice the elasticity of the mean stay per admission with respect to price. The values of M j and yj are, therefore, calculated by assuming that the proportional change in Mi is twice the proportional change in yj and that the product M j y j is related to Miyi in the way indicated by equation (20).47
Data collected by the National Center for Health Statistics (1971) indicate that the mean duration of stay in 1969 was 8.4 days.4s An earlier survey (National Center for Health Statistics 1966) provides the data with which to calculate the skewness parameter of the gamma distribution of stays per admission; 6 = 0.42.49 The mean stay of 8.4 days then implies that yi = 20. The average annual number of hospitalizations depends on the family size; for a family of four persons less than 65 years old, Mi = 0.47 (National Center for Health Statistics 1971). Since there were 180 million persons under age 65 in 1969, the total welfare effects of increasing the coinsurance rate will be calculated by multiplying the value per family ( V ) by 45 million.50 The average hospital cost per patient day was $71 in 1969. The total cost of $12.6 billion used above is the product of this price
46 Recall that the risk bearing may actually decrease, making the welfare change a welfare gain.
47 More specifically, ln(Mj/Mi)= 2 ln(yj/yi).
48 This excludes persons 65 years old and over (who are covered by Medicare) as well as persons who died in the hospital or were patients in special long-stay insti-tutions.
4Qecall that 6 is the inverse of the relative variance of the duration of stay and is assumed to be unaffected by the coinsurance rate.
"The average family actually contains fewer than four persons. The assumption of 45 million four-person families increases the risk per family and therefore the loss from increasing the coinsurance rate.
274 JOURNAL O F POLITICAL ECONOMY
($71)) the admission rate (0.47), the mean stay (8.4). and the total number of families (45 million) .51
The only remaining parameter needed to calculate V in equation (27) is R , the coefficient of risk aversion. I t is perhaps easiest to derive reason- able values of R by considering a simple bet. A man who is willing to participate in a fair bet in which there is an even chance of winning and losing $1,000 has R = 0 and would place no value on insurance. If he requires a side payment of $50 to make such a bet (i.e., if he requires odds of $1,050 to $950), his risk aversion is 0.0001.52 If he requires a side pay- ment of $150 (i.e., if he is just indifferent between no bet and even chance of winning $1,150 and losing $850), his risk aversion is R = .0003. A very risk-averse individual who requires 2: 1 odds in order to make the bet (i.e., a side payment of $333 so that there is an even chance of winning $1,333 and losing $667), has a risk aversion of R = .0007. The calculations of the welfare loss of increased risk bearing have been done for these values of R.53
Table 3 presents the estimated welfare losses associated with increased risk bearing when @ goes from 0.33 to 0.50 and 0.67. Separate estimates are shown for the 12 combinations of 11, a , and (3 and for the three values of R.
For a = 0, that is, when the change in inputs associated with higher costs per patient day does not cause the demand curve to shift, an increase in the coinsurance rate actually decreases average expenditures sufficiently to decrease overall risk bearing. A decrease in risk bearing also occurs with a = 0.33 if the price is sufficiently sensitive to @ (i.e., for a high value of (3) and the demand is sufficiently insensitive to the lowering of price (i.e., a low value of 1111). Even if a = 0.67, a sufficient increase in @ can reduce the risk bearing.
The most likely values of 1111, a , and (3 are a low elasticity of demand with respect to both price and inputs and a high sensitivity of price with respect to @. As we have just seen, these are the conditions which tend to make an increase in @ actually lower the amount of risk bearing. The re- mainder of table 3 shows how much risk bearing increases if these condi-
51The $12.6 billion is very close to the estimate of $12.1 billion prepared by the Social Security Administration.
52The value of R is found by solving the equation U(yo) = U(y, - 1,000 + 50) + % U(yo + 1,000 + 50) or, more specifically, exp[--Ryo1 =% exp[-R(y,, -1,000 + 50) 1 + % exp[-R(y,,.t 1,000 + 50) I . The assumption of constant absolute risk aversion implies that the ln~t ia l income y,, does not affect the value of R . j3Perhaps intuition is aided if these absolute risk-aversion parameters are related
to proportional risk-aversion parameters ( Y yu"/uf) a t a family income of $10,000. Since r = yR, the three values of R discussed above correspond to proportional risk aversion parameters of 1, 3, and 7. Note also that these are the implied local elasticities of the marginal utility function. This suggests that 1 and 3 are likely to be more reasonable than 7 .
WELFARE LOSS OF HEALTH IXSURANCE
TABLE 3
&'ELFARE LOSSF R O M RISK BEARINGIKCREASED
LOSSF R O M RAISING LOSSFROM RAISIKG 0 to 0.50 B to 0.67
($ MILLIOXS) ( $ ~ ~ L L L I O N S )
R = R = R E R = R = R =1 % a fl 0001 ,0003 ,0007 ,0001 0003 ,0007
NOTE.-Based on 1969 private hospital expenditure of $12.6 billion. Negative values indicate welfare gains.
tions are not satisfied. For risk-aversion coefficients below R = .0003, rais- ing @ to 0.50 increases risk bearing by a maximum value of $2.4 billion. Raising @ to 0.67 yields a maximum increased risk of $3.6 billion. With the much more risk-average coefficient of R = .0007, the increases reach $2.8 billion and $4.1 billion. To interpret these numbers i t is necessary to compare them with the gains from reduced price distortion that were re-ported in table 2.
The Net Welfare Gain from Reducing Insurance
Table 4 shows the difference between the welfare gains from reduced price distortion and the welfare loss from increased risk bearing. For the more plausible values (low 1111 and a, high P and R 5 .0003), the estimates indicate very large gains from reducing insurance. For a = 0, the gains range between 54.3 billion and $8.9 billion. For a = 0.33, the gains range between $0.5 billion and $5.9 billion, with an average value of $3.0 billion. Only with a high value of a , a high price elasticity ( / q = OX), and a low sensitivity of price to insurance ((3 = 0.5) do the estimates indicate a welfare loss from reduced insurance. These estimates are relatively insensi- tive to changes in the risk-aversion coefficient. In short, the overall analysis suggests that the current excess use of health insurance produces a very substantial welfare loss.54
54 For a variety of reasons that have been noted above, e.g.. the exclusion of public insurance and nonhospital care, these values are likely to understate the true welfare loss.
2 7 6 JOURNAL O F POLITICAL ECONOMY
TABLE 4
lrll a fi
Loss FROM RAISIXG 8 to 0.50
($ MILLIOBS)
R = R E R = ,0001 0003 ,0007
Loss FROM RAISIBG 8 to 0.67
($ MILLIONS)
R = R = R = ,0001 ,0003 ,0007
NOTE.-Based on 1969 private hospital expenditure of $12.6 billion. Negative values indicate welfare losses.
These calculations have, of course, used the assumption that insurance pays a fixed proportion of all expenses. Although this is a convenient simplification for the analysis of this paper, it is not a fully accurate de- scription of the typical insurance coverage. Health insurance provides very complete reimbursement for relatively small and moderate hospital bills but is generally quite inadequate for the small proportion of families that have very large e ~ p e n s e s . ~ T h i s implies that the values of table 4 are underestimates of the potential welfare gains since they are based on under- estimates of the current price distortion and overestimates of the current protection against risk.
Conclusions
The analysis and conclusions of this paper can be summarized briefly. The first two sections specified and estimated a structural equation for the demand for health insurance. The parameter estimates indicate that an increase in the price of hospital care causes a substantial increase in the demand for insurance. The following section then examines the interrela- tion between the purchase of insurance and the demand and supply of hospital care. There is mutually reinforcing behavior: more insurance
j 5 A 1963 national survey (Andersen and Anderson 1967) found that among in-sured iamilies with medical expenditures in the top 20 percent of the national distribution, only one-third received insurance benefits exceeding half of their expenditures while another third received benefits of less than one-fifth of their expenditures.
WELFARE LOSS OF HEALTH INSURANCE 2 7 7
increases the price of care, and a higher price of care increases the demand for insurance. Although the system is dynamically stable (nonexplosive), the interdependence between insurance and the price of care implies that there is more insurance and a higher price of care than would otherwise prevail. This interdependence also increases the effect of changes in any exogenous variable on both the price of care and the level of insurance.
The final section estimates the welfare gains that would result from decreasing insurance by raising the average coinsurance rate from 0.33 to 0.50 or 0.67. The gross welfare gain from reduced price distortion and the gross welfare loss from increased risk bearing are calculated separately and compared. Estimates are provided for a wide range of parameter values. The most likely values imply net gains in excess of $4 billion per year.56 Even a rather conservative selection of parameter values implies net gains of approximately $2-$3 billion. Only if the demand for care is quite sensi- tive to the level of resource inputs per day and to the price of care while the price of care is quite unresponsive to the average level of insurance would the welfare loss of additional risk bearing due to an increase in the coinsurance rate outweigh the welfare gains of reduced price distortion.
I t seems reasonable to conclude that an increase in the average co-insurance rate would increase welfare and that the net gain would probably be quite substantial. Moreover, a more general restructuring of the form of health insurance, reducing its role as a method of prepaying small and moderate hospital bills, and increasing its role in protecting against the major financial risks of very large health expenses, could produce even greater gains.67
Appendix
Measurement of State Income Distribution
This Appendix describes the use of survey data to derive a single variable mea- sure of the state's income distribution that is particularly relevant to the demand for health insurance. This variable was referred to in the text as INSINC.
Let the function h(y)represent the probability that a household with income y is insured, and let f(y) be the relative frequency distribution of incomes in a particular state. The effect of this income distribution on the proportion of households in the state that are insured may be represented by the integral $ h(y) f(y) dy, that is, the weighted average of the insurance probabilities with the income density as weights.
Values of hiy), the proportions of households at each income level that are insured, were estimated in a national survey of approximately 42,000 households (National Center for Health Statistics 1967). This survey data can be well repre- sented by a function of the form h(y) = 1 - k e - a v , that is, as income rises the probability of being insured tends to 1. The parameters k and a can be estimated with the regression equation
56 These are based on 1969 private hospital care expenditure of $12.6 billion. 57 See Feldstein (1971~) and Feldstein, Friedman, and Luft (1972) for the analysis
of such a proposal to restructure health insurance.
2 78 JOURNAL OF POLITICAL ECONOMY
l o g [ l - h ( y ) ]= l o g k - a l o g y ,
using the income classes in the survey as observations. The estimated values are k = 7,956 and a = 0.6192.
Substituting this form of h ( y ) into the income-insurance integral yields:
IA7SZNC=$ ( 1 - k e-a" ) ( y ) d y = 1 - k $ e-"v f ( y ) d y . (A2)
The final integral is the moment-generating function for the income distribution f(y) with "dummy" parameter -a. Using the log-normal distribution to ap-proximate f (y) implies
I N S I N C = 1 - k ( 1 + p)a(a+1)/2y-a ('43)
where y is the mean income in the state and is the relative variance of income (the ratio of its variance to y2).
The value of for the nation as a whole has, like other measures of income inequality, remained nearly constant for the period 1959-65. As a further ap- proximation, the value of has also been assumed to be equal among the states. An estimate of p 70.55 was used in practice. This implies that I N S I N C for each year and state is a function of y and the parameters k and a. The values of this variable derived from equation (A3) were used in the estimates presented in the second section of the text.
References
American Hospital Association. Hospitals, Journal of the American Hospital Association, Guide Issue, Part 11 (issues from 1950-65).
Andersen, R., and Anderson. 0.W. A Decade of Health Services. Chicago: Univ. Chicago Press, 1967.
Arrow, Kenneth J. "Uncertainty and the Welfare Economics of Medical Care." A.E.R. 53, no. 5 (December 1963): 941-73.
. "The Role of Securities in the Optimal Allocation of Risk-bearing." Rev . Econ. Studies 3 1 (April 1964) : 91-96.
. Aspects o f the Theory of Risk Bearing. Yrjo Jahnsson Lectures. Hel- sinki: Yrjo Jahnsson Found., 1965.
Bailey, N. T . J. "Operational Research in Hospital Planning and Design." OF-erational Res. Q. (1957), p. 149.
Balestra, P., and Nerlove, M. "Pooling Cross-Section and Time-Series Data in the Estimation of a Dynamic Model: The Demand for Natural Gas." Econo-m e t r i c ~34 (July 1966) : 585-612.
Borch, K. H . T h e Economics of Uncertainty. Princeton, N.J.: Princeton Univ. Press, 1968.
Dubos, Rene. Mirage o f Health. New York: Harper, 1959. Ehrlich, I.. and Becker, G. S. "Market Insurance. Self-Insurance and Self-
Protection." J.P.E. 80 (JulyIAugust 1972) : 623-48. Feldstein, M. S. "The Use of an Econometric Model for Health Sector Plan-
ning." In Federal Programs for the Development o f Hzlman Resources: A Compendium of Papers Submitted to the Szlbcomntittee o n Economic Progress of the Joint Economic Committee. Washington: Government Printing Office, 1968.
, "The Rising Price of Physicians' Services." Rev . Econ. and Statis. 52, no. 2 (May 1970) : 121-33.
WELFARE LOSS OF HEALTH INSURANCE 279
. "An Econometric Model of the Medicare System." Q.J.E. 85, no. 1 (February 1971) : 1-20. ( a )
. "Hospital Cost Inflation: A Study in Yonprofit Price Dynamics." A.E.R. 61, no. 5 (December 1971) : 853-72. ( b )
. "A New Approach to National Health Insurance." Public Interest 23 (Spring 1971) : 93-105. (c)
. The Rising Cost of Hosfi tal Care. Washington: Information Resources Press (for Dept. Health, Educ., and Welfare), 1971. ( d )
Feldstein, M. S., and Allison, E . "Tax Subsidies of Private Health Insurance: Distribution, Revenue Loss and Effects." Harvard Institute of Economic Research Discussion Paper No. 237. Mimeographed. 1972.
Feldstein, M. S.; Friedman, B. S.; and Luft, H. "Distributional Aspects of Na- tional Health Insurance Benefits and Finance." &vat. Tax J . (December 1972).
Friedman, B. S. "A Study of Uncertainty and Health Insurance." Ph.D. disser- tation, Massachusetts Inst. Tech., 1971.
Gould, J. P. "The Expected Utility Hypothesis and the Selection of Optimal Deductibles for a Given Insurance Policy." J. Bus. 42. no. 2 (April 1969) : 143-51.
Harberger, A. C. "The Measurement of Waste." A.E.R. 54 (May 1964) : 58-76. . "Three Basic Postulates for Applied IVelfare Economics." J . Econ. Lit .
9, no. 3 (September 1971) : 785-97. Health Insurance Institute. Source Book of Health Insurance Data. New York:
Health Insurance Inst., 1959-68. Hotelling, H. "The General Welfare in Relation to Problems of Taxation and of
Railway and Utility Rates." Econometrica 6 (July 1938) : 242-69. Houthakker, H . S., and Taylor, L. D. Consumer Demand in the United States,
1929-1970. Cambridge, Mass. : Harvard Univ. Press, 1966. Klarman, H. E. "Reimbursing the Hospital: The Differences the Third Party
Makes." J. Risk and Insurance 36 no. 5 (December 1969'1 : 553-66. Mossin. J. ".i\spects of Rational Insurance Purchasing." J.P.E. 76, no. 4, pt. 1
(July/August 1968) : 553-68. National Center for Health Statistics. Hospital Discharges and Length o f S tay:
Short-Stay Hospitals, United States-July 1963-June 1964. Nat. Center Health Statis. series 10, no. 30. Washington: Government Printing Office, 1966.
. Family Hospital and Surgical Insurance Coverage United States-July 1962-June 1963. Nut . Center Health Statis. series 10, no. 42. Washington: Government Printing Office, 1967.
. Current Estimates from the Health Interview Survey, United Sfates- 1969. Nu t . Cellter Health Stntis, series 10, no. 63. T\'ashington: Government Printing Office, 1971.
Pashigian. B. P.; Schkade, L. L . ; and Menefee. G. H. "The Selection of an Optimal Deductible for a Given Insurance Policy." J. BUS. 39, no. 1, pt. 1 (January 1966) : 35-44.
Pauly, M. "The Economics of Moral Hazard.'! A.E.R. 53, no. 3 (June 1968): 531-37.
. "A Measure of the Welfare Cost of Health Insurance." Health Services Res . (Winter 1969) : 281-92.
. Medical Care at Public Expense. New York: Praeger, 1971. Pratt, J. U7."Risk Aversion in the Small and in the Large." Econometrica 32
(January-April 1964) : 122-36.
2 80 JOURNAL OF POLITICAL ECONOMY
Rosenthal, G. D. The Demand for General Hospital Facilities. Hospital Mono- graph Series no. 14. Chicago: American Hospital Assoc., 1964.
Schelling, T. C. "The Life You Save May Be Your Own." In Problems in Pzdblic Expenditz~re Analysic, edited by S. B. Chase, Jr. Washington: Brookings Inst., 1968.
Smith, V. L. "Optimal Insurance Coverage." J.P.E. 76, no. 1 (January/February 1968) : 68-77.
Zeckhauser, Richard. "Medical Insurance: A Case Study of the Tradeoff be-tween Risk Spreading and Appropriate Incentives." 1. Econ. Theory 2 , no. 1 (March 1970): 10-26.
You have printed the following article:
The Welfare Loss of Excess Health InsuranceMartin S. FeldsteinThe Journal of Political Economy, Vol. 81, No. 2, Part 1. (Mar. - Apr., 1973), pp. 251-280.Stable URL:
This article references the following linked citations. If you are trying to access articles from anoff-campus location, you may be required to first logon via your library web site to access JSTOR. Pleasevisit your library's website or contact a librarian to learn about options for remote access to JSTOR.
[Footnotes]
1 The Selection of an Optimal Deductible for a Given Insurance PolicyB. Peter Pashigian; Lawrence L. Schkade; George H. MenefeeThe Journal of Business, Vol. 39, No. 1, Part 1. (Jan., 1966), pp. 35-44.Stable URL:
1 The Expected Utility Hypothesis and the Selection of Optimal Deductibles for a GivenInsurance PolicyJohn P. GouldThe Journal of Business, Vol. 42, No. 2. (Apr., 1969), pp. 143-151.Stable URL:
2 The General Welfare in Relation to Problems of Taxation and of Railway and Utility RatesHarold HotellingEconometrica, Vol. 6, No. 3. (Jul., 1938), pp. 242-269.Stable URL:
2 The Selection of an Optimal Deductible for a Given Insurance PolicyB. Peter Pashigian; Lawrence L. Schkade; George H. MenefeeThe Journal of Business, Vol. 39, No. 1, Part 1. (Jan., 1966), pp. 35-44.Stable URL:
4 The Selection of an Optimal Deductible for a Given Insurance PolicyB. Peter Pashigian; Lawrence L. Schkade; George H. MenefeeThe Journal of Business, Vol. 39, No. 1, Part 1. (Jan., 1966), pp. 35-44.Stable URL:
17 Pooling Cross Section and Time Series Data in the Estimation of a Dynamic Model: TheDemand for Natural GasPietro Balestra; Marc NerloveEconometrica, Vol. 34, No. 3. (Jul., 1966), pp. 585-612.Stable URL:
30 Three Basic Postulates for Applied Welfare Economics: An Interpretive EssayArnold C. HarbergerJournal of Economic Literature, Vol. 9, No. 3. (Sep., 1971), pp. 785-797.Stable URL:
The Role of Securities in the Optimal Allocation of Risk-bearingK. J. ArrowThe Review of Economic Studies, Vol. 31, No. 2. (Apr., 1964), pp. 91-96.Stable URL:
Pooling Cross Section and Time Series Data in the Estimation of a Dynamic Model: TheDemand for Natural GasPietro Balestra; Marc NerloveEconometrica, Vol. 34, No. 3. (Jul., 1966), pp. 585-612.Stable URL:
The Expected Utility Hypothesis and the Selection of Optimal Deductibles for a GivenInsurance PolicyJohn P. GouldThe Journal of Business, Vol. 42, No. 2. (Apr., 1969), pp. 143-151.Stable URL:
Three Basic Postulates for Applied Welfare Economics: An Interpretive EssayArnold C. HarbergerJournal of Economic Literature, Vol. 9, No. 3. (Sep., 1971), pp. 785-797.Stable URL:
The General Welfare in Relation to Problems of Taxation and of Railway and Utility RatesHarold HotellingEconometrica, Vol. 6, No. 3. (Jul., 1938), pp. 242-269.Stable URL:
The Selection of an Optimal Deductible for a Given Insurance PolicyB. Peter Pashigian; Lawrence L. Schkade; George H. MenefeeThe Journal of Business, Vol. 39, No. 1, Part 1. (Jan., 1966), pp. 35-44.Stable URL: