The Growth of Agricultural Protection in Europe in the 19th and 20th Centuries Johan F. M. Swinnen LICOS Centre for Institutions and Economic Performance, and Department of Economics, University of Leuven (KUL) 1. INTRODUCTION T HE collapse of the Doha trade negotiations in the summer of 2008, again, put the spotlight on two important realities of international trade policy. The first is that, despite the strong decline of agriculture in terms of employment and output in rich countries, agriculture remains disproportionately important to rich countries in their trade negotiations – even to the extent that they are willing to let the WTO negotiations collapse over disputes on agricultural policy. The sec- ond reality is that despite hundreds of years of economists’ arguing the optimal- ity of free trade, political factors are more important than these economic arguments in both rich and poor countries. The political economy of agricultural policy is crucial to understanding the positions of the developing and developed countries in their trade negotiations, as well as their apparent inability to reform unilaterally or to reform as part of a broader trade negotiation outcome. Europe is a fascinating case for the study of growth in agricultural protection because it has gone from one extreme to another in the course of one century. European countries currently spend tens of billions of euros annually – the EU alone more than 50 billion – on subsidising their farmers and protecting farm- ers against imports from other countries through import tariffs. While countries such as Norway and Switzerland also heavily protect farmers, the most impor- I thank Kym Anderson, Sabine Bernabe, Harry de Gorter, David Harvey, Alessandro Olper, and participants at conferences at the World Bank and in Ghent (EAAE) for useful comments on an earlier version of the paper; and Liesbeth Colen, Els Compernolle, Anja Crommelynck, Gunilde Simeons and Joris Stiers for assistance with the data collection and analysis. The research project was financially supported by the World Bank, the Flemish Research Foundation (FWO) and the KU Leuven Research Council (OT, EF and Methusalem projects). The World Economy (2009) doi: 10.1111/j.1467-9701.2009.01247.x Ó 2009 The Author Journal compilation Ó 2009 Blackwell Publishing Ltd, 9600 Garsington Road, Oxford, OX4 2DQ, UK and 350 Main Street, Malden, MA 02148, USA 1499 The World Economy
Transcript
The World Economy (2009)doi: 10.1111/j.1467-9701.2009.01247.x
The World Economy
The Growth of Agricultural
Protection in Europe in the 19th and
20th Centuries
Johan F. M. Swinnen
LICOS Centre for Institutions and Economic Performance, and Department of Economics,
University of Leuven (KUL)
1. INTRODUCTION
THE collapse of the Doha trade negotiations in the summer of 2008, again,
put the spotlight on two important realities of international trade policy. The
first is that, despite the strong decline of agriculture in terms of employment and
output in rich countries, agriculture remains disproportionately important to rich
countries in their trade negotiations – even to the extent that they are willing to
let the WTO negotiations collapse over disputes on agricultural policy. The sec-
ond reality is that despite hundreds of years of economists’ arguing the optimal-
ity of free trade, political factors are more important than these economic
arguments in both rich and poor countries. The political economy of agricultural
policy is crucial to understanding the positions of the developing and developed
countries in their trade negotiations, as well as their apparent inability to reform
unilaterally or to reform as part of a broader trade negotiation outcome.
Europe is a fascinating case for the study of growth in agricultural protection
because it has gone from one extreme to another in the course of one century.
European countries currently spend tens of billions of euros annually – the EU
alone more than 50 billion – on subsidising their farmers and protecting farm-
ers against imports from other countries through import tariffs. While countries
such as Norway and Switzerland also heavily protect farmers, the most impor-
I thank Kym Anderson, Sabine Bernabe, Harry de Gorter, David Harvey, Alessandro Olper, andparticipants at conferences at the World Bank and in Ghent (EAAE) for useful comments on anearlier version of the paper; and Liesbeth Colen, Els Compernolle, Anja Crommelynck, GunildeSimeons and Joris Stiers for assistance with the data collection and analysis. The research projectwas financially supported by the World Bank, the Flemish Research Foundation (FWO) and the KULeuven Research Council (OT, EF and Methusalem projects).
� 2009 The AuthorJournal compilation � 2009 Blackwell Publishing Ltd, 9600 Garsington Road,Oxford, OX4 2DQ, UK and 350 Main Street, Malden, MA 02148, USA 1499
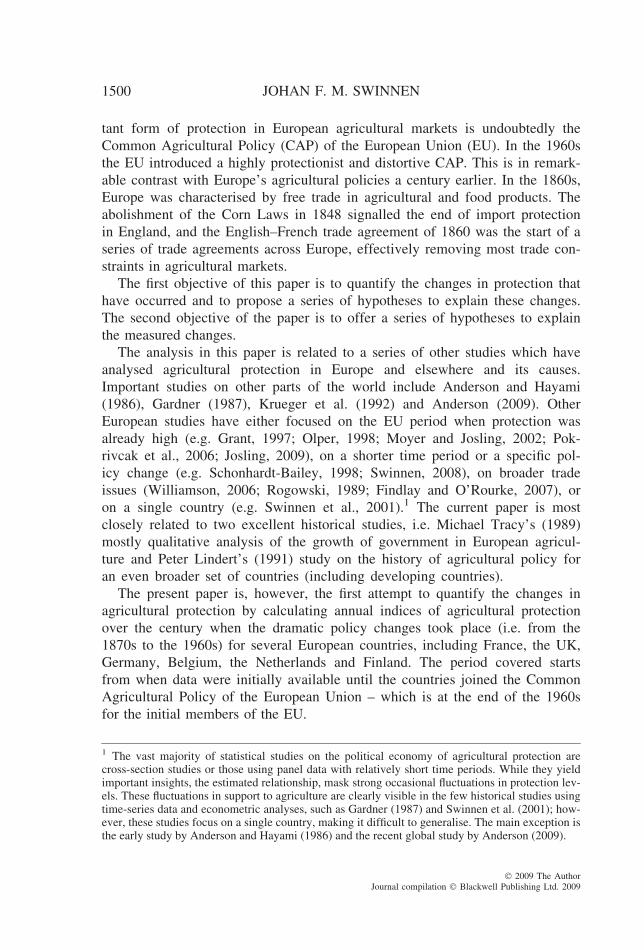
1500 JOHAN F. M. SWINNEN
tant form of protection in European agricultural markets is undoubtedly the
Common Agricultural Policy (CAP) of the European Union (EU). In the 1960s
the EU introduced a highly protectionist and distortive CAP. This is in remark-
able contrast with Europe’s agricultural policies a century earlier. In the 1860s,
Europe was characterised by free trade in agricultural and food products. The
abolishment of the Corn Laws in 1848 signalled the end of import protection
in England, and the English–French trade agreement of 1860 was the start of a
series of trade agreements across Europe, effectively removing most trade con-
straints in agricultural markets.
The first objective of this paper is to quantify the changes in protection that
have occurred and to propose a series of hypotheses to explain these changes.
The second objective of the paper is to offer a series of hypotheses to explain
the measured changes.
The analysis in this paper is related to a series of other studies which have
analysed agricultural protection in Europe and elsewhere and its causes.
Important studies on other parts of the world include Anderson and Hayami
(1986), Gardner (1987), Krueger et al. (1992) and Anderson (2009). Other
European studies have either focused on the EU period when protection was
already high (e.g. Grant, 1997; Olper, 1998; Moyer and Josling, 2002; Pok-
rivcak et al., 2006; Josling, 2009), on a shorter time period or a specific pol-
icy change (e.g. Schonhardt-Bailey, 1998; Swinnen, 2008), on broader trade
issues (Williamson, 2006; Rogowski, 1989; Findlay and O’Rourke, 2007), or
on a single country (e.g. Swinnen et al., 2001).1 The current paper is most
closely related to two excellent historical studies, i.e. Michael Tracy’s (1989)
mostly qualitative analysis of the growth of government in European agricul-
ture and Peter Lindert’s (1991) study on the history of agricultural policy for
an even broader set of countries (including developing countries).
The present paper is, however, the first attempt to quantify the changes in
agricultural protection by calculating annual indices of agricultural protection
over the century when the dramatic policy changes took place (i.e. from the
1870s to the 1960s) for several European countries, including France, the UK,
Germany, Belgium, the Netherlands and Finland. The period covered starts
from when data were initially available until the countries joined the Common
Agricultural Policy of the European Union – which is at the end of the 1960s
for the initial members of the EU.
1 The vast majority of statistical studies on the political economy of agricultural protection arecross-section studies or those using panel data with relatively short time periods. While they yieldimportant insights, the estimated relationship, mask strong occasional fluctuations in protection lev-els. These fluctuations in support to agriculture are clearly visible in the few historical studies usingtime-series data and econometric analyses, such as Gardner (1987) and Swinnen et al. (2001); how-ever, these studies focus on a single country, making it difficult to generalise. The main exception isthe early study by Anderson and Hayami (1986) and the recent global study by Anderson (2009).
� 2009 The AuthorJournal compilation � Blackwell Publishing Ltd. 2009
AGRICULTURAL GROWTH PROTECTION IN EUROPE 1501
In the second part of the paper I will relate the variations in protection indi-
cators to changes in policies and protection to changes in political institutions
and organisations, economic development, and specific events, such as the two
world wars. I propose a set of hypotheses on the causes of the changes in pro-
tection and relate those to insights from the literature on the political economy
of agricultural protection.2
2. MEASURING AGRICULTURAL PROTECTION
There are several indicators (methodologies) that can be used to measure
sectoral protection.3 To generate a comparable set of numbers over extended
periods and a range of countries, the preferred methodology needs to be rela-
tively simple and somewhat flexible (Anderson et al., 2008). For this reason,
I follow Anderson et al.’s (2008) approach in measuring agricultural protection
by calculating the nominal rate of assistance (NRA). The NRA is defined as
the percentage share by which government policies have raised (or lowered)
gross returns to producers above what these returns would have been without
the government’s intervention (see Appendix for details). In this study the most
important element of the NRA is based on comparisons between domestic and
international prices. This part of the NRA compares the prices of commodities
in the domestic economy (at the port) with the international prices of commodi-
ties at the border (that is, c.i.f. in the port for importable goods; f.o.b. in the
port for exportable ones).4 These price comparisons provide indicators of the
incentives for production, consumption and trade, and of the income transfers
associated with government interventions. For a more complete measure of pro-
tection I also added domestic subsidies to producers to these price distortions.
The NRA thus captures the total protection to agricultural producers.
The data are collected for six countries (Belgium, France, Finland, Germany,
the Netherlands and the UK) and several commodities. The quantity and qual-
ity of the data varies importantly among countries. In the tables I have only
presented indicators and data for which I was relatively confident that they
represented reality. The missing variables in the tables and figures thus reflect
either that no data were available or that the calculated indicators appeared
unrealistic due to poor quality of the data.
2 See de Gorter and Swinnen (2002) and Swinnen (2009) for surveys of this literature.3 Other measures include the OECD’s PSE (Producer Support Estimate).4 Within the framework of this study it was impossible to collect consistent data on quality adjust-ment, transport, storage and handling costs in moving commodities from the farm to the wholesalelevel; so we try to be careful in interpreting the calculated indicators in order to allow for bias in thenumbers due to these omissions.
� 2009 The AuthorJournal compilation � Blackwell Publishing Ltd. 2009
2.50
2.00
1.50
1.00
0.50
–1.00
–0.50
0.00
1870
1873
1876
1879
1882
1885
1888
1891
1894
1897
1900
1903
1906
1909
1912
1915
1918
1921
1924
1927
1930
1933
1936
1939
1942
1945
1948
1951
1954
1957
1960
1963
1966
1969
Belgium Netherlands France UK Germany Finland
FIGURE 1NRA Average over Main Commodities, 1870–1969
somewhat in the beginning of the 20th century, and increase substantially in the
1930s, before declining rapidly in the 1940s. In the 1950s and 1960s the NRAs
increase strongly, to a level close to 1 in the second half of the 1960s.
In the next section I relate these calculated indicators to actual policy decisions.
3. THE EVOLUTION OF AGRICULTURAL POLICIES AND PROTECTION
At the start of the 19th century there was substantial government interven-
tion in agricultural markets in Europe. Probably the most well-known form of
protection was the Corn Laws in the UK. The Corn Laws were introduced cen-
turies earlier to regulate grain prices and imposed import tariffs on grains in
the early 19th century (Kindleberger, 1975; Schonhardt-Bailey, 2006). Other
European countries also had import tariffs for agricultural commodities. For
example, in the Netherlands, import tariffs were increased in the 1820s in
response to a strong increase of grain exports from the Black Sea region which
caused a sharp decline in grain prices in Western Europe in 1818 (Vander Va-
eren, 1930; van den Noort, 1980).6
a. The Liberalisations of the Mid-19th Century
Most of the 19th century, from the late 1820s to the late 1870s, was charac-
terised by a move towards free trade. In the UK, reforms in 1828 and 1842
6 In 1825 import tariffs were 22 per cent for wheat, 7 per cent for oats, 11 per cent for barley and15 per cent for rye (Jansma and Schroor, 1987; Priester, 1991).
� 2009 The AuthorJournal compilation � Blackwell Publishing Ltd. 2009
TABLE 1Import Tariffs in Prussia, the Zollverein and Germany (in Dmark per ton, 1857–1914)
relaxed the import regulations of the Corn Laws, which were finally abolished
in 1846 (Schonhardt-Bailey, 1998, 2006). Around the same time import tariffs
on live animals, meat, potatoes and vegetables were abolished. In the Nether-
lands, as grain prices recovered after 1835, the government reduced import tar-
iffs under the Grain Laws in the mid-1840s and abolished all import tariffs in
the 1870s (Sneller, 1943; Bieleman, 1992). Similarly in Prussia, import tariffs
were reduced after the Napoleonic wars in the early 19th century. These
reduced tariffs were extended to other parts of Germany with the establishment
of the Zollverein. In 1853 grain tariffs were abolished. As Table 1 shows,
tariffs were zero or very low in the 1850s until the 1870s.
A series of trade agreements contributed to the spread of free trade through-
out Europe. The first was the English–French trade agreement in 1860 which
was followed by several other trade agreements between European countries,
including the 1862 French–German trade agreement, reducing tariffs also on
manufacturing goods.7 The French–German Peace Treaty of 1871 renewed
trade relations indefinitely and established the principle of the ‘most favoured
nation’ on a reciprocal basis. The German agricultural sector was strongly in
favour of free trade. The large Junker estates in Prussia benefited from grain
exports and feared that import tariffs on industrial goods would increase their
costs or could lead to reprisal grain tariffs (Tracy, 1989).
The NRA calculations are consistent with these policy evolutions. During
the earliest period for which I have data (for grains from 1870 onwards) the
NRAs indicate no protection in the grain market in the 1870s. The NRA for
wheat was around zero in Belgium, the Netherlands, France and the UK during
the 20-year period 1860–80 (Table 2).
7 Between 1861 and 1867 France concluded 11 commercial treaties: with England, Belgium, theGerman Zollverein, Italy, Switzerland, Sweden and Norway, the Hanseatic League, the Nether-lands, Spain, Portugal and Austria; and each of the treaties included the most favoured nation clause(Tracy, 1989).
� 2009 The AuthorJournal compilation � Blackwell Publishing Ltd. 2009
Note:*Germany refers to West Germany after 1945. (This applies to all tables and figures.)
Source: Own calculations.
AGRICULTURAL GROWTH PROTECTION IN EUROPE 1505
While the move towards free trade is associated with the intellectual contribu-
tions of Adam Smith and his colleagues, it comes as no surprise that liberalisation
of imports came in a period of relative prosperity for farmers. The 1840s, and
through to most of the 1870s, was generally a period of relatively high incomes
and productivity growth.8 In England it is referred to as the period of ‘high farm-
ing’. It was also a period of relatively high grain prices partly due to the Crimean
War which reduced exports from Russia and the Black Sea region.
b. The Agricultural Crisis of the End of the 19th Century
The period between 1880 and 1895 was marked by a sharp reduction in
grain prices due to a dramatic increase in imports from Canada, the United
8 Productivity growth in agriculture was interrupted in the mid-1840s by the first appearance ofPhytophtora infestans (‘potato disease’) in Europe which caused disastrous potato harvests in 1845and the following years. The effects were worsened by poor grain harvests. This led to a period offood shortage and hunger in 1845–48 in several European countries. Prices increased dramatically.In Belgium, prices for potatoes increased three-fold between 1845 and 1846, wheat prices increasedby 70 per cent and rye prices doubled. Urban consumers and landless rural workers were hurt most.In reaction, the Belgian government abolished all import tariffs on food products and prohibited theexport of staple foods (Vander Vaeren, 1930). In Holland, the central government refused to inter-vene and relied on the market mechanism to solve the crisis. However, local governments intro-duced maximum bread prices to protect urban consumers and compensate bakers (van Tijn, 1977).It took three years before the food crisis was fully settled; and many suffered from hunger in themeantime or migrated: for example, the hunger induced massive migration to the US from Ireland.Following the food crisis, governments initiated a series of policies to support innovation and pro-ductivity growth in agriculture, including investments in agricultural schools, extension agencies,demonstration fields, etc. It was to be the last food shortage crisis in Europe. From then on, exceptfor the two world wars, there would only be surplus crises.
� 2009 The AuthorJournal compilation � Blackwell Publishing Ltd. 2009
TABLE 3Evolution of Transport Costs (1870–1900, in pence ⁄ quarter)
Price of US wheat (c.i.f. Liverpool) 625 568 531 402 379 356
Source: Tracy (1989).
1506 JOHAN F. M. SWINNEN
States, Argentina and Russia. There are two reasons for this. First, there
was a major expansion of agricultural production, especially in the United
States where land was abundant and cheap. Second, technological innova-
tions dramatically decreased production costs, both through agricultural
machinery which allowed for the exploitation of vast areas, and through
transport prices, as the steam engine allowed much cheaper transport via
trains and the steamboat. The dramatic fall of transport costs is summarised
in Table 3.
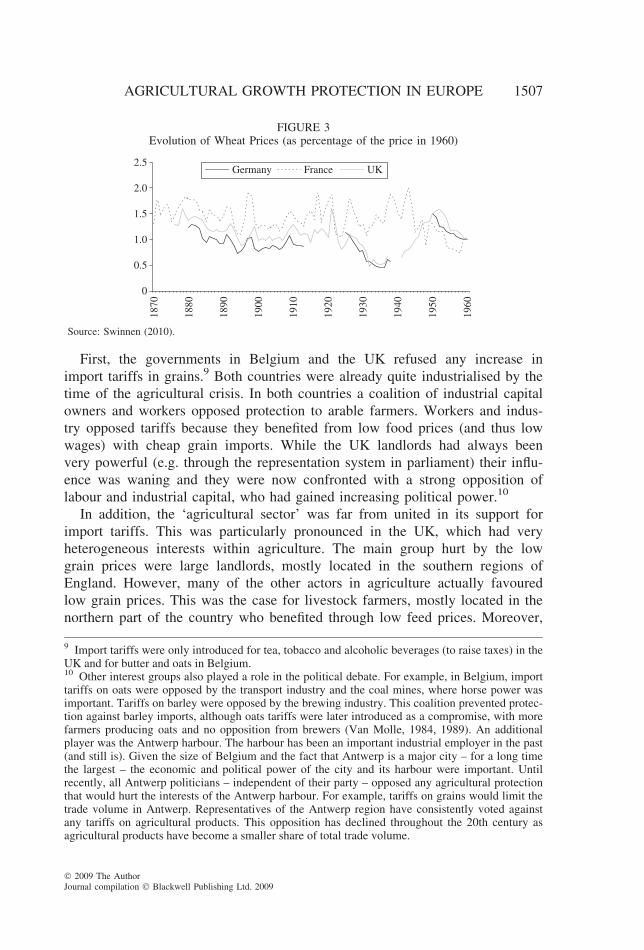
As a consequence of these changes, imports in Western Europe surged and
wheat prices fell by almost 50 per cent over the period 1880–95. The decline in
wheat prices was particularly intense during the periods 1881–86 and 1891–94
(see Figure 3). With wheat being an important part of the agricultural sector
and because of the spillover effects on other (especially arable) commodity
markets, incomes of arable farmers decreased significantly throughout Europe.
The dramatic changes in the agricultural markets induced strong pressure
from farmers on governments to intervene. The reactions of European govern-
ments to these changes and pressures were mixed. It is impossible to sum-
marise in this paper all the details of the policy proposals, debates and
decisions, but I can distinguish different patterns in government reactions. The
wheat NRAs, as summarised in Table 2, reflect these different government
reactions. After 1880 the NRA stays very low (less than 10 per cent) for Bel-
gium and the UK for the entire period until 1930, while it increases in France
and Germany after 1880. In France the NRA increases to 18 per cent on aver-
age in the 1890s. In Germany the NRA increases in the 1880s to 13 per cent
on average and further increases to an average of 25 per cent for the 30-year
period between 1890 and 1920.
These variations in NRAs reflect real differences in policy choices: the UK
and Belgium (as well as other countries such as the Netherlands and Finland)
did not impose import tariffs, while the French and German (as well as the
Swedish) governments protected their farmers by increasing import restrictions.
� 2009 The AuthorJournal compilation � Blackwell Publishing Ltd. 2009
0
0.5
1.0
1.5
2.0
2.518
70
1880
1890
1900
1910
1920
1930
1940
1950
1960
Germany France UK
FIGURE 3Evolution of Wheat Prices (as percentage of the price in 1960)
Source: Swinnen (2010).
AGRICULTURAL GROWTH PROTECTION IN EUROPE 1507
First, the governments in Belgium and the UK refused any increase in
import tariffs in grains.9 Both countries were already quite industrialised by the
time of the agricultural crisis. In both countries a coalition of industrial capital
owners and workers opposed protection to arable farmers. Workers and indus-
try opposed tariffs because they benefited from low food prices (and thus low
wages) with cheap grain imports. While the UK landlords had always been
very powerful (e.g. through the representation system in parliament) their influ-
ence was waning and they were now confronted with a strong opposition of
labour and industrial capital, who had gained increasing political power.10
In addition, the ‘agricultural sector’ was far from united in its support for
import tariffs. This was particularly pronounced in the UK, which had very
heterogeneous interests within agriculture. The main group hurt by the low
grain prices were large landlords, mostly located in the southern regions of
England. However, many of the other actors in agriculture actually favoured
low grain prices. This was the case for livestock farmers, mostly located in the
northern part of the country who benefited through low feed prices. Moreover,
9 Import tariffs were only introduced for tea, tobacco and alcoholic beverages (to raise taxes) in theUK and for butter and oats in Belgium.10 Other interest groups also played a role in the political debate. For example, in Belgium, importtariffs on oats were opposed by the transport industry and the coal mines, where horse power wasimportant. Tariffs on barley were opposed by the brewing industry. This coalition prevented protec-tion against barley imports, although oats tariffs were later introduced as a compromise, with morefarmers producing oats and no opposition from brewers (Van Molle, 1984, 1989). An additionalplayer was the Antwerp harbour. The harbour has been an important industrial employer in the past(and still is). Given the size of Belgium and the fact that Antwerp is a major city – for a long timethe largest – the economic and political power of the city and its harbour were important. Untilrecently, all Antwerp politicians – independent of their party – opposed any agricultural protectionthat would hurt the interests of the Antwerp harbour. For example, tariffs on grains would limit thetrade volume in Antwerp. Representatives of the Antwerp region have consistently voted againstany tariffs on agricultural products. This opposition has declined throughout the 20th century asagricultural products have become a smaller share of total trade volume.
� 2009 The AuthorJournal compilation � Blackwell Publishing Ltd. 2009
1508 JOHAN F. M. SWINNEN
livestock had become more important. At the time of the crisis, grains only
accounted for 12 per cent of agricultural output, while meat (42 per cent) and
milk (21 per cent) were much more important.11 In fact, the divergent interests
of the farms caused a split among farm organisations.
Furthermore, the English landlords were not even supported in their demand
for protection by those who worked on their farms (Burnett, 1969). Farm work-
ers were paid in wages.12 They were generally very poor and they benefited
more from low prices of staple food (grains) than they lost from the negative
pressure on their wages, which were strongly influenced by industrial wages.
A budget survey from 1874 shows that farm workers spent 90 per cent of their
income on grains and potatoes; and that meat or milk was an unknown luxury.
Their welfare actually increased during the agricultural crisis (Royal Commis-
sion on Labour, 1893). While farm worker interests had little influence during
most of the 19th century, this changed with the political reforms of 1885 which
gave them equal voting rights, and thus substantial political representation in
parliament (see further).
Second, in contrast to the free trade position of the UK and Belgium, the
governments of France and Germany introduced import tariffs to protect their
grain farms. Both countries were characterised by a large agricultural popula-
tion, a less industrialised economy and a more important crop sector.13 For
example, in France crops made up more than 70 per cent of total agricultural
production during all of the 19th century, and still accounted for 60 per cent
by 1950 (Table 4).
In France the government initially opposed import tariffs, but when grain
prices kept falling the government gave in to strong pressure from the French
grain farms, and import tariffs were introduced in the 1880s (Agulhon, 1976).
In Germany, the introduction of grain tariffs signalled a major reversal of
policy, not just of the government but even more of the main farmers’ organ-
isations. In the second half of the 19th century it was German industry which
11 The share of the livestock sector grew from 55 per cent in 1860 to 70 per cent of agriculturaloutput in 1900.12 Tenants and landlords suffered when prices fell. However in the UK in the mid-19th centuryabout 70 per cent of the farm population were farm workers, although this share declined signifi-cantly during the 19th century with rapid industrial migration (Burnett, 1979). In countries such asFrance and Belgium the share of farm workers was only 50 per cent in the mid-19th century (and25 per cent by 1940) as more family farms had their own land following the French Revolutionwhich transferred land from the feudal landlords and the Church to farmers.13 The other European countries for which no NRAs could be calculated for the 19th century canalso be separated into these different patterns. Sweden, another country with a large part of employ-ment and output in agriculture (and then still part of the Sweden–Norway political union), intro-duced import tariffs for grains in 1888 which were adjusted a few times over the next decade. Incontrast, Finland (then still part of Russia) provided little or no protection (Crommelynck et al.,1999). Similarly, the Dutch government opposed import tariffs and instead argued that policyshould focus on farm modernisation and stimulating more efficient production (Van Zanden, 1986).
� 2009 The AuthorJournal compilation � Blackwell Publishing Ltd. 2009
TABLE 4Value of Crops and Livestock as Percentage of Total Agricultural Output, 1867–1903
Sources: Toutain (1961), Hoffmann (1965) and Fletcher (1973).
AGRICULTURAL GROWTH PROTECTION IN EUROPE 1509
lobbied for import tariffs as it sought protection from competition from British
industrial products. But until the 1870s the large grain farmers of Prussia
opposed any tariffs. They were the main proponents of the German free trade
regime to protect their export position. However, as grain started arriving on
the world market and even inside Germany at prices below which the Prussian
farms could compete, they changed position. During the 1880s there was con-
siderable debate among farmers as to what the best position was, but when
prices kept falling they ultimately shifted to a protectionist stance. Since the
German industry had already demanded trade protection, import tariffs were
introduced across the entire economy and gradually increased in Germany, also
for grains (see Table 1).
Third, all governments introduced some protection in the livestock sector
when the crisis spread to this sector a decade later. Initially there was no surge
of imports in livestock or meat and livestock farmers benefited from declining
grain prices as their feed costs fell. However, a decade after the surge in grain
imports, technological innovation, in particular the dispersion of new freezing
technology, then also allowed long-distance transport of frozen meat. When
freezing technology spread in the meat processing and trading sectors, meat
imports from overseas grew and prices started falling also in the European live-
stock sector. As livestock prices also started falling in the 1890s there was
additional pressure on the government to intervene, now also from the livestock
farms. This occurred despite the fact that the price decline in livestock was
considerably less than in grains: in the UK, crop prices fell on average by more
than 40 per cent between the 1870s and the 1890s, while by only around 25
per cent for livestock (Tracy, 1989).
France early on raised import tariffs on livestock products. Its NRA for meat
increased from 12 per cent on average in the 1890s to 40 per cent on average
in the 1900s. Belgium also introduced small import tariffs on livestock and
meat in 1887 and import tariffs on butter and margarine in 1895. NRAs for
dairy in Belgium increased from around 0 in the 1880s to 7 per cent in the
� 2009 The AuthorJournal compilation � Blackwell Publishing Ltd. 2009
1510 JOHAN F. M. SWINNEN
1890s and 16 per cent in the 1900s. In addition a series of payments were
made from the budget in the animal disease prevention programme.
Governments use a combination of instruments to protect the livestock sec-
tor. They use tariffs, subsidies and non-tariff barriers, such as animal disease
controls. In fact, with the implementation of import tariffs on livestock, border
controls increased and, with that, the use of health arguments as protectionist
instruments also increased. This type of hidden protectionism through sanitary
regulations increased particularly in the 1890s. In Germany in 1880 a law
restricted the import of live animals, ostensibly for sanitary reasons. By 1889
the government had all but closed the border to imports of live animals; and
meat imports were restricted as well. Also in the other countries borders were
closed regularly to prevent the ‘import of infections’. In 1892, the French gov-
ernment imposed a ban on imports of cattle and the UK introduced the ‘Animal
Disease Act’ which prohibited the import of live animals under cover of safety
rules; while it allowed frozen meat imports. The impact on consumers was
mixed: the Act mainly hurt richer consumers since poor consumers could con-
tinue to benefit from cheap frozen meat imports.
Fourth, there were substantial investments by governments to support the
restructuring of the agricultural sector from grains to livestock production, par-
ticularly in countries which did not introduce import tariffs (or limited them),
such as Belgium, the Netherlands and Finland. The governments of these coun-
tries considered that the modernisation and restructuring of agriculture through
the stimulation of livestock production, was the only realistic development
strategy in the face of cheap grain imports, which made competition in grains
more difficult but also made feed costs cheaper for the livestock sector. A series
of government initiatives were taken to stimulate and help farmers shift to live-
stock production: research and extension; the subsidisation of activities that
provided incentives for improved quality of livestock breeding; and compensa-
tion for farmers for the slaughter of infected animals.14 Furthermore, some
governments stimulated the creation of dairy marketing and processing
cooperatives.
14 For example in the 1890s, the Belgian government approved important increases in the systemof damage refunds in case of livestock diseases. This system existed since the 1860s, but in 1892,1893 and 1894 the refunds were increased substantially, tuberculosis of cows was included as arefundable disease, preventive measures were increased and local livestock farmers’ organisationswere subsidised for their initiatives in the fight against animal diseases. These government actionswere the main reasons for a strong increase in the budget of the Ministry of Agriculture between1891 and 1894. In 1891, damage refunds made up 10 per cent of the total budget. By 1894 theyaccounted for 25 per cent. The increase in compensating amounts and an extension of the diseasesor infections for which they could be claimed, continued after 1984. By 1900, the total amount ofcompensation payments accounted for 40 per cent of the budget of the Ministry of Agriculture. Thestrong increase in government expenditures on compensation for animal diseases halted and yearlyexpenditures stabilised after 1900, when agricultural incomes had improved considerably.
� 2009 The AuthorJournal compilation � Blackwell Publishing Ltd. 2009
AGRICULTURAL GROWTH PROTECTION IN EUROPE 1511
More generally, European governments increased investment in public
goods, such as agricultural research, extension and education, to increase agri-
cultural productivity. Policies to reduce fraud and to improve rural transport
were introduced. Ministries of Agriculture and agricultural schools and univer-
sities were established.
c. 1900–1920: The Pre-War Period and the First World War
In the 1900–1910 period the crisis started subsiding. Prices started increasing
because production costs increased in grain exporting countries and because
industrial growth increased demand for food, in particular for livestock and
horticultural products. The demand for protection by farmers declined with an
improvement in their incomes. In a review of the political debates on agricul-
tural policy in Belgium, Van Molle (1989) concludes that, in strong contrast to
the long and ardent debates in the 1880s and 1890s, there was no substantial
debate on agricultural protection in most of the period between the turn of the
century and the First World War.15 The members of parliament representing
farm interests voiced little interest or did not sponsor new laws for supporting
agriculture between 1910 and the end of the 1920s.16
The First World War started in 1914 and brought destruction and disruption
in the food production and distribution systems. International trade broke down
with warships controlling the sea and blockades being set up. During and
immediately after the war, food markets were strongly regulated. The policy
focus shifted from protecting producers to protecting consumers. Food was
generally scarce and expensive and government regulation was introduced in
order to secure sufficient food for consumers under war conditions. Maximum
prices, compulsory deliveries and export restrictions were introduced. However,
where governments imposed maximum prices and mandatory deliveries on
farmers, a black market emerged, yielding high prices. Hence, despite the war-
related problems, the war years typically yielded high prices for farmers.
15 Van Molle (1989, p. 288) provides details: in contrast to the long debates in the 1880s and1890s, in 1902, 1910 and 1911 the budget of the Ministry of Agriculture was discussed and votedon in a single day; on three days in 1912 and 1914. In 1905, there was no debate at all. In 1901,1906, 1907 and 1908 there were complaints about absenteeism in the Parliament. The budgetincreases on average with 2.5 per cent annually between 1901 and 1914, compared to a 7 per centaverage annual increase for 1885–1900 and 4.1 per cent between 1879 and 1884. And, on 30October, 1908, the Ministry of Agriculture was, as before 1884, reduced to a department within theMinistry of the Interior.16 There are two minor exceptions over this period. One of the discussions involved Belgian beer.Belgian hop producers were increasingly confronted with imports of cheaper and better quality hop.Two proposals for hop protection were presented in Parliament in 1903 and 1907. They weredefeated because of the perceived negative effects on the breweries and on the ‘price ofthe worker’s beer’.
� 2009 The AuthorJournal compilation � Blackwell Publishing Ltd. 2009
1512 JOHAN F. M. SWINNEN
d. The Interwar Period: 1920–40
Immediately after the war, food was still expensive and many governments
continued to apply strict regulations to food consumption, production and trade.
With the high prices, important farm investments took place immediately after
the war. More land was taken into production and the number of the livestock
increased, as well as yields. At the same time, land prices and rents increased
both due to increasing prices and the large war savings of farmers.
Protection rates were low, in particular for basic food such as grains. On
average NRAs for wheat were close to zero (or slightly negative) in the 1920s
in Belgium, the Netherlands, France, the UK, Germany and Sweden (see
Table 2).
However, things changed again in the late 1920s and 1930s. With the
liberalisation of war regulations, in the early 1920s, agricultural prices fell.
This price decline was further reinforced in the late 1920s as the investments
by farmers resulted in substantial increases in productivity and supplies. At the
same time, demand fell with the general economic crisis following the 1929
stock market crash on Wall Street. As a result real farm prices fell substantially
in the 1930s. Figure 4 illustrates this general trend in Europe with data from
the Netherlands: agricultural prices fell by around 40 per cent between 1920
and 1923 and fell another 30 percentage points between 1927 ⁄ 28 and 1932.
While costs also declined, their decline was lesser (about 20 percentage
points).
As in the late 19th century, this resulted in strong pressure on the govern-
ments to intervene and support farmers. However, at the same time the govern-
ment faced strong pressure from industry and workers to keep basic food prices
low in the midst of the depression. Again I see different reactions among
Crop prices
Livestock prices
Costs
0
20
40
60
80
100
1938
1937
1936
1935
1934
1933
1932
1931
1930
1928
1929
1927
1926
1925
1924
1923
1922
1921
1920
FIGURE 4Farm Prices and Costs in the Netherlands, 1920–40
Source: Centraal Bureau voor de Statistiek.
� 2009 The AuthorJournal compilation � Blackwell Publishing Ltd. 2009
AGRICULTURAL GROWTH PROTECTION IN EUROPE 1513
European governments with some more likely to protect agriculture than others.
Yet, overall, there was a greater willingness of governments to protect farmers
than in the 1880s, and import constraints were introduced in many countries, in
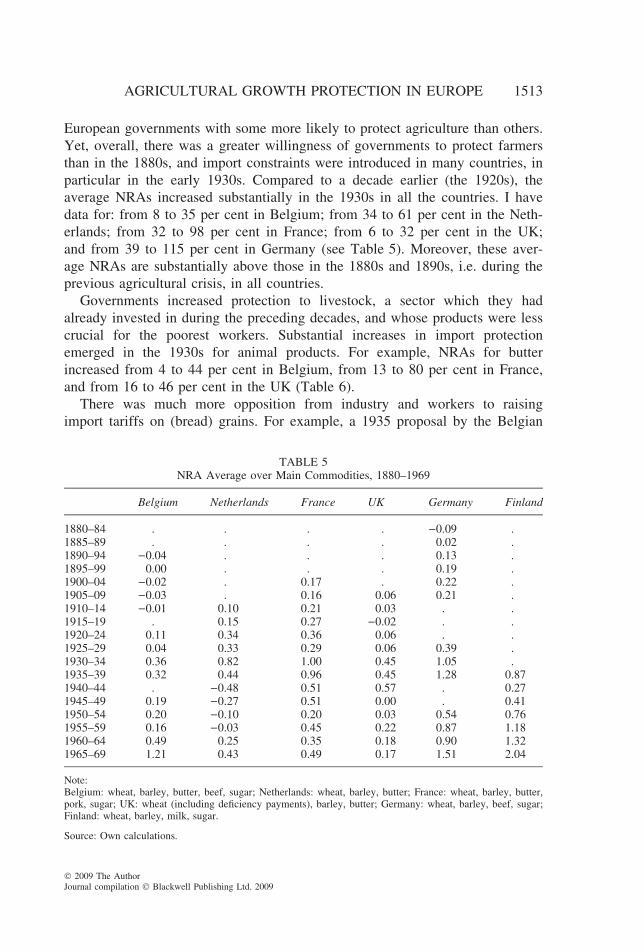
particular in the early 1930s. Compared to a decade earlier (the 1920s), the
average NRAs increased substantially in the 1930s in all the countries. I have
data for: from 8 to 35 per cent in Belgium; from 34 to 61 per cent in the Neth-
erlands; from 32 to 98 per cent in France; from 6 to 32 per cent in the UK;
and from 39 to 115 per cent in Germany (see Table 5). Moreover, these aver-
age NRAs are substantially above those in the 1880s and 1890s, i.e. during the
previous agricultural crisis, in all countries.
Governments increased protection to livestock, a sector which they had
already invested in during the preceding decades, and whose products were less
crucial for the poorest workers. Substantial increases in import protection
emerged in the 1930s for animal products. For example, NRAs for butter
increased from 4 to 44 per cent in Belgium, from 13 to 80 per cent in France,
and from 16 to 46 per cent in the UK (Table 6).
There was much more opposition from industry and workers to raising
import tariffs on (bread) grains. For example, a 1935 proposal by the Belgian
TABLE 5NRA Average over Main Commodities, 1880–1969
government, under pressure from farmers, to increase grain import tariffs caused
a general strike which resulted in the fall of the government, after which the tar-
iff proposal was abolished. Because of this strong opposition from industry and
workers, support to grain farmers occurred to an important extent through other
measures than through import tariffs. One policy measure which was used in
several European countries was the compulsory use of domestic grain by millers.
Millers were obliged by the government to use a minimum percentage of domes-
tic grain in their flour. Another measure was government payments to grain pro-
ducers, such as deficiency payments in the UK and per hectare subsidies in
Belgium – measures which did not increase grain prices, quite the contrary.17
Despite the stronger opposition against tariffs for grains than for livestock,
the NRA for wheat increased substantially in the 1930s compared to the 1920s:
from 1 to 32 per cent in France, from –8 to 13 per cent in Belgium, and from
–9 to 35 per cent in the UK (Table 2).18 In the UK tariff protection remained
roughly the same (from –9 per cent to –3 per cent) but spending on deficiency
payments increased the NRA from –9 per cent to +35 per cent.
17 Governments also intervened in other ways to assist farmers, particularly if the measures did notaffect consumers. During the ‘good years’ of the 1920s, farmers rented more land and signed con-tracts with high land rents, which they were unable to pay as agricultural prices fell. Both in theNetherlands and Belgium, the government intervened to assist tenants. Examples are the Belgian‘Crisis Land Lease Law’ in August 1933 that restricted ‘exaggerated’ lease contracts. Land leaseswere, since the tenure law of 1929, based on nine-year contracts. Under the ‘Crisis Land LeaseLaw’ the government gave the authority to the local courts to judge whether some lease contractsincluded ‘exaggerated’ rents, and this with special reference to the ‘extreme economic conditions’(Desmecht, 1987).18 The very strong increases in the Netherlands and Germany should be interpreted with care asthey are strongly affected by macroeconomic factors, in particular hyperinflation and a collapse intheir exchange rates in the 1930s.
� 2009 The AuthorJournal compilation � Blackwell Publishing Ltd. 2009
0
20
40
60
80
100
120
140
1900 1910 1920 1930 1940 1950 1960 1970 1980 1990
%
FIGURE 5Income in Agriculture as Percentage of Incomes in Industry in Finland, 1900–90
Source: Crommelynck et al. (2001).
AGRICULTURAL GROWTH PROTECTION IN EUROPE 1515
By the end of the 1930s, prices recovered as war preparations began. Many
protectionist measures were sustained until 1939, but relaxed from the mid-
1930s onwards as farm profits started recovering (Bublot, 1980; Tracy, 1989).
e. The Second World War and the Post-War Period
There are major changes in protection as indicated by the NRAs over the
1940–70 period. In the 1940s there was a reversal of the protectionism of
the 1930s in most countries: average NRAs fell back to substantially lower
levels in Belgium, France, Finland, the Netherlands and the UK. While there
was variation across countries, the period 1950–70 was characterised by,
again, substantial increases in NRA. Average NRAs increased steadily in the
1950s and 1960s, to 43 per cent in the Netherlands, 49 per cent in France,
121 per cent in Belgium and 151 per cent in Germany; and 204 per cent in
Finland.
These variations in NRAs reflect important policy changes. During the
Second World War, food production and consumption were strongly regulated.
As in the First World War, food prices were high on the black market and
farmers’ incomes soared, certainly compared to incomes in the rest of the econ-
omy. Figure 5 illustrates, using long-run income data from Finland, how farm
incomes were lower than incomes in the rest of the economy during the entire
20th century, except during the two world war periods when food was scarce.
The developments after the Second World War were similar to those after
the First World War. During the war, food production and consumption were
strongly regulated. Immediately after the war the existing regulatory system
was sustained in most European countries and used to ensure a sufficient and
‘affordable’ food supply. Maximum prices were imposed and harvests and
stocks were claimed by the government. In the next years the strongly regu-
lated agricultural markets were slowly liberalised.
� 2009 The AuthorJournal compilation � Blackwell Publishing Ltd. 2009
1516 JOHAN F. M. SWINNEN
Agricultural prices started declining again from the late 1940s onwards.
Farmers’ incomes started falling behind incomes outside the agricultural sector
(Figure 5). Economic growth was strong in the rest of the economy and the
income gap between farmers and people working in other sectors increased
strongly in favour of the non-agricultural sectors. There were two reasons for
the income gap. The first was the strong growth in the industrial and service
sectors of the economy. The second was the introduction of labour-saving tech-
nologies in agriculture. Because demand for food had become more inelastic,
there was downward pressure on agricultural incomes.
From the 1950s onwards and for the next decades, ‘income parity’ became a
central issue in agricultural policy. In the speeches of politicians, in political
discussions and in the agricultural press, the relative income situation of farm-
ers was at the top of the agricultural policy agenda. Farmers pressured Euro-
pean governments to intervene in the market to correct these growing income
gaps by introducing a series of measures to support farm incomes.
This led to a series of government interventions in European agriculture in
the 1950s and 1960s. Minimum prices, target prices, import quotas etc. were
introduced. The regulatory system installed during the war now became an
instrument to support farm incomes by intervening in markets in favour of
farmers.
An argument often invoked to support these measures, especially in con-
tinental Europe, is the importance of food security (self-sufficiency). On a con-
tinent twice devastated in a 50-year period and twice facing food shortages
during war times, the argument of sufficient food through local production
touches a nerve. Politicians who had to address the nation’s basic concerns and
consumers who faced hunger and food shortages during times when food
imports and long-distance food supplies were interrupted were sympathetic to
the call for local food production.
In the 1960s several of these national policy measures became the building
blocks on which the EU’s Common Agricultural Policy was constructed. The
CAP was designed at the Stresa Conference in 1958 and introduced in 1968.
The introduction of high guaranteed prices at the EU level in the 1970s and
1980s resulted in large trade distortions. This led to the EC’s wine lakes and
butter and grain mountains and a budget crisis in the 1970s and 1980s, and to
increasing tensions with the traditional agricultural exporting countries on the
world markets (Josling, 2009).
4. THE POLITICAL ECONOMY OF AGRICULTURAL PROTECTION: KEY FACTORS
In a recent review of the literature on the political economy of agricultural
protection, Swinnen (2009) highlights three sets of variables that have been
� 2009 The AuthorJournal compilation � Blackwell Publishing Ltd. 2009
AGRICULTURAL GROWTH PROTECTION IN EUROPE 1517
identified as important causes of (changes in) agricultural protection in the liter-
ature: (a) comparative advantage and market fluctuations which affect market
returns and incentives to demand government protection from market forces; (b)
the structure of the economy – which is typically affected by economic develop-
ment and which affects both the costs of distribution and the ability to organise
politically; and (c) political institutions and organisations. I will first briefly
review the conceptual arguments and the evolution of these factors in Europe
over the relevant time period and then relate these developments to the policy
changes. The last part of this section discusses a series of additional factors.
a. Relative Income and Market Returns
A first set of variables relate to the relative income situation of farmers.
Both theoretical and empirical studies show that changes in market returns will
affect political activities of farmers as well as changes in political incentives
for governments to intervene.19 This creates political incentives, both on the
demand (farmers) side and the supply (politicians) side, to give up government
transfers in exchange for political support. Empirically, one can identify at least
two ‘variables’ which affect agricultural protection through this mechanism.
The first is (potentially) short-term changes in, for example, world markets,
exchange rates etc., which affect the relative income position of farmers; the
other is more long-term (structural) and has to do with economic development
and comparative advantage. With economic development, incomes in the rest
of the economy typically grow faster than in agriculture causing both a reduc-
tion of the share of agriculture in the economy and incentives for those who
remain in agriculture to seek government support.
In all European countries agriculture was a much more important share of
the economy in the 19th century than it is today. With the Industrial Revolu-
tion, agriculture’s share declined strongly, albeit with major differences
between countries (see Figure 6). In the UK, where the Industrial Revolution
started, agricultural employment had fallen to 20 per cent of total employment
by 1880. On the continent, the shares were lowest in Belgium and Finland (less
than 30 per cent) and the Netherlands (35 per cent). In contrast, farmers and
farm workers still accounted for almost one-half of the population in France
and Germany in 1880. By the 1960s, the employment share was close to 5 per
cent in the UK and Belgium and around 10 per cent in the Netherlands, Fin-
land, Sweden and in Western Germany, as the more agricultural part of the
19 Theoretically, the relative income hypothesis in agricultural policy is developed formally in deGorter and Tsur (1991) and Swinnen and de Gorter (1993). A related general theory is by Hillman(1982). Empirical evidence is in Anderson and Hayami (1986), Gardner (1987) and Swinnen et al.(2001).
� 2009 The AuthorJournal compilation � Blackwell Publishing Ltd. 2009
0
10
20
30
40
50
60
1875 1905 1935 1965
Belgium
Netherlands
France
UK
Germany
Finland
FIGURE 6Share of Agriculture in Active Population (%)
Source: Swinnen (2010).
1518 JOHAN F. M. SWINNEN
country was separated into East Germany.20 Only France still had a much lar-
ger share of its population in agriculture (around 20 per cent).
Everywhere and always the contribution of agriculture to total output was
even lower than its share in employment (Figure 7). By the late 19th century
the share of agriculture in GDP had fallen to around 10 per cent in Belgium
and the UK while it was around a quarter of total output in France and around
a third in Germany. By the 1960s these shares had fallen to around 6 per cent
or less in all the countries in this study.21
When farm incomes from market decline relative to other sectors, farms look
for non-market sources of income such as government support, either because
returns to investment are larger in lobby activities than in market activities, or
because willingness to vote for ⁄ support politicians is stronger as the impact on
utility is relatively stronger. For similar reasons governments at a given stage
of development are more likely to support sectors with a comparative disadvan-
tage than sectors with a comparative advantage. These explanations are consis-
tent with observations of agricultural protection being countercyclical to market
conditions and protection being higher in countries with less comparative
advantage in agriculture.
As I explained already in the previous sections, over the 1870–1969 century,
there were three periods when either world market prices were depressed and
imports increased strongly, putting pressure on domestic farms, or when the
gap between incomes in farming and those in the rest of the economy grew sig-
nificantly. This was at the end of the 19th century (1880–95), during the inter-
bellum (and especially the period 1928–35), and the post-1950 period.
20 Agricultural technology and factor use changed dramatically as well. Agricultural productionbecame increasingly capital intensive, capital intensity increased particularly in the 1950s and1960s.21 Within agriculture, the share of crop production has consistently fallen, while livestock (includ-ing meat and dairy production) and horticulture have become relatively more important (Table 4).
� 2009 The AuthorJournal compilation � Blackwell Publishing Ltd. 2009
0
10
20
30
40
1875 1905 1935 1965
Belgium
France
UK
Germany
Finland
FIGURE 7Share of Agriculture in GDP (%)
Source: Swinnen (2010).
AGRICULTURAL GROWTH PROTECTION IN EUROPE 1519
Inversely, during and in the years after the world wars, food prices were high
and incomes of farmers were high relative to the rest of the economy.
b. Structural Changes in the Economy
Changes in the structure of the economy affect the distribution and the size of
political costs and benefits of agricultural protection and thus the governments’
political incentives in decision making.22 For example, with a higher share of
food in total consumer expenditures, the opposition of consumers to agricultural
protection will be stronger as they are hurt more. Similarly, the opposition of
industry – or capital owners in other sectors – will be stronger since the (wage)
inflation pressures that come from increased food costs with agricultural protec-
tion are larger. Another factor is that with a larger share of farmers in the
economy, the (per unit) burden of farm support on the rest of society is higher.23
I already documented (Figures 6 and 7) that the share of agriculture in employ-
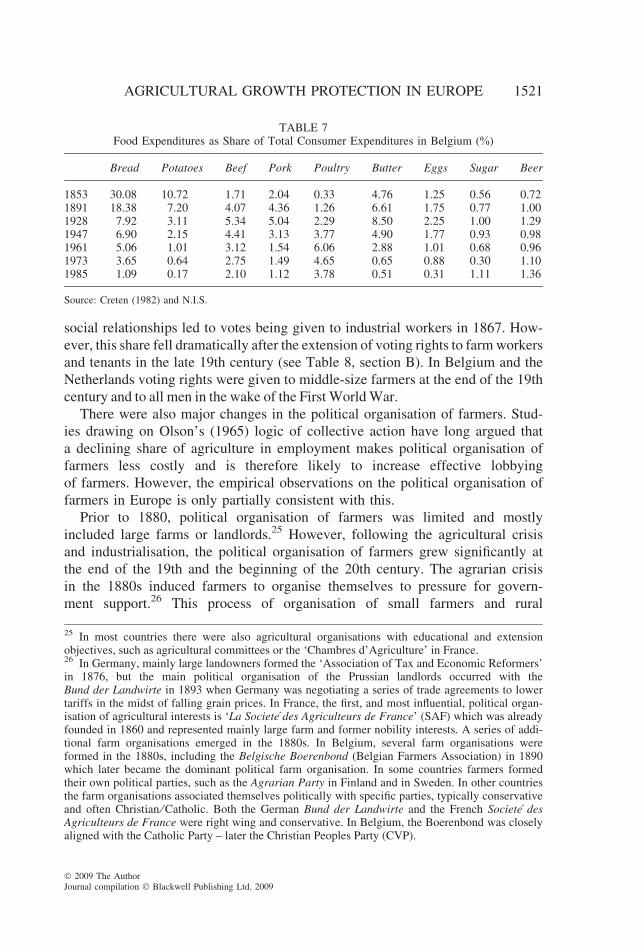
ment and output fell strongly over the 1870–1970 period. Also the share of food in
consumer expenditures reduced substantially. Food expenditures remained a very
large share of total consumer expenditures well into the 20th century in several
countries (Figure 8). However, these aggregate figures hide the fact that there were
major differences among groups in society, with the poorest spending much more
on food and major changes within the broad category of ‘food’ consumption. For
example, in Belgium the share of staple foods, such as bread and potatoes, declined
from around 40 per cent of total expenditures in 1850 to around 10 per cent by
1920, despite that the aggregate share of food expenditures remained almost
22 See e.g. Swinnen (1994) and Anderson (1995) for theoretical analyses of the impact of thesestructural variables on agricultural policy.23 In addition, political economy theories predict that exports will be subsidised less (or taxedhigher) than imports because of differences in demand and supply elasticities, affecting the induceddistortions. The distortions (deadweight costs) and transfer costs of policy intervention typicallyincrease with the commodity’s trade balance, i.e. when its net exports increase (Gardner, 1987).These arguments depend to some extent on the policy instrument that is used.
� 2009 The AuthorJournal compilation � Blackwell Publishing Ltd. 2009
0
10
20
30
40
50
60
70
1870
–187
9
1880
–188
9
1890
–189
9
1900
–190
9
1910
–191
9
1920
–192
9
1930
–193
9
1940
–194
9
1950
–195
9
1960
–196
9
1970
–197
9
1980
–198
9
1990
–199
9
2000
–200
5
Belgium
Netherlands
France
UK
Germany
Finland
FIGURE 8Share of Food in Consumption Expenditures (%)
Source: Swinnen (2010) and Eurostat.
1520 JOHAN F. M. SWINNEN
constant over this period (at 60 per cent) (see Table 7). The food shares declined
particularly fast in the decades after the Second World War.
c. Political Organisations and Institutions
The impact of political systems on protection has been the subject of a series
of recent theoretical and empirical studies (e.g. Beghin and Kherallah, 1994;
Olper, 2001; Swinnen et al., 2001; Dutt and Mitra, 2005; Grossman and Help-
man, 2005; Olper and Raimundi, 2009). The political regime determines the
degree of ‘insulation’ of policymakers.24 Greater insulation of decision-makers
implies that they can follow their private preferences – or those of the ruling
class – to a greater extent. Changes in the political system, either because of
changes in the institutions (such as changes in voting rights) or because some
interest groups become better organised, will affect the policy outcome.
Important political reforms occurred in all the European countries in the second
half of the 19th century (see Table 8). In the first part of the 19th century votes were
restricted to the richest in society, often the landed nobility. France was the first to
allocate voting rights to all men, in 1848. In England, a series of voting reforms
gradually eroded the parliamentary power of large landowners. While landlords
maintained 60 per cent of parliamentary seats in 1880, even after the changed
24 While the importance of political systems for policy (and thus agricultural policy distortions)has long been emphasised, for example in the seminal work by Buchanan and Tullock (1962), thepast decade and a half has witnessed a growing set of studies analysing the role of political regimesand ideology on policy making. These issues not only relate to the differential effects of democracyand autocratic regimes, but also between different electoral systems – such as proportional versusmajoritarian systems, and the autonomy given to bureaucrats and implementing institutions (seee.g. Persson and Tabellini, 2003; Acemoglu and Robinson, 2006; Prendergast, 2007, for importantcontributions and Swinnen and Rozelle, 2009, for an overview of applications to land and agricul-tural policy issues).
� 2009 The AuthorJournal compilation � Blackwell Publishing Ltd. 2009
TABLE 7Food Expenditures as Share of Total Consumer Expenditures in Belgium (%)
social relationships led to votes being given to industrial workers in 1867. How-
ever, this share fell dramatically after the extension of voting rights to farm workers
and tenants in the late 19th century (see Table 8, section B). In Belgium and the
Netherlands voting rights were given to middle-size farmers at the end of the 19th
century and to all men in the wake of the First World War.
There were also major changes in the political organisation of farmers. Stud-
ies drawing on Olson’s (1965) logic of collective action have long argued that
a declining share of agriculture in employment makes political organisation of
farmers less costly and is therefore likely to increase effective lobbying
of farmers. However, the empirical observations on the political organisation of
farmers in Europe is only partially consistent with this.
Prior to 1880, political organisation of farmers was limited and mostly
included large farms or landlords.25 However, following the agricultural crisis
and industrialisation, the political organisation of farmers grew significantly at
the end of the 19th and the beginning of the 20th century. The agrarian crisis
in the 1880s induced farmers to organise themselves to pressure for govern-
ment support.26 This process of organisation of small farmers and rural
25 In most countries there were also agricultural organisations with educational and extensionobjectives, such as agricultural committees or the ‘Chambres d’Agriculture’ in France.26 In Germany, mainly large landowners formed the ‘Association of Tax and Economic Reformers’in 1876, but the main political organisation of the Prussian landlords occurred with theBund der Landwirte in 1893 when Germany was negotiating a series of trade agreements to lowertariffs in the midst of falling grain prices. In France, the first, and most influential, political organ-isation of agricultural interests is ‘La Societe des Agriculteurs de France’ (SAF) which was alreadyfounded in 1860 and represented mainly large farm and former nobility interests. A series of addi-tional farm organisations emerged in the 1880s. In Belgium, several farm organisations wereformed in the 1880s, including the Belgische Boerenbond (Belgian Farmers Association) in 1890which later became the dominant political farm organisation. In some countries farmers formedtheir own political parties, such as the Agrarian Party in Finland and in Sweden. In other countriesthe farm organisations associated themselves politically with specific parties, typically conservativeand often Christian ⁄ Catholic. Both the German Bund der Landwirte and the French Societe desAgriculteurs de France were right wing and conservative. In Belgium, the Boerenbond was closelyaligned with the Catholic Party – later the Christian Peoples Party (CVP).
� 2009 The AuthorJournal compilation � Blackwell Publishing Ltd. 2009
TABLE 8Voting Rights Reforms in Western Europe
A. France
1814: Voting rights restricted to large landowners (those who paid more than 300 FF taxes,equivalent to taxes on 50 hectares property); i.e.100,000 people out of 30 million total.
1831: Reduction to 200 FF minimum tax: now 200,000 people can vote.1848: Voting rights for all men.1944: Voting rights for women.
B. England
VotingReform Act
Main Beneficiaries Share of Parliamentary Seatsby Large Landowners (%)
1832 I Farm managers1867 II Industrial workers1880 60%1885 III Farm workers and tenants1885-post election 30%1906 20%1918 IV Women1919 10%
C. The Netherlands
Before 1887: Census voting rights1887: Extension of voting rights to 27% of the population, including many larger
(richer) farmers1917: General voting rights
D. Belgium
Before 1893: Cijns voting rights Votes based on tax payments1893: Plural general voting rights All men over 25 years old at least
one vote, but number of votes dependson education and wealth (taxes)
1919: Singular general voting rights One man, one vote1948: Voting rights for women One person, one vote
E. Germany
1871: Singular general voting rights (two votes per man; second vote countswhen no majority is obtained by first votes)
Before 1918: Prussia: three classes have equal voting rightsOne-third of votes attributed to class of rich landowners (4% of population)
1918: Voting rights for women
F. Finland
Before 1906: Under Russia: Lantdag with representatives of four classes (nobility, clergy,citizens, farmers)
1906: Voting rights for women
Source: Swinnen (2002).
� 2009 The AuthorJournal compilation � Blackwell Publishing Ltd. 2009
1522 JOHAN F. M. SWINNEN
AGRICULTURAL GROWTH PROTECTION IN EUROPE 1523
households is also related with the intensified political competition that was
characteristic of the democratisation process at the end of the 19th and early
20th centuries. With voting rights being extended to the general population,
conservative parties saw rural households as an important source of votes.
A crucial political strategy of conservative and religious parties in continental
Europe at the end of the 19th century was the social and political organisa-
tion of the rural areas to create a strong power base and a reliable source of
votes.27
Farm organisations were often dominated by large farmers and nobility but,
in order to enhance their political clout, they tried to project an image of
defending interests of all farmers. Sometimes they were successful in this,
sometimes not.28
In the next section I will relate (changes in) agricultural protection, as identi-
fied in the previous section, to (changes in) these three sets of variables.
27 This social organisation included the political organisation of farmers and the establishment of abroad social and educational network of Catholic schools, hospitals and other rural organisations.Village priests often played a key role in the local organisation. This strategy was very successful inseveral countries. For example, in Belgium the Catholic Party created a dominant political andsocial network in the rural areas in collaboration with the Catholic Church and the farmers’ union.Similarly, in France, the conservative coalition of the Catholic Church and the (former) nobility inFrance was organised through the Societe des Agriculteurs de France (SAF) – and in reaction theRepublican political movement established alternative farm organisations, focusing on small farm-ers (see further). In Germany in the 1920s and 1930s, the National Socialist (Nazi) Party inGermany rose to power initially targeting urban areas. However, the Nazi Party soon realised thepotential voting strength of a discontented peasantry and designed rural policies to address farmers’concerns. While their strategy focused strongly on the broad rural population, which dominantlyvoted for them in the 1930 elections, at the same time they joined forces with the large Prussianlandlords with whom they shared preferences about the importance of protecting domestic foodproduction and an autocratic political regime.28 The German and Belgian farm unions were relatively successful in keeping all farmers withinone farm organisation. For example, the Belgian Boerenbond succeeded in keeping this unifiedorganisation despite the fact that for a long time small farmers had no voice at the highest level ofdecision making. This was reserved for leaders of the Catholic Party, Church officials and largefarmers and landowners. One reflection of this bias was the organisation’s support of the existingland tenure laws, which in the first part of the 20th century were heavily criticised by small farmersand mainly benefited landowners (Craeybeckx, 1973). In France and the UK small and large farm-ers separated into two organisations. In the UK, the large inequalities in tenure relationships and inland ownership were such that they induced tenant farmers to organise themselves to defend theirinterests against large landlords, rather than forming a coalition with them. In France, the (former)rural nobility was organised in the Societe des Agriculteurs de France (SAF), in a conservative coa-lition with the Catholic Church. Small farmers organised in other farm organisations, including theSociete National de l’Encouragement a l’Agriculture (SNEA). This small farmer organisation wasactively supported by the Republican political movement which wanted to counter the conservativeinfluence of the nobility and the Church in the rural areas. Interestingly, these conflicts were typi-cally reflected at the village level in the local priest representing and organising the SAF while theRepublican organisations (SNEA) were represented by the local schoolteacher.
� 2009 The AuthorJournal compilation � Blackwell Publishing Ltd. 2009
1524 JOHAN F. M. SWINNEN
5. AN EXPLANATION OF THE GROWTH OF AGRICULTURAL PROTECTION
IN EUROPE
As documented in previous sections, important changes took place in agri-
cultural policies in Europe in the 19th and 20th centuries. In the 1860s free
trade spread across the continent. A century later, in the 1960s, European inte-
gration coincided with an agreement on heavy government intervention in agri-
cultural markets and strong protection against imports. In the final section of
this paper I will argue that the growth of agricultural protection in Europe is
due to a combination of factors, in particular the combination of increased
incentives for farmers to demand protection, decreased opposition to protection
from the rest of society, and political changes that have given farmers’
demands greater influence at the decision-making level.
If I want to explain the growth in protection, it is important to realise – and
account for – the fact that agricultural protection in Europe did not increase
monotonically over time. There were very important fluctuations over time.
From the mid-19th to the end of the 20th century, there were three periods
when European farmers intensely demanded protection from international com-
petition. This was at the end of the 19th century (1880–95), from the late
1920s to the late 1930s, and in the post-1950 period. In other periods, there
was less or no demand for protection. In some periods consumers demanded
that governments protect them from increasing food prices, in particular during
and just after the two wars when food was scarce and food prices very high.
However, while farmers’ demands for protection were intense during three
periods in the century when incomes from market returns were relatively low
(the end of the 19th century, the interbellum and the post-1950 period), there
was a very different government response to these demands for protection by
farmers. Governments mostly resisted protectionist demands at the end of the
19th century, except in France and Germany. European governments provided
more protection in the 1930s, and substantially more so from 1950 onwards.
Hence, governments responded more favourably to farmers’ demands to pro-
vide protection as decades passed.
First, a key factor is that with economic development the importance of
expenditures on food, and in particular on staple foods, declined. This reduced
opposition to import protection by the coalition of workers and industrial inter-
ests. This opposition coalition was so strong at the end of the 19th century, and
for some basic food commodities still into the 1930s, that they were able to
block substantive import tariffs for agriculture, and in particular for (bread)
grain farms. The opposition was strongest in the most industrialised countries,
such as the UK, Belgium and the Netherlands. There, the share of employment
in agriculture was lowest and both capital investment and employment
in industry was largest (see Figures 6 and 7). In France and Germany, the
� 2009 The AuthorJournal compilation � Blackwell Publishing Ltd. 2009
AGRICULTURAL GROWTH PROTECTION IN EUROPE 1525
economic importance of agriculture was comparatively larger (and that of
industry still smaller). In those countries grain tariffs were introduced in the
late 19th century.
Second, differences in comparative advantage in industry and in farm struc-
ture appear to have been important factors in explaining the difference in pro-
tection policies between the UK on the one hand and France and Germany on
the other in the early 20th century. In all three countries large grain farms were
important, and relatively well organised. However, in the UK they were unsuc-
cessful in obtaining protection against imports as the opposition from industry,
workers and the rest of agriculture (see further) was stronger. In Germany and
France they were able to obtain support. Both countries had an industry (manu-
facturing sector) which was under pressure from imports from more advanced
industrial nations such as the UK. Both in Germany and France the manufac-
turing industry wanted import protection. In Germany the main group opposing
import tariffs were the Prussian grain-exporting farms. But this changed when
cheap grain swamped the European markets in the second half of the 1870s.
With French and German farmers now switching sides in favour of protection,
an anti-free-trade coalition of industry and agriculture emerged in both coun-
tries – in contrast to the UK (and Belgium) where industry wanted export
opportunities and cheap food. This caused the introduction of general import
tariffs, not just on agricultural products but also on industrial products, in 1879
in Germany and in 1892 in France.29
Interestingly, in Germany this alliance was only temporary. By the 1890s,
German industry was in a much stronger competitive position and started
becoming worried about the negative effects of high food costs and high
wages. In addition, it was being harmed by tariffs which the United States had
imposed in reaction to the German agricultural tariffs. However, by the 1890s
industrial interests had changed. Industry, and industrial workers, wanted
cheaper food and access to international export opportunities. This effectively
led to a reversal of German trade policies: despite strong opposition from farm-
ing interests, especially the Prussian landlords, a series of new trade agreements
in the 1890s lowered agricultural tariffs and brought benefits for manufacturing
(see Table 1). New trade agreements with Romania and Russia, through the
most favoured nation principle, also reduced tariffs on grains from the US and
other grain exporters (Tracy, 1989; Schonhardt-Bailey, 2006).
Third, so far I have mostly discussed the political coalitions in fairly simple
terms, referring mostly to those with agricultural interests as ‘farmers’. How-
ever there were important heterogeneities among ‘farmers’ both in terms of
their economic interests and their political organisations. These heterogeneities
29 In France, the main exceptions were agricultural raw materials used as inputs in industry, suchas wool, skins, cotton, flax etc.
� 2009 The AuthorJournal compilation � Blackwell Publishing Ltd. 2009
1526 JOHAN F. M. SWINNEN
had important impacts on the policy decisions. One element is that livestock
farms typically opposed grain import tariffs. In countries where livestock farm-
ing was well established (for example, in the UK, livestock farms represented
more than 60 per cent of agricultural output by the 1880s, compared to less
than 30 per cent in France), livestock farms formed a powerful lobby against
import tariffs for grains, rather than forming a coalition with grain farms. In
addition, in feudal systems (as in the UK) the role and divergent interests of
farm workers are important. In low-income societies, such as the UK at the
end of the 19th century, farm workers – even those working on grain farms –
opposed import tariffs on staple foods because they were to lose more as con-
sumers (poverty was widespread and 80 per cent of a farm worker’s expendi-
ture was on bread) than they would gain through increased wages. Moreover,
in feudal systems small farms and tenants were more concerned with their ten-
ure rights than with import tariffs at the end of the 19th and early 20th cen-
turies. They saw landlords and large grain farms as their main problem, not
cheap imports. Their political struggle focused on improving tenure conditions
by opposing landlords, rather than forming a coalition with them to increase
farm prices.30
Fourth, the impact of political reforms and organisation on agricultural pro-
tection is complex. A simple comparison between 1860 and 1960 would sug-
gest that agricultural protection had increased with the political organisation of
farms. However, such simple comparison ignores important periods in the
course of this century when farms were well organised and when protection
was not given to agriculture. While landlords and large farms were already
powerful and politically well organised in the 19th century, many new farm
organisations, in particular representing small farmers, emerged during the cri-
sis at the end of the 19th century, and a network of rural organisations linked
to farming grew in importance in the first decades of the 20th century. In addi-
tion, voting rights were extended to small farmers and farm workers in the
beginning of the 20th century. Yet, both factors seem to have had relatively
limited impact on the protection debate at the end of the 19th century because
by the time the organisations were working effectively and small farmers and
workers had voting rights, the agricultural crisis had subsided (the late 1890s
30 The agrarian crisis in the 1880s not only induced farmers to politically organise themselves todefend their interests against other interest groups (such as industrial capital) and to demand protec-tion, but also to fight for changes in relationships within agriculture. This was particularly clear inthe UK. As farmers were forced off their land as they could no longer pay their rents with decliningprices, the crisis induced social revolts by small farmers and tenants against the feudal relationships.In England tenants and small farmers organised themselves to defend their rights in the FarmersAlliance (1879) and the Society of the Land for the People (1883). Their main objectives were toget a better deal from landlords, rather than import tariffs, as reflected in their demands for ‘theThree F’s’: Fair land rents, Fixity of land tenure, and Free sale of their commodities (Cannadine,1992).
� 2009 The AuthorJournal compilation � Blackwell Publishing Ltd. 2009
AGRICULTURAL GROWTH PROTECTION IN EUROPE 1527
and 1900s). However, these political developments did enhance the influence
of farmers when the next crisis emerged: in the late 1920s and 1930s.
But opposition from industry and workers was still strong in the 1930s. Food
still accounted for a major part of worker expenditures, and, moreover, the gen-
eral economy was hit by the economic crisis of the late 1920s and early 1930s,
making cheap food an important concern. As a result there was an increase in
agricultural import tariffs, but less on food staples such as bread grains or pota-
toes. For these commodities support was more likely given under the form of
non-tariff measures such as direct payments (in the UK) and milling ratios (in
other countries).
After the Second World War, all factors in favour of more protection and
more support to agriculture came together and opposition was reducing fast.
Most importantly, after the Second World War, opposition of industry and
workers in the rest of the economy fell strongly. With strong growth in the
rest of the economy, the share of food in total consumer expenditures and its
impact on wages declined strongly and with this so did opposition to protec-
tion from workers and industry. At the same time, farm incomes fell increas-
ingly behind incomes in the rest of the economy, increasing demands for
agricultural support. Farm demands were now politically influential since
political organisations of farms were well established and because of their
votes. In addition, farm-related cooperatives and business organisations in the
agri-food sector became important interest groups, with, for example, dairy
and sugar processing companies joining farm unions in actively lobbying for
government support and import protection for their sectors. The combination
of these factors caused an important and structural shift of the political equi-
librium towards more protection – resulting in high levels of government
intervention and support to agriculture in the decades following the Second
World War.31
Finally, it is important to explicitly discuss the impact of the wars in Europe.
I already explained above that the specific circumstances during the wars
affected the relative income position of farmers and consumers, and hence gov-
ernment interventions. But agricultural policies were affected also in the years
leading up to the wars and the following years. For example, Imperial Germany
in the early 20th century sought re-armament and made food self-sufficiency an
important consideration on the home front. During the Weimar Republics the
Nazi’s nationalistic (emphasising the importance of domestic production) and
right-wing ideology found a close ally (and many votes) in the conservative
31 In Germany this occurred despite – or as some would argue because – of the fact that an impor-tant part of agriculture is now separated from Western Germany. The farms in western and southernGermany were smaller and less well structured to compete in international markets, making themsignificant demanders of protection.
� 2009 The AuthorJournal compilation � Blackwell Publishing Ltd. 2009
1528 JOHAN F. M. SWINNEN
rural population and the large Prussian landlords. The farm organisations
reorganised in a Nazi-dominated Green front.
After the war, the political cause of supporting domestically-produced food
resonated well with consumers who had suffered from trade blockades, food
shortages and high food prices in the war. The emergence of the ‘cold war’ in
the 1950s and 1960s reinforced these arguments. In some countries these argu-
ments resonated earlier concerns. For example, in Finland food shortages fol-
lowing its separation from Russia and the disruption of trade ties in the early
20th century, made food self-sufficiency an important political objective during
the first half of the 20th century and was reinforced later by the experience in
the wars. After the Second World War, when West Germany had lost most of
its grain production areas, it became preoccupied with stimulating domestic
food production through high prices on the smaller western and southern farms.
6. CONCLUSION
Important changes took place in agricultural policies in Europe in the 19th
and 20th centuries. In the 1860s free trade spread across the continent. A cen-
tury later, in the 1960s, European integration coincided with an agreement on
heavy government intervention in agricultural markets and strong protection
against imports. In this paper I quantified the extent of agricultural protection
and related it to the history of agricultural policies and offered a series of
hypotheses on the causes of these dramatic changes in agricultural and trade
policies.
The growth of agricultural protection was not linear, but there was substan-
tial fluctuation in the century that was analysed. Factors that appear to have
played an important role in causing the increase in agricultural protection in
Europe are: the decline of income from markets for farmers, in particular in
comparison with incomes from the rest of the economy; the reduced share of
consumer expenditures for food; the farm structure; the political organisation
of farmers and the growth in government administrative capacity for
regulating markets; the food shortages during the world wars in Europe, and
democratisation.
However, the impact of each of these factors is complex and almost always
interrelated with other factors. Periods of substantial increases in agricultural
protection were characterised by three conditions. First, farmers had substantive
political influence, either through votes in parliament of through extra-parlia-
mentary political organisations. Second, a crisis in agriculture or growing
income gap with the rest of the economy triggered strong political action by
farmers to influence governments. Third, the opposition to protection was suffi-
ciently low, either because support to agriculture had relatively little effect on
� 2009 The AuthorJournal compilation � Blackwell Publishing Ltd. 2009
AGRICULTURAL GROWTH PROTECTION IN EUROPE 1529
consumers and the rest of the economy, or because the rest of the economy
had relatively little political influence. The combination of these three factors
was needed to induce major increases in protection. Such a combination was
present to some extent in the 1930s, but especially in the 1950s, when protec-
tion grew strongly.
An interesting element addressed in this paper which is the subject of impor-
tant current research is the impact of democracy on (agricultural) protection.
The growing literature on this issue suggests a subtle and non-linear effect of
democracy on agricultural protection.32 The conclusions from the analysis in
this paper seem to be consistent with this argument. Extending voting rights
‘from the rich to the poor’ (as is the standard evolution) shifts parliamentary
power from the landlords and industrial capital (the rich) to industrial and farm
workers and small farmers (the poor). Conceptually, it is not clear why this
would lead to an increase in agricultural protection in general. While democrat-
isation and the growth of farm associations have enhanced the political influ-
ence of small farmers, tenants, and farm workers, it also enhanced the
influence of industrial workers and labour unions. Those benefiting from the
vote extensions and improved political organisation have opposing interests on
protection. And this is consistent with the empirical evidence in this paper. In
fact, the evidence here suggests that in the UK agricultural protection was neg-
atively affected by democratisation during the 19th and the first half of the
20th centuries: almost all the poor, even the farm workers and small livestock
farms, benefited from cheap grains and therefore opposed import protection
which landlords and grain farmers demanded. As electoral reforms gave these
groups voting rights this reinforced the political opposition against grain import
tariffs in the 19th and early 20th centuries.
The enhanced political influence of small farmers and farm workers in the
first part of the 20th century seems to have been more important in affecting
the distribution of rents within the agricultural sector rather than average pro-
tection for agriculture as a whole. Tenure rights of tenants were enhanced
through a variety of regulatory changes in many continental European coun-
tries, as well as increases in land taxes and inheritance taxes contributing to the
break-up of large estates and the growth of (smaller) operator-owned farms in
the UK (Swinnen, 2002).
Finally, there are a number of important elements that require further analy-
sis and attention than is paid to them in this paper. One element is the relation
32 This is consistent with Swinnen et al.’s (2001) econometric findings that the impact dependscrucially on the details of the political reforms, i.e. who precisely benefits from the electoralchanges. They find that over the course of a century only one out of four political reforms in Bel-gium had an impact on agricultural ⁄ trade policy. The extension of voting rights in the early 20thcentury, which disproportionately benefited small farmers and landless rural workers, was associ-ated with an increase in agricultural protection, ceteris paribus, in the following years.
� 2009 The AuthorJournal compilation � Blackwell Publishing Ltd. 2009
1530 JOHAN F. M. SWINNEN
between agricultural protection (distortions in agricultural markets) and govern-
ment policies such as land reforms and public investments in infrastructure,
research, extension etc., which benefit farmers through enhanced productivity.
Another element is the relation between trade protection and macroeconomic
variables, in particular exchange rates and the budget. Several studies point at
important interactions.33 These effects require further research.
APPENDIX A: METHODOLOGY OF CALCULATING NRA
The methodology used for measuring agricultural protection is based on
Anderson et al. (2008). In the most simple open and distortion-free economy
the domestic farm product price and domestic consumer price of a product
equals E.P, which is the currency price of foreign exchange, E, times the
foreign currency price of this identical product in the international market,
P. Agricultural protection is measured as the diversion from this equality
between the distorted domestic and the undistorted international market price,
as a fraction of the undistorted price.
Our measure of the nominal rate of assistance (NRA) includes trade distor-
tions through an import tariff tm and direct producer support through production
subsidies sf1. The overall measure of distortion is then:
NRA ¼ ½ðPd þ sf Þ � E.P�=E.P ¼ ½ðð1þ tmÞE.Pþ sf Þ � E.P�=E.P;
where P is the (undistorted) unit price at the border (c.i.f. import or f.o.b.
export price), expressed in the local currency using the exchange rate E.
The (distorted) price Pd is the price observed in the domestic market
Pd = (1 + tm) E.P and sf is a production subsidy.
33 For example, both in Germany and in France in the 1880s governments wanted to increase tariffsfor public revenue purposes: Bismarck, the German leader, needed revenues for his imperial objec-tives and so did the French (in the wake of the French–German war) (Tracy, 1989). Similarly, Euro-pean governments ran into budgetary problems in the 1930s, which led to increased taxes anddevaluations and to important changes in relative prices for farmers.
� 2009 The AuthorJournal compilation � Blackwell Publishing Ltd. 2009
� 2009 The AuthorJournal compilation � Blackwell Publishing Ltd. 2009
1534 JOHAN F. M. SWINNEN
7.00
6.00
5.00
4.00
3.00
2.00
1.00
0.00
–1.00 1870
1875
1880
1885
1890
1895
1900
1905
1910
1915
1920
1925
1930
1935
1940
1945
1950
1955
1960
1965
Belgium Netherlands France UK Germany Finland
FIGURE A5NRA Sugar, 1870–1969
Source: Own calculations.
AGRICULTURAL GROWTH PROTECTION IN EUROPE 1535
REFERENCES
Acemoglu, D. and J. Robinson (2006), Economic Origins of Dictatorship and Democracy(Cambridge: Cambridge University Press).
Agulhon, M. (1976), ‘L’essor de la paysannerie 1789-1852’, in G. Duby (ed.), Histoire de laFrance rurale: 3 (Paris: Editions du Seuil), 19–58.
Anderson, K. (1995), ‘Lobbying Incentives and the Pattern of Protection in Rich and PoorCountries’, Economic Development and Cultural Change, 43, 2.
Anderson, K. (ed.) (2009), Distortions to Agricultural Incentives: A Global Perspective, 1955–2007 (London: Palgrave Macmillan and Washington, DC: World Bank).
Anderson, K. and Y. Hayami (1986), The Political Economy of Agricultural Protection: EastAsia in International Perspective (London: Allen and Unwin).
Anderson, K., M. Kurzweil, W. Martin, D. Sandri and E. Valenzuela (2008), ‘MeasuringDistortions to Agricultural Incentives, Revisited’, World Trade Review, 7, 4.
Beghin, J. C. and M. Kherallah (1994), ‘Political Institutions and International Patterns ofAgricultural Protection’, Review of Economics and Statistics, 76, 3.
Bieleman, J. (1992), Geschiedenis van de landbouw in Nederland 1500–1950 (DutchAgricultural History 1500–1950) (Amsterdam: Boom Meppel).
Bublot, G. (1980), ‘De periode van 1914 tot 1980’, in A. Verhulst and G. Bublot (eds.),De Belgische land- en tuinbouw. Verleden en heden (Brussels: Cultura).
Buchanan, J. and G. Tullock (1962), The Calculus of Consent: Logical Foundations ofConstitutional Democracy (Michigan: University of Michigan Press).
Burnett, J. (1969), A History of the Cost of Living (Harmondsworth, Middlesex: Penguin Books).Cannadine, D. (1992), The Decline and Fall of the British Aristocracy (New York, NY: Anchor
Books).Centraal Bureau voor de Statistiek (CBS), Annual Statistics 1900–2000 (The Hague, The
Netherlands).Craeybeckx, J. (1973), ‘De agrarische depressie van het einde der XIXe eeuw en de politieke
strijd om de boeren I’, Belgisch Tijdschrift voor Nieuwste Geschiedenis, IV, 190–230.Crommelynck, A., J. Kola and J. Swinnen (2001), ‘The Political Economy of Agricultural Policy
in Finland 1900–1990’, Working Paper No. 98 (LICOS, K.U. Leuven: Belgium).de Gorter, H. and J. Swinnen (2002), ‘Political Economy of Agricultural Policy’, in B. L.
Gardner and G. C. Rausser (eds.), Handbook of Agricultural Economics, Vol. 2 (Oxford:Elsevier), 1893–943.
� 2009 The AuthorJournal compilation � Blackwell Publishing Ltd. 2009
1536 JOHAN F. M. SWINNEN
de Gorter, H. and Y. Tsur (1991), ‘Explaining Price Policy Bias in Agriculture: The Calculus ofSupport Maximizing Politicians’, American Journal of Agricultural Economics, 73, 4, 1244–54.
Desmecht, K. (1987), ‘Reacties op de landbouwcrisis van 1929-1935: geschiedenis van hetBelgische landbouwprotectionisme’, unpublished dissertation, Department of History,Katholieke Universiteit Leuven, Leuven.
Dutt, P. and D. Mitra (2006), ‘Political Ideology and Endogenous Trade Policy: An EmpiricalInvestigation’, Review of Economics and Statistics, 87, 1, 59–72.
Findlay, R. and K. H. O’Rourke (2007), Power and Plenty. Trade, War and the World Economyin the Second Millennium (Princeton, NJ: Princeton University Press).
Fletcher, T. W. (1973), ‘The Great Depression of English Agriculture, 1973–1896’, in P. J. Perry(ed.), British Agriculture, 1875-1914 (University Paperbacks, Debates in Economic History,London: Methuen & Co. Ltd.), 30–55.
Gardner, B. L. (1987), ‘Causes of US Farm Commodity Programs’, Journal of PoliticalEconomy, 95, 2, 290–310.
Grant, W. (1997), The Common Agricultural Policy (Basingstoke: Palgrave Macmillan).Grossman, G. M. and E. Helpman (2005), ‘A Protectionist Bias in Majoritarian Politics’,
Quarterly Journal of Economics, 120, 4, 1239–82.Hillman, A. (1982), ‘Declining Industries and Political-Support Protectionist Motives’, American
Economic Review, 72, 5, 1180–87.Hoffmann, W. G. (1965), Das Wachstum der Deutschen Wirtschaft seit der Mitte des 19.
Jahrhunderts (Berlin: Springer Verlag).Jansma, K. and M. Schroor (1987), Tweehonderd jaar geschiedenis van de Nederlandse
landbouw (Leeuwaarden: Intercombi van Seyen).Josling, T. (2009), ‘Distortions to Agricultural Incentives in the European Union’, in
K. Anderson (ed.), Distortions to Agricultural Incentives: A Global Perspective, 1955–2007(London: Palgrave Macmillan and Washington, DC: World Bank).
Kindleberger, C. P. (1975), ‘The Rise of Free Trade in Western Europe, 1820–1875’, Journal ofEconomic History, 35, 1, 20–55.
Krueger, A. O., M. Schiff and A. Valdes (1992), The Political Economy of Agricultural Protectionin Developing Countries. A World Bank Comparative Study (5 volumes) (Baltimore: JohnsHopkins University Press).
Lindert, P. H. (1991), ‘Historical Patterns of Agricultural Policy’, in C. P. Timmer (ed.),Agriculture and the State (Ithaca, NY: Cornell University Press), 29–83.
Moyer, H. W. and T. E. Josling (1990), Agricultural Policy Reform: Politics and Process in theEC and the USA (New York: Harvester Wheatsheaf).
Nationaal Instituut voor de Statistiek (N.I.S.), Annual Statistics 1890-1990 (Brussels: NIS).Olper, A. (1998), ‘Political Economy Determinants of Agricultural Protection in EU Member
States: An Empirical Investigation’, European Review of Agricultural Economics, 24, 463–87.Olper, A. (2001), ‘Determinants of Agricultural Protection: The Role of Democracy and
Institutional Setting’, Journal of Agricultural Economics, 52, 2, 75–92.Olper, A. and V. Raimundi (2009), ‘Constitutonal Rules and Agricultural Protection’, in
K. Anderson (ed.), The Political Economy of Distortions to Agriculture (Washington, DC:World Bank Publications).
Olson, M. (1965), The Logic of Collective Action (New Haven, CT: Yale University Press).Organisation for Economic Co-operation and Development (2009), Agricultural Policies in
OECD Countries: Monitoring and Evaluation (Paris: OECD Publications).Persson, T. and G. Tabellini (2003), The Economic Effects of Constitutions: What Do the Data
Say? (Cambridge, MA: MIT Press).Pokrivcak, J., C. Crombez and J. Swinnen (2006), ‘The Status Quo Bias and Reform of the
Common Agricultural Policy: Impact of Voting Rules, the European Commission andExternal Changes’, European Review of Agricultural Economics, 33, 4, 562–90.
Prendergast, C. (2007), ‘The Motivation and Bias of Bureaucrats’, American Economic Review,97, 1, 180–96.
� 2009 The AuthorJournal compilation � Blackwell Publishing Ltd. 2009
AGRICULTURAL GROWTH PROTECTION IN EUROPE 1537
Priester, P. (1991), De economische ontwikkeling van de landbouw in Groningen 1800-1910:Een kwalitatieve en kwantitatieve analyse (Wageningen: Afdeling Agrarische Geschiedenis).
Rogowski, R. (1989), Commerce and Coalitions. How Trade Affects Domestic PoliticalAlignments (Princeton, NJ: Princeton University Press).
Schonhardt-Bailey, C. (1998), ‘Parties and Interests in the ‘‘Marriage of Iron and Rye’’’, BritishJournal of Political Science, 28, 291–330.
Schonhardt-Bailey, C. (2006), From the Corn Laws to Free Trade. Interests, Ideas andInstitutions in Historical Perspective (Cambridge, MA: MIT Press).
Sneller, Z. W. (ed.) (1943), Geschiedenis van den Nederlandschen landbouw 1795–1940 (Historyof Dutch Agriculture 1795–1940) (Groningen, The Netherlands: Wolters).
Swinnen, J. (1994), ‘A Positive Theory of Agricultural Protection’, American Journal ofAgricultural Economics, 76, 1–14.
Swinnen, J. (2002), ‘Political Reforms, Rural Crises, and Land Tenure in Western Europe’, FoodPolicy, 27, 4, 371–94.
Swinnen, J. (ed.) (2008), The Perfect Storm: The Political Economy of the Fischler Reforms ofthe Common Agricultural Policy (Brussels: Centre for European Policy Studies Publications).
Swinnen, J. (2009), ‘The Political Economy of Agricultural Policies: The Literature to Date’, inK. Anderson (ed.), The Political Economy of Distortions to Agriculture (Washington, DC:World Bank Publications).
Swinnen, J. (2010), A Historical Database on European Agriculture, Food and Policies, Leuven:LICOS Centre for Institutions and Economic Performance, forthcoming.
Swinnen, J. and H. de Gorter (1993), ‘Why Small Groups and Low Income Sectors ObtainSubsidies: The ‘‘Altruistic’’ Side of a ‘‘Self-Interested’’ Government’, Economics and Politics,5, 3, 285–96.
Swinnen, J. and S. Rozelle (2009), ‘Governance Structures and Resource Policy: Insights fromAgricultural Transition’, Annual Review of Resource Economics, 1, 1, forthcoming.
Swinnen, J., A. N. Banerjee and H. de Gorter (2001), ‘Economic Development, InstitutionalChange, and the Political Economy of Agricultural Protection. An Econometric Study ofBelgium since the 19th Century’, Agricultural Economics, 26, 1, 25–43.
Toutain, J.-C. (1961), ‘La croissance du produit de l’agriculture entre 1700–1958’, Cahiers del’I.S.E.A, 115, 1–287.
Tracy, M. (1989), Government and Agriculture in Western Europe 1880–1988 (London:Granada).
Van den Noort, P. C. (1980), Inleiding Tot de Algemene Agrarische Economie (Leiden,Antwerpen: Stenfer Kroese Uitgevers).
Van Molle, L. (1984), ‘100 jaar Ministerie van Landbouw’, Agricontact (Brussels: Ministerievan Landbouw).
Van Molle, L. (1989), Katholieken en Landbouw. Landbouwpolitiek in Belgie 1984–1914(Leuven: Universitaire Pers Leuven).
van Tijn, G. (1977), Algemene Geschiedenis der Nederlanden, boekdeel XII (Bursum: Unieboekbv), 145–64.
Van Zanden, J. L. (1986). ‘Modernisering en de toenemende betekenis van de overheid: 1800–1950’, in L. Noordegraaf (ed.), Agrarische Geschiedenis van Nederland (Gravenhage, TheNetherlands: Staatsuitgeverij), 85–141.
Vander Vaeren, J. (1930), De Voornaamste Feiten uit eene eeuw Geschiedenis van denBelgischen Landbouw 1830–1930 (Leuven: Ets Fr Ceuterick).
Williamson, J. G. (2006), Globalization and the Poor Periphery before 1950 (Cambridge, MA:MIT Press).
� 2009 The AuthorJournal compilation � Blackwell Publishing Ltd. 2009