NASACONTRACTOR REPORT vl, Q P N & U THERMAL AND STRUCTURAL TESTS OF A HYDROGEN COOLED PANEL by C. E, Xz’chard, J. 13. Dzlncmz, Ei W. Gellersen, und C. Demogenes Prepared by AIRESEARCH MANUFACTURING COMPANY THE GARRETT CORPORATION Los Angeles, Calif. 90009 for Langley Research Center NATIONAL AERONAUTICS AND SPACE ADMINISTRATION l WASHINGTON, D. C. l AUGUST 1972 https://ntrs.nasa.gov/search.jsp?R=19720022273 2018-07-08T00:00:32+00:00Z
Transcript
NASACONTRACTOR
REPORT
vl, Q P
N
& U
THERMAL AND STRUCTURAL TESTS OF A HYDROGEN COOLED PANEL
by C. E, Xz’chard, J. 13. Dzlncmz, Ei W. Gellersen,
und C. Demogenes
Prepared by
AIRESEARCH MANUFACTURING COMPANY
THE GARRETT CORPORATION
Los Angeles, Calif. 90009
for Langley Research Center
NATIONAL AERONAUTICS AND SPACE ADMINISTRATION l WASHINGTON, D. C. l AUGUST 1972
R THFF!MAI TFSTS 19. Security Classif. (of this report) 20. Security Classif. (of this page) 21. No. of Pages 22. Price*
UNCLASSIFIED Unclassified 55 4 3.00
*For sale by the National Technical Information Service, Springfield, Virginia 22151
. -
FOREWORD
This report was prepared by AiResearch Manufacturing Company, a division of The Garrett Corporation, Los Angeles, California for the Langley Research Center of the National Aeronautics and Space Administration. This report presents the results of an experimental study performed under Task Order No. 6, “Thermal and Structural Evaluation of Hydrogen Cooled Panels.” The work is part of a comprehensive analytical and experimental study of regenera- t ively cooled panels performed under Contract NAS I-5002.
. . * I I I
,\ *:.
THERMAL AND STRUCTURAL TESTS OF A HYDROGEN COOLED PANEL
By C. E. Richard, J. D. Duncan, E. W. Gellersen, and C. Demogenes The Garrett Corporation
AiResearch Manufacturing Division
SUMMARY
A hydrogen-cooled panel was fabricated and experimentally evaluated to provide design data for regeneratively cooled panels. The design and test conditions were based on previous studies of cooled surfaces typical of hyper- sonic vehicle appl icat ions. A test panel assembly, which consisted of an Inconei 718 chevron web sandwich , attachment clips and I-beams and Inconei 625 heat exchanger and manifolds , was tested in an apparatus which applied pressure and radiant heat to the cooled surface. (including manifolds, seals,
Unit weight of the panel as fabricated and piping) was 6.94 ib/ft2 (34 kg/m2); however,
it was estimated that, using minimum weight components, a unit weight of 5.75 lb/ft2 (28 kg/m2) could be attained. The panel was tested to a maximum heat flux of 103 Btu/sec-ft2 (I I70 kW/m2), a maximum external surface pressure of I15 psi (790 kN/m2) and maximum measured surface metal temperature of 1930’R ( t070’K). Panel heat transfer performance was lower than expected because of non-uniform hydrogen flow and heating conditions.
INTRODUCTION
In hypersonic cruise vehicles, regenerative cooling is an attractive thermal protection method for regions with high heating rates for extended operating periods. It was shown in previous analytical studies (reference 1) that sand- wich construction provided the desired lightweight construction for such cooled surfaces, and related experimental studies with smal i specimens (references 2 and 3) verified that brazed superalloy sandwich panels would be suitable for this appl icat ion. The major objective of this program was to fabricate and test a hydrogen cooled panel which would be of representative size for a typcial vehicle design.
The test panel was a two-layer, brazed sandwich consisting of an Inconel 625 heat exchanger surface and an Inconel 718 structural layer. The panel was mechanically attached to Inconel 718 I-beams to complete the assembly. The configuration was representative of the bonded concept of reference 1. It was selected because the problems of fabrication and operation are typical of key areas in all of the concepts studied in reference 1.
This report presents the results of heat transfer and structural tests of a i4- by 20-in. (36 by 51 cm) hydrogen cooled panel. The design and testing goals for this study were:
Maximum heat flux = 100 Btu/sec-ft2 (I 140 kW/m2)
Maximum applied pressure = 100 psi (690 kN/m2)
Maximum metal temperature = 2000’R (I I lOoK)
Maximum coolant out let temperature (during external pressure appl icat ion) = 1600’R (~90~~)
To achieve these conditions, a test apparatus was designed and fabricated to apply radiant heat and external pressure loads to one side of the test panel.
SYMBOLS AND PARAMETERS
A
a
b
C
E
f
G
H
h
I
K2
K3
K4 L
M
m
area, in.2 (cm2)
beam length, in. (cm)
fin or chevron web spacing, in. (cm)
beam spacing, in. (cm)
elastic modulus, ksi (MN/m2)
ratio of tested to theoret ical fin tensile strength
shear modulus, ksi (MN/m2)
overal 1 heat transfer coefficient, Btu/sec-ft2-OR ( kW/m2-OK)
height, in. (cm)
moment of inertia, in.& (cm*)
core or web bending buck1 ing coefficient
core or web shear buck1 ing coefficient
beam flange buck1 ing coefficient
length, in. (cm)
bending moment, lb-in. (N-m)
bending moment, lb-in./in. (N-m/m)
P
P
Q
T
t
W
X
cy
A
6
P
0
7
load, lb(N) or lb/in. (N/m)
pressure, psi ( kN/m2)
heating rate, Btu/sec (kW)
Temperature, OR (OK)
thickness, in. (cm)
weight, lb (kg) or lb/in.2 (kg/m2)
distance, in. (cm)
mean coefficient of thermal expansion, in-/in.-OR (cm/cm-OK)
difference
deflect ion, in. (cm)
density, lb/in.3 ( kg/m3)
stress, ks i ( MN/m2)
shear stress, ks i ( MN/m2)
Subsc r i pt s
C core
cc critical buck1 ing
eq equivalent
F flange
f facesheet
fin fin
W web
TEST PANEL
Design
The test panel design evolved from previous analytical and experimental studies of minimum weight sandwich panels (references I through 3). The
3
previous design procedures were incorporated into a more detailed analysis which accounted for the expected test conditions, the test fixture interaction, and fabrication considerat ions. Pratt ical, lightweight solutions were found for components which were altered from, or more fully developed than, the previous structural model. However., incentives to produce small weight savings were compromised by fabrication costs, material lead times and details of the test insta 1 lat ion. Design considerations are presented in appendix A.
Description
The test panel is basically a two-layer sandwich consisting of an Inconel 625 heat exchanger surface and an Inconel 718 prime structural layer. The complete panel assembly. includes manifolding provisions for the heat exchanger and supporting structure provided by Inconel 718 I-beams which are bolted to Inconel 718 attachment clips on the prime panel structure.
Prime structure. - The prime panel, beams and attachment clips shown in figure la are the major elements (prime structure) which support the externally appl ied uniform pressure load. The rectangular web core prime panel consists of two 0.01 -in. (0.03 cm) thickness face sheets which braze to 0.31-in. (0.79 cm) height chevron webs. The web thickness and spacing were 0.006 and 0.2 in. (0.015 and 0.5 cm), respectively. The chevron rectangular-web design, a modi- f ication of the straight rectangular-web-core geometry of reference I, appre- ciably increases web lateral bending rigidity for a small weight increase. The added rigidity is necessary to avoid buckling due to concentrated compres- sive loads applied by the attachment clip webs. Figure la also shows the seal bar which compressed the test apparatus seal to restrict leakage around the perimeter of the panel during external pressurization. The seal bear and the seal between the test panel and test apparatus were not representative of the design for vehicle panel arrays studied in reference 1. The seal for the test panel was designed primarily to insure that pressure and thermal loads were not transmitted through the seal.
The 2.4-in. (6.1 cm) height I-beam design utilized the reference I analysis except for modifications to accommodate standard material sizes, end reinforce- ments for shear strength and lateral stability, and the bolts attaching the beams to the clips. The bolted connection permits sliding between the beam and clip thereby reducing thermal stresses in both the panel and the supporting beams. Beam and cl ip differential mot ions (along the beam) were accommodated by elongated bolt holes. The previous studies did not consider friction forces between the beam and beam support (figure la) due to differential thermal move- ments while the external surface is pressurized. Stress analyses (append ix A) indicate that unacceptably high stresses will exist in the beam web and attach- ment clips if sliding does not occur* For an actual vehicle application these stresses could be reduced through the use of a friction reducing device between the beam and beam support. For the test appl icat ion the effects of friction could be minimized by allowing the panel to approach thermal equilibrium before the pressure load is appl ied; however, because of other restraints this procedure was not followed (see section, TESTS).
4
The 0.26-in. (0.66 cm) height attachment clips were machined to the cross- section shown in figure la and brazed to the prime panel. The clips are critical structural members since they transmit external pressure forces to the beams and their rigidity.affects panel and beam interface loads. Whereas a cursory est i- mate of cl ip weight was obtained in reference 1, a comprehensive analysis of panel, clip and beam interface loads was performed in this study.
Cool inq system. - The Inconel 625 cooling system consists of two major components: the single-layer straight-through-flow heat exchanger, and the inlet and outlet manifolds on either end. Cooling system details at the hydrogen inlet are shown in figure lb. The basic heat exchanger consists of 0.05-in. (0.13 cm) height rectangular offset fins with 0.006-in. (0.015 cm) thickness and O-037-in. (0.094 cm) fin spacing and a cover sheet with a thickness of 0.010 in. (0.025 cm). The fin geometry was selected to ut i 1 ize available tool ing rather than provide optimum lightweight geometry. Gas flow between the heat exchanger and, manifolds was provided by fifty-six 0.05-in. (0.13 cm) diameter holes which were drilled in the adjacent Inconel 718 prime panel sheet. Rectangular header bars with an 0.05- by 0.05-in. (0.13 by 0.13 cm) cross-section enclosed the four sides of the heat exchanger.
Flow control across the panel width was achieved by introducing relatively high resistance paths so that variations in the heat exchanger fin array and the manifolds would not give large flow variations. Short sections of cross- wise fins at the heat exchanger inlet introduced a pressure drop of more than three times that of the basic fin array and the row of 0.05-in. (0.13 cm) dia- meter transfer holes, particularly at the outlet end, added a pressure drop roughly equivalent to that of the cross-flow fins. An alternate to the cross- flow fins was to drill a row of varying size holes to account for the variable geometry. However minimum hole size had to be about 0.02 in. (0.05 cm) and blockage during brazing was poss,ible. Flow control was also introduced since transient temperature analyses and previous test experience indicated that the headers would operate at higher temperatures than the fin array* Therefore a space (about equal to two fin spat ings) was provided between headers and adjacent fins along the entire panel flow length to provide excess header cooling.
The basic manifold consisted of a single machined part, shown in figure Ic* The open side brazes to the Inconel 718 sheet which is common to the heat ex- changer and prime panel. Connection of the external piping system was provided by a plug which was brazed to the Inconel 718 sheet to provide reinforcement for the unsupported sheet area- Fittings, butt-welded to the plugs, provided a threaded connect ion which facil itated assembly. The manifold locally replaced the prime panel (figure lb) and was therefore integral with the panel rather than a separate component as in reference 1. In addition, the previous study consid- ered a plate-fin design rather than a machined manifold. The latter approach was selected since the reduced number of external braze joints facil itated sealing although a plate-fin design approach would have been lighter.
5
Fabr icat ion
Standard techniques were used in manufacturing the various panel components. Manufacturing complexity was avoided where the weight savings were a small per- centage of panel weight. For example, control of manufacturing tolerances was generally not attempted and typical tolerance ranges could produce about 5 to IO percent variations in component weights. Both welding and brazing operations were performed to obtain the fully fabricated panel. In the discussion that follows the impact of the various fabrication operations on panel design are emphasized, rather than the techniques themselves. The verification of panel coolant containment capabi 1 ity, an important step in the fabricat ion process, and panel repairs are also discussed.
Fabricat ion of three ident ical panels was attempted. One panel was lost in manufacturing due to braze contamination. The other two were successfully fabricated and tested; however, one of these was damaged several times during the initial test attempts and although successfully repaired, it was not used for the tests reported herein. The panel used for the tests was also repaired; initially to remove braze alloy blockage revealed by x-ray and temperature sensitive paint examinations and later to repair minor surface damage due to arcing from the radiant heater.
Brazinq and welding.- Brazing was performed in a two-step operation; the first
b operation joined the cooling system and the second added the prime panel,
attachment clips and sealing bars. These separate brazing cycles permitted a complete pressure containment check when the critical joints between the prime panel and the cooling system were exposed. Some braze repairs of the sheet-to- header bar region were required after the first braze cycle on one panel. The outlet pipe connections to the manifold plugs were the only post-braze welding operations on the cooling system. Based on the reference 2 results, Palniro 7 (70 Au, 8 Pd, 22 Ni) braze alloy was used for both braze operations.
Coolant containment verif icat iqn. - Subsequent to panel fabrication, and after a leak tight cool ing system was obtained, the plate-f in heat exchanger was examined by x-ray photographs and stresscoat pressure tests. The purpose of these tests was to verify that no unbrazed areas existed which would lead to unacceptable fin and sheet loads and that no excessive concentrations of braze alloy existed which would disturb or block hydrogen flow and thereby reduce heat transfer performance.
The x-ray examinations of braze alloy distribution (braze alloy density greater than the parent metal density is required for detection) showed some small unbrazed regions (one or two adjacent fins), however subsequent stress- coat testing was then performed to accurately interpret the possible degradation- From the x-rays it also appeared that both successfully fabricated panels had fin passages with excessive braze alloy at the edges near the coolant outlet. This is illustrated by the x-ray photograph in figure 2a. A more extensive area with excessive braze alloy (not shown) was detected in one corner of the panel used in the test program- Initial tests with temperature sensitive paint applied to the surface indicated that severe flow blockage existed and the area was subsequently repaired as described below.
Thermal paint was useful for indicating relative temperatures on the panel surface. However, accurate temperature measurements were undependable since paint thickness had a significant effect in the radiant heating environment. This technique was therefore used in initial flow pattern evaluations in con- junction with x-ray photographs. A typical panel surface profile is shown in figure 2b.
Stresscoat testing proved to be an accurate method of heat exchanger pres- sure containment evaluation. The panel was coated with a stresscoat compound with a strain sensitivity of 450 to 500 ulin./in. (u&m/cm) and pressurized to 1000 psi (6900 kN/m2) in about IO0 psi (690 kN/m2) increments. A typical final crack pattern is shown in figure 2~. There was no evidence of unbrated areas in the critical stress locations at the hydrogen outlet area, however small un- brazed regions occurred in the center of the panel where operating temperatures are less than 1200’R (670°K) and excess strength was available. The manifold patterns, visible in the photo, are associated with the unsupported spans be- tween the machined webs; 200 psi (1380 kN/m2).
and the initial cracks appeared in these areas at about
- Several repairs were performed on the Inconel 625 heat exchanger fol lowing damage incurred during test equipment tryout runs. In two cases, test equipment difficulties led to an overheating of the Inconel 625 face sheet with a resulting failure at the fin-to-sheet braze joint. These failures were repaired by locally removing the O.OlO-in. (0.025 cm) face sheet and rebrazing a 0.015-in. (0.038 cm) sheet over the fins and header bars. While it was not attempted, repairs appeared feasible with the original thick- ness to maintain a smooth aerodynamic surface.
As previously discussed, excessive braze alloy was removed from one panel. The local area was removed by Electric Discharge Machining and replacement fins and face sheet were brazed into the panel. A satisfactory repair was verifled by x-ray, stresscoat, and leakage tests except that an additional leak was dis- covered between the heat exchanger and the Inconel 718 structural sandwich near the exit of the heat exchanger. Rather than attempting further repairs, the structural sandwich was sealed externally and subsequently used as part of the hydrogen pressure containment structure. As a consequence, hydrogen outlet pressure was minimized during the tests to avoid overpressurizing the structural sandwich.
TEST APPARATUS
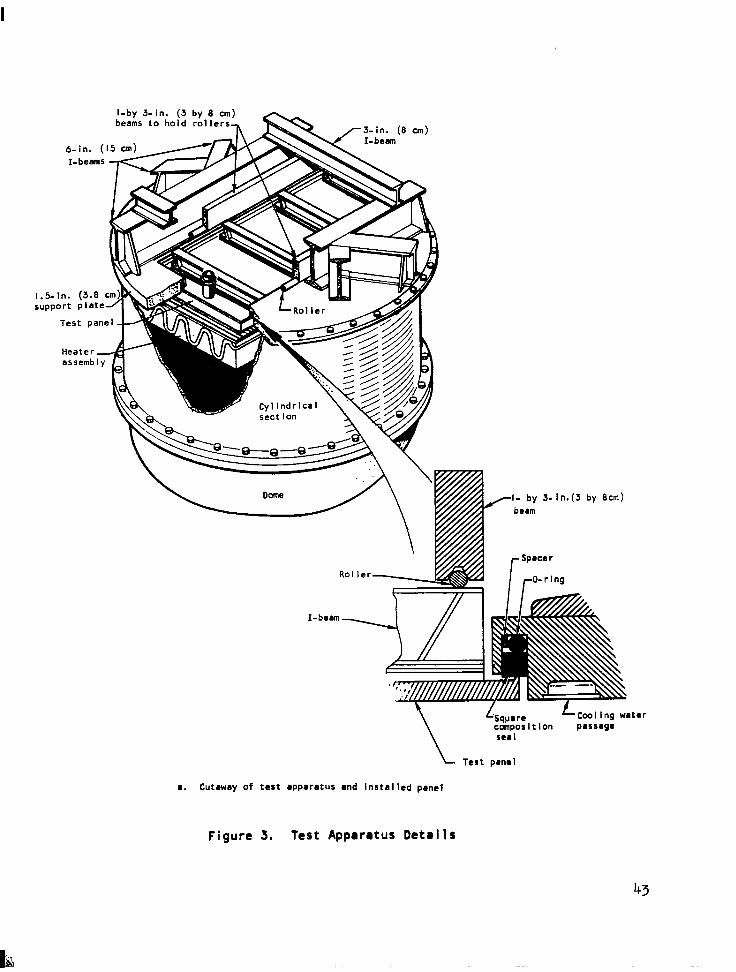
The test apparatus, designed and constructed for evaluating the panel assem- bly is shown in figure 3. The cutaway view in figure 3a shows the major compon- ents such as the reinforced support plate with a cutout for the panel, the cylindrical section holding the radiant heater, and the dome (not shown for clarity is a small pneumatic cyl inder that, mounted centrally over the panel, supported the panel and preloaded it against the seal during initial test apparatus pressur izat ion) l Panel surface pressure forces were obtained by pressurizing the cavity formed by the flat support plate, cylindrical section and dome. Pressure forces on the panel surface were transmitted through two I- by 3-in. (3 by 8 cm) beams to the 3- and 6-in. (8 and 15 cm) I-beams
7
reinforcing the l-5-in. (3.8 cm) thickness support plate. The bolted joint at the support plate and cylinder interface provided access to the panel surface and the heater as shown by figures 3b and c) respectively. The heater, suppl ied by the Government, consisted of a rectangular array of carbon strips mounted on water-cooled terminals above a water-cooled reflector which directed the radiant heat toward the panel surface. An external view of the test apparatus readied for testing operations is shown in figure 3d. Design cons iderat ions for the test apparatus are discussed in appendix B.
Sealing Provisions
A cross-section of the seal around the perimeter of the rectangular cutout in the reinforced table is shown schematically in figure 3a. Due to the rela- t ively large out-of-plane different ial thermal expansion and pressure load deflect ions, the seal arrangement was required to deflect as much as about 0.2 in. (0.5 cm) without introducing panel loads greater than IO lb/in. (I.8 kN/m) . Thermal distortions of the unloaded panel are indicated in figure 4. Essentially all of the deflections associated with bowing of the relatively stiff beams (61 Or 62) had to be accommodated by seal deflect ion. However, the seal was not required to accommodate all of the distortion indicated along the length of the panel (63) since panel stiffness is relatively low and sealing is achieved by panel bending combined with seal penetration and deflection. The composition seal and O-ring comb inat ion shown in figure 3a was selected to satisfy the sealing requirements; the composition seal protects the O-ring from radiation and conduct ion heating, and the nonmetallic O-ring provides large deflection capability for small load levels. The spacer positions the O-ring directly under the panel seal bar to prevent rotation of the square composition seal.
Utilities
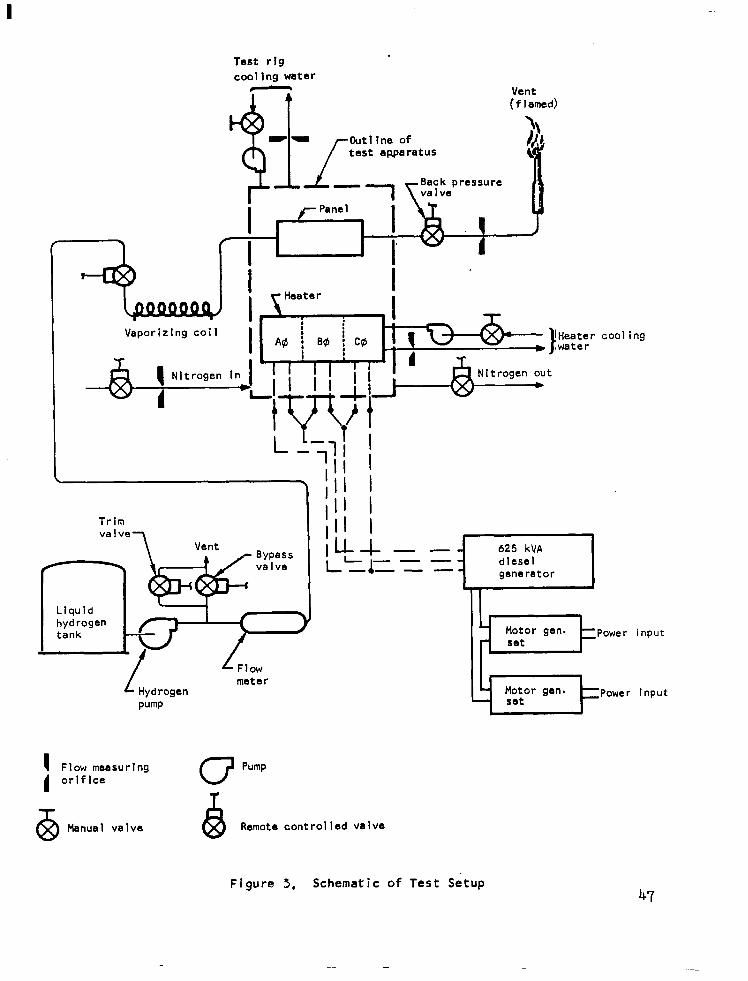
The various circuits required to supply gases, water, and electricity to the test apparatus are shown schematically in figure 5.
Electricity. - Power to the three phase, Delta connected heater was supplied by a 480 V, 625 kVA, 60 A wye connected diesel generator. Output of the diesel generator was controlled by externally exciting the field of the generator with a small direct current motor generator (two motor generators connected in series were requi red for some tests) l This method of control was adopted after inter- actions between an ignitron-type power controller and the voltage regulator of the diesel generator caused voltage surges and arcing which damaged both the heater and the test panel.
Water. - Two cool ing water circuits were used. One circuit provided cooling for the terminals and reflector of the radiant heater; the other provided cool- ing for the port ion of the support plate exposed to the heater (figure 3a).
Water for both circuits was stored in and recirculated to a 5000 gal (19 ms) gal lon storage tank.
8
Nitroqen. - Gaseous nitrogen from high pressure storage bottles was used to purge and pressurize the cavity of the test apparatus. The nitrogen provided a non-reactive atmosphere for the graphite heater and was introduced in such a manner as to provide additional cooling for low temperature insulating couplings used to electrically isolate the water cooling circuits from the heater terminals and reflector.
- Hydrogen for cooling the test panel was stored as a liquid in a m3) tank with a positive displacement, variable speed pump de-
1 ivery system. Hydrogen was vaporized and preheated to approximately 200’R (I lOoK) prior to entering the panel. Hydrogen exiting from the panel was dis- charged through a vent stack and burned.
He1 ium. - Gaseous helium from high pressure storage bottles (not shown in figure 5) was used to purge the hydrogen system before and after each test.
INSTRUMENTATION
Temperatures were measured with three types of thermocouples: copper- constantan for hydrogen and nitrogen inlet temperatures; chromel-alumel for cooling water, test apparatus ambient (nitrogen outlet), hydrogen outlet and netal temperatures on panel areas not exposed to the heater; and 13 percent rhodium platinum-platinum for panel regions exposed to the heater. Al so, special water-cooled thermocouples suppl ied by NASA prevented wire insulation !Gnage and temperature reading errors due to exposure to heater radiation. Ca i ibrat ion at representative heat fluxes verified that temperature measure- ment s were accurate. The readout equipment for the thermocouples was a combina- tion of CEC recorder, direct reading Brown recorders, and a potentiometer.
Bourdon-tube pressure gauges, manometers (water and/or mercury) and pressure transducers were used in the tests. Al 1 gauges were visually monitored and, in addit ion, the hydrogen and rig transducer outputs were recorded.
I-beam deflections were measured with G. L. Co1 1 ins (Model SS104) 1 inear motion transducers and recorded on a Sandbourn recorder. The transducers were calibrated using a 0- to l-in. (0 to 2.5 cm) micrometer with an accuracy of 0.001 in. (0.025 mm).
TESTS
Three types of tests were performed: heat transfer tests with hydrogen cooling, structural tests with external pressure loads, and combined heat trans- fer and structural tests with simultaneous heating and external pressure appii- cat ion.
Heat transfer tests. - Heat transfer tests were conducted by applying radiant heat to the hydrogen cooled panel surface. The objective was to reach a maximum uniform heat flux of 100 Btu/sec-ft’ (1140 kW/m*) and a maximum
hydrogen outlet temperature of 1910°R (iO6O’K) (corresponding to a 2000’R (I II0 K) maximum surface metal temperature). The test series, summarized in table I, consisted of increasing the hydrogen outlet temperature while main- taining the maximum heat flux; temperature (i.e.
then maintaining the maximum hydrogen outlet maximum metal temperature) while reducing the heat flux to
about 40 Btu/sec-ft2 (450 kW/m2).
The test procedure was to first establish hydrogen flow at a predetermined level (as measured by orifice plates). Then power was applied to the heater and gradually increased until the hydrogen outlet temperature (the most sensi- tive measure of power and flow conditions) approached the desired test condi- t ions. Hydrogen flow rate, heat flux (based on hydrogen inlet and outlet temperatures and flow rate) and maximum metal temperature were determined and power and hydrogen flow were then adjusted to obtain the desired heat flux and max imum meta 1 temperature- In changing test conditions, hydrogen flow was always increased first and decreased last to avoid exceeding the design metal temperatures. Data were recorded only after steady-state conditions were attained.
The desired 100 Btu/sec-ft2 (I 140 kW/m*) heat.ing rate was not reached dur- ing the initial heat transfer tests since the single motor generator set excit- ing the generator field did not have sufficient power. In the later combined heat transfer and structural tests an additional motor generator set provided the required power and a heat flux of 103 Btu/sec-ft2 (I I70 kW/m*) was attained. In deference to damage sustained by the test panel due to equipment difficulties in the initial test a.ttempts and subsequent repair, the maximum surface metal temperature was 1 imited to approximately 1900’R (106O’K) ( lOOoR (56’K) less than the design temperature), and no attempt was made to maintain the design hydrogen outlet pressure (see subparagraph, Panel reoai rs).
Structural testy. - Panel capabil ity for uniform normal pressure loads was evaluated by pressurizing the test apparatus. The object ive was to achieve a maximum pressure of 100 psi (690 kN/m*) with uniform metal temperatures of room temperature and 1600’R (890’K). The 1600’R (890°K) temperature represents the crossover between short time limited and creep rupture limited strength designs of Inconel 718. Higher maximum metal temperatures would conserve coolant (assuming coolant outlet and maximum metal temperatures are equal) however appreciable weight penalties are incurred due to rapid decreases in creep strength. Uniform temperature conditions were desired so that thermal stresses would not be a factor.
The pane; was initially loaded to about 3 to 5 psi (21 to 34 kN/m2) by the actuator to aid in establishing a seal around the panel perimeter. Nitrogen gas was then introduced into the apparatus and when pressure increases indicated sealing the actuator load was removed. This sequence was reversed when the pressure load was removed from the panel. Nitrogen gas pressure was increased to, and dec reased from, the 100 psi (690 kN/m*) maximum pressure in approxi- mately 20 psi (I40 kN/m2) increments. I-beam deflections were recorded at each pressure level.
10
J I’
For the elevated temperature pressure tests a low heating rate was applied to the panel to achieve a uniform metal temperature of l600’R (890’K). The beam side of the panel was insulated with Fiberfrax to minimize heat loss. However,- panel in-depth and in-plane temperature gradients due to heat flux non-uniform- ities and heat loss to the environment prevented testing at a uniform maximum temperature of l600’R (890’K).
Combined tests. - In an actual appl ication, heat ing and externa 1 pressure loads would occur simultaneously. Tests to simulate such conditions were per- formed with the objective of applying a 100 Btu/sec-ft2 ( II40 kW/m2) heat flux and a 100 psi (690 kN/m2) normal pressure. A maximum hydrogen outlet tempera- ture of 1600’R (890’K) was desired to be consistent with the maxjmum Inconel 718 prime panel temperature discussed above.
to achieve the sea.1 o surize the concerning Consequent
The intended procedure for these combined tests was to first establish the 100 Btu/sec-ft2 (II40 kW/m2) heat flux and then to apply the external nitrogen pressure in increments to 100 psi (690 kN/m2). This would permit the panel
steady thermodynamic conditions prior to sealing and avoid damaging ial attempts to pres-
there was uncertainty I140 kW/m*) heat flux.
prior to heating.
r the panel assembly. However, during the init panel the heater was damaged due to arcing and its capability to operate at 100 Btu/sec-ft2 (
ly, the maximum design pressure was established
RESULTS AND DISCUSSIONS
Weight
The fabricated panel, shown in figure 6, had a total (6. I kg)-or a unit weight for the l4- by 20-in. (36 by 51
weight of 13.44 lb cm) area of 6.94 Ib/ft’
(34 kg/m’). Weights of the components are summarized in table 2 and discussed for the major components in appendix A. However, several of these components ( including fins, manifolds, and seals) were not minimum weight because of cost
and atypical test constraints. It is estimated that using the establ ished fabricating techniques and minimum weight components a unit weight of 5.75 lb/ft* (28 kg/m*) could be attained. This is approximately I I percent higher than the unit weight of 5.04 Ib/ft* (25 kg/m’) that would be predicted for this size panel at the desi n operating conditions (100 Btu/sec-ft* (I140 kW/m*) heat flux,
9 100 psi (690 kN/m ) normal pressure, and a 1600’R (890’K) hydrogen outlet tempera- ture) based on the less detailed design analysis of reference 10
Heat Transfer Performance
The heat transfer tests are summarized and compared to the design conditions in table 3a. The first seven points were heat transfer tests and the next three are combined tests. Heat fluxes reached 103 Btu/sec-ft* ( 1170 kW/m’), hydrogen outlet temperatures were from COO to 1580’R (330 to 880°K), and the maximum sur- face metal temperature was 1931°R (1070’K). The above heat flux was applied during the combined heat transfer and structural tests, however the 100 psi
11
(690 kN/m2) external pressure was not simultaneously achieved. In subsequent tests at full pressure the heat flux reached 64 Btu/sec-ft2 (730 kW/m2) before heater failure terminated the tests.
An est itnate of panel heat transfer performance can be obtained from the ratios of test to theoretical overall heat transfer coefficients summarized in table 3b. Derivation of the separate coefficients is discussed in appendix C. The ratios based on the 1 inear average of the four surface thermocouple measure- ments (table 3a) varied from 0.46 to I.78 with an average ratio of 0.77 for the ten test points. Surface thermocouple locations are shown in figure 7a. For both cases in which the ratio exceeded unity, the temperatures measured by thermocouple 4 (which subsequently became inoperative) are considerably lower than the temperature measured at other locations. If thermocouple 4 is ignored for those two test points the ratios become about 0.8 and the average of the ten readings is reduced to 0.63. The differences between test and theoret ical overal 1 heat transfer coefficient are attributed primarily to the assumption of uniform heat flux and flow over the panel surface used in the calculations. (Heat flux and flow non-uniformities were observed during the elevated tempera- ture structural and thermal paint tests, respectively.) In addition, the test values of the coefficient were related to the average surface metal temperature which is not well defined by four thermocouples when the temperature differences and gradients are large (table 3a). The disagreement between test and theory is not attributed to uncertainty in the theoretical predictions (exclusive of
assuming uniform flow and heat flux) since appendix C data reduction techniques utilized heat exchanger performance data later substantiated by tests.
St ructura 1 Performance
The primary design goal was satisfied by successful containment of internal hydrogen gas pressure and external uniform pressure loads. However, max imum srructural capability was not evaluated since the test conditions were generally less severe than design levels as shown in table 4 and stresses were not measured or indirectly indicated by component failure. Temperatures were estimated from clip and beam measurements 1 isted in table 5, (thermocouple locat ions are shown in figure 7b) and from average hydrogen gas and maximum surface metal tempera- tures.
Components comprising the Inconel 718 prime, pressure carrying structure were relatively highly loaded since surface pressures exceeded the 100 psi (690 kN/m2) design value. However, structural loads in the cool ing system were only a small fraction of the Inconel 625 capability since maximum coolant tempera- ture and pressure used in the tests were below design conditions (design condi- tions were not imposed due to previously sustained damage, see above).
Inconel 718 prime panel. - The most severe prime panel test conditions probably occurred during the Ii5 psi (790 kN/m*) pressure application in the elevated temperature structural test. This pressure exceeds the design goal however the maximum temperature was 980’R (540’K) rather than the desired i600°R (890’K) so panel strength was increased. The calculated maximum stress, based on nominal dimensions and uniform temperature, was 92 ks i (630 MN/m2) compared to an allowable stress of 98 ksi (680 MN/m’) l In the combined heat flux and
12
pressure test, a maximum pressure of 105 psi (720 kN/m2) was appl ied at a 1380’R (770’K) maximum metal temperature and a 330’R (180’K) temperature difference through the panel depth. Although this pressure was higher than the design goal, the temperature and temperature difference were considerably lower than the de- sign values of I600 and 400’R (890 and 220°K), respectively (see table 4). Consequently the calculated maximum stress was significantly lower than the a 1 lowable, 73 ksi (500 MN/m*) compared to 91 ks i (630 MN/m*).
Inconel 718 beams. - The most severe test conditions occurred on a central beam during the elevated temperature test at a pressure of 115 psi (790 kN/m*) and beam maximum temperature of 1065’R (590’K). A beam temperature difference of 265’R (150’K) occurred based on measurements of the beam adjacent to the outlet manifold,’ whereas the design assumpt ion was that beam temperature was un i form. This non-linear gradient across beam height resulted in a maximum thermal stress of 7 ksi (48 MN/m2). The maximum combined thermal and pressure stress was 101 ksi (700 MN/m2) compared to an allowable stress of 96 ksi (660 MN/m*) .
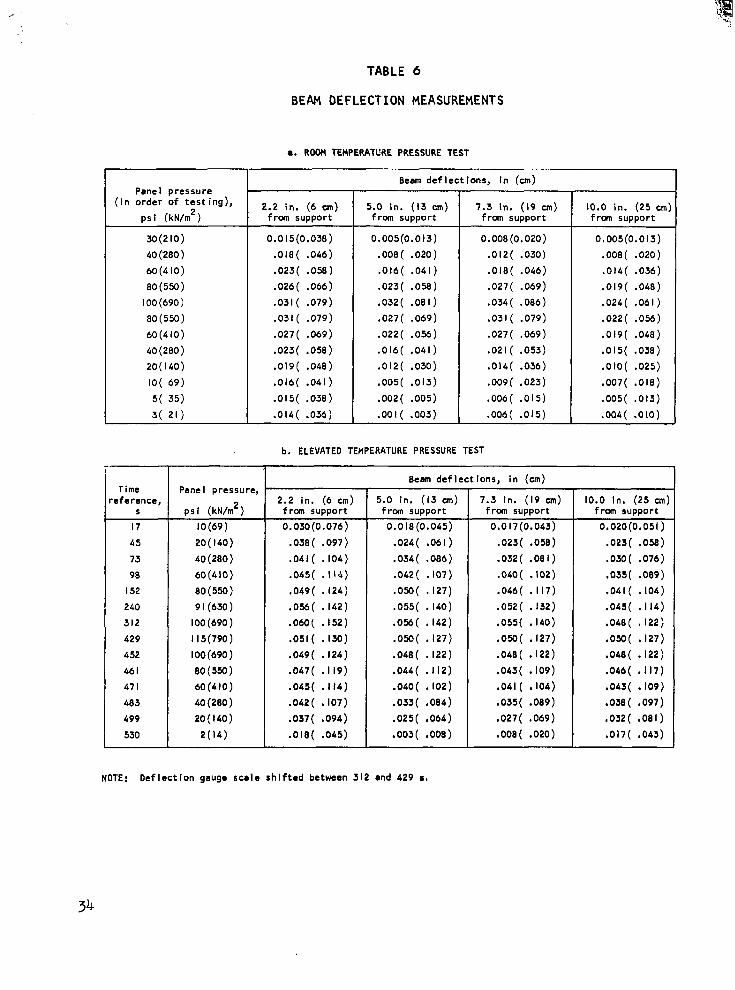
Beam deflections were monitored during the tests and the results are shown in table 6 (the associated thermocouple measurements are in table 5 and deflec- t ion gauge locations are shown in figure 7~). A comparison of the test deflec- tions and theoretical predictions for the pressure tests are provided in figures 8, 9 and IO. The predicted deflect ions due to pressure and temperature gradients are discussed in appendix C. The theoretical deflections were comparable to the measured values with the largest variations between the test data and theory of about 20 percent occurring in the elevated temperature and combined tests (figures 9b and lob). This agreement appears to be within the measuring accuracy ,about kO.002 in. (0.005 cm) especially since temperature gradients could par- tially contribute to the differences (uniform beam temperature was used for the calculated curves). There was also considerable scatter in the room temperature test data including a noticeable difference between the load and unload curves. The measurement accuracy and a systematic error (see appendix C) would account for the difference between load appi ication and rel.ease.
A comparison of test data and theory for beam deflection vs. temperature difference across the beam height is shown in figure IOc. Considering the limited temperature data obtained on the beam, the scatter is reasonable and there was good agreement between test data and theory.
Inconel 718 attachment clips. - The most severe loading conditions were probably imposed on the attachment cl ips during the combined tests at a pressure of 105 psi (710 kN/m2), maximum temperature of 1210°R (670°K), and a temperature difference across the clip height of 320’R (180’K). Although higher pressures (I I5 psi (790 kN/m2)) were applied during the elevated temperature test, the temperature and temperature difference across the clips were higher for the com- bined tests and the Ioading sequence (pressure, then temperature) probably in- duced additional loads in the clips. With this loading sequence the ability of the beams to slide along the beam support to accommodate thermal growth is in- hibited by friction forces and the resulting offset between the clip and beam webs may induce large loads in the beams and clips. Since the amount of offset was unknown a quantitative analysis of the clip stresses was not attempted; how- ever, no visual damage was detected in post-test examination of the cl ips.
13
CONCLUDING REMARKS
A hydrogen cooled panel was fabricated and experimentally evaluated to provide design data for regeneratively cooled panels for application to hyper- sonic aircraft. Test panel configuration, test conditions, material select ion and optimum design techniques were based on previous analytical and experimental studies of regeneratively cooled panels reported in references 1 and 2. The test panel was designed for a maximum metal temperature of 200O”R (liiO”K), applied heat flux of 100 Btu/sec-ft2 (ii40 kW/m2), and a maximum external surface pres- sure of 100 psi (690 kN/m2). The panel was tested in an apparatus using inert gas to apply surface pressure and a graphite heater to radiantly heat the cooled surface.
A satisfactory panel assembly with a i4- by 20-in. (36 by 51 cm) plan area was fabricated using state-of-the-art techniques. The structure included a two layer brazed sandwich panel with an Inconel 625 heat exchanger and an Inconel 718 chevron web core sandwich. The two layer sandwich also incorporated integral Inconel 625 manifolds for hydrogen coolant access to the heat exchanger. Supporting structure included Inconel 718 I-beams and attachment clips. The flexibility of the fabrication technique was demonstrated by successful repairs which were requi red when the Inconel 625 heat exchanger was damaged during testing. Unit weight of the panel as fabricated (including manifolds, seals, and piping) was 6.94 lb/ft2 (34 kg/m2); however, it was estimated that using minimum weight components a unit weight of 5.75 lb/ft2 (28 kg/m2) could be attained. This latter weight is approximately I1 percent greater than previous analytical predict ions.
The maximum heat flux applied to the panel was 103 Btu/sec-ft2 (I I70 kW/m2) and the maximum metal temperature was 1930’R (1070’K) during the tests. The maximum uniform normal pressure on the panel was 115 psi (790 kN/m2) at a maxi- mum temperature of 980’R (540’K) during the tests without hydrogen cooling. The above maximum pressure created the most severe loads on the Inconel 718 chevron web sandwich and I-beams, whereas other heating and loading conditions produced the highest stresses in other components. Panel heat transfer performance was generally lower than expected, apparently due to flow and heater non-uniformities. Based on the average measured surface temperatures the average overall heat transfer coefficient was 63 percent of the value predicted for uniform hydrogen flow and heat flux.
14
APPENDIX A
PANEL DESIGN
The comprehensive heat transfer and structural analyses performed for the panel design were based on reference 1 design procedures. Those simpl if ied procedures facilitated calculations of panel and beam geometries for a wide range of loading conditions however a detailed design was required for thls evaluation. The increased details occurred primarily in the structural aspects, with a resulting,impact on weight, as emphasized in this appendix.
Structural design followed reference 1 in that a safety factor of 1.5 on the material yield, creep strength, or buckling strength was used for external pressure loads and coolant.containment. The safety factor was incorporated with material properties to determine allowable stress levels, Inconel 718 and Inconel 625 material properties were obtained from references 4 and 5, respect- ively. When pressure containment was not a factor, stresses were permitted to exceed yield if 3000 or more cycles could be estimated to ensure 300 cycle life. The design life was 100 hr although the anticipated test duration was about 20 hr.
Inconel 718 Prime Panel
Panel geometry was initially selected for a 2 by 2-ft (0.6 by 0.6 m) panel area, a 1600’R (890’K) coolant outlet temperature and a 100 psi (690 kN/m2) applied pressure load. Subsequent si ze modi f i cat ions were accommodated by adjusting beam spacing since the panel geometry was established for earlier reference 2 tests. A four-beam array with a beam spacing and panel overhang of of 5.24 in. (13.3 cm) and 2.14 in. (5.43 cm), respectively, was selected to satisfy moment balance at the clips. This spacing geometry provided the best utilization of prime panel strength since the minimum design moment for four supports was obtained. Based on nominal dimensions, the maximum panel bending moment at the clip was 272 lb-in./in. (1210 N-m/m) at the 100 psi (690 kN/m2) design pressure whereas flexure test panel specimens with the same geometry (reference 2) produced a minimum ultimate (buckling) bending moment under com- bined shear and bending of 440 lb-in./in. (1960 N-m/m) at 1600’R (89O’K).
Pressure stresses. - The prime panel design for pressure loads was initiated by determining the maximum beam spacing that would satisfy panel bending strength. The requirement for moment balance at the clips was satisfied by equating the fixed ended beam bending moment, ml> to the cantilever bending moment, m2; where
ml = p&l2
m2 = PL2/2
15
The maximum acceptable beam spacing was 5.24 in.(l3.3 cm) so the moment at the beams was
m = pc*/12 = 100 (5.24)*/12 = 230 lb-in/in.(l020 N-m/m)
The associated bending stress is about 68 ksi (470 MN/m*) assuming that yield occurs at the test moment of 440 lb-irJin.( 1960 N-m]m). The computed value was 51 to 75 ksi (350 to 520 MN/m*), depending on tolerance variations and the amount of creep relaxation of the Inconel 625 heat exchanger. These stresses occur at the clip, however, the bending moment midway between beams is one half the maximum value, or at most 38 ksi (260 MN/m2).
Additional minor pressure stresses arise due to beam bowing, manifold rigidity, support beam deflection, and misalignment between the clip and beam webs. Beam bowing introduces stresses perpendicular to the primary pressure bending stress and the equivalent stress given by
u = eq JU12 - up2 + u2* (1)
must be computed. The stress due to beam bowing is dependent on panel no-flow bending stiffness and, assumingthat no-flow stiffness was 20 percent of the flow stiffness (parallel to the chevron webs), stresses were estimated to be about 5 ksi (34 MN/m*). The other three interactions; manifold rigidity, sup- port beam deflection, and clip and beam web misalignment would increase panel bending moment from 230 to 272 lb-in./in. (1020 to 1210 N-m/m , thereby increas-
2 ing maximum bending stress from 75 to 88 ksi (520 to 610 MN/m ). However when combined with the 5 ksi (34 MN/m*) perpendicular stress we have an equivalent stress
u eq
= J88* -( 88) (-5) + (-5)* = 90 ksi (620 MN/m*)
This stress slightly exceeds the 87 ksi (600 MN/m*) allowable for Inconel 718 at 1600°R (890OK) based on yield strength. However the maximum stress level for nominal dimensions is about 80 ksi (550 MN/m*). This was the maximum stress in the prime panel, and it would occur due to 100 psi (690 kN/m*) pressure applica- tion with no thermal stresses.
Therma 1 stresses. - The principal prime panel thermal stresses occur during rapid heating or cooling of the panel. Furthermore, the major thermal stresses are caused by temperature gradients through the depth of the entire panel struc- ture, i.e. heat exchanger, prime panel, clips and beams. Heat transfer analysis of the composite structure indicated that in-depth ATIS equal to .the final surface temperature minus the initial beam temperatures (about 1500°R (830’K) maximum) would result from instantaneous heat application. This was considered to be too severe for the stru,cture and the more gradual heat application sequence shown in figure I I was selected. The resulting maximum thermal stresses for the selected heating profile indicated that simultaneous heating and external pressurization would not endanger panel performance.
16
The heating profile in figure II gives a maximum panel temperature dif- ference at 220 s after initiation of gas flow. The Inconel 625 facesheet and the Inconel 718 sheet adjacent to the clip develop a temperature difference of 400°R (220’K) and the Inconel 625 facesheet is 850’R (470’K) hotter than the clip web adjacent to the beam flange. Since the beams prevent panel bowing, biaxial thermal stresses are developed in the plane of the panel. However, due to the much lower panel stiffness in the no-flow direction, it was assumed that uniaxial thermal strains due to the 400’R (220’K) temperature difference are developed only in the strong stiffness direction. Consistent with this assump- tion, the clip would develop a thermal- strain due to the 450’R (250’K) differ- ence across its height rather than the 850’R (470’K) difference across the combined panel and clip. The, estimated temperature difference in the panel produces a thermal stress of about 40 ksi (280 MN/m*). This adds to the pres- sure stress at mids i s 78 ksi (540 MN/m r
an and subtracts at the clip so the maximum combined stress ) midway between the beams, a satisfactory stress level.
The above thermal stress can be estimated by considering a plate with a uniform temperature gradient across its thickness. If it is fully constrained from bowing, the thermal stresses are approximately
u = Ecu (T2 - T,) /2
For Inconel 718 at 1600’R (890’K) the stresses for a 400’R (220’K) temperature difference are 40 ksi (280 MN/m2) equal to the above value even though gradients in the composite panel are not uniform (figure I lb).
The nominal web shear stress was checked to determine that no yielding or buck1 ing would occur. The shear yield stress by distortion energy theory is 74 ksi (510 MN/m*) and the shear buck1 i ng stress is
7 cc = K3E (tC/h)* = 8.1 (24 x 106) (0.006/0.305)* = 75 ksi (520
MN/m* ) (2)
The allowable stress is therfore 49 koi (340 MN/m’), exceeding the maximum of
7 max = pc bf/2 tc = 100(5.24) (0.2)/2(0.006) = 29 ksi (200 MN/m*)
Concentrated compressive stresses will be applied to the panel webs by the attachment cl i ps. The chevron geometry was introduced to avoid local or general buck1 ing of the webs in this compressive load region. The maximum compressive stress was 87 ksi (600 MN/m*) assuming that one of the chevron web corners i ies directly over the clip web. The direct stress therefore equals the al lowable and the computed buckling strength was more than eight times the maximum applied load. Also, the chevron web locations were staggered with respect to the clip web and the average stress is less than the above maximum value.
Panel weisht. - The panel weight per unit area based on the nominal fabri- cated dimensions was 1.38 Ib/ft* (6.7 kg/m*). An additional contribution of 0. I8 lb/ft* (0.88 kg/m*) due to a 0.0026-in. (0.007 cm) thickness (two layers) of Palniro 7 braze alloy gives a total of 1.56 lb/ft* (7.6 kg/m*). The reference I
17
panel weight was 1.00 lb/ft* (4.9 kg/m*) although a direct comparison is not realistic since the test panel was designed for a 24-in.(61 cm) beam span rather than the fabricated width of I4 in.(36 cm) and braze alloy weight was not in- cluded previously. Based on equal design conditions, fabricated panel weight would exceed reference I estimates due to braze alloy contributions and the previous simpl if ied analyses. For equal facesheet and fin dimensions, the test panel was about 25 percent heavier than expected and this is a reasonable factor for estimating flight weight designs from the reference I weights.
The prime panel extends over an area of about 253 in? (1630 cm*) so the total weight was 2.74 lb (1.2 kg). The O.l-by 0.3-in.(0.3 by 0.8 cm) reinforc- ing bars enclosing the sides of the panel had a weight of 0.35 lb (0.16 kg). The bars were used to provide support for the seals during brazing, however their use was not considered to be required for typical vehicle applications.
Inconel 718 Beams
(13.3m.a - Beam design was performed for a spacing, c, of 5.24 in.
of I4 in.(36 cm). the optimum value of Lending moment,
Using reference I design techniques, M, divided by beam height cubed, h3, is
M/h3 = 203/*/3( K2E) ‘I*
where the stress, CT, is 130 ksi (900 MN/m*); the web buckling coefficient, K2, is 21.7; and the elastic modulus, E, is 24 x IO3 ksi (165 x IO3 MN/m*). This gives an (M/h’) value of 1365 psi (9400 kN/m*). The design moment for a I .5 safety factor on the 100 psi (690 kN/m*) uniform pressure load is
The assoc iated value of beam height is therefore 2.42 in.(6. I5 cm), The optimum thickness ratios for a flange buckling coefficient, K4, of 0 ,385 are
The resulting dimensions for b , tF and tw were 0.87, 0.053, 0.135 and 0.099 cm), respectivgly.
Web shear. - The maximum web shear stress, which occurs beam, is given by
T = 9 pca/16htw
and 0.039 in.(2.2,
at the ends of the
18
This shear stress must be compared to the shear yield stress of 74 ksi (510 MN/m*) and the web ,buckl ing stress. For the nominal geometry, equation 2 gives a buck1 ing stress of
7 cc = 8. I (24 x 106) ( 0.039/2.42)* = 50 ksi (340 MN/m*)
The allowable stress is therefore 33 ksi (230 MN/m*). The maximum shear stress at 100 psi (690 kN/m*) for the l2.5-in.(32 cm) span of the fabricated beams is
Since this exceeds the allowable, reinforcements, which also added lateral stability, were added at the ends of’the beam as shown in figure la.
Torsion. - Ciip loads which do not act through the geometric center of the beam cause torsional or shear stresses. The anqular rotation of the beam and
and the maximum applied clip were analyzed for several loadings (see below) moment was then related to beam shear stress by
T = Mt/J
where t is the maximum sect the open beam section, is
ion thickness. The tors ional moment of inert ia for
J = 0.67 bFtF3 +
The allowable clip moment is 14.8 lb-in/in.(66 N-m/m) and the resulting maximum shear stress for the above. beam geometry is about 7 ksi (48 MN/m*). This stress occurs near the ends of the beam when distributed loads are transmitted through an offset between the beam and clip web.
Beam torsional moments also arise from clip rotation and are transmitted to the beam by the attachment bolts. The resulting bending stress was computed for a unit width flange section reacting one-half of the above maxlmum clip moment. The maximum bending stress on the 0.053-in.(O.l35 cm) thickness flange is
u = 6M/t* = 6(7.4)/(0.053)* = I6 ksi (I IO MN/m*)
This estimated stress is locally applied at the joint between the flange and the web perpendicular to the pressure bending stresses. The combine stresses given by equation I slightly exceeded the allowable stress criterion however local deformation at this location will not impair the integrity of the beam,
Thermal st.resses. - The preliminary beam design assumption was that thermal stresses would be negligible since beam temperature would be uniform and prime panel, cl ip and heat exchanger temperature gradients would cause negl i gible beam loads. Subsequent thermal analyses showed substantial linear beam temperature gradients which lead to stress-free beam bowing except for the small restraining loads of the panel. However, beam thermocouple measurements during the tests showed a non-linear gradient characterized by an approximately linear tempera- ture decrease from the clip to midway between the flanges and constant temperature
19
in the remainder of the section. For this profile the maximum thermal stress, occurring in the web was about
CT = 0.4 E o AT
The maximum flange stress is about one-third of this web value and for a beam maximum temperature of 990'R (550'K) and a temperature difference of 265OR (150'K) the flange stress is about 7 ksi (48 MN/m2). The combined thermal and pressure stress must satisfy the same design criteria used for pressure stresses.
Beam flange bending stresses due to tensile bolt loads were within the allowable stress levels. The maximum loads occur during heating conditions without pressure application since compressive forces do not load the bolts. The maximum bolt load due to an 850'R (470'K) temperature difference across the panel and clip was estimated to be 117 lb (520 N) with a resultant maximum flange bending stress of 21 ksi (145 MN/m2).
Final desiqn and fabrication. - The beams utilized standard sheet material and they were fabricated by welding 0.08-in.(0.2 cm) flanges to a 0.04-in. (0.1 cm) web. To obtain the desired beam height and flange width the flanges were then machined. Resulting thicknesses were 0.061 to 0.073 in. (0.15 to 0.19 cm) on the solid flange and 0.056 to 0.062 in. (0.014 to 0.16 cm) on the flange with the bolt holes, and the effective thickness at the bolt holes was 0.037 to 0.040 in. (0.09 to 0.10 cm). However, finish machining to further minimize possible weight penalties was not performed. Also, beam geometry was not adjusted for the variable loading due to the different unsupported panel spans. The nominal beam span for the tests was 12.5 in. (32 cm) so the maximum bending moment on the beam adjacent to the outlet manifold, supporting 4.76 in. (12.1 cm) of the panel, was
M = 100 (4.76) (12.5)2/8 = 9300 lb-in. (1050 N-m)
The center beams support a span of 5.24 in. (13.3 cm) so the maximum moment was 10,200 lb-in. (II50 N-m). The maximum bending stresses on the beam at the outlet manifold and the adjacent central beam were 70 and 82 ksi (480 and 570 MN/m'), respectively. This satisfied the allowable stress of 87 ksi (600 MN/m2).
During the tests the pressure level was II5 psi (790 MN/m2) so the maximum estimated bending stress was 94 ksi (650 MN/m2). The 265'R (150°K) gradient discussed above caused an additional flange stress of about 7 ksi (48 MN/m'). The combined stress of IO1 ksi (700 MN/m2) exceeded the allowable stress of 97 ksi (670 MN/m3) for Inconel 718 at 990°R (550'K).
Beam weiqht. - Beam weight based on nominal fabrication drawinq dimensions was the same as the reference I prediction of 1.76 lb/ft2 (8.6 kg/m3), or 3.42 lb (1.55 kg) for four beams. Subsequent to fabrication the beams were weighed, giving a total of 4.32 lb (1.96 kg). The difference was attribured primarily to weld alloy. Since beam fabrication could have been performed by brazing or excess weld alloy could have been removed by machining, the added weight could be avoided in a flight-weight design. In addition, scalloping the flange with the bolts holes, a typical flight-weight design approach, would save about 0.21
lb (0.1 kg), so a realistic beam total weight would be 3.21 lb (1.46 kg) com- pared to the measured value of 4.32 lb (1.96 kg).
Inconel 718 Attachment Cl ips
Flanqe adiacent to prime panel. - The flange and adjacent panel face sheet were sized to support a maximum load of 547 lb/in. (96 N/m) acting at mid-span between chevron fin corners. A 100 psi (690 kN/m2) surface pressure acting on a span of 5.24 in. (13.3 cm) gives a 524 lb/in. (92 N/m) loading and the effects of support beam bowing, beam bowing and manifold resistance to bowing cause minor variations along the length of the clips. The maximum bending moment for a 0.5-in. ( I .3 cm) span, assuming fixed end beam conditions, was
M = pL/8 = (547)(0.5)/8 = 33 lb-in./in.(l47 N-m/m)
The required thickness for an allowable stress of 87 ksi (600 MN/m2) was 0.048 in. (0.13 cm). The panel facesheet thickness, including the contribution of the chevron fin tabs, was 0.012 in. (0.03 cm) so a clip flange thickness of 0.036 in. (0.09 cm) was required (a clip width of 0.87 in. (2.2 cm) guaranteed that one chevron corner was effective).
&. - The major stresses on the web arise due to (I) direct load trans- mission to the beam, (2) bending moments (bending axis parallel to clip axis), yld (3) bending of the clip and panel combination (bending axis parallel to
cuolant flow di rection). The first two loads cause additive stresses which vary across the web thickness. The third loading causes axial stresses perpendicular to the above stresses, and equation I determines the maximum combined stresses.
Pressure stresses: The direct compressive and bending stresses combine by the standard equation for a unit width beam.
u = P/t + 6M/t2 (3)
The maximum stress occurs adjacent to the beam at the 547 lb/in. (96 N/m) load and a bending moment of 6.1 lb-in./in. (27 N-m/m). The moment arlses prlmarily from mi sal ignment between the cl ip and beam webs although there is al so a con- tribution due to manifold resistance to beam bowing. The maximum stress for the nominal web thickness of 0.032 in. (0.08 cm) was therefore
The direct stress portion was therefore very low and column buckling strength exceeded the applied load by a factor of 20. The other stress component arises when beam deflection deforms the panel and clip to the beam curvature. The resulting stress of 32 ksi (220 MN/m2) combines with the above stress to give a maximum equivalent stress of
Thermal stresses: Heating causes temperature gradients through the panel depth and in the panel surface and beam restraint produced thermal loads in the clip. Maximum compressive loads due to the in-depth gradient of 400°R (220’K) at the 100 Btu/sec-ft2 (II40 kW/m2) conditions were about 100 lb/in. (I8 N/m) (the maximum tensile load of II7 lb/in. (20 N/m) does not occur in the highest web stress region). The in-plane temperature profile of the panel, 100 to 1600°R (56 to 890’K) along the hydrogen flow path, and the above compressive load acting on out-of-line clip and beam webs cause an estimated moment of 3.2 lb-in./in. (I4 N-m/m). The stress component due to this force and moment was
-22 ksi (150 MN/m2) by equation 3. An estimated perpendicular stress component of 40 ksi (280 MN/m2) arises due to restraint of panel bowing by the beams. The maximum equivalent thermal stress, by equation 2, was therefore 54 ksi (370 MN/m2 ) .
Combined pressure and thermal stresses: The combined effects of tempera- ture gradients and pressure causes stress components of -66 ksi (460 MN/m2) due to direct loads and bending and 72 ksi (500 MN/m2) due to beam bowing and re- straint of panel thermal bowing. The maximum combined stress due to the two components was 120 ksi (830 MN/m2) (this stress is not the sum of the separate loads since maximum values occur at different locations). So separate applica- tions of pressure and heat flux were acceptable whereas combined loads would have to be at reduced conditions to satisfy the allowable stress of 87 ksi (600 MN/m2 ) .
Flanqe adiacent to beam. - The highest loading on this flange occurs during heating conditions since compressive pressure loads do not cause appreciable bending stresses. The maximum direct flange load of II7 lb/in. (20 N/m) causes a bending stress at the bolt of 65 ksi (450 MN/m) in the 0.026-in. (0.066 cm) thickness sheet. The perpendicular stress component of 40 ksi (280 MN/m2) due to restraint of panel bowing combines to given an equivalent stress of 92 ksi ( 630 MN/m2 ) . This local stress at one extreme fiber sllghtly exceeds the al- lowable however the average across the thickness of 75 ksi (520 MN/m2) was acceptable.
Bolts. - The bolts (AN 500A6-5), had an area of 0.009 in.2 (0.06 cm2) so at the maximum load of II7 lb (520 N) the stress was I3 ksi
1 90 MN/m2). The
material allowable (steel) was a minimum of 21 ksi (140 MN/m ).
Clip and bolt weiqht. - The nominal cross-sectional area of the clip was 0.060 in’ (0.4 cm’) so the weight of 4 clips with lengths of I3 in. (33 cm) was 0.93 lb (0.42 kg). The bolt weight (including washers) was 0.26 lb (0.12 kg) giving a total of I.19 lb (0.54 kg) or 0.61 lb/ft2 (3.0 kg/m2) over the panel area. Removal of excess flange material between bolts would reduce welght by 0.10 lb. (0.05 kg) for a potential flight weight of 1.09 lb (0.50 kg). The reference I we1 ght was 0.86 1 b (0.39 kg).
22
Inconel 625 Heat Exchanger
Heat transfer analyses provided design temperatures and pressures for the cool i ng system. Table I summarizes calculations for the heat transfer tests and table 7 presents an example pressure drop distribution corresponding to the first test point in table I. Due to material strength limitations, heat ex- changer regions at the highest temperatures, 2000°R ( I I lOoK) on the surface and I 980°R ( I I OO’K) in the fin, govern the design. The associated design pressure
was 130 psi (900 kN/m2); 100 psi (690 kN/m2) outlet pressure plus 30 psi (210 kN/m2) pressure drop for the outlet manifolding. A maximum pressure of about 392 psi (2700 kN/m2) was expected (table 7 conditions) however stresses are a fraction of material capability due to the lower operating temperatures.
Fin. - The primary fin loading arises from internal hydrogen pressure which causezensile stress in the fin. Fin tensile stress is given by
(4)
The factor, f, which relates theoretical fin strength to tested performance, was determined to be 0.21 for Palniro 7 based on reference 2 tests, however limited creep tests performed for this program gave a factor of 0.12. The f stress for a spacing, bf in, of 0.036 in. (0.091 cm) and thickness, tfin, of
0.006 in. (0.015 cm) using the lower factor was 5.4 ksi (21 MN/m2) at the maximum pressure of 130 psi (900 kN/m2). At the hydrogen gas outlet there w ~
in
as an area unsupported by fins with a width of 0.06 in. (0. I5 cm). Creep rupture tests indicated that this gap would increase the stress by 43 percent giving a stress in the unsupported region of 7.7 ksi (53 MN/m2). The allowable creep rupture stress for Inconel 625 for the design operating life of 100 hr was 9.7 ksi (67 MN/m2).
Facesheet. - The design stress for the facesheet occurs at the 0.06-in. (0. Is-at the hydrogen outlet. The maximum pressure bending stress is
Q = 0.5 p (L/Q2
For a span of 0.06 in. (0.15 cm), a thickness of 0.01 in. (0.03 cm) and a pres- sure of 130 psi (900 kN/m2), the stress is 2.3 ksi (I6 MN/m2), much less than the facesheet allowable stress at 2000’R (lllO°K) of 8.8 ksi (61 MN/m2).
Weiqht. - The fin weight and facesheet weight per unit area is glven by
W = p (tf + tfin + htfin/bfin), lb/in.2 (kg/m2)
With the nominal fin geometry the weight was
W = 0.3 0.01 + 0.006 (I + (0.05/0.036)) I
= 0.0073 lb/in.2 (0.036 kg/m2)
23
I. -
The calculated heat exchanger weight for a fin area of I4 by 20 in. (36 by 51 cm), 0.05-by 0.05-in. (0.13 by 0.13 cm) header bars with a total length of 67.9 in. (1.72 m) and 0.35 lb (0.16 kg) of braze alloy (0.0013 in. (0.003 cm) thickness) was 2.44 lb (I. I I kg). The reference I estimate was 1.40 lb (0.64 kg) with 0.18 lb (0.08 kg) allocated for braze alloy, using a fin spacing of 0.05 in. (0.13 cm) and a fin thickness of 0.003 in. (0.008 cm). The fabricated panel weight exceeds the previous estimate due to the higher fin density and braze alloy weight. The potential weight of a flight design would be about 1.77 lb (0.80 kg) using the lighter fin geometry.
Inconel 625 Manifolds
Fin. - The machined manifolds had fins (webs) with a minimum thickness of 0.06 in. (0.15 cm) and a spacing of 0.25 in. (0.64 cm). The fin stress by equation 4 was 2.6 ksi ( I8 MN/m ) for a strength factor of 0. I2 and a 100 psi (690 kN/m2) design pressure. The Inconel 625 allowable stress for 100 hr at 1910°R (1060’K) is 14.3 ksi (99 MN/m2).
Unsupported spans. - The critical unsupported span (equivalent to heat ex- changer facesheet case) was the 0.3-in. (0.8 cm) height enclosing web or header bar. A minimum thickness of 0.019 in. (0.048 cm) occurred at a groove which was provided for local welding compatabi 1 ity with the Inconel 718 sheet between the heat exchanger and manifold. The maximum bending stress was IO.8 ksi (74 MN/m2), less than the above allowable stress.
Outlet pipe and plug. - The 321 stainless steel outlet pipe had with a l-in. (3 cm) diameter and a minimum wall thickness of 0.045 in. (0. I I cm). The cir- cumferential membrane stress is therefore about I. I ksi (7.6 MN/m2) whereas the allowable stress at 1910°R (1060°K) is about 5.4 ksi (37 MN/m2), so there was a large margin of safety.
The plug transfers the pipe pressure load to the Inconel 718 sheet separat- ing the heat exchanger and manifold. Stresses in the Inconel 625 plug were re!atively low with the maximum estimated to be less than I ksi (7 MN/m2).
qht. Wei - The weight of the manifolds and plugs, based on nominal fabri- cated dimensions, was I.10 lb (0.50 kg) whereas the reference I weight was 0.93 lb (0.42 kg). The manifolds were machined from bar stock whereas the previous assumption was that a plate-fin sandwich type would be utilized. A plate-fin type would be lighter due to limitations on machining complex shapes and thin gauge material. Potentials for savings exist if designs for flight applications utilize the plate-fin geometry.
Additional weight would be expected for hydrogen piping. The reference I piping weight was 0.58 lb (0.26 kg) whereas the test panel fittings had a weight of 0.75 lb (0.34 kg). The reference I weight should be more realistic since the fitting would not be required in a welded piping system.
24
APPENDIX B
TEST APPARATUS DESIGN
The test apparatus and its associated equipment were designed to apply radiant heat and external pressure to the panel surface. The primary considera- tion was pressure containment and standard structural design practices were followed in designing the apparatus for the requi red nitrogen pressure. The cooling system 1 imi ted metal temperatures to less than 960 R (530’K); there- fore short-time material properties were applicable. The limiting stress level at the 100 psi (690 kN/m2) design pressure was the material engineering yield stress divided by a I .5 safety factor. Structural steel (ASTM-A-7) was used for the majority of the chamber components. The cylindrical element was an exception in that AISI 4130 steel was used to provide increased strength with- out increasing the cylinder wall thickness.
Deflections of the pressure chamber were computed since they contribute to test panel and seal relative movement. The two panel support beams also con- tribute to this relative movement and furthermore their deflection causes move- ment of the panel I-beams relative to one another , producing stresses in the prime panel and clips.
Pressure Load Design
El 1 iptical dome. - This was an off-the-shelf item which satisfied the ASME boiler and pressure vessel code requirements (minimum safety factor on yield of 1.6). No additional analysis was performed for this application.
Cylindrical section. - The cylinder has a radius of about 21 In. (53 cm) and a nominal wall thickness of 0.16 in. (0.41 cm). Flanges, welded to either end of the cylinder, provided a seal and bolt connection to the dome and the table. The maximum stress in the cylinder at 100 psi (690 kN/m2) pressure was estimated to be 63 ksi (430 MN/m2) at the joint between the cylinder wall and flange adjacent to the table. This stress is a combination of she1 1 membrane stress and discontinuity bending stress. The al lowable stress for AISI 4130 steel is 93 ksi (640 MN/m2).
Reinforced circular plate. - The 41.6-in. (106 cm) dlameter plate had a thickness of 1.5 in. (3.8 cm), and was reinforced by 6-in. (I5 cm) I-beams welded to the plate along their entire length. Assuming simple support con- ditions and no contribution from the plate, the maximum bending moment on the I-beams was 214 000 in.-lb (24 000 N-m). The associated bending stress is 24.6 ksi ( I70 MN/m*), greater than the above allowable for ASTM-A-7 steel of 22 ksi ( I50 MN/m2 ) . However, the contribution of the plate would reduce the above stress by more than the 7 percent required to satisfy the design requirements.
25
Panel support beam. - The test panel I-beams rest on l-by 3-in. (3 by 8 cm) support beams. These support beams have a 0.5-in. (1.3 cm) rod in a groove on one edge to provide simple support conditions for the panel I-beams (figure la). The maximum panel load causes a bending moment of 33 300 in.-lb (3800 N-m) in the support beam. The associated maximum bending stress is 22 ksi (150 MN/m2), equal to the allowable stress for ASTM-A-7 steel.
The support beams have gussets which provide stabilization against side loads due to test panel beam rotation on the 0.5-in. (1.3 cm) rods. The gussets were bolted to the 3-in. (8 cm) I-beams which transmit the loads to the 6-in. (I5 cm) beams reinforcing the table. The side loads produce very low stresses in the bolts, gussets and 3-in. (8 cm) beam flange. The support beams were shimmed to give uniform contact with the flanges of the 3-in. (8 cm) beams at maximum external pressure. This arrangement reduced flange bending and centered the applied load over the web to avoid twisting.
Panel Hoist and Actuator Loading Fixture
A loading fixture lifted the test panel and reinforced table to provide heater access without disturbing the test panel setup. This was accomplished b, .Ia>lding two angle beams to the 6-in. (I5 cm) beams. One half of the table and test panel weight of about 500 1 b (2200 N), acting on a span of about I6 in. (41 cm) produces a maximum bending stress of less than 5 ksi (35 MN/m’).
The angle beams also supported an actuator which held the panel in place and preloaded it against the seal. The actuator was designed for a maximum load of about 1000 lb (4400 N) based on the panel profile in figure 7. This loads each of the angle beams to the same level mentioned above. The actuator
was attached to a plate with four sets of jaws to grip the bottom fl,anges of the two center panel I-beams. Clearance was provided for differential thermal ex- pansion at the expected operating conditions.
The panel deflected shape shown in figure 7 was based on a uniform 400°R (220’K) temperature difference across the panel height, a 1070”R (600’K) di f- ference across the beam height at the hydrogen outlet and a 360°R (200’K) dif- ference across the beam at the inlet. The calculations also indicated that panel steady-state conditions would be reached in about 300 s with a temperature difference of about lOOoR (56OK). Therefore, a short time after the appl ica- tion of heat to the panel the required sealing load would be considerably re- duced, to less than 250 lb (II00 N).
26
APPENDIX C
DATA REDUCTION
Heat Transfer Performance
Test heat transfer performance. - Performance as measured by the heat transfer coefficient was based on the temperature difference, AT, between the linear average of the measured surface metal temperatures and the hydrogen out let temperature. The calculations were performed assuming a uniform heat flux, Q/A, and hydrogen flow over the panel surface. The overal 1 heat transfer coefficient (fins and facesheet over the panel surface), H, is
H=$ Btu/sec-ft2 - OR ( kW/m2 - OK) (5)
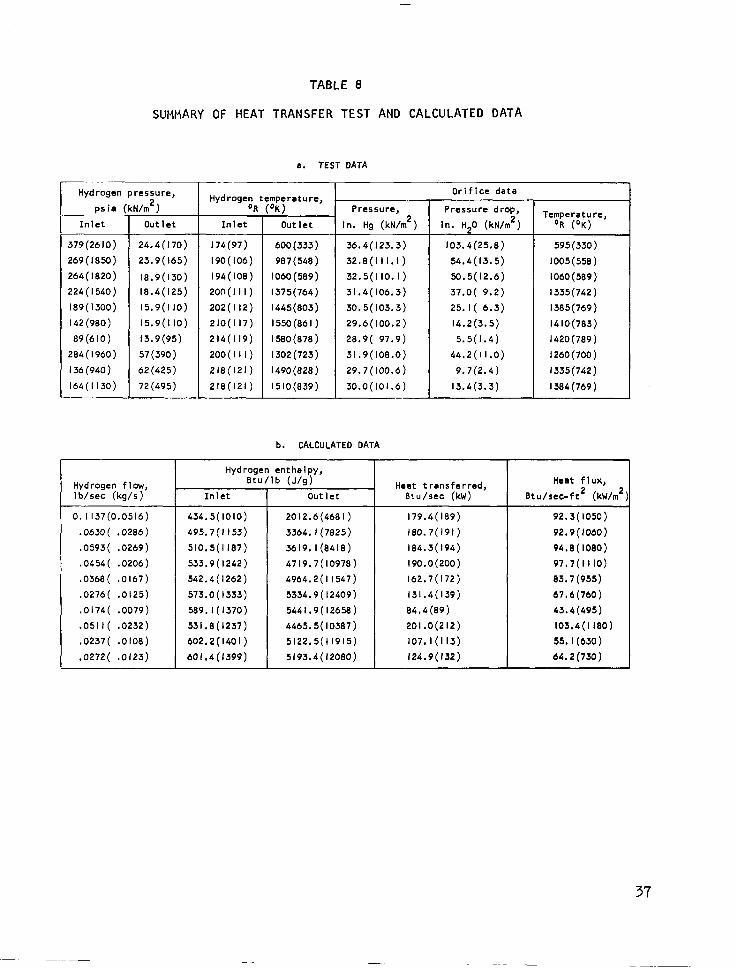
Measured data required to calculate heat flux is summarized in table 8a and temperature differences were obtained from measurements of surface temperature and hydrogen outlet temperature in table 3a. The hydrogen flow rate, enthalpy and associated heating rates are listed in table 8b using the measurements in table 8a and published hydrogen properties.
Theoretical~ heat transfer performance. - The theoretical overall heat transfer coefficient (table 3b) for the panel utilized test values of hydrogen outlet temperature and heat flux and computed values of maximum surface tem- perature in equation 5. The maximum surface temperature was determlned for the measured hydrogen flow rate (assuming uniform flow over the surface) utilizing fin thermal conductance data reported in reference 6 (similar calculations were performed for table I). Subsequent thermal conductance tests performed in a related program gave excellent agreement with the reference 6 data used for thii program.
Beam Deflections
Predicted beam deflections were requi red for comparison to the test results. The bending deflection due to a uniform load, P, along a beam with simple sup- port conditions was determined for a measured support spacing, L, of 12.4 in* (32 cm). The equation for deflection between supports as a function of the distance from one support is
6 = ( P/24EI) (XL” - 2Lx3 + x’)
A portion of the beam overhangs at either end however the effect on deflections given by this equation is negligible. The distributed load for the end beam was 476 lb/in. (83 N/m) at the maximum uniform normal pressure of 100 psi (690 kN/m2) and the minimum beam area moment of inertia, I, was 0.20 in.’ elastic modulus, E, for Inconel 718 was 29 x IO3 ksi (200 x IO 5
8.3 cm’). The MN/m2) at room
temperature. Deflections were calculated at distances of 2.2 and 5.0 in. (5.6 and 12.7 cm) from the support.
27
The beam deflection due to shear must also be considered. The shear deflec- tion as a function of distance from a support for a two-flange beam is
6 = (P/2AG) (XL - x2)
where the web area, A, was 0.094 in. 2 (0.61 cm2) and the shear modulus, G, at room temperature was I I x I O3 ksi (76 x IO3 MN/m2). The shear deflection was about 35 percent of the bending deflection 2.2 in. (5.6 cm) from the support and 33 percent at 5.0 in. ( 12.7 cm) from the support.
Beam bowing deflections due to a uniform (stress-free) temperature gradient across the height, h, are given by the approximate equation.
6 = (aAT/2h) (XL - x2)
For examp 1 e, with a beam height of 2.42 in. (6.2 cm), a thermal coefficient of expansion, CY, of 7.1 x 10m6 in./in.-OR (I3 x 10B6 cm/cm-OK) at 600’R (330°K), and a temperature difference, AT, of lOOoR (56’K) the deflection 5.0 in. (12.7 cm) from the support was about 0.005 in. (0.013 cm).
The scatter in the room temperature deflection readings (figure 8) was partially attributed to the recording technique. The def 1 ect ions were recorded by stylus on a moving trace which was then marked at the various pressure levels. Due to operator error, the recordings were marked at the instant that the pres- sure was reached rather than waiting for the applicable portion of the tape to become exposed.
28
REFERENCES
I. Fl ieder, W. G. ; Richard, C. E. ; Buchmann, O.A. ; and Walters, F.M. : An Analytical Study of Hydrogen Cooled Panels for Application to Hypersonic Ai rcraft. NASA CR-1650, April 1971..
2. Demogenes, C.; Jones, 0.; Richard, C.E.; Duncan, J.D. ; and Fl ieder, W.G. : Fabrication and Structural Evaluation for Regeneratively Cooled Panels. NASA CR-1651, March 1971.
3. Richard, C. E. ; Duncan, J.D. ; Demogenes, C. ; and Fl ieder, W.G. : Low- Cycle Fatigue Evaluation for Regeneratively Cooled Panels. NASA CR-I 884, October 1971.
4. Anon : High Temperature, High Strength,Nickel Base Alloys, Report A-393, The International Nickel Company, 1964.
5. Anon : Engineering Properties of Inconel Alloy 625. Report T-42, The International Nickel Company, August 1966.
6. Walters, F.M. and Buchmann, O.A. : Heat Transfer and Fluid Flow Analysis of Hydrogen-Cooled Panels and Manifold Systems. NASA CR-66925, July 1970.
29
TABLE I
HEAT EXCHANGER PARAMETERS FOR HEAT TRANSFER TESTS
Test conditions Panel conditions i
Fact sheet
I 1
coole"t flow rate T Haxlmum metal
temmrsture
Fin friction pressure
Total heat
exchanger 6T
Fin AT -
OK -
440
670
690
II0
II0
II0
II0 -
@
OR - 650
1040
1440
IBY)
I870
I890
1910 -
3%
580
800
1030
1040
1050
1060
Al - OR -
43
34
28
23
I9
14
9 -
- OK -
24
19
I6
I3
II
a
5 -
- psi -
44
22
I6
I2
a
5
3 -
300
150
II0
80
60
40
20
Heat fll
Btu/sec-ft2 kW/m2
100 II40
100 II40
100 1140
100 II40
80 910
60 680
40 450
drc
I
I
A
OR -
800
1200
1600
2000
2000
2000
2000 -
T lb/see-ft'
0.051
.029
.02l
.016
.Ol2
.009
.006
cg/s - 0.25
.I4
. IO
.OB
.06
-04
.03
I I
NOTES: (I) Fin geometry; tfin = 0.006 in. (0.015 cm), bfin = 0.037 in. (0.094 cm), and hfln = 0.05 In. (0.13 cm)
(2) Facesheet thlcknasr - 0.010 In. (0.025 cm)
(3) Coolant inlet trmparatura WM lOOoR (56'K), flov length was 20 In. (51 2m), fl" frlctlo" pressure drop was for an average coolant pressure of 200 psl (I400 kN/m )
TABLE 2
WE1 GHT SUMMARY
Welghts
Calculated or Reference 1 Item weighed Flight design est lmate
I ! I I :;::n1;e25 ( 48(330) [ 1870(1040) / frlZisured / 130(900.)
Inconel 625 48 (330) 149o(g30) o(2) I OO( 690) out I et manifold
Temperature Temperature, difference,
‘R(‘K) ‘R(‘K)
1600(890) 400(220)
1600(890) 0
1600(890) 450(250)
2000(1 I IO)(l) l53@5)
1910(1060) 0
NOTES: (I) Maximum fin temperature = 1980’R (I lOoK)
(2) Not measured, however there was no steady-state heat input to produce a temperature difference
(3) Estimated hydrogen temperature over the beam adjacent to the outlet manifold (19005 time reference during combined pressure and heat flux test with panel pressure from 92 to II0 psi
(630 to 760 kN/m2))
(4) Based on hydrogen temperature over the beam adjacent to the outlet manifold minus the average of thermocouple readings on the clip adjacent to the Inconel 718 panel (same test point as note 3)
(5) Estimated thermocouple reading at the 1900s time reference in the 92 to I IO psi (630 to 760 kN/m2) pressure combined tests
32
TABLE 5
TEMPERATURE MEASUREMENTS OF THE BEAM AND CLIP ADJACENT TO THE OUTLET MANIFOLD
. . ELEVATED TEMPERATURE PRESSURE ThST
Time reference, 5 B&n web
I7 Il20(620)
45 Il20(620)
73 Il20(620)
98 * I I I5(620)
I52 I Il5(620)
240 1070(595)
312 1065(590)
429 990(550) 452 900(544)
461 980(544)
47 I 980(544)
483 975(540)
499 975(540)
530 975(540)
Thermocouple temperawe, OR Mid-span l-
(OK)
Beam flange adjacent to cl Ip Beam web at support
775(430)
775(430)
780(435)
780(435)
790(440)
780(435)
770(430)
735(410)
730(405)
730(405)
730(405)
730(405)
725(405)
73Of400 I
995(555)
985(545)
950(530)
895(495)
840(465)
780(435)
755(420)
725(405)
720(400)
725(405)
740(410)
750(415)
BIO(4M)
.910(450)
b. CO,,BINED PRESSURE AND HEAT FLUX, 25 PSI (170 kN/m’) tlAXIllUil PRESSURE
Thermocouple temper.t”rer, OR(‘K)
,,ld-rp.” At support
l3c.m fl.nge Belm flange clip flange Bemll flange CIIP flange CIIP fl*nge remote from adjacent to adj.cent to remote from l dJacent to l dJaccnt to
cl Ip Be.“, mb cl IP p.ne I Slip Se.” web beam p.n* 1