THERMAL MANAGEMENT TECHNOLOGIES OF LITHIUM-ION BATTERIES APPLIED FOR STATIONARY ENERGY STORAGE SYSTEMS Investigation on the thermal behavior of Lithium-ion batteries HAIDER ADEL ALI ALI ZIAD NAMIR ABDELJAWAD School of Business, Society and Engineering Course: Degree Project in Energy Engineering Course code: ERA403 Credits: 30 hp Program: Master of Science in Engineering- Energy Systems Supervisor at Mälardalens University: Hailong Li Supervisor at Vattenfall R&D: Jinying Yan Examiner: Jan Sandberg Date: 2020-06-14 E-post: [email protected][email protected]
Transcript
THERMAL MANAGEMENT TECHNOLOGIES OF LITHIUM-ION BATTERIES APPLIED FOR STATIONARY ENERGY STORAGE SYSTEMS Investigation on the thermal behavior of Lithium-ion batteries
HAIDER ADEL ALI ALI
ZIAD NAMIR ABDELJAWAD
School of Business, Society and Engineering Course: Degree Project in Energy Engineering Course code: ERA403 Credits: 30 hp Program: Master of Science in Engineering- Energy Systems
Supervisor at Mälardalens University: Hailong Li Supervisor at Vattenfall R&D: Jinying Yan Examiner: Jan Sandberg Date: 2020-06-14 E-post: [email protected][email protected]
1
ABSTRACT
Batteries are promising sources of green and sustainable energy that have been widely used in
various applications. Lithium-ion batteries (LIBs) have an important role in the energy storage
sector due to its high specific energy and energy density relative to other rechargeable batteries.
The main challenges for keeping the LIBs to work under safe conditions, and at high
performance are strongly related to the battery thermal management. In this study, a critical
literature review is first carried out to present the technology development status of the battery
thermal management system (BTMS) based on air and liquid cooling for the application of
battery energy storage systems (BESS). It was found that more attention has paid to the BTMS
for electrical vehicle (EV) applications than for stationary BESS. Even though the active forced
air cooling is the most commonly used method for stationary BESS, limited technical
information is available. Liquid cooling has widely been used in EV applications with different
system configurations and cooling patterns; nevertheless, the application for BESS is hard to
find in literature.
To ensure and analyze the performance of air and liquid cooling system, a battery and thermal
model developed to be used for modeling of BTMS. The models are based on the car company
BMW EV battery pack, which using Nickel Manganese Cobalt Oxide (NMC) prismatic lithium-
ion cell. Both air and liquid cooling have been studied to evaluate the thermal performance of
LIBs under the two cooling systems.
According to the result, the air and liquid cooling are capable of maintaining BESS under safe
operation conditions, but with considering some limits. The air-cooling is more suitable for
low surrounding temperature or at low charging/discharge rate (C-rate), while liquid cooling
enables BESS to operate at higher C-rates and higher surrounding temperatures. However, the
requirement on the maximum temperature difference within a cell will limits the application
of liquid cooling in some discharge cases at high C-rate. Finally, this work suggests that specific
attention should be paid to the pack design. The design of the BMW pack is compact, which
makes the air-cooling performance less efficient because of the air circulation inside the pack
is low and liquid cooling is more suitable for this type of compact battery pack.
Keywords: Air and liquid cooling, battery thermal management system, Lithium-ion
batteries, NMC, prismatic cell, pack simulation, maximum temperature difference,
The model has the fastest parallel processing and athletic self-learning ability. However,
the model requires a massive amount of data, and the error is susceptible to the training
data and methods (Zhang, Shang, Duan, & Zhang, 2018). The model is used to predict the
deterioration in battery performance.
3.2.1.4 Peukert's law model
The models are mainly used for the lead-acid batteries at constant discharge. It is used to
estimate the nonlinear delivered capacity and predict the battery run time of rechargeable
lead-acid batteries at different constant discharge current from a fully charged state.
However, it does not take into account and ignores the temperature effect on battery
nonlinear capacity (Zhang, Shang, Duan, & Zhang, 2018). The models can estimate the
battery calendar life for most cases (Jongerden & Haverkort, 2009).
3.2.1.5 Equivalent Circuit model
The equivalent circuit model (ECM) is the most common approach for battery numerical
analysis (Huria, Ceraolo, Gazzarri, & Jackey, 2012). The model can present the electrical
behavior of the battery and can accurately describe the battery I-V characteristics (Zhang,
Shang, Duan, & Zhang, 2018). The model considers the influence operational and
environmental factors have on the value of the circuit parameters (Aurilio, o.a., 2015). The
model can be used for LIBs and as well as other battery chemistries. The EMC is
computationally essential and is easy to combine with other methods.
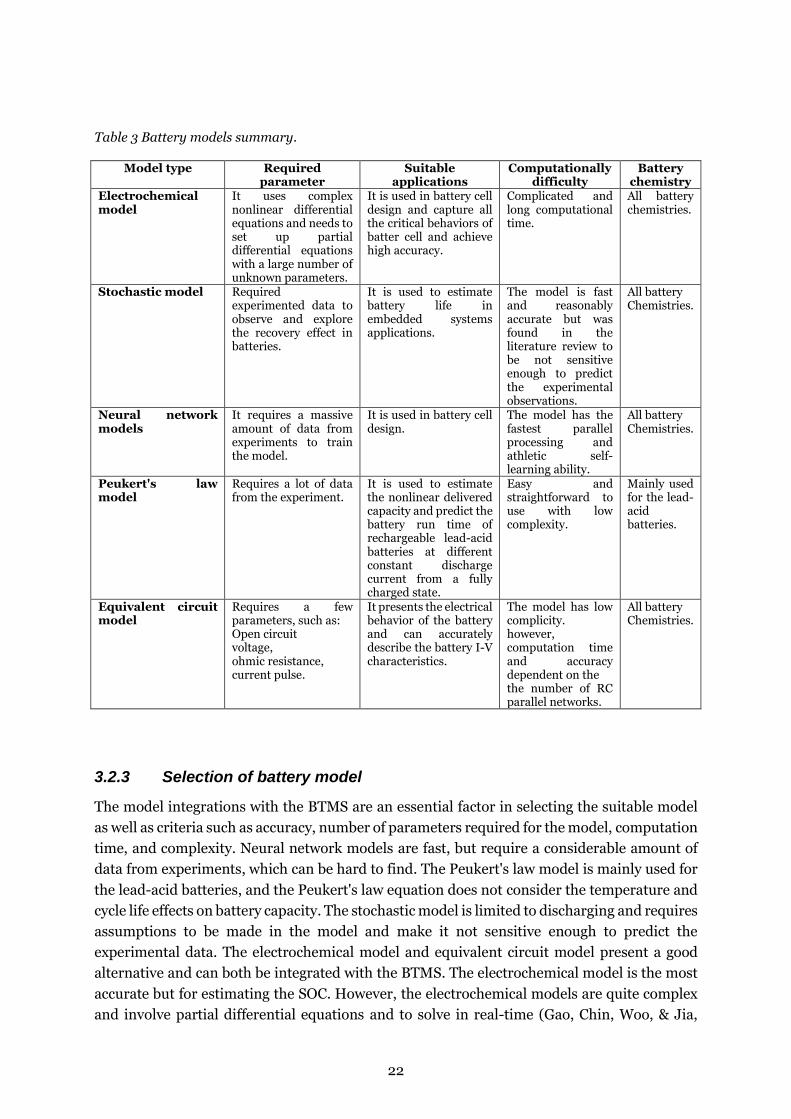
3.2.2 Summary of battery models
The models presented in the previous section are summarized in Table 3 to compare their
features from:
• Required parameter
• Suitable applications
• Computationally difficulty
• Battery chemistry
22
Table 3 Battery models summary.
Model type Required parameter
Suitable applications
Computationally difficulty
Battery chemistry
Electrochemical model
It uses complex nonlinear differential equations and needs to set up partial differential equations with a large number of unknown parameters.
It is used in battery cell design and capture all the critical behaviors of batter cell and achieve high accuracy.
Complicated and long computational time.
All battery chemistries.
Stochastic model Required experimented data to observe and explore the recovery effect in batteries.
It is used to estimate battery life in embedded systems applications.
The model is fast and reasonably accurate but was found in the literature review to be not sensitive enough to predict the experimental observations.
All battery Chemistries.
Neural network models
It requires a massive amount of data from experiments to train the model.
It is used in battery cell design.
The model has the fastest parallel processing and athletic self-learning ability.
All battery Chemistries.
Peukert's law model
Requires a lot of data from the experiment.
It is used to estimate the nonlinear delivered capacity and predict the battery run time of rechargeable lead-acid batteries at different constant discharge current from a fully charged state.
Easy and straightforward to use with low complexity.
Mainly used for the lead-acid batteries.
Equivalent circuit model
Requires a few parameters, such as: Open circuit voltage, ohmic resistance, current pulse.
It presents the electrical behavior of the battery and can accurately describe the battery I-V characteristics.
The model has low complicity. however, computation time and accuracy dependent on the the number of RC parallel networks.
All battery Chemistries.
3.2.3 Selection of battery model
The model integrations with the BTMS are an essential factor in selecting the suitable model
as well as criteria such as accuracy, number of parameters required for the model, computation
time, and complexity. Neural network models are fast, but require a considerable amount of
data from experiments, which can be hard to find. The Peukert's law model is mainly used for
the lead-acid batteries, and the Peukert's law equation does not consider the temperature and
cycle life effects on battery capacity. The stochastic model is limited to discharging and requires
assumptions to be made in the model and make it not sensitive enough to predict the
experimental data. The electrochemical model and equivalent circuit model present a good
alternative and can both be integrated with the BTMS. The electrochemical model is the most
accurate but for estimating the SOC. However, the electrochemical models are quite complex
and involve partial differential equations and to solve in real-time (Gao, Chin, Woo, & Jia,
23
2017). The equivalent circle model requires a few parameters, gives an accurate result, is
suitable for all battery chemistries, suitable for nonlinear conditions, and has low complicity.
Therefore, the equivalent circle model is chosen for the battery model in this work.
3.3 Battery thermal models review
There are various thermal models used for battery cells that were found in the literature. The
different models have a different impact on the accuracy of the heat transfer in the cell (Damay,
Forgez, Bichat, Friedrich, & Ospina, 2013).
The thermal model applied to investigate the temperature profile of the battery cell during the
battery's operation. The study by Ahemd A (2002) presents and summarized common models.
These models are the following:
• Lumped thermal model
• Partial differential equations (PDEs) models
• Finite element analysis battery model
3.3.1.1 Lumped capacitance thermal model
The model treats the battery core and battery case as two sperate isothermal nodes, all
components inside the core such as anode, cathode, active material, etc., are assumed to be a
single homogenous material with averaged properties (Ahemd A, 2002). A lumped electric
equivalent model is part of the lumped thermal model and is proposed by Damay et al. (2013).
The study deals with thermal modeling and experimental validation of a large prismatic Li-ion
battery. A one-dimensional lumped thermal model is developed. The heat generated, thermal
resistors, and specific heat capacity of the cell is required for the model. The simulation shows
that the model is well-suited for applications such as a BMS or off-line applications such as a
pack thermal design tool. The simulation tool MATLAB/Simulink can be used to develop such
a model.
3.3.1.2 Partial differential equations models
The models contain nonlinear partial differential equations, PDE models can accurately
capture system dynamics. The models form complex structure mathematically represented by
a series of coupled nonlinear partial differential equations. According to the study by Zou,
Manzie, & Nesic (2015), the PDE model is accurate but is a mathematical complex and has long
simulation time.
3.3.1.3 Finite element analysis battery thermal model
The model describes the battery heat transfer in three-dimensional. This is presented in the
study by Wand, Ma, & Zhang (2017) where a cylindrical Li-ion battery thermal model was
24
developed using the finite element analysis battery thermal model. The model is accurate and
very useful to study how the heat behaves in the cell and surrounding. However, the model
requires a massive amount of data, which can be determined through theoretical analysis or
experiments, and the simulation time can be too long without powerful computers. The model
can be established in the software ANSYS.
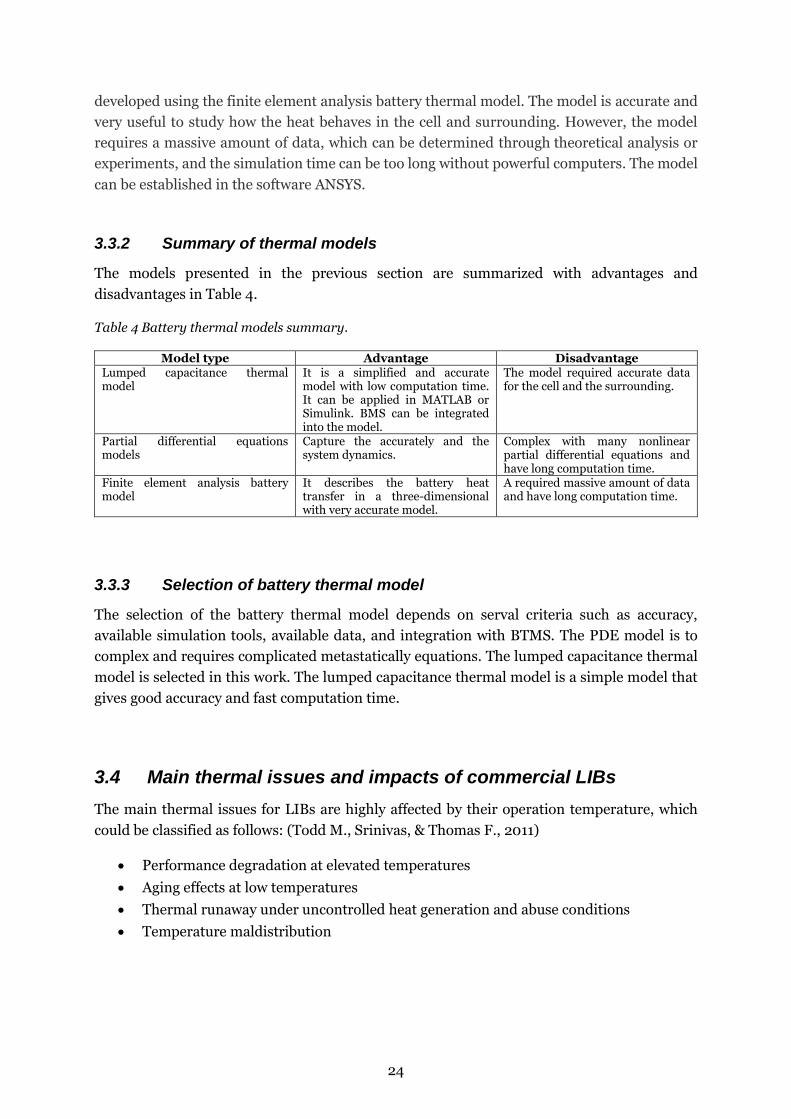
3.3.2 Summary of thermal models
The models presented in the previous section are summarized with advantages and
disadvantages in Table 4.
Table 4 Battery thermal models summary.
Model type Advantage Disadvantage Lumped capacitance thermal model
It is a simplified and accurate model with low computation time. It can be applied in MATLAB or Simulink. BMS can be integrated into the model.
The model required accurate data for the cell and the surrounding.
Partial differential equations models
Capture the accurately and the system dynamics.
Complex with many nonlinear partial differential equations and have long computation time.
Finite element analysis battery model
It describes the battery heat transfer in a three-dimensional with very accurate model.
A required massive amount of data and have long computation time.
3.3.3 Selection of battery thermal model
The selection of the battery thermal model depends on serval criteria such as accuracy,
available simulation tools, available data, and integration with BTMS. The PDE model is to
complex and requires complicated metastatically equations. The lumped capacitance thermal
model is selected in this work. The lumped capacitance thermal model is a simple model that
gives good accuracy and fast computation time.
3.4 Main thermal issues and impacts of commercial LIBs
The main thermal issues for LIBs are highly affected by their operation temperature, which
could be classified as follows: (Todd M., Srinivas, & Thomas F., 2011)
• Performance degradation at elevated temperatures
• Aging effects at low temperatures
• Thermal runaway under uncontrolled heat generation and abuse conditions
• Temperature maldistribution
25
3.4.1 Performance degradation
The performance degradation of the lithium-ion cell, explaining how the power loss and
capacity fade can occur mainly influenced by the high cell temperature. Besides, the high
temperature itself is generated by using high operation conditions like a cell working at a high
C-rate. However, the cell performance degradation changes from one cell to another depending
upon the different cell chemistries. The capacity fade occurs when the active material inside
the battery has been transformed into inactive phases, which reduces capacity at any discharge
rate. While the available power is lost when the cell internal impedance increases, which
reduces the operating voltage at each discharge rate. All these capacity fade issues have a
further impact on cell materiel and cell aging. Furthermore, the state of charge (SOC) and
depth of discharge (DOD) is also a mechanism for cell degradation. This impact of the SOC
range can be observed in the remaining studies, according to Todd M., Srinivas, & Thomas F.,
(2011). For example, K.Takei, o.a., (2001) showed that a cycled C/LiCoO2 cylindrical batteries
in 25% DOD increments, with maximum voltage ranging from 4.27 to 2.78 V. Their results
show that the capacity fades increased as the maximum cell voltage increased.
Figure 4 shows a clear summary of the calendar aging, which is highly dependent on the
temperature, SOC, and battery chemistries. (Keil, o.a., 2016)
Figure 4 Calendar aging behaviors of three common LIB cells (Schuster, o.a., 2016).
Figure 4 showing comparison between the three common LIB cells NCA, NMC, and LFP after
storage of 9-10 months. It is apparent in the figure that the relative capacity of the cells affected
by the different storage temperatures and the storage period, which itself led to high DOD. The
relative capacity variety between the three different cells in Figure 4 depends on the different
cell chemistries and can explain which cell can withstand high DOD more than others.
(Schuster, o.a., 2016). Considering the massive combinations of diverse electrode materials
and electrolyte composites, it’s impractical to cover the performance degradation mechanisms
of all these electrochemical batteries. However, according to Ning, Haran, & N.Popov, (2003),
the capacity fade is attributed to lithium loss and active material reduction inside the battery,
while the origin of power abatement is the increasing cell internal resistance due to the elevated
temperature according to R.Belt, D.Ho, G.Motloch, J.Miller, & Q.Duong (2003).
3.4.2 Low-temperature effects
It has been indicated that the high cell temperature leads to performance degradation of LIBs.
Many studies have implied that the cell performance is also reduced under low temperature,
26
and it is another main thermal issue. A low cell temperature could be affected by the ambient
temperature, mostly in a condition such for example, when a failure occurs in the battery
heating system in cold ambient temperature. However, the exact mechanisms leading to the
poor performance of LIBs at cold temperatures are still under debate and needs to be studied
further (Huaqiang, 2017). Nonetheless, the performance of LIBs is reduced at lower
temperatures for all cell materials. In addition, the charge performance is substantially less
than that for discharge. It can be seen that the battery capacity drops with temperature,
especially below −20°C. Although the ionic conductivity of the solid electrolyte interphase
(SEI) and electrolyte and the diffusion of lithium into the graphite can be reduced significantly
at low temperatures, (Zhang, Xu, & Jow,T., 2003) argue that poor performance of LIBs at low
temperatures is linked to poor charge transfer at the electrode/electrolyte interface. In fact,
this poor charge transfer can lead to substantial plating on the negative electrode during
charging, which can cause irreversible capacity loss from electrolyte reduction (Todd M.,
Srinivas, & Thomas F., 2011). A further consequence at low temperatures could also result in a
localized degradation to short battery lifetime, especially during charging. It means that the
charge performance degrades more quickly than discharge performance under cold conditions
(Wiebelt, 2018).
3.4.3 Thermal Runaway
Thermal failure of individual lithium-ion cells could be initiated for different reasons, most
likely in situations such as internal short-circuit, overheating, and overcharging or discharging.
These reasons further cause an initial increase in cell temperature and trigger chemical
reactions. The highly exothermic reactions result in a rapid self-heating of the cell, i.e., thermal
0.3C 96 33.2 94 Vattenfall, 2019. A vehicle lithium-ion battery system BMW
JRC's Smart Grid BESS
Prismatic NMC 148 x 98 x 27
HVAC active (Air cooling)
~ 0.4C 16 3.97 68 (Rancilio, o.a., 2019)
According to Table 5, the air-cooling system has been widely used on BESS. The air cooling
might not be a preferred cooling system due to it is low heat capacity and low thermal
conductivity. However, it is still an attractive solution for BTMS because there is no leaks
potential and no heat exchangers. It is also less complicated and more comfortable to maintain
compared to liquid cooling. The only cooling system in Table 5 that is based on passive air
31
convection is for Nissan Leaf EV. The movement of the car during drive gives the battery pack
an advantage of airflow through it and making the passive cooling system more efficient.
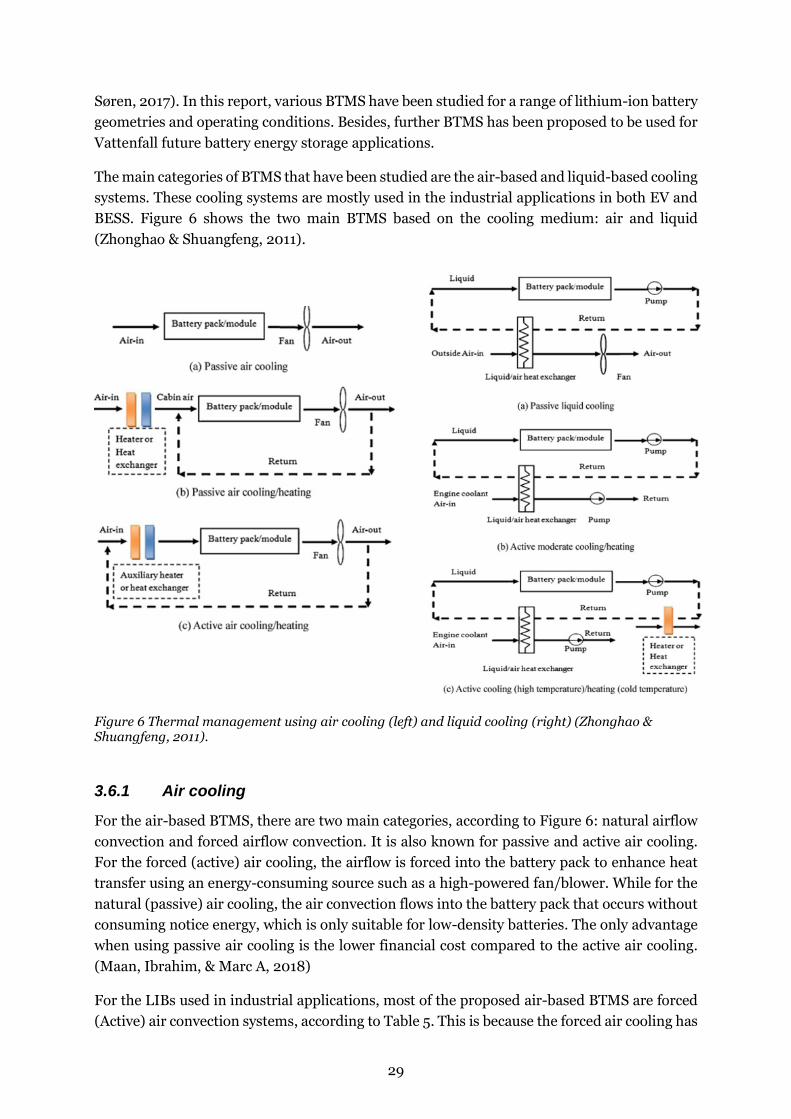
3.6.2 Liquid cooling
Same as for air cooling, the liquid-based BTMS consists of two main categories, according to
Figure 6: passive and active liquid cooling. For the active liquid cooling, there are two loops,
which are the primary loop and the secondary loop. The primary loop is the same as the loop
in a passive liquid system, where the heat transfer fluid is circulated by a pump. The secondary
loop can be an air conditioning loop. The upper heat exchanger, instead of being a radiator,
works as an evaporator for cooling operation and connects both loops. While for the passive
liquid cooling, the heat-sink for cooling is a radiator. Heat transfer fluid is circulated by the
pump in a closed system. The circulating fluid absorbs heat from the battery pack and releases
heat through a cooler. The cooling power depends strongly on the temperature between the
ambient air and the battery. The fans behind the radiator can improve cooling performance,
but if the ambient air is higher than the battery temperature or the difference between them is
too small, the passive liquid system becomes ineffective. (Zhonghao & Shuangfeng, 2011)
The liquid coolant has more advantages compared to air. The advantages of using liquid
coolant are that it can handle large cooling loads in scenarios such as defects in cells, high
power draws, and high environmental temperatures. The main disadvantage when using liquid
cooling is that it is complex, has leakage potential and such a high cost. (Guodong, Lei, &
Guanglong, 2017)
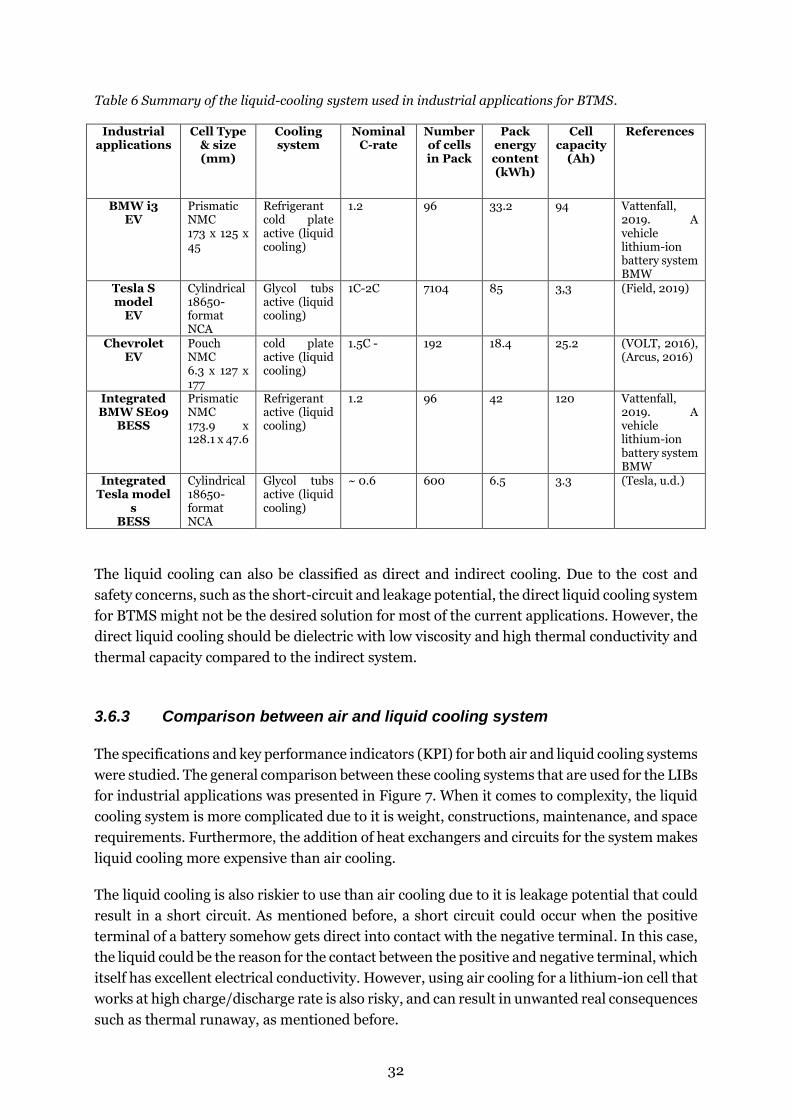
The liquid cooling for BTMS, according to the summary in Table 6, has mostly used in EV
applications. The advantage of using liquid cooling in EV is that it is more compact and makes
the battery pack consuming fewer spaces in the EV compared to the air-cooling system. In
addition, due to the liquid coolant high thermal conductivity and high heat transfer coefficient,
the major EV manufacturers using liquid cooling systems to maintain their batteries within the
optimum operating range. (Maan, Ibrahim, & Marc A, 2018)
There are four main variables for the liquid -cooling system. Same as for the air cooling, these
variables can improve or decrease the efficiency of the system, and they are (1) number of
channels, (2) inlet mass flow rate, (3) flow direction, and (4) width of channels. (Qian, Li, &
Rao, 2016)
32
Table 6 Summary of the liquid-cooling system used in industrial applications for BTMS.
Industrial applications
Cell Type & size (mm)
Cooling system
Nominal C-rate
Number of cells in Pack
Pack energy content (kWh)
Cell capacity
(Ah)
References
BMW i3 EV
Prismatic NMC 173 x 125 x 45
Refrigerant cold plate active (liquid cooling)
1.2 96 33.2 94 Vattenfall, 2019. A vehicle lithium-ion battery system BMW
Tesla S model
EV
Cylindrical 18650- format NCA
Glycol tubs active (liquid cooling)
1C-2C 7104 85 3,3 (Field, 2019)
Chevrolet EV
Pouch NMC 6.3 x 127 x 177
cold plate active (liquid cooling)
1.5C - 192 18.4 25.2 (VOLT, 2016), (Arcus, 2016)
Integrated BMW SE09
BESS
Prismatic NMC 173.9 x 128.1 x 47.6
Refrigerant active (liquid cooling)
1.2 96 42 120 Vattenfall, 2019. A vehicle lithium-ion battery system BMW
Integrated Tesla model
s BESS
Cylindrical 18650- format NCA
Glycol tubs active (liquid cooling)
~ 0.6 600 6.5 3.3 (Tesla, u.d.)
The liquid cooling can also be classified as direct and indirect cooling. Due to the cost and
safety concerns, such as the short-circuit and leakage potential, the direct liquid cooling system
for BTMS might not be the desired solution for most of the current applications. However, the
direct liquid cooling should be dielectric with low viscosity and high thermal conductivity and
thermal capacity compared to the indirect system.
3.6.3 Comparison between air and liquid cooling system
The specifications and key performance indicators (KPI) for both air and liquid cooling systems
were studied. The general comparison between these cooling systems that are used for the LIBs
for industrial applications was presented in Figure 7. When it comes to complexity, the liquid
cooling system is more complicated due to it is weight, constructions, maintenance, and space
requirements. Furthermore, the addition of heat exchangers and circuits for the system makes
liquid cooling more expensive than air cooling.
The liquid cooling is also riskier to use than air cooling due to it is leakage potential that could
result in a short circuit. As mentioned before, a short circuit could occur when the positive
terminal of a battery somehow gets direct into contact with the negative terminal. In this case,
the liquid could be the reason for the contact between the positive and negative terminal, which
itself has excellent electrical conductivity. However, using air cooling for a lithium-ion cell that
works at high charge/discharge rate is also risky, and can result in unwanted real consequences
such as thermal runaway, as mentioned before.
33
Figure 7 General KPI for both air and liquid cooling systems. (Chen, Jiang, Kim, Yang, & Pesaran, 2016), (Kim, Ho, Marina, & Eugene, 2012), (Han, Khalighi, & Kaushik, 2017), (Khan, Nielsen, & Kær, 2014), (Madani, Swierczynski, & Kær, 2017).
Even though liquid cooling has some disadvantages that are mentioned above, it still has better
performance than air cooling. When it comes to thermal conductivity, heat capacity, and
precise control for heating/cooling, liquid cooling is more efficient (Han, Khalighi, & Kaushik,
2017). This improves the more uniform cell temperature distribution and keeps the optimal
max temperature under the limit of the lithium-ion cell avoiding cell aging, decreasing cycles,
and decreasing power content. The summary of the differences between both air and liquid
cooling systems were studied for LIBs. Table 7 shown the advantages and disadvantages of the
liquid cooling systems of commercial LIBs.
Table 7 Advantages and disadvantages of the liquid cooling systems. (Maan, Ibrahim, & Marc A, 2018), (S.Panchal, o.a., 2017), (Qian, Li, & Rao, 2016), (E, o.a., 2018),
Liquid cooling Advantages Disadvantages
It can be 3500 times more effective than air cooling due to itis has high thermal conductivity and high heat transfer coefficient with the ability to absorb more heat, compared with air cooling, and it occupies less volume.
It handles large cooling loads in scenarios (high power draws, high environment temperatures).
Ability to decrease energy consumption by constructing a wider cooling channel, and that leads to a lower pressure drop. The pressure drop can go up to 55 % when the channel broad changes from 3 mm to 6 mm.
Better thermal balance and uniformity could be achieved using liquid cooling.
The liquid cooling system is more complicated compared to air cooling due to the addition of heat exchangers and circuits.
Higher cost compared to air cooling.
Higher specific weighs of the cooling system, the high coolant weight, due to the high density of the liquid.
The increase in coolant velocity corresponds to an increase in energy consumption.
Requires more often maintenance than air cooling
Potential leakage that can make manufacturers hesitate to use liquid cooling for the lithium-ion cells. Increase temperature difference in the cell.
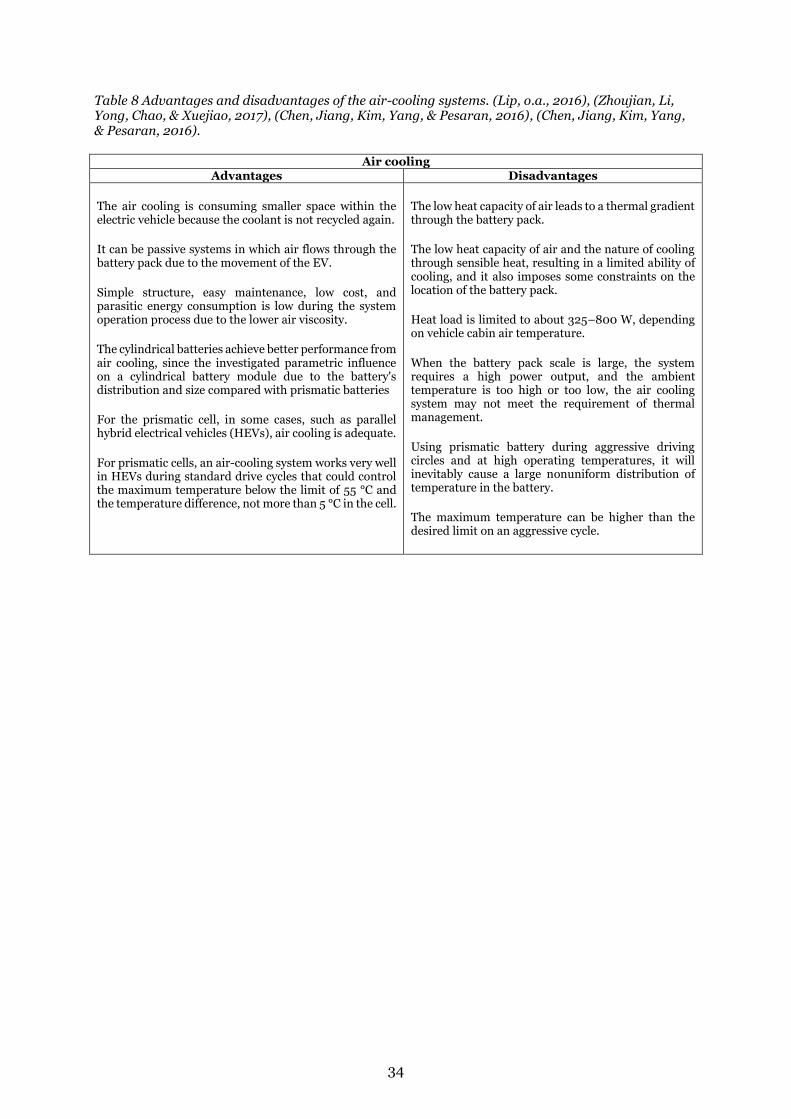
While Table 8 shown the advantages and disadvantages of the air-cooling systems of
commercial LIBs.
34
Table 8 Advantages and disadvantages of the air-cooling systems. (Lip, o.a., 2016), (Zhoujian, Li, Yong, Chao, & Xuejiao, 2017), (Chen, Jiang, Kim, Yang, & Pesaran, 2016), (Chen, Jiang, Kim, Yang, & Pesaran, 2016).
Air cooling Advantages Disadvantages
The air cooling is consuming smaller space within the electric vehicle because the coolant is not recycled again.
It can be passive systems in which air flows through the battery pack due to the movement of the EV.
Simple structure, easy maintenance, low cost, and parasitic energy consumption is low during the system operation process due to the lower air viscosity.
The cylindrical batteries achieve better performance from air cooling, since the investigated parametric influence on a cylindrical battery module due to the battery's distribution and size compared with prismatic batteries
For the prismatic cell, in some cases, such as parallel hybrid electrical vehicles (HEVs), air cooling is adequate.
For prismatic cells, an air-cooling system works very well in HEVs during standard drive cycles that could control the maximum temperature below the limit of 55 °C and the temperature difference, not more than 5 °C in the cell.
The low heat capacity of air leads to a thermal gradient through the battery pack.
The low heat capacity of air and the nature of cooling through sensible heat, resulting in a limited ability of cooling, and it also imposes some constraints on the location of the battery pack.
Heat load is limited to about 325–800 W, depending on vehicle cabin air temperature.
When the battery pack scale is large, the system requires a high power output, and the ambient temperature is too high or too low, the air cooling system may not meet the requirement of thermal management.
Using prismatic battery during aggressive driving circles and at high operating temperatures, it will inevitably cause a large nonuniform distribution of temperature in the battery.
The maximum temperature can be higher than the desired limit on an aggressive cycle.
35
4 CASE STUDIES
The case studies for this work conducted with the following sections:
• Battery Model (ECM)
• Battery Thermal Model
• BTMS
The work started with developing a model that can predict the temperature in the LIBs involves
the combination of different models. These models also involve various steps for each, and in
the end, they are combined to achieve the desired goal. In the beginning, the equivalent circuit
model ECM was selected. The ECM model implies that the initial model parameters, such as
the resistances, capacitances, and OCV with SOC relationship, must be first determined. When
the initial model parameters were estimated for the equivalent circuit model, it was then
combined with heat generation and thermal sub-models in the MATLAB-Simulink. Finally,
when a battery model (ECM) and thermal model were developed. The model was validated
against experimental data to ensure the accuracy of the model. The cell model was integrated
to pack size and was developed based on the thermal model of the cell. The BTMS for the pack
is used to control the battery's thermal behavior. The pack model was validated against
operational data from existing BESS. Finally, in the simulations, the BTMS system was used
further to analyze different cell operation conditions to identify the operating limitations of the
pack using air or liquid cooling. The result can be found in the result section.
The cell that is used in this work is 120 Ah capacity with NMC chemistry. The cell has a large
capacity and used in both EV and commercial stationary applications. The cell technical
specifications are presented in Table 9.
Table 9 General technical specifications of the cell
Battery Cell Type Prismatic Nominal capacity 120 Ah Nominal voltage 3.68 V Energy content 439 Wh
Dimensions 174 × 128 × 48 mm Cell chemistry NMC
36
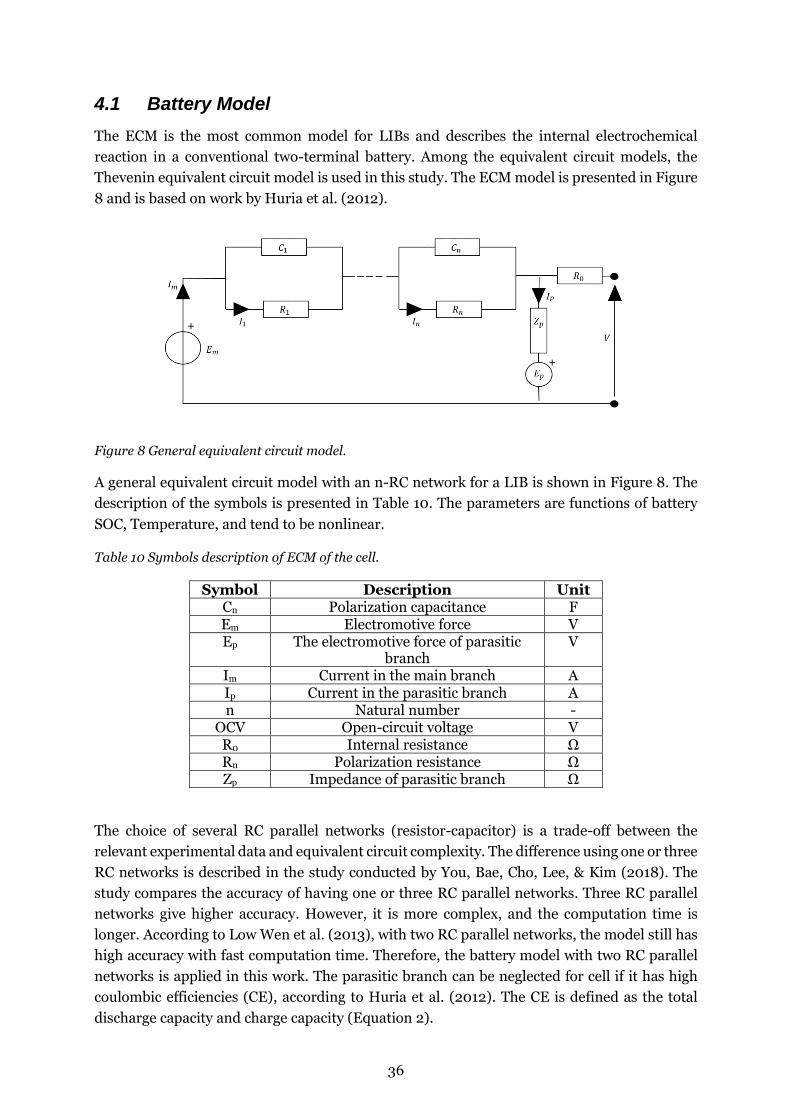
4.1 Battery Model
The ECM is the most common model for LIBs and describes the internal electrochemical
reaction in a conventional two-terminal battery. Among the equivalent circuit models, the
Thevenin equivalent circuit model is used in this study. The ECM model is presented in Figure
8 and is based on work by Huria et al. (2012).
Figure 8 General equivalent circuit model.
A general equivalent circuit model with an n-RC network for a LIB is shown in Figure 8. The
description of the symbols is presented in Table 10. The parameters are functions of battery
SOC, Temperature, and tend to be nonlinear.
Table 10 Symbols description of ECM of the cell.
Symbol Description Unit Cn Polarization capacitance F Em Electromotive force V Ep The electromotive force of parasitic
branch V
Im Current in the main branch A Ip Current in the parasitic branch A n Natural number -
OCV Open-circuit voltage V R0 Internal resistance Ω Rn Polarization resistance Ω Zp Impedance of parasitic branch Ω
The choice of several RC parallel networks (resistor-capacitor) is a trade-off between the
relevant experimental data and equivalent circuit complexity. The difference using one or three
RC networks is described in the study conducted by You, Bae, Cho, Lee, & Kim (2018). The
study compares the accuracy of having one or three RC parallel networks. Three RC parallel
networks give higher accuracy. However, it is more complex, and the computation time is
longer. According to Low Wen et al. (2013), with two RC parallel networks, the model still has
high accuracy with fast computation time. Therefore, the battery model with two RC parallel
networks is applied in this work. The parasitic branch can be neglected for cell if it has high
coulombic efficiencies (CE), according to Huria et al. (2012). The CE is defined as the total
discharge capacity and charge capacity (Equation 2).
37
Equation 2 Coulombic efficiencies.
𝜂𝐶𝑜𝑢𝑙𝑜𝑚𝑏𝑖𝑐 = 𝐶𝑎𝑝𝑎𝑐𝑖𝑡𝑦𝑑𝑖𝑠𝑐ℎ𝑎𝑟𝑔𝑒
𝐶𝑎𝑝𝑎𝑐𝑖𝑡𝑦𝑐ℎ𝑎𝑟𝑔𝑒
The CE was estimated at Vattenfall for the cell. The result shows that the CE is over 98%, and
the parasitic branch can be neglected. The simplified ECM used in this work is presented in
Figure 9.
Figure 9 Simplified ECM for lithium-ion batteries with two RC parallel networks and neglection of the parasitic branch.
The main parameters for two RC blocks ECM are R0, R1, R2 C1, C2, and Em (i.e., open-circuit
voltage OCV), which are functions of SOC and temperature. These parameters can be estimated
by conducting a pulse test and a low current experiment.
Coulomb-counting is used to estimate SOC and is described in Equation 3. t0 represents the
initial state, and CN represents rated stored battery capacity. The OCV is estimated in Equation
4. Terminal voltage is the measured voltage from the cells two terminals using a multimeter.
Internal voltage can be estimated from Ohm's law (Equation 5), and the voltage of the RC
parallel network is estimated by Kirchhoff's current law in Equation 6.
Equation 3 Coulomb counting.
𝑆𝑂𝐶(𝑡) = 𝑆𝑂𝐶(𝑡0) +1
𝐶𝑁∫ 𝐼(𝑡)𝑑𝑡
𝑡
𝑡0
Equation 4 Calculate OCV.
𝑂𝐶𝑉 = 𝑉𝑡𝑒𝑟𝑚𝑖𝑛𝑎𝑙 + 𝑉1 + 𝑉2 + 𝑉0
Equation 5 Ohm's law.
𝑉 = 𝐼 ∗ 𝑅
Equation 6 Kirchhoff's current law.
𝐶𝑑𝑉
𝑑𝑡+
𝑉
𝑅= 0
38
4.1.1 Parameter Identification
The accuracy of the ECM is dependent on the parameters in the model. The parameters
identified using measurement data obtained from the pulse test and low current experiment.
This section covers the approach used for the parameter identifications.
The approach in this work follows the same methodology used in the study by Huria et al.
(2012). Furthermore, as stated earlier, two RC parallel networks are used. The methodology is
illustrated in the flow diagram and is illustrated in Figure 10.
The pulse test experiment was done for three temperatures (0, 25, and 40 °C). The current
profile for charge and discharge was taken from the test and used in the model to get the
terminal voltage. The simulated voltage later compared with the measured voltage from the
pulse test experiment. If the simulated voltage does not match the measured voltage, the
parameters (Em, R0, R1, R2, C1, C2) were modified until the two voltage matches. The function
"parameter estimation" in Simulink was used to modify the parameters. Here it is vital to have
an understanding of the range, the maximum and minimum values. The main objective is to
match the voltage profile of the pulse test with simulation voltage.
Figure 10 Flow diagram of parameter estimation.
39
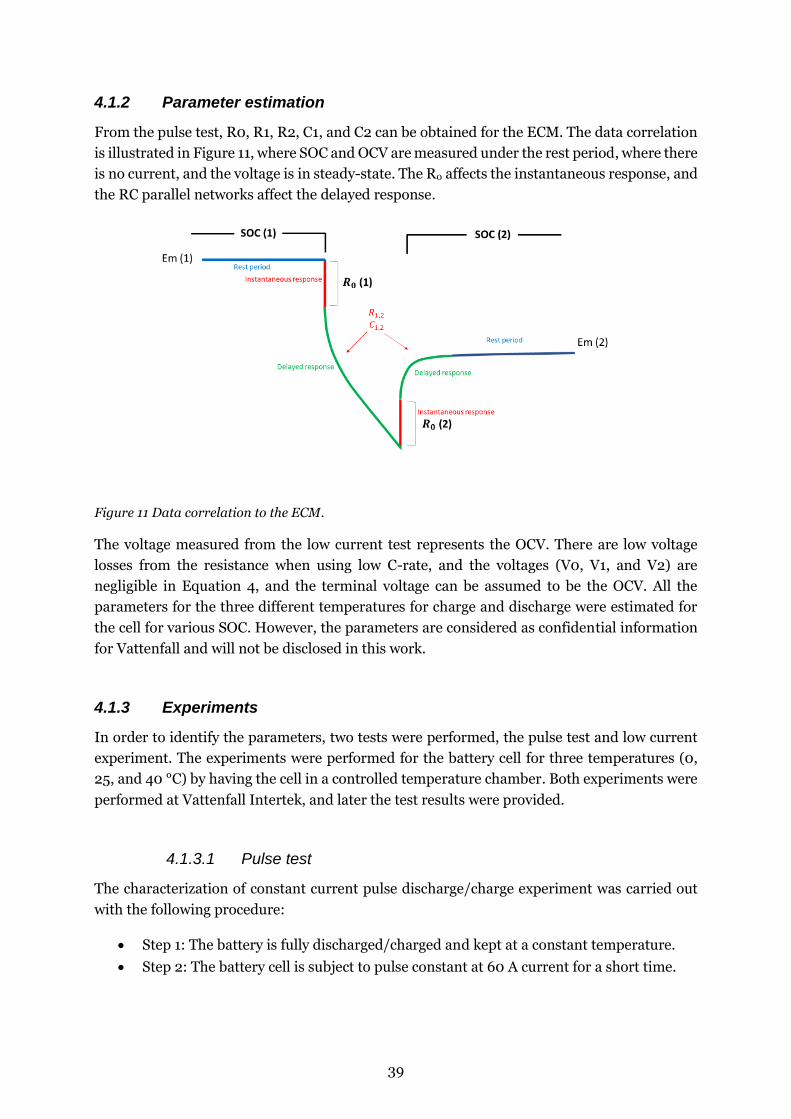
4.1.2 Parameter estimation
From the pulse test, R0, R1, R2, C1, and C2 can be obtained for the ECM. The data correlation
is illustrated in Figure 11, where SOC and OCV are measured under the rest period, where there
is no current, and the voltage is in steady-state. The R0 affects the instantaneous response, and
the RC parallel networks affect the delayed response.
Figure 11 Data correlation to the ECM.
The voltage measured from the low current test represents the OCV. There are low voltage
losses from the resistance when using low C-rate, and the voltages (V0, V1, and V2) are
negligible in Equation 4, and the terminal voltage can be assumed to be the OCV. All the
parameters for the three different temperatures for charge and discharge were estimated for
the cell for various SOC. However, the parameters are considered as confidential information
for Vattenfall and will not be disclosed in this work.
4.1.3 Experiments
In order to identify the parameters, two tests were performed, the pulse test and low current
experiment. The experiments were performed for the battery cell for three temperatures (0,
25, and 40 °C) by having the cell in a controlled temperature chamber. Both experiments were
performed at Vattenfall Intertek, and later the test results were provided.
4.1.3.1 Pulse test
The characterization of constant current pulse discharge/charge experiment was carried out
with the following procedure:
• Step 1: The battery is fully discharged/charged and kept at a constant temperature.
• Step 2: The battery cell is subject to pulse constant at 60 A current for a short time.
40
• Step 3: After the battery is charge/discharge with a short pulse current, the cell is
allowed to rest for a longer time. This is to get the OCV at a steady state for higher
accuracy and keep the temperature controlled.
• Step 4: Repeat steps 2 and 3 in a number of cycles depending on the battery capacity.
• Step 5: The experiment is repeated for different temperatures.
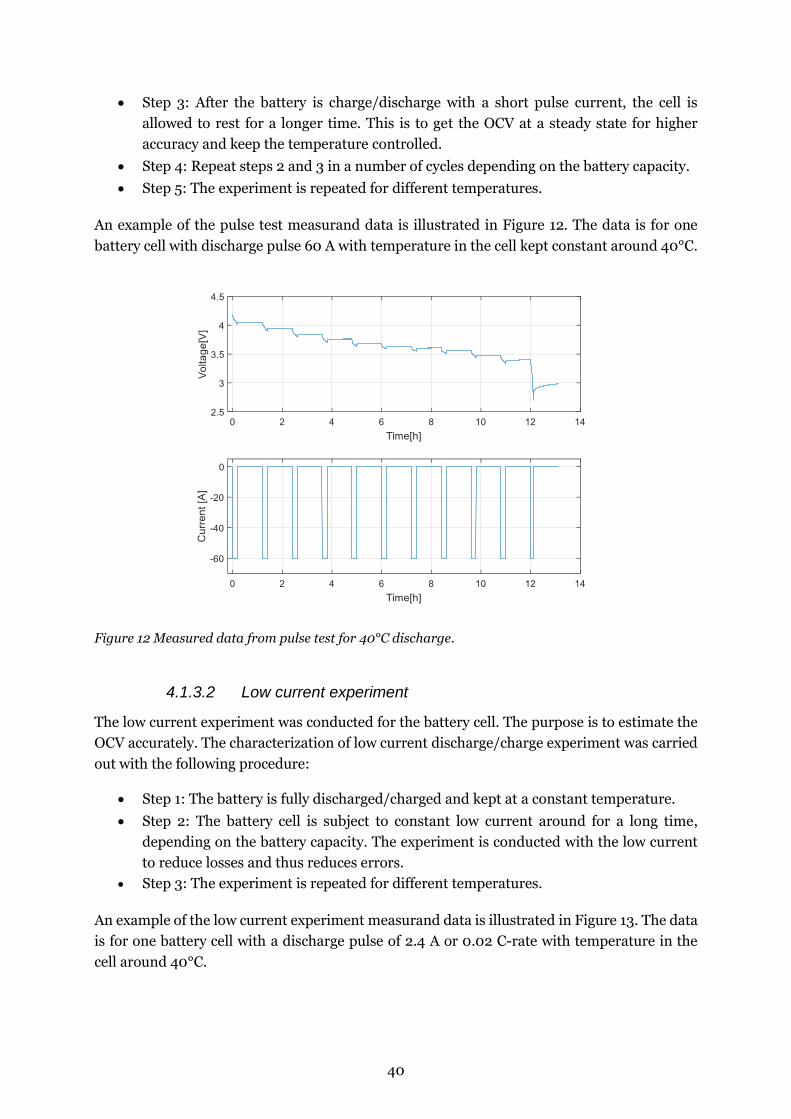
An example of the pulse test measurand data is illustrated in Figure 12. The data is for one
battery cell with discharge pulse 60 A with temperature in the cell kept constant around 40°C.
Figure 12 Measured data from pulse test for 40°C discharge.
4.1.3.2 Low current experiment
The low current experiment was conducted for the battery cell. The purpose is to estimate the
OCV accurately. The characterization of low current discharge/charge experiment was carried
out with the following procedure:
• Step 1: The battery is fully discharged/charged and kept at a constant temperature.
• Step 2: The battery cell is subject to constant low current around for a long time,
depending on the battery capacity. The experiment is conducted with the low current
to reduce losses and thus reduces errors.
• Step 3: The experiment is repeated for different temperatures.
An example of the low current experiment measurand data is illustrated in Figure 13. The data
is for one battery cell with a discharge pulse of 2.4 A or 0.02 C-rate with temperature in the
cell around 40°C.
41
Figure 13 Measured data from low current experiment for 40°C discharge.
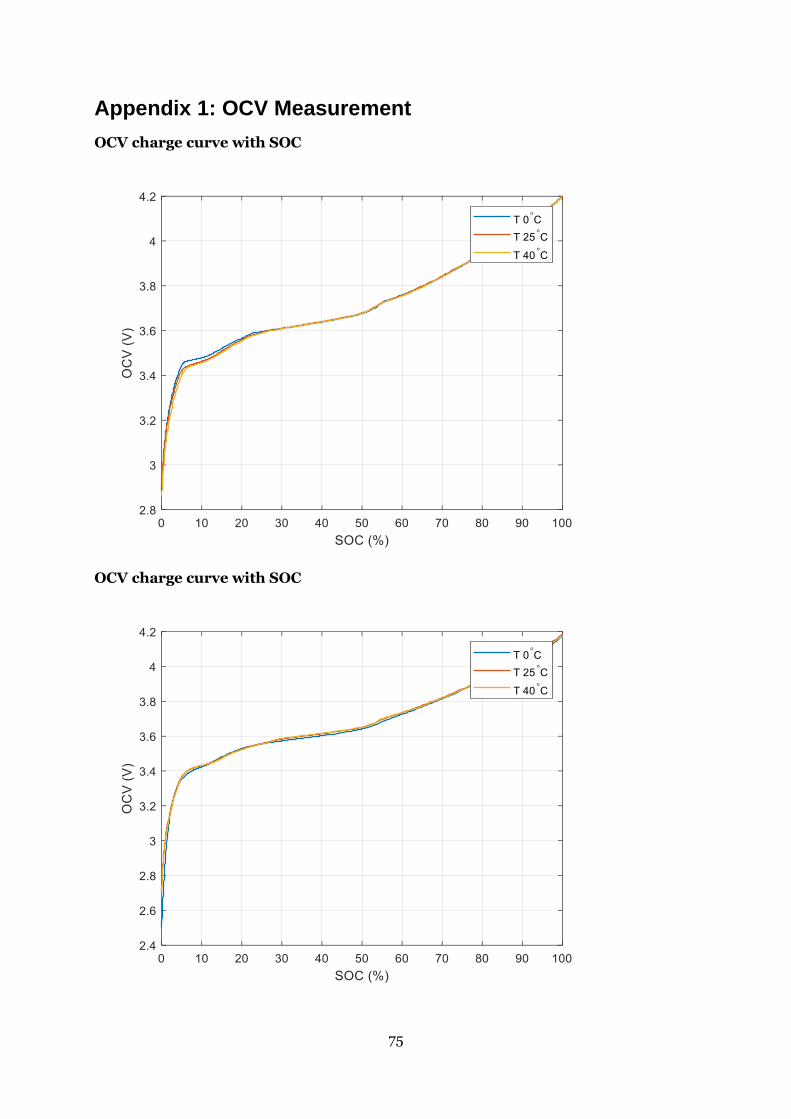
The estimated OCV curves for the charge and discharge for the three temperatures can be
found in Appendix 1. The OCV initial and end voltage for charge and discharge for the three
temperatures is presented in Table 11.
Table 11 OCV Initial and End.
Charge
Temperature (˚C) Initial (V) End (V)
0 2.88 4.2
25 2.92 4.2
40 2.86 4.2
Discharge
Temperature (˚C) Initial (V) End (V)
0 4.181 2.5
25 4.188 2.7
40 4.179 2.7
42
4.2 Battery Thermal Model
The thermal model is developed using the electrical parameters for the ECM. The cell heat
generation and heat transfer are developed in a model and later validated against experimental
data.
4.2.1 Heat generation in Lithium-ion Batteries
Energy conversion through chemical, electrical, and mass transport processes is responsible
for the heat generated during the operation of the battery cell. Reliable predictions of cell
temperature and heat generation rate are required for the developing thermal model. The two
main heat sources in the cell are the irreversible and reversible heat (Damay, Forgez, Bichat,
Friedrich, & Ospina, 2013) and can be described in Equation 7.
Equation 7 Heat generation.
𝑔𝑒𝑛 = 𝑖𝑟𝑟 + 𝑟𝑒𝑣
The irreversible heat, also called the joule effect are ohmic losses in the cell from the electrical
resistances (Makinejad, o.a., 2015). This is presented in Equation 8.
The reversible heat mechanism consists of the entropy effect, and heat is generated or
consumed because of the reversible entropy change resulting from electrochemical reactions
within the cell. The equation for the reversible heat can be written as Equation 9.
Equation 9 Reversible heat.
𝑟𝑒𝑣 = 𝐼𝑐𝑒𝑙𝑙𝑇𝑐𝑒𝑙𝑙
𝜕𝑉𝑂𝐶𝑉
𝜕𝑇
The entropic coefficients term (𝜕𝑉𝑂𝐶𝑉
𝜕𝑇) is calculated from the OCV for the cell under different
temperatures. The term was calculated for both charge/discharges, and the average value was
used. The entropic coefficients term as a function of SOC is illustrated in Figure 14. The outliner
at the beginning and end was removed, and data for SOC between 90 and 12 % was obtained
in this work.
43
Figure 14 Entropic coefficients as a function of SOC.
Most of the time, the reversible heat considered to be negligible compared with the irreversible
heat, and that depends on the material and current application. The battery studied in this
work shows that the amount of heat rate disputed from the irreversible and reversible heat can
vary with C-rate and is presented in Figure 15. The figure presents the heat dissipation at SOC
0.5 and the temperature of the cell around 25 ˚C. The reversible heat can be larger than the
irreversible heat at low C-rate, so it is imported to have an accurate entropic coefficient if the
thermal model is simulating at a low C-rate. However, at high C-rate, the irreversible heat is
more significant and dominating, and the effect of the reversible heat is small. If the cell
operates at a low C-rate, the reversible heat becomes more critical and must be considered.
Figure 15 Heat dissipation between the irreversible and reversible as a function of C-rate.
44
The total heat rate from the irreversible and reversible heat for the cell is illustrated in Figure
16 with C-rate 0.5 and the temperature of the cell around 25 ˚C. From the figure, a noticeable
result is that the reaction heats can be positive or negative within the cell due to the transfer of
ions and electrons. The positive heat in the reaction is called exothermic, this occurs when
there is an increase in enthalpy, and the reaction is hotter than the surrounding. The opposite
happens in the endothermic reaction, were the enthalpy decreases, and the reaction is cooler
than the surrounding (Santhanagopalan, Smith, Neubauer, Gi-heon, & Pescaran, 2015).
Figure 16 Cell heat rate as a function of SOC with operation C-rate at 0.5 and temperature around 25 ˚C.
4.2.2 Heat transfer model in the Cell
The temperature distribution in the cell depends on the material inside the cell and local heat
generation. The lumped capacitance thermal model was used in the study. The cell component
is illustrated in the schematic figure in Figure 17. The cell consists of five components; the jelly
roll is the inside part of the cell and consists of layers of anode, cathode, and separator. The
visible outside parts of the cell are the cell top, floor, and can. The visible component is
integrated with the environment surrounding the cell.
45
Figure 17 Schematic figure of the cell component, cell front (left), and cell side (right).
Heat transfer and the surrounding assumed to be through conductivity heat transfer (Equation
10) and convective heat transfer (Equation 11). The heat from radiation is small and assumed
to be negligible. The energy balance combining the conductivity, connectivity, and heat is
presented in Equation 12 (Incropera, Dewitt, Bergman, & Lavine, 2013, ss. 112-118). The
definition of the symbols in the equation is presented in Table 12.
Equation 10 Conductivity heat transfer.
𝑄𝑐𝑜𝑛𝑑 =𝑘𝐴
𝐿(𝑇𝑖 − 𝑇𝑆𝑢𝑟𝑓)
Equation 11 Convective heat transfer.
𝑄𝑐𝑜𝑛𝑣 = ℎ𝐴(𝑇𝑠𝑢𝑟𝑓 − 𝑇𝑎𝑚𝑏)
Equation 12 Heat transfer energy balance.
𝐶𝑡ℎ
𝜕𝑇𝑖
𝜕𝑡= 𝑄ℎ𝑒𝑎𝑡 −
𝑘𝐴
𝑑(𝑇𝑖 − 𝑇𝑆𝑢𝑟𝑓) − ℎ𝐴(𝑇𝑠𝑢𝑟𝑓 − 𝑇𝑆𝑢𝑟𝑓)
Table 12 Symbols description of heat transfer equations.
Symbol Description A Cross-section area
Cth Thermal mass capacity h Heat transfer coefficient k Thermal conductivity L Thickness
Qheat Thermal heat t Timestep Ti Internal temperature
Tsurf Surface temperature Tsurr Surrounding/Ambient temperature
The cell was modeled by the thermal network shown in Figure 18, where there is one central
node for the cell core (Jelly Roll), one node per face, and one for the terminal. The main heat
generation happens in the cell core and transfers to the other parts of the cell, according to the
figure.
46
Figure 18 Lumped thermal model of the cell.
Table 13 presents the descriptions of the symbols used in Figure 18. The equation to estimate
the parameter is highlighted. However, the parameter, such as thermal mass capacity (Cth) and
thermal resistance (Rth) is was extracted from the cell datasheet.
Table 13 Symbols description of the lumped thermal model of the cell.
Symbol Description Evaluation Cth1 Thermal mass capacity Jelly roll Analytical Cth2 Thermal mass capacity Can Analytical Cth3 Thermal mass capacity Cell Floor Analytical Cth4 Thermal mass capacity Top Analytical Cth5 Thermal mass capacity Terminal Analytical
Q gen Heat generation Estimated (Equation 7) Rth 1 Thermal resistance Jelly Roll – Can Analytical Rth 2 Thermal resistance Can – Cell Floor Analytical Rth 3 Thermal resistance Can – Top Analytical Rth 4 Thermal resistance Jelly Roll – Terminal Analytical Rth 5 Thermal resistance Terminal - Top Analytical T1 Temperature Jelly Roll Estimated (Equation 12) T2 Temperature Can Estimated (Equation 12) T3 Temperature Cell Floor Estimated (Equation 12) T4 Temperature Top Estimated (Equation 12) T5 Temperature Terminal Estimated (Equation 12)
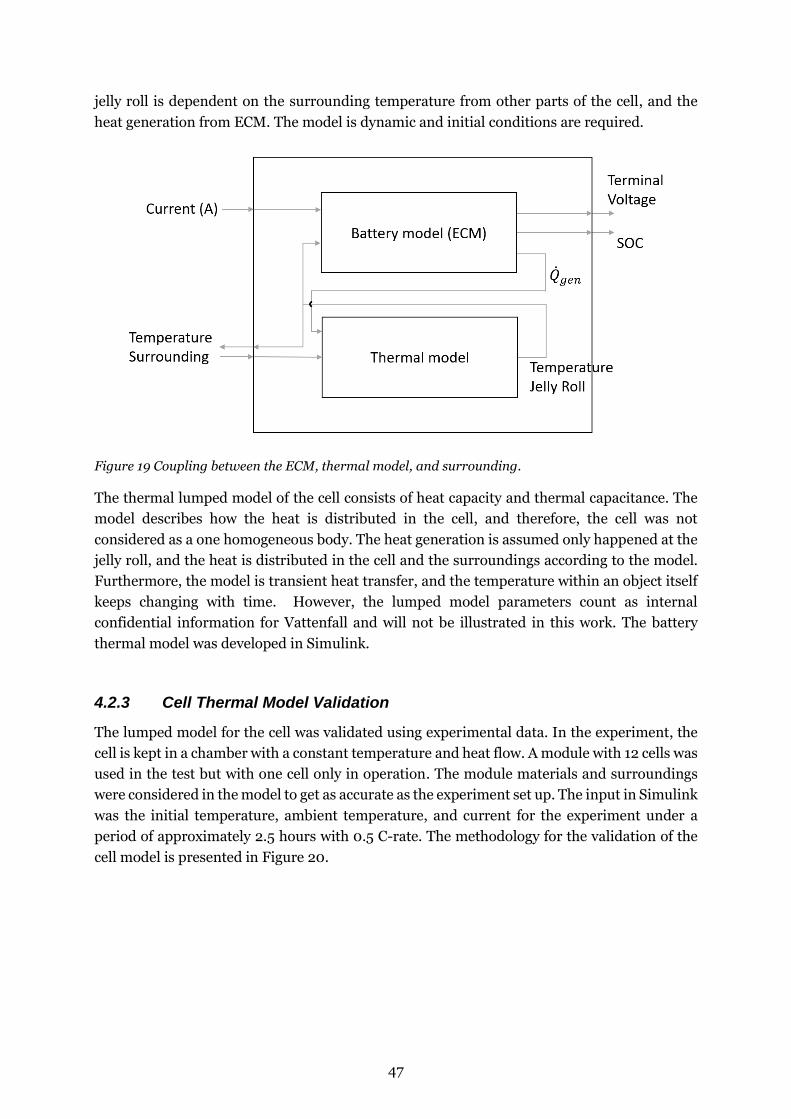
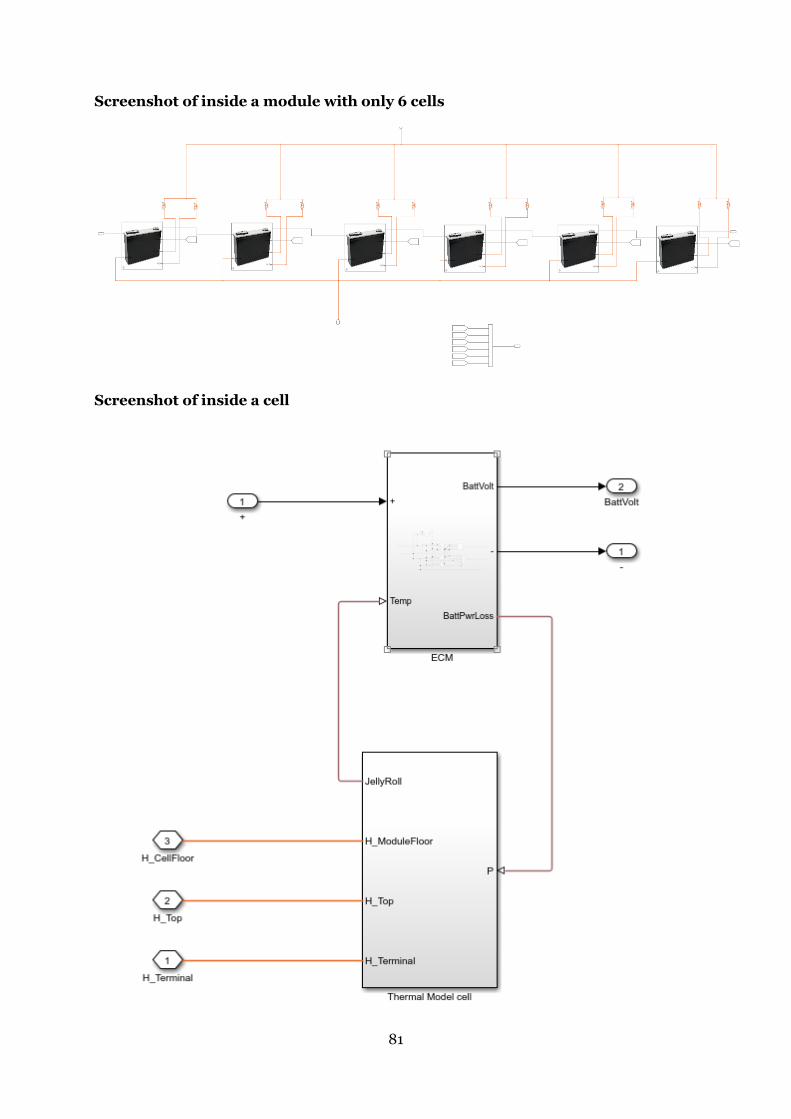
Figure 19 describes how the ECM from the battery model is used with the thermal model. The
ECM is a function of SOC, current a temperature. The figure describes how the cell core, the
47
jelly roll is dependent on the surrounding temperature from other parts of the cell, and the
heat generation from ECM. The model is dynamic and initial conditions are required.
Figure 19 Coupling between the ECM, thermal model, and surrounding.
The thermal lumped model of the cell consists of heat capacity and thermal capacitance. The
model describes how the heat is distributed in the cell, and therefore, the cell was not
considered as a one homogeneous body. The heat generation is assumed only happened at the
jelly roll, and the heat is distributed in the cell and the surroundings according to the model.
Furthermore, the model is transient heat transfer, and the temperature within an object itself
keeps changing with time. However, the lumped model parameters count as internal
confidential information for Vattenfall and will not be illustrated in this work. The battery
thermal model was developed in Simulink.
4.2.3 Cell Thermal Model Validation
The lumped model for the cell was validated using experimental data. In the experiment, the
cell is kept in a chamber with a constant temperature and heat flow. A module with 12 cells was
used in the test but with one cell only in operation. The module materials and surroundings
were considered in the model to get as accurate as the experiment set up. The input in Simulink
was the initial temperature, ambient temperature, and current for the experiment under a
period of approximately 2.5 hours with 0.5 C-rate. The methodology for the validation of the
cell model is presented in Figure 20.
48
Figure 20 Methodology for cell thermal model validation.
The validation was examined by the root-mean-square deviation (RMSE). The RMSE is used
to measure the differences between the operation data and simulated data. That will give how
much the error is for the simulated data in the model. The average RMSE for the model is 0.38
˚C. This is a relatively small difference between the experiment and simulated and is in an
acceptable range. Figure 21 illustrated the temperature curve for the experiment and simulated
data and RMSE with time.
Figure 21 Cell model validation methodology.
49
4.3 BTMS
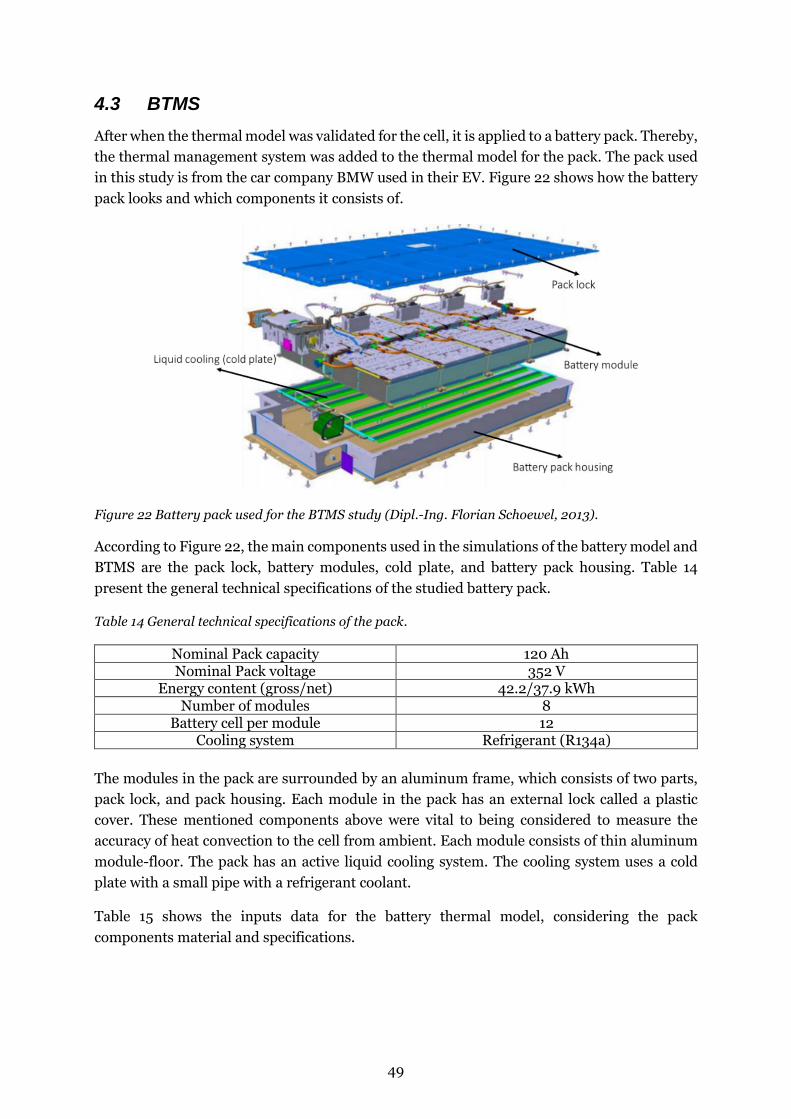
After when the thermal model was validated for the cell, it is applied to a battery pack. Thereby,
the thermal management system was added to the thermal model for the pack. The pack used
in this study is from the car company BMW used in their EV. Figure 22 shows how the battery
pack looks and which components it consists of.
Figure 22 Battery pack used for the BTMS study (Dipl.-Ing. Florian Schoewel, 2013).
According to Figure 22, the main components used in the simulations of the battery model and
BTMS are the pack lock, battery modules, cold plate, and battery pack housing. Table 14
present the general technical specifications of the studied battery pack.
Table 14 General technical specifications of the pack.
Nominal Pack capacity 120 Ah Nominal Pack voltage 352 V
Energy content (gross/net) 42.2/37.9 kWh Number of modules 8
Battery cell per module 12 Cooling system Refrigerant (R134a)
The modules in the pack are surrounded by an aluminum frame, which consists of two parts,
pack lock, and pack housing. Each module in the pack has an external lock called a plastic
cover. These mentioned components above were vital to being considered to measure the
accuracy of heat convection to the cell from ambient. Each module consists of thin aluminum
module-floor. The pack has an active liquid cooling system. The cooling system uses a cold
plate with a small pipe with a refrigerant coolant.
Table 15 shows the inputs data for the battery thermal model, considering the pack
components material and specifications.
50
Table 15 Pack material and specifications
Material plastic cover Aluminum frame Thickness m 0.002 0.004
Area m2 0.1404 2.913 Density (kg/m3) 920 -
Specific heat (J/kg, K) 1900 890 Mass (kg) 0.25834 37
Conduction coefficient (K) 0.2 218
Table 16 shows the inputs data for the battery cooling system specifications. The controller
time constant means the time needed for the refrigerant to start flows into the cold plate pipes
after the cell reaches a specific temperature limit.
Table 16 Battery cooling system specifications
Cooling system Refrigerant (R134a) One cooling pipe length 1.334 m Cooling pipe diameter 0.026 m
cooling Pressure 5 bars Mass flow 0.00208 kg/s
Controller time constant 17 sec Cooling power 299.31 kW
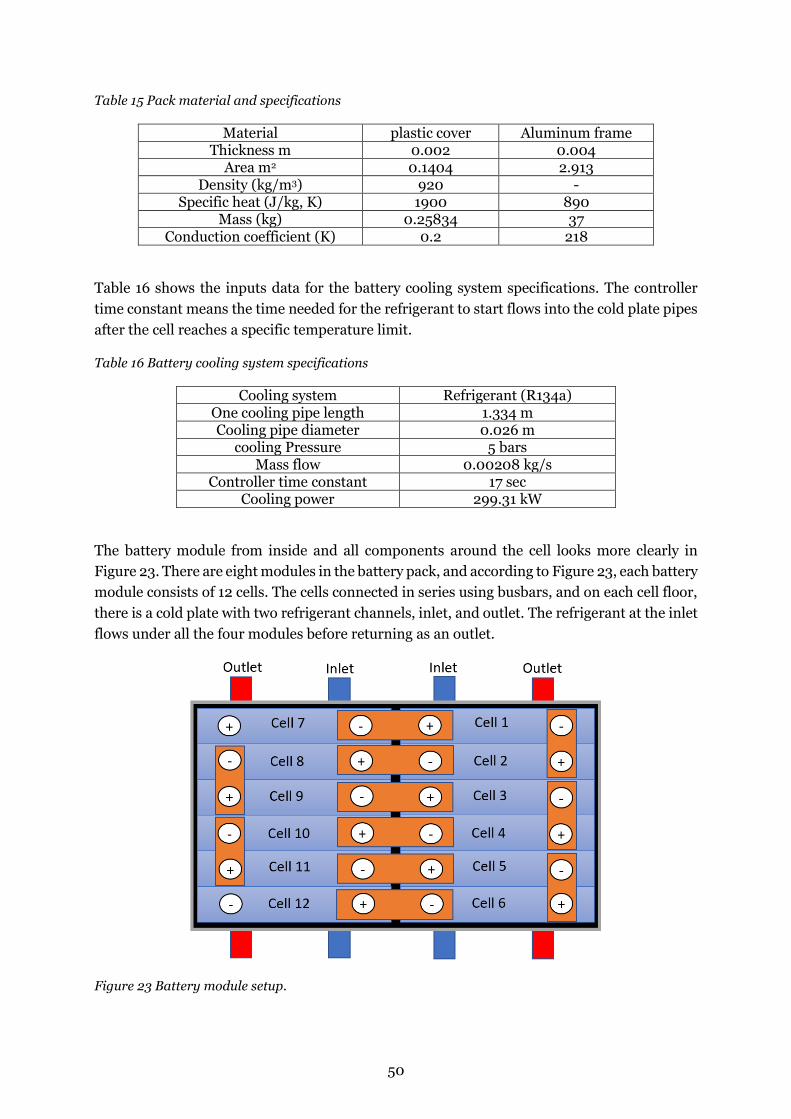
The battery module from inside and all components around the cell looks more clearly in
Figure 23. There are eight modules in the battery pack, and according to Figure 23, each battery
module consists of 12 cells. The cells connected in series using busbars, and on each cell floor,
there is a cold plate with two refrigerant channels, inlet, and outlet. The refrigerant at the inlet
flows under all the four modules before returning as an outlet.
Figure 23 Battery module setup.
51
The Pack is a component in a refrigerant cycle. The four main components in the cycle include
an evaporator, compressor, condenser, and expansion valve. The pack is the evaporator in this
cycle, which works the opposite of the condenser, here refrigerant liquid is transformed to gas,
absorbing heat from the modules in the pack. However, in this work, only inlet inputs such as
temperature, pressure, and mass flow were taken into the model. Other another component of
the refrigerant cycle was not included. This is due to limited information on the cycle and the
time of the project.
4.3.1 Pack Model Validation
The air and liquid-cooling model was validated against the operational data of the battery
storage container. The container house has a number of same battery pack described in the
work, inverters, heat ventilation air conditioner (HVAC) system, and several other
components. The HAVC system is installed to keep the container in optimal condition during
cold or hot weather as well as provide cooling during peak operational time, in which both the
battery pack and inverters tend to get hot. The data extracted from the system is both when the
pack used air for cooling and liquid. The step size is 15 min, however smaller step size can be
better for validation but was not available. The temperature data are round up and is another
source of error for the validation. It is assumed there is natural convection between the room
temperature and the pack aluminium frame.
The methodology for the validation of the BMW pack model is illustrated in Figure 24. The
input for the simulation is the container room temperature, current, initial SOC, and initial
temperature. The parameters SOC, voltage, and temperature of the top part of the cell were
simulated and validated with the operation data. The top temperature part of the cell is used
due to only that part of the cell had a sensor and measured temperature. The validation was
examined by RMSE and determination coefficient (R2). R2 is used to test how good the model
to predict the operation data.
Figure 24 BMTS Pack model validation methodology.
4.3.1.1 Air Cooling Validation
Air cooling was validated against the operation data, and the result is illustrated in Table 17.
The result shows that the model for air cooling is accurate and can be used for the simulation.
The SOC and voltage curves are almost the same. The temperature for discharge is accurate
and has RMSE mean around 0.98 ˚C and the charge is 0.93 ˚C. The R2 is high, and the model
is accurate to simulate the air cooling for the pack. The temperature curve with time for
operation data and simulation for discharge is illustrated in Figure 25.
52
Figure 25 Air cooling temperature validation discharge
The temperature curve with time between the operation data and simulation for the charge is
illustrated in Figure 26.
Figure 26 Air cooling temperature validation charge.
53
The summary of the validation for charge and discharge can be found in Table 17. The full
result curves for voltage and SOC can be found in Appendix 2.
Table 17 Air cooling model validation.
Air cooling charge
Parameters R2 RMSE mean
V 98% 2.58 V
SOC 99% 3.8%
T 79% 0.93 ˚C
Air cooling discharge
Parameters R2 RMSE mean
V 98% 4.12 V
SOC 99% 5.7%
T 97% 0.98 ˚C
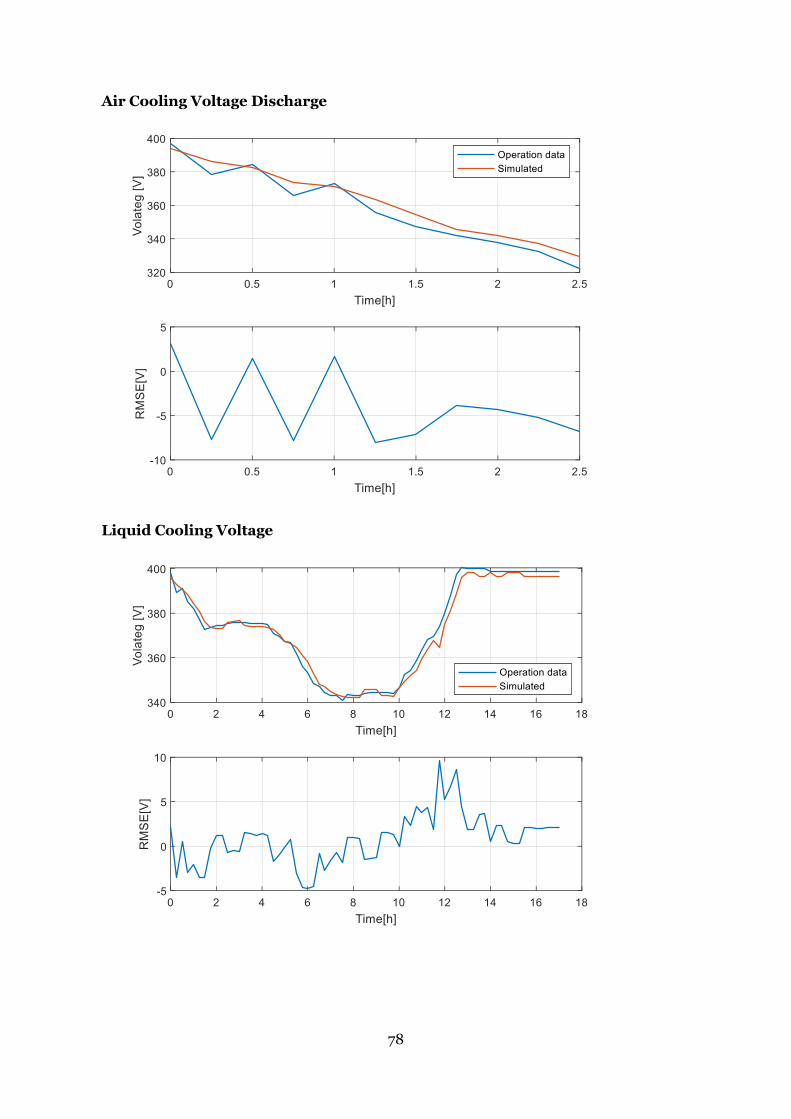
4.3.1.2 Liquid Cooling Validation
The liquid cooling is a more complicated system compared to the air cooling, and it is crucial
to have the air-cooling model validated before proceeding with the liquid cooling. To be able
to validate the model, the chosen data period should have enough time with liquid cooling is
working. The period of the chosen data is over 17 hours, with liquid cooling working for around
5 hours. The data start with the cells are at SOC 97 % and is discharge to SOC 28%. After that,
the cells are charged to SOC 97%. Figure 27 represents the temperature curve for that period
and with the RMSE curve, and Table 18 represents the rest of the validation.
Figure 27 Liquid cooling temperature validation.
54
Table 18 Liquid cooling model validation.
Liquid cooling
Parameters R2 RMSE mean
V 98% 2.91 V
SOC 99% 2.09%
T 90% 1.02 ˚C
The validation curves for the SOC and voltage can be found in Appendix 2.
55
5 RESULTS
In this study, the terminal voltage will be simulated for the cell for the three temperature cases
(0, 25, and 40˚C), and each case was simulated with different C-rate. The cell heat generation
using different C-rate under different cell temperatures for both full charge and discharge cases
was also studied. In addition, the cell temperature in the BMW battery pack was investigated
using air, and liquid cooling simulation with the same configuration described earlier and can
be seen in Figure 22.
5.1 Cell terminal voltage
The voltage curves were simulated with certain C-rate for the three cell temperatures (0, 25,
and 40 ˚C). The result shows the impacts on the OCVs in a range of temperatures and SOC.
The result for the voltage at cell temperature 0 ˚C for discharge and charge is illustrated in
Figure 28. Form the result, the gap between OCV and terminal voltage is more significant with
a higher C-rate. The gaps are resulted by the electrical resistance, which is a function of SOC
and current. With a higher current, the losses are more significant.
Figure 28 Voltage curve with C-rate for 0 ˚C, discharge (left), and charge (right).
Figure 29 presents the terminal voltage with SOC at temperature 25 ˚C for discharge and
charge. The voltages at cell temperature 25 ˚C have fewer gaps compared to the 0 ˚C due to
electrical resistance losses are smaller at higher cell temperature.
56
Figure 29 Voltage curve with C-rate for 25 ˚C, discharge (left), and charge (right).
Figure 30 shows the terminal voltage with SOC at temperature 40 ˚C for discharge and charge.
The voltages at 40 ˚C have fewer gaps compared to the 0 and 25 ˚C due to the electrical
resistance losses smaller than the other two cell temperatures.
Figure 30 Voltage curve with C-rate for 40 ˚C, discharge (left), and charge (right).
5.2 Cell heat generation
The cell heat generation varies depending on a number of factors such as C-rate, the
temperature of the cell, SOC, and if the cell is charging or discharging. In Figure 31, the cell
heat generation with temperature for different C-rate is illustrated when the cell is full
discharging and charging. The purpose of the figure is to see the optimum operating
temperature range related to the cell generated heat. The figure shows that the cell has high
heat generation at low temperature as well when the C-rate is high. However, the heat is lower
at higher cell temperature, and this is due to the electrical resistances at ECM are smaller at
high temperature. The optimum temperature range for the cell is between 15 and 35 ˚C for
LIBs (Wiebelt, 2018). Another noticeable result is that heat generation from charging is higher
57
comparing with discharging. This is due to the electrical resistances in the ECM are higher
during charge.
Figure 31 Cell heat generation for different C-rate with cell temperature, discharge (left) and charge (right)
5.3 Simulation result for BTMS
Simulations were conducted for the pack with different C-rate for both air and liquid cooling.
The simulation result will be conducted for initial temperature, which is equal to surrounding
temperatures. The temperature conditions are 12˚C (T12), 18˚C (T18), 22˚C (T22), 28˚C
(T28), and 32˚C (T32). The C-rate varies between 0.3 and 2. If the temperature is over 40˚C,
the simulation for a higher C-rate will is not recommended and can give a less accurate result.
This is due to the experimental data for the ECM was conducted only for the temperatures
between 0 to 40 ˚C.
5.3.1 Air cooling
Figure 32 illustrates the max temperature inside the cell during full discharge and charge with
different C-rate. The result presented shows that the temperature of the cell depends on the
surrounding temperature and the C-rate. The upper optimum temperature limit for LIBs is
around 35˚C and marked with a red dash line.
58
Figure 32 Max temperature of the cell using air cooling, discharge (left), and charge (right).
The maximum C-rate for every case, according to the simulation result from Figure 32, is
presented in Table 19. The table shows that at lower temperature cases, the maximum C-rate
is higher than in high surrounding temperature cases.
Table 19 Operation condition for air cooling.
Discharge Charge
Case Max C-rate Case Max C-rate
T12 1.7 T12 1.15
T18 1.45 T18 0.95
T22 1.2 T22 0.75
T28 0.8 T28 0.35
T32 0.5 T32 < 0.3
Figure 33 presents the cell temperature development for different C-rate cases. The cell
temperature development is the difference between max cell temperature and initial cell
temperature. At low surrounding temperature cases such as at T12, the cell temperature
development is higher compared to high surrounding temperature cases such as at T32 due to
higher heat generation at low cell temperatures, as presented in Figure 31.
59
Figure 33 Temperature difference between the initial and max temperature of the cell for air cooling, discharge (left), and charge (right).
The max temperature difference within a cell is illustrated in Figure 34. The air cooling has a
low-temperature difference in the cell (ΔT) and is under the upper limit of 5˚C for all cases
except T12 at high C-rate. However, this will not change the operation limit in Table 19.
Figure 34 Max temperature difference between different parts in the of the cell for air cooling, discharge (left), and charge (right).
5.3.2 Liquid cooling
Figure 35 illustrates the cell max-temperature for surrounding temperature cases with
different C-rate. The upper optimum temperature limit for LIBs is around 35˚C and marked
with a red dash line. The result presented shows that with liquid cooling, the cell can go for
higher C-rate despite having high initial and surrounding temperature such as at T 32˚C.
60
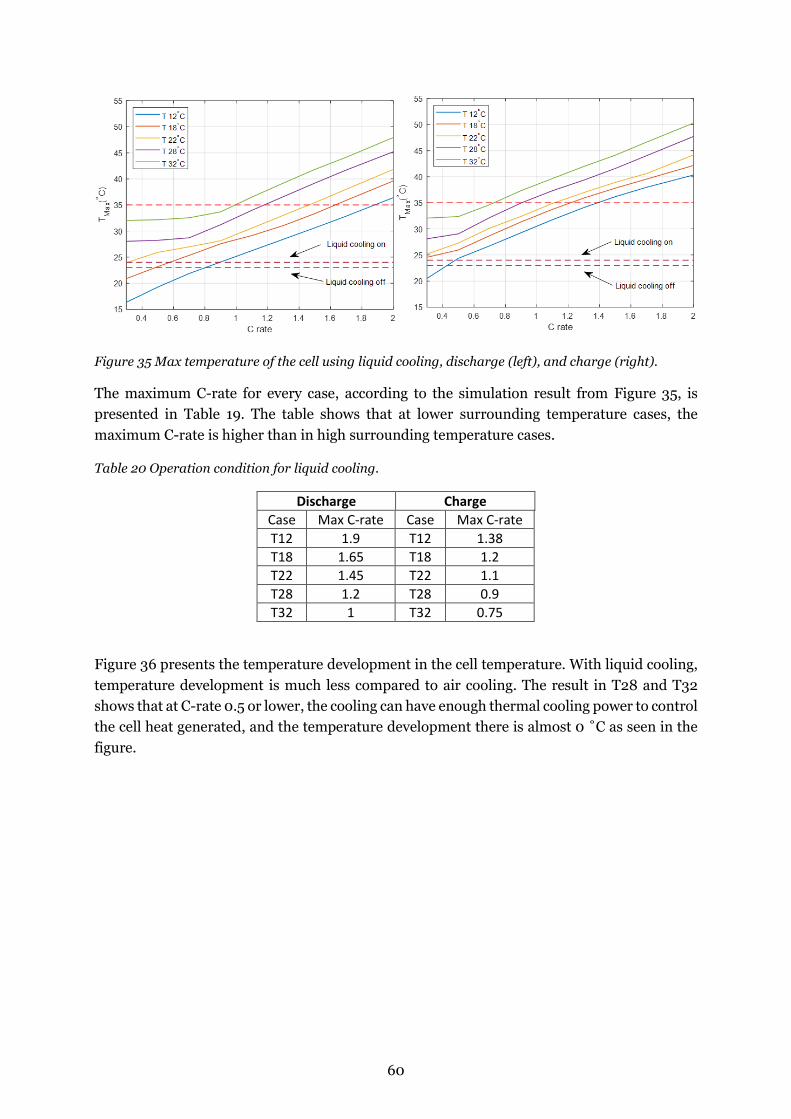
Figure 35 Max temperature of the cell using liquid cooling, discharge (left), and charge (right).
The maximum C-rate for every case, according to the simulation result from Figure 35, is
presented in Table 19. The table shows that at lower surrounding temperature cases, the
maximum C-rate is higher than in high surrounding temperature cases.
Table 20 Operation condition for liquid cooling.
Discharge Charge
Case Max C-rate Case Max C-rate
T12 1.9 T12 1.38
T18 1.65 T18 1.2
T22 1.45 T22 1.1
T28 1.2 T28 0.9
T32 1 T32 0.75
Figure 36 presents the temperature development in the cell temperature. With liquid cooling,
temperature development is much less compared to air cooling. The result in T28 and T32
shows that at C-rate 0.5 or lower, the cooling can have enough thermal cooling power to control
the cell heat generated, and the temperature development there is almost 0 ˚C as seen in the
figure.
61
Figure 36 Temperature difference between the initial and max temperature of the cell for liquid cooling, discharge (left), and charge (right).
Figure 37 presents how the max temperature difference in the cell using liquid cooling. The
result shows that liquid cooling has a high-temperature difference in the cell compared to air
cooling. This is due to that the cooling plate is installed on the bottom of modules, and the
prismatic cell size is big compared to other cell types. This can create a high-temperature
gradient in the cell.
Figure 37 Max temperature difference between different parts in the of the cell for liquid cooling discharge (left), and charge (right).
According to Figure 37, there is a higher temperature difference in the cell when using liquid
cooling. Thereby, the operation condition in Table 20, which only takes the 35 ˚C max cell
optimum temperature limits to consideration, must be modified to consider the optimum
maximum temperature difference in the cell of 5 degrees. The new operational condition, after
taken account of both the optimum max cell temperature and maximum temperature
difference in the cell, is presented in Table 21. The reduction difference after taking the
temperature difference in the cell shown in the percentage in the table. The result shows that
in discharge in all cases except T32, there is a reduction. For the charge cases, there is no
reduction in the maximum C-rate.
62
Table 21 Operation condition for liquid cooling after ΔT cell.
Discharge Charge
Case Max C-rate Case Max C-rate
T12 1.58 (-17%) T12 1.38 (0%)
T18 1.45 (-12%) T18 1.2 (0%)
T22 1.35 (-15%) T22 1.1 (0%)
T28 1.25 (-7%) T28 0.9 (0%)
T32 1 (0%) T32 0.75 (0%)
5.3.3 Comparison between Air and Liquid cooling
A comparison between the liquid and air-cooling operating conditions was conducted from
Table 21, and Table 19, with the result presented in Table 22. The result shows that air is better
at T12 and T18 cases during discharge. However, in all the other cases, liquid cooling is better.
The difference in optimum C-rate gets higher between liquid and air cooling with temperature
surrounding get higher, this indicates air cooling is more dependent on the surrounding
temperature compared using liquid cooling.
Table 22 Comparison between liquid and air cooling.
Discharge Charge
Case Max C-rate Case Max C-rate
T12 -0.12 T12 0.28
T18 0 T18 0.3
T22 0.15 T22 0.4
T28 0.5 T28 0.55
T32 0.55 T32 >0.55
5.3.4 Relaxing period
The time for the cells to cool down in the pack with no load is expressed as a relaxing period.
The simulation was conducted with the pack temperature starting at 32 ˚C with the
surrounding temperature at 22 ˚C and the three cases where simulated. The first case is with
the liquid cooling with natural convection outside of the pack (h=20 W/m2K). The second case
is liquid turned off, and the pack is cooled by air with natural convection similar to the first
condition. The last case is without liquid, and the pack is cooled by air with forced convection
(h=100 W/m2K). The simulation for the cases with time is presented in Figure 38. The time for
each case to cool the cells in the pack from 32 to 23 ˚C is presented in Table 23. The result
shows that air cooling can cool the cell in a much faster time compared with only using air
cooling. The result shows that there is not much between natural or forced convection with
only 1.2 hours difference. This issue is due to the design of the pack being isolated with low air
circulation inside and no gaps between the cells in the module for air to cool the cells.
63
Table 23 Cases cooling time from 32 to 23 ˚C
Case Cooling time (hour) Liquid cooling 1.8
Air cooling (natural convection) 15 Air cooling (forced convection) 13.3
Figure 38 Relaxing period simulation
64
6 DISCUSSION
Most of the knowledge and industrial experiences of BTMS for LIBs come from EV applications
in comparison with stationary BTMS applications. There are some differences between the EV
and the grid/microgrid stationary applications, mainly in requirements, such as the scale of
capacity, operation voltage, and current and battery usage patterns. Therefore, the design basis
and operation requirements are different, which should further be investigated.
Actively force air cooling has mostly been used for current stationary grid/microgrid connected
stationary BESS applications but with limited technical information available. The gaps in
basic engineering knowledge and operation experiences could be filled by internal case studies
for the existing projects and close collaboration with technology suppliers. The BMW air
cooling system used in Vattenfall projects could be considered as a simple air-cooling (passive
cooling) solution for the stationary application in comparison with common air-cooling
concepts applied for LIB TMS.
Liquid cooling has widely been used in EV applications with different system configurations
and cooling patterns. The BMW liquid cooling currently used in Vattenfall projects is a relative
sample indirect liquid cooling solution in comparison with the liquid cooling systems in other
EV applications. There is a general trend to increasing liquid cooling in stationary LIB TMS
based on communications with some stationary BESS suppliers and users. The benefits may
mainly be expected to reduce the footprint of BTMS and improve the lifetime and safety of
LIBs. However, the benefits of stationary applications are not varied clear and under
investigation.
It is difficult to give an apparent comparison between air cooling and liquid cooling for
stationary applications without a fair comparison basis and specifying the applications because
it is generally projected (service or application) dependence. The selection of a better BTMS is
generally an optimization of important performance based on relevant KPIs, in which trade-
offs should be made among many factors such as costs, complexity, cooling effects,
temperature uniformity, and parasitic power consumption. Thermal modeling and simulation
may be the best way to give a better comparison for different technical options if proper KPIs
have been chosen together with economic factors.
According to the simulations, the BTMS depends on many factors such as cooling system type,
the surrounding temperature, operation conditions, and C-rate. The advantages of using air
cooling are that the system is a simple structure, low cost, easy maintenance, and the parasitic
energy consumption is low during the system operation process due to the lower air viscosity.
Moreover, according to the result, the air cooling keeps the cell temperature difference under
the limit of 5°C event at high C-rate and surrounding temperature. However, the air cooling
can keep the cell working under the optimum temperature only at low C-rate and low
surrounding temperature. Furthermore, having low surrounding temperature can affect the
heat generation in the cell, as shown in Figure 31, and can be further illustrated in Figure 33
with the temperature developed for the cell at different surrounding temperatures. The result
of the air-cooling operation condition is presented in Table 19. Furthermore, it is also more
65
challenging to have an evenly distributed cooling performance between the cells in the pack as
air has a low viscosity that makes it flow less controllable.
Using liquid cooling for the BTMS allows the cell to operate at a higher C-rate compared to air
cooling since the refrigerant R134a has higher heat capacity than air. According to Figure 35,
the cell can be operated at a higher C-rate and surrounding temperature, keeping the
maximum temperature under the optimum limit of 35°C. Besides, according to the literature
study, the liquid cooling has other advantages over air cooling such as high heat transfer,
handles large cooling loads in scenarios (high power draws, high environment temperatures),
better thermal balance and uniformity temperature distribution at certain conditions. The
liquid cooling system also has the advantage of occupying less space compared to the air-
cooling system, but it is not so crucial for BESS, where space is not limited as for EV
applications. However, BTMS using liquid cooling is more complex, requires more
maintenance, has a higher cost compared to air cooling, and has potential leakage, which is a
safety hazard. In addition, the maximum temperature difference in the cell is higher when
using liquid cooling for the BMW pack design compared to air cooling, and this is illustrated
in Figure 37. The figure shows that the ΔT max in the cell at the optimum limit of 5°C and
considered this shows that the maximum C-rate must be decreased for all cases for discharge
except the T32 case compare with only taken the temperature max limit of 35°C into
consideration. The result is illustrated in Table 21. This is due to the pack design, which makes
one side of cells (cell floor) only conducting with the cold plate, and it is harder to distribute
the heat through the whole-cell due to the large size of the prismatic cell. Even when using air
cooling, (Lip, o.a., 2016) indicate that the cylindrical batteries achieve better performance from
air cooling, since the investigated parametric influence on a cylindrical battery module due to
the battery's distribution and size compared with prismatic batteries.
Furthermore, the performance comparison between the liquid and air cooling for different
surrounding temperature cases is presented in Table 22. The comparison shows that using
liquid cooling, the LIBs can be operated at higher C-rate and high surrounding temperature
cases, such as at T32 compared to air cooling. However, the result shows that air-cooling is
better at surrounding temperatures below 18°C during discharge. This due to that using liquid
cooling during discharge at surrounding temperature 18°C or below will create high ΔT in the
cell, above the optimum limit of 5°C. This can be seen in Table 21 at case T12 during discharge,
where the max C-rate decreased by 17%.
LIBs, after many cycles, lose their capacity, and after a certain period, the cells reach end-of-
life and need to recycle. If the cells do not follow their recommended operation temperature, it
will appear many thermal issues that affect the performance of the cells badly. The cell
operation temperature can affect the cell performance degradation at elevated temperatures,
aging effects at low temperatures, thermal runaway under uncontrolled heat generation and
abuse conditions, and temperature maldistribution, mostly due to BTMS setup. Finally, there
is simply no BTMS solution that would fit all applications. It should instead be thoroughly
investigated and optimized based on the requirements of what the system will be used for.
There are several external factors when selecting a suitable thermal management system, such
as the use case, cost, safety, manufacturability, life-expectancy, and other factors.
66
7 CONCLUSION
In this work, the status of BTMS technologies applied for stationary lithium-ion BESS was
investigated. There is more literature about the BTMS for EV applications, and the major
BTMS applied for stationary applications is air-cooling systems. In this study, a model for the
BMW battery pack with BTMS using air and liquid cooling was developed, and the
performance of the two cooling systems was compared.
The following conclusion was drawn from this work:
• Both air and liquid cooling can be applied for BESS applications with certain limits.
• The air-cooling is more suitable for the BMW battery pack operated at low surrounding
temperatures or operating at low C-rate.
• The liquid cooling is better to use for the BMW battery pack operated at high
surrounding temperature or operating at high C-rate. However, the cell temperature
difference when using liquid cooling has a certain limitation on the operation
conditions for most of the discharge cases.
• Considering air cooling, the BMW battery pack is compact, isolated, and there are no
gaps between each cell for the air to flows through. This makes the BMW pack special
case with passive air cooling and makes air cooling less efficient.
• There is simply no BTMS solution that would fit all applications and should be
investigated and optimized based on the requirements of how and what the system will
be used for.
67
8 FUTURE WORK
The work conducted in this thesis can be improved in several aspects. Aging factor needs to be
implemented in the model. This can make the model capable of simulating and study cell
capacity degradation under cells' lifetime. A more accurate study of the operational cell
condition can be conducted. Furthermore, the CFD model has been developed for the cell.
However, the model requires more parameters and needs more time for the BTMS system, and
therefore it’s not mentioned in this thesis. With the CFD model, the heat flow in the pack can
be studied more in detail. In this work, the BMW pack was used for both air and liquid cooling.
Furthermore, the pack is designed for liquid cooling and not air cooling. This means when
using air cooling, it’s passive air cooling. However, there is more pack design, such as from
Samsung, that is designed for air-cooling and uses a fan to cool the cells. This is more effective
than the BMW passive cooling, and this type of BTMS can be studied more and compared with
the BMW liquid cooling.
68
REFERENCES
Ahemd A, P. (2002). Battery thermal models for hybrid vehicle simulations. Journal of
Power Sources, Volume 110, Issue 2, 377-382. doi:10.1016/S0378-7753(02)00200-8
Arcus, C. (2016). A Tale of 3 Battery Packs. Retrieved from cleantechnica: