a. Corresponding author: [email protected]THERMODYNAMIC ANALYSIS OF EFFICIENT DOMESTIC HEATING SYSTEMS S. Cooper 1,a , G. P. Hammond 1, 2 and M. C. McManus 1, 2 1. Department of Mechanical Engineering, University of Bath, Bath, UK 2. ISEE, University of Bath, Bath, UK ABSTRACT Energy and exergy analysis is employed to compare the relative thermodynamic performance of Air Source Heat Pumps (ASHP) with that of micro Combined Heat and Power (mCHP) units. The effect of varying the heat to power demand ratio is considered in order to provide insights regarding their relative merits both now and for a 2020 scenario. Exergy analysis can be considered to give an indication of the level of irreversibility in a system and the theoretical potential for improvement; continued development of these systems will inevitably reduce the level of irreversibility, improving their exergy efficiency. It is shown that whilst there is scope for improvements in exergy efficiency for both ASHP and mCHP systems, these improvements will have different effects on the overall heat to power ratio delivered. For CHP, a higher power to heat ratio would be necessary whereas for ASHP units improvements are possible across the range of possible heat to power ratios and therefore higher energy efficiency gains may be achieved for power to heat ratios below 1:1.5. INTRODUCTION Domestic space and water heating accounted for 23% of total primary energy consumption of the UK in 2008, accounting for 13% of CO 2 emissions (Department of Energy and Climate Change, 2009a; Utley & Shorrock, 2008). With the increasing profile of climate change and energy security, the UK has made a commitment to reduce total UK CO 2 e emissions 18% relative to 2008 levels by 2020 with a 29% reduction in those associated with domestic heating (Department of Energy and Climate Change, 2009b). Improving the energy and carbon emissions performance of our building stock is gathering considerable interest and it is intended that domestic dwellings built from 2016 should attain Code for Sustainable Homes performance level 6, zero net carbon emissions (Department For Communities And Local Government, 2009). However, approximately 80% of 2050 building stock is currently standing (Boardman, 2007) and even with extensive refurbishment, domestic heat and power demand are likely to remain substantial (Banfill & Peacock, 2007). Micro Combined Heat and Power units (mCHP) and Air Source Heat Pumps (ASHP) have both been suggested as devices with the potential to reduce carbon emissions and energy demand (Cockroft & Kelly, 2006). They are increasingly attracting attention, with major field trials of both devices conducted in recent years (Carbon Trust, 2007; Energy Saving Trust 2010; Miara, 2008; Yamada & Nishizaki, 2009). In order to consider the thermodynamic performance of mCHP and ASHP units in context of the wider energy system, the exergy & energy flow has been considered for four stages connected by three sub-systems (1 – 3), shown in Figure 1. Energy and exergy analysis was conducted for each of these stages individually. Analysis was then expanded to consider the whole system before consideration was given to the effect of varying the ratio of power-heat consumed at the end use stage. Figure 1 – Stages in overall energy system mCHP or ASHP Local Power and Heat Distribution Primary Energy conversion, transmission & distribution system Primary Energy Resources 1 2 3 Power and heat from device End use (power and heated space) Energy supplied to dwelling
THERMODYNAMIC ANALYSIS OF EFFICIENT DOMESTIC HEATING SYSTEMS
S. Cooper1,a, G. P. Hammond1, 2 and M. C. McManus1, 2 1. Department of Mechanical Engineering, University of Bath, Bath, UK
2. ISEE, University of Bath, Bath, UK
ABSTRACT
Energy and exergy analysis is employed to compare the relative thermodynamic performance of Air Source Heat Pumps (ASHP) with that of micro Combined Heat and Power (mCHP) units. The effect of varying the heat to power demand ratio is considered in order to provide insights regarding their relative merits both now and for a 2020 scenario. Exergy analysis can be considered to give an indication of the level of irreversibility in a system and the theoretical potential for improvement; continued development of these systems will inevitably reduce the level of irreversibility, improving their exergy efficiency. It is shown that whilst there is scope for improvements in exergy efficiency for both ASHP and mCHP systems, these improvements will have different effects on the overall heat to power ratio delivered. For CHP, a higher power to heat ratio would be necessary whereas for ASHP units improvements are possible across the range of possible heat to power ratios and therefore higher energy efficiency gains may be achieved for power to heat ratios below 1:1.5.
INTRODUCTION
Domestic space and water heating accounted for 23% of total primary energy consumption of the UK in 2008, accounting for 13% of CO2 emissions (Department of Energy and Climate Change, 2009a; Utley & Shorrock, 2008). With the increasing profile of climate change and energy security, the UK has made a commitment to reduce total UK CO2e emissions
18% relative to 2008 levels by 2020 with a 29% reduction in those associated with domestic heating (Department of Energy and Climate Change, 2009b). Improving the energy and carbon emissions performance of our building stock is gathering considerable interest and it is intended that domestic dwellings built from 2016 should attain Code for Sustainable Homes performance level 6, zero net carbon emissions (Department For Communities And Local Government, 2009). However, approximately 80% of 2050 building stock is currently standing (Boardman, 2007) and even with extensive refurbishment, domestic heat and power demand are likely to remain substantial (Banfill & Peacock, 2007). Micro Combined Heat and Power units (mCHP) and Air Source Heat Pumps (ASHP) have both been suggested as devices with the potential to reduce carbon emissions and energy demand (Cockroft & Kelly, 2006). They are increasingly attracting attention, with major field trials of both devices conducted in recent years (Carbon Trust, 2007; Energy Saving Trust 2010; Miara, 2008; Yamada & Nishizaki, 2009). In order to consider the thermodynamic performance of mCHP and ASHP units in context of the wider energy system, the exergy & energy flow has been considered for four stages connected by three sub-systems (1 – 3), shown in Figure 1. Energy and exergy analysis was conducted for each of these stages individually. Analysis was then expanded to consider the whole system before consideration was given to the effect of varying the ratio of power-heat consumed at the end use stage.
Figure 1 – Stages in overall energy system
mCHP or ASHP
Local Power and Heat
Distribution
End use (Electricity)
Primary Energy conversion,
transmission & distribution
system
Heat from
device
Power from device
Primary Energy
Resources
1
2 3
Power and heat
from
device End use
(Heated space)
End use (power and heated
space)
Energy supplied
to dwelling
BACKGROUND
Combined Heat and Power Units
Combined Heat and Power (CHP) units combine the generation of power with heat recovery in order to maximise efficiency (Figure 2).
Stirling Engine mCHP (SE-mCHP) is currently the most widely used technology for domestic application as Internal Combustion Engine based mCHP (ICE-mCHP) devices tend to be larger and pose more challenges to successful integration into the domestic environment. Fuel Cells are currently prohibitively expensive for widespread domestic application but attract interest due to their potential for high electrical efficiency (Staffell, 2009a). The two leading fuel cell technologies are Polymer Exchange Membrane Fuel Cell (PEMFC) and Solid Oxide Fuel Cell (SOFC). PEMFC units are nearer to commercialisation but the higher electrical efficiency and simpler fuel reformer requirements of SOFC units means that they are potentially the more attractive option in the longer term (Hawkes, Staffell, Brett, & Brandon, 2009). BS EN15316-4-4:2007 defines mCHP efficiency and performance criteria, giving:
(1)
(2)
Where is the total net electrical energy
generated by the device, is the total useable heat output from the device and is the enthalpy
of combustion of the fuel. The Gross Calorific Value (GCV, i.e. Higher Heating Value, HHV) is preferred and used in this paper.
Heat Pump Systems
Heat pumps use a thermodynamic cycle to transfer heat from a source to a sink at higher temperature. In the context of domestic heating they extract heat from the outside air, ground or water. Most commonly, a vapour compression cycle is employed with an electrically driven compressor (Figure 3).
Performance is measured by the heat output of the
device and by its Coefficient of Performance (COP) defined as:
COP = Q / W (3) Where Q is the heat delivered and W is the power consumption of the heat pump. Test conditions and considerations are standardised for ASHP application to space heating (BS EN14511-4:2007) and potable hot water supply (BS EN255-3:1997). Although Ground Source Heat Pumps (GSHP, those that employ the ground as their heat source) are generally more efficient, the market potential for Air Source Heat Pumps (ASHP) is considered larger due to the additional installation requirements associated with GSHPs (Berntsson, 2002).
Exergy
To consider exergy, consideration must be made of the second law of thermodynamics as well as the first; unlike energy, exergy is destroyed in any process that involves irreversibility (Dincer & Cengel, 2001): ∑ ∑ ∑ (4)
Where ∑ is the sum of exergy inputs to the
system, ∑ is the sum of desired exergy outputs from the system, ∑ is the sum of any
other exergy outputs from the system and is the
amount of irreversibility associated with the process. The rational exergy efficiency is then defined (Kotas, Mayhew, & Raichura, 1995): (5)
Considering the case of heat transfer, , across
the system boundary at constant temperature ( ),
the associated exergy transfer is given by the maximum work that could be obtained from that heat transfer:
(6)
Where is ambient temperature.
For the case of a heat transfer process to a fluid at constant pressure (i.e. the boundary temperature varies), the exergy transfer can found from the integral of the exergy transfer at each temperature (Lohani & Schmidt, 2010):
∫ (
)
(7)
(
) (
)
Kotas (1980) provides a methodology for calculating the exergy content of chemical enthalpy. It is convenient to consider the exergy content of the fuel as related to its enthalpy of combustion, H, by a factor :
Figure 2 – CHP energy flow
Losses
Power
Heat CHP Fuel
Losses
Higher TempHeat
ASHP Compression
Expansion
Evaporation Condensation Low
Temp Heat
Power
Figure 3 – Heat Pump energy flow
(8)
Allen & Hammond (2010) have collected values of for various fuels. These are adapted for inclusion
in Table 1: Table 1 adapted from Allen & Hammond, (2010)
Fuel
Coal 1.03
Fuel Oil 1.01
Natural Gas 0.94
METHODOLOGY – ENERGY ANALYSIS
Energy analysis at each stage shown in Figure 1 was considered:
1. Primary Energy conversion, transmission and distribution.
The Digest of UK Energy Statistics (DUKES, Department of Energy and Climate Change, 2009a) provides data on the UK electrical generation efficiency, generation mix, transmission and distribution losses, and is followed in taking renewable energy input to be the same as output. For comparison, the lead ―RES 80‖ scenario of the Low Carbon Transition Plan (LCTP) (Department of Energy and Climate Change, 2009b) was considered. The LCTP suggests a 22% reduction of grid associated carbon emissions will be necessary by 2020 and will be achieved through increasing the proportion of renewable and non-renewable low carbon generation to 40%. Table 2 - Electricity generation mix (output mix). Data from Department of Energy and Climate Change 2009a and 2009b
Generation 2008 2020
Coal 32% 22%
Oil 1% 1%
Gas 45% 29%
Renewables 6% 31%
Nuclear 13% 8%
Other 2% 9%
The energy requirement for natural gas was taken to be the input to the national transmission system (i.e. including distribution losses but excluding extraction and processing energy use).
2a. mCHP Energy flows
For the purpose of this comparison, steady-state performance characteristics of each type of mCHP unit were selected. It should be noted that for the mCHP units to actually achieve this performance, their control system and associated balance of plant would need to decouple operation of the unit from fluctuations in local heat and power demand. This would imply either a grid connection or an efficient storage for power generation and either well insulated thermal storage or base-load heat operation. In practice, this is hard to achieve in
domestic settings and so the performance characteristics should be considered to be an upper limit on their current potential. Performance data from various sources (Aliabadi, Thomson, & Wallace, 2010; Carbon Trust, 2007; De Paepe, D'Herdt, & Mertens, 2006; Dorer & Weber, 2009; Payne, Love, & Kah, 2009; Staffell, 2009b; Thomas, 2008; Yamada & Nishizaki, 2009) was reviewed by considering the relationship between electrical efficiency and thermal efficiency shown in Figure 4. Data from field trials is approximated by the ellipses due to the number of devices tested.
2b. ASHP Energy flows
Selection of ASHP Heat Pump performance is generally published by manufacturers after either in-house testing or testing by a recognised test body. COP data of production model ASHPs published by BRE (2007) and the Swiss Warmepumpen-Testzentrum ("WPZ") (2010) was plotted against the year of testing in Figure 5.
Despite some spread in the results there is a clear trend in the state-of-the-art. Performance of the mid-range heat pumps tends to lag the state-of-the-art by about 5 years. It is feasible that nominal COPs of 4.5 or higher will be achieved by mid-range heat pumps in the period 2015 – 2020; though of course market conditions will determine the actual prevalence of this. Previous studies (Hepbasli & Akdemir
Figure 4 - mCHP thermal & electrical efficiency. Data from Payne et al. 2009; Carbon Trust 2007; Thomas 2008; De Paepe et al. 2006; Dorer & Weber 2009; Aliabadi et al. 2010
Figure 5 – COP data to EN255 (A2W35-25). Adapted from
BRE, 2007 and WPZ, 2010
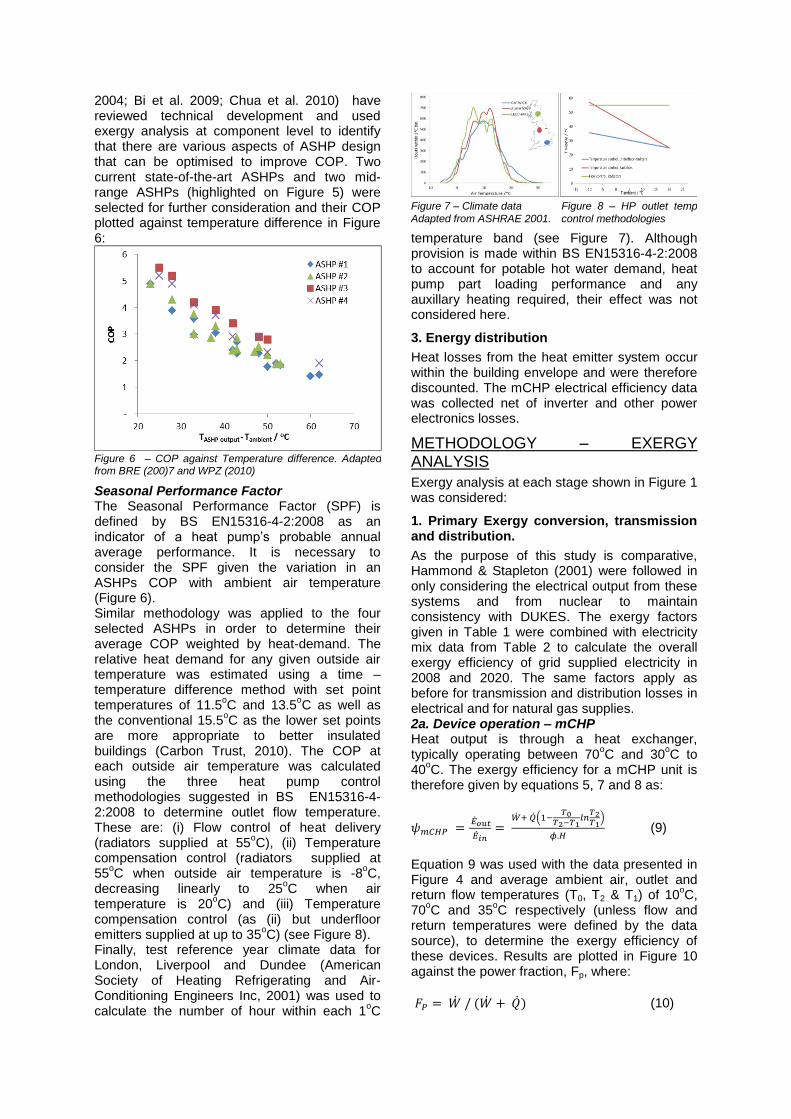
2004; Bi et al. 2009; Chua et al. 2010) have reviewed technical development and used exergy analysis at component level to identify that there are various aspects of ASHP design that can be optimised to improve COP. Two current state-of-the-art ASHPs and two mid-range ASHPs (highlighted on Figure 5) were selected for further consideration and their COP plotted against temperature difference in Figure 6:
Seasonal Performance Factor The Seasonal Performance Factor (SPF) is defined by BS EN15316-4-2:2008 as an indicator of a heat pump’s probable annual average performance. It is necessary to consider the SPF given the variation in an ASHPs COP with ambient air temperature (Figure 6). Similar methodology was applied to the four selected ASHPs in order to determine their average COP weighted by heat-demand. The relative heat demand for any given outside air temperature was estimated using a time – temperature difference method with set point temperatures of 11.5
oC and 13.5
oC as well as
the conventional 15.5oC as the lower set points
are more appropriate to better insulated buildings (Carbon Trust, 2010). The COP at each outside air temperature was calculated using the three heat pump control methodologies suggested in BS EN15316-4-2:2008 to determine outlet flow temperature. These are: (i) Flow control of heat delivery (radiators supplied at 55
oC), (ii) Temperature
compensation control (radiators supplied at 55
oC when outside air temperature is -8
oC,
decreasing linearly to 25oC when air
temperature is 20oC) and (iii) Temperature
compensation control (as (ii) but underfloor emitters supplied at up to 35
oC) (see Figure 8).
Finally, test reference year climate data for London, Liverpool and Dundee (American Society of Heating Refrigerating and Air-Conditioning Engineers Inc, 2001) was used to calculate the number of hour within each 1
oC
temperature band (see Figure 7). Although provision is made within BS EN15316-4-2:2008 to account for potable hot water demand, heat pump part loading performance and any auxillary heating required, their effect was not considered here.
3. Energy distribution
Heat losses from the heat emitter system occur within the building envelope and were therefore discounted. The mCHP electrical efficiency data was collected net of inverter and other power electronics losses.
METHODOLOGY – EXERGY ANALYSIS
Exergy analysis at each stage shown in Figure 1 was considered:
1. Primary Exergy conversion, transmission and distribution.
As the purpose of this study is comparative, Hammond & Stapleton (2001) were followed in only considering the electrical output from these systems and from nuclear to maintain consistency with DUKES. The exergy factors given in Table 1 were combined with electricity mix data from Table 2 to calculate the overall exergy efficiency of grid supplied electricity in 2008 and 2020. The same factors apply as before for transmission and distribution losses in electrical and for natural gas supplies. 2a. Device operation – mCHP Heat output is through a heat exchanger, typically operating between 70
oC and 30
oC to
40oC. The exergy efficiency for a mCHP unit is
therefore given by equations 5, 7 and 8 as:
(
)
(9)
Equation 9 was used with the data presented in Figure 4 and average ambient air, outlet and return flow temperatures (T0, T2 & T1) of 10
oC,
70oC and 35
oC respectively (unless flow and
return temperatures were defined by the data source), to determine the exergy efficiency of these devices. Results are plotted in Figure 10 against the power fraction, Fp, where:
(10)
Figure 6 – COP against Temperature difference. Adapted from BRE (200)7 and WPZ (2010)
Figure 8 – HP outlet temp
control methodologies
Figure 7 – Climate data
Adapted from ASHRAE 2001.
2b. Device operation – ASHP
A heat exchanger is used to deliver heat with a typical outlet flow temperature of 35
oC – 55
oC
and return flow temperature 5oC lower. Using
equations 5 and 7, the exergy efficiency is given by:
(
)
(
) (11)
Where T0 is the ambient temperature, T2 is the ASHP outlet flow temperature and T1 is the ASHP return flow temperature. The data presented in Figure 6 was used with the SPF methodology above and equation 11 to calculate the exergy efficiency of each ASHP.
3. Heat emitter performance
The heat distribution system takes heat from the mCHP or ASHP unit’s heat exchanger and then delivers heat to the room at a constant temperature. Assuming negligible distribution losses, the exergy efficiency is therefore given by equations 5, 6 and 7 as:
(
)
(12)
Where TD is the internal temperature of the dwelling. The exergy efficiency of the heat distribution system was calculated for the three heat pump control methodologies outlined above, taking TD = 20
oC and T2-T1 = 5
oC. Selection of an
appropriate ambient temperature, T0, is important given that the process is occurring at temperatures relatively near to it. Using similar methodology to that for ASHP SPF calculation, the heat-demand weighted mean temperature in Dundee was found to be 7.8
oC, 7.1
oC and 6.0
oC for heating set points
of 15.5oC, 13.5
oC and 11.5
oC respectively.
RESULTS & DISCUSSION
Energy
Grid electrical generation efficiency was reported as 38.9% in 2008 with 7% transmission and distribution losses resulting in an overall efficiency of 35%. For the LCTP 2020 scenario, the overall efficiency is approximately 45%. For comparison, (Siemens AG, 2010) claim CCGT efficiencies up to 54% (i.e. 50% when including 7% transmission losses). Losses from natural gas pumping, leakage and other operator activities amounted to 2.0% of the total energy input in 2008 with a resultant energy requirement for natural gas of 1.02. Performance data for four typical mCHP units is given in Table 3.
The calculated SPF for the four selected ASHPs is given in Table 4.
Notably, using a temperature compensated control methodology can improve the SPF by more than 50%, a similar effect to that observed by Kelly & Cockroft (2011) who calculated a comparable SPF (c. 2.7) using a detailed model without temperature compensation control. Although the further improvement made possible by use of underfloor heating with temperature compensation is considerable (in the order of another 30%), it is likely that the cost of implementing this will make a temperature compensated control methodology with conventional radiators the most popular option in the short term. Four permutations (highlighted) have been selected as examples of the range of SPFs that might be expected in different conditions. Figure 9 shows the energy present in each point of the overall system for the typical SE-mCHP, PEMFC-mCHP and ASHPs with SPFs of 2.8 and 5.3. The 2008 grid efficiency is assumed with a demand power to heat ratio of 1:1.
Table 3 – mCHP typical efficiencies
mCHP Type Electrical efficiency Thermal efficiency
The exergy efficiency of grid supplied electricity generation in 2008 and 2020 was calculated to be 38% and 48% respectively. Taking into account transmission and distribution losses totalling 7%, this gives efficiencies of 35.1% and 45.2% respectively. For natural gas supplied to the dwellings, the same factors apply as before giving an exergy requirement for gas exergy of 1.02.
mCHP exergy efficiency is plotted against power fraction in Figure 10. It can be seen that although the total energy efficiency of most of the mCHP units being considered is high (c. 80%), the relatively low exergy value (c. 15%) of heat delivered at this temperature means that the exergy efficiency of units is low unless their power-heat output ratio is high. This would not be the case for applications in which the heat is required at a higher temperature such as for an industrial process or to drive a secondary power generation cycle (Al-Sulaiman, Dincer, & Hamdullahpur, 2010). The proximity of the 100% energy efficiency plot at lower power fractions constrains any significant improvements in exergy efficiency such that they must involve an increased electrical efficiency. ASHP exergy efficiency results were plotted against external air temperature in Figure 11.
In contrast to the energy efficiency (Figure 6), the exergy efficiency of each ASHP does not vary greatly with ambient air temperature (typical variation of +/- 3% across working range). There is usually a slight dip in exergy efficiency at ambient air temperatures around 2
oC, possibly due to the
onset of defrost cycles (Jenkins, Tucker, Ahadzi, & Rawlings, 2008).
The exergy efficiency of the heat distribution system was calculated and plotted in Figure 12 for the three heat emitter control methodologies detailed above.
It is clear that considerable exergy is lost in the heating systems that use higher flow temperatures. There is therefore some benefit in improving the effectiveness of the heat distribution system if the mCHP and ASHP devices are designed to take advantage of lower flow temperatures.
The exergy content at each point in the system is shown in Figure 13 for the same four systems used for Figure 9.
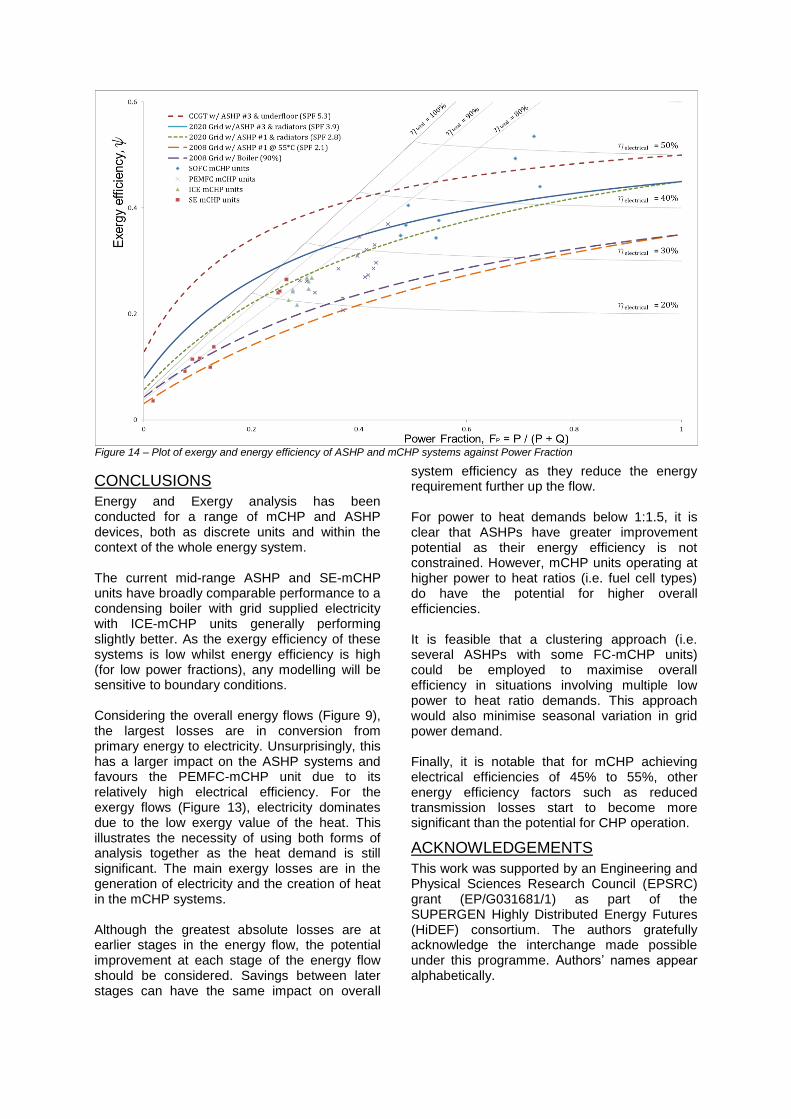
The variation of the energy and exergy efficiencies with the power fraction of the overall system can be considered by reference to Figure 14, (for case where T0 = 6
oC & TDWELLING = 20
oC). The exergy
efficiency of the four selected ASHPs with grid supplied electricity were plotted as lines on the graph as any total power fraction is feasible. Plots are also given for various electrical efficiencies to aid interpretation. mCHP devices are characterised by single points (as in Figure 10 but taking account of the efficiency of the gas supply and heat distribution systems). However the heat – power ratio for these systems will vary; this can be achieved through control of the device operation or, more commonly, by importing & exporting electricity. A system comprising a 90% efficient condensing gas boiler with 2008 grid supplied electricity is plotted for comparison.
Figure 10 – mCHP exergy efficiency against power fraction
Figure 11 – ASHP exergy efficiency against ambient temp
Figure 12– Heat distribution system exergy efficiency
Figure 13 – Exergy flows across overall systems
CONCLUSIONS
Energy and Exergy analysis has been conducted for a range of mCHP and ASHP devices, both as discrete units and within the context of the whole energy system. The current mid-range ASHP and SE-mCHP units have broadly comparable performance to a condensing boiler with grid supplied electricity with ICE-mCHP units generally performing slightly better. As the exergy efficiency of these systems is low whilst energy efficiency is high (for low power fractions), any modelling will be sensitive to boundary conditions. Considering the overall energy flows (Figure 9), the largest losses are in conversion from primary energy to electricity. Unsurprisingly, this has a larger impact on the ASHP systems and favours the PEMFC-mCHP unit due to its relatively high electrical efficiency. For the exergy flows (Figure 13), electricity dominates due to the low exergy value of the heat. This illustrates the necessity of using both forms of analysis together as the heat demand is still significant. The main exergy losses are in the generation of electricity and the creation of heat in the mCHP systems. Although the greatest absolute losses are at earlier stages in the energy flow, the potential improvement at each stage of the energy flow should be considered. Savings between later stages can have the same impact on overall
system efficiency as they reduce the energy requirement further up the flow. For power to heat demands below 1:1.5, it is clear that ASHPs have greater improvement potential as their energy efficiency is not constrained. However, mCHP units operating at higher power to heat ratios (i.e. fuel cell types) do have the potential for higher overall efficiencies. It is feasible that a clustering approach (i.e. several ASHPs with some FC-mCHP units) could be employed to maximise overall efficiency in situations involving multiple low power to heat ratio demands. This approach would also minimise seasonal variation in grid power demand. Finally, it is notable that for mCHP achieving electrical efficiencies of 45% to 55%, other energy efficiency factors such as reduced transmission losses start to become more significant than the potential for CHP operation.
ACKNOWLEDGEMENTS
This work was supported by an Engineering and Physical Sciences Research Council (EPSRC) grant (EP/G031681/1) as part of the SUPERGEN Highly Distributed Energy Futures (HiDEF) consortium. The authors gratefully acknowledge the interchange made possible under this programme. Authors’ names appear alphabetically.
Figure 14 – Plot of exergy and energy efficiency of ASHP and mCHP systems against Power Fraction
NOMENCLATURE ASHP Air Source Heat Pump mCHP Micro Combined Heat and Power SOFC Solid Oxide Fuel Cell PEMFC Proton Exchange Membrane Fuel Cell ICE Internal Combustion Engine SE Stirling Engine W Work / Electrical energy Q Heat T Temperature T0 Ambient temperature E Exergy
Energy efficiency
Exergy efficiency COP Coefficient of Performance SPF Seasonal Performance Factor
Ratio of chemical exergy to enthalpy H Enthalpy of combustion (higher heating value)
REFERENCES Al-Sulaiman, F. a, Dincer, I., & Hamdullahpur, F. (2010). Exergy
analysis of an integrated solid oxide fuel cell and organic Rankine cycle for cooling, heating and power production. Journal of Power Sources, 195(8), 2346-2354. doi: 10.1016/j.jpowsour.2009.10.075.
Aliabadi, A. a, Thomson, M. J., & Wallace, J. S. (2010). Efficiency Analysis of Natural Gas Residential Micro-cogeneration Systems. Energy & Fuels, 24(3), 1704-1710. doi: 10.1021/ef901212n.
Allen, S. R., & Hammond, G. P. (2010). Thermodynamic and carbon analyses of micro-generators for UK households. Energy, 35(5), 2223-2234. Elsevier Ltd. doi: 10.1016/j.energy.2010.02.008.
American Society of Heating Refrigerating and Air-Conditioning Engineers Inc. (2001). International Weather for Energy Calculations (IWEC Weather Files) Users manual and CD-ROM. Atlanta: ASHRAE.
Banfill, P. F. G., & Peacock, A. D. (2007). Energy-efficient new housing - the UK reaches for sustainability. Building Research & Information, 35(4), 426-436. doi: 10.1080/09613210701339454.
Berntsson, T. (2002). Heat sources — technology , economy and environment. International Journal of Refrigeration, 25, 428-438.
Bi, Y., Wang, X., Liu, Y., Zhang, H., & Chen, L. (2009). Comprehensive exergy analysis of a ground-source heat pump system for both building heating and cooling modes. Applied Energy, 86(12), 2560-2565. Elsevier Ltd. doi: 10.1016/j.apenergy.2009.04.005.
Boardman, B. (2007). Home Truths: A low-carbon strategy to reduce UK housing emissions by 80% by 2050. Oxford: Environmental Change Institute, University of Oxford.
BRE. (2007). Ecodan PUHZ-W90VHA air to water heat pump tests. Garston: Building Research Establishment Ltd.
BS EN14511-4. (2007). Air conditioners, liquid chilling packages and heat pumps with electrically driven compressors for space heating and cooling - Part 4: Requirements. London: BSI.
BS EN15316-4-2. (2008). Heating systems in buildings — Method for calculation of system energy requirements and system efficiencies — Part 4-2:Space heating generation systems, heat pump systems (Vol. 3). London: BSI.
BS EN255-3. (1997). Air conditioners , liquid chilling packages and heat pumps with electrically driven compressors - Heating mode Part 3 . Testing and requirements for sanitary hot water units. London: BSI.
Carbon Trust. (2010). Degree days for energy management. London: HMSO.
Chua, K. J., Chou, S. K., & Yang, W. M. (2010). Advances in heat pump systems: A review. Applied Energy, 87(12), 3611-3624. Elsevier Ltd. doi: 10.1016/j.apenergy.2010.06.014.
Cockroft, J., & Kelly, N. J. (2006). A comparative assessment of future heat and power sources for the UK domestic sector. Energy Conversion and Management, 47(15-16), 2349-2360. doi: 10.1016/j.enconman.2005.11.021.
De Paepe, M., DʼHerdt, P., & Mertens, D. (2006). Micro-CHP systems for residential applications. Energy Conversion and
Department For Communities And Local Government. (2009). Code for Sustainable Homes. Communities. London: Department For Communities And Local Government.
Department of Energy and Climate Change. (2009a). Digest of United Kingdom Energy Statistics 2009. Statistics. London: TSO.
Department of Energy and Climate Change. (2009b). The UK Low Carbon Transition Plan. London: TSO.
Dincer, I., & Cengel, Y. a. (2001). Energy, Entropy and Exergy Concepts and Their Roles in Thermal Engineering. Entropy, 3(3), 116-149. doi: 10.3390/e3030116.
Dorer, V., & Weber, A. (2009). Energy and CO2 emissions performance assessment of residential micro-cogeneration systems with dynamic whole-building simulation programs. Energy Conversion and Management, 50(3), 648-657. Elsevier Ltd. doi: 10.1016/j.enconman.2008.10.012.
Energy Saving Trust. (2010). Getting warmer: a field trial of heat pumps. London: Energy Saving Trust.
Hammond, G. P., & Stapleton, a J. (2001). Exergy analysis of the United Kingdom energy system. Proceedings of the Institution of Mechanical Engineers, Part A: Journal of Power and Energy, 215(2), 141-162. doi: 10.1243/0957650011538424.
Hawkes, A., Staffell, I., Brett, D., & Brandon, N. (2009). Fuel cells for micro-combined heat and power generation. Energy & Environmental Science, 2(7), 729. doi: 10.1039/b902222h.
Hepbasli, A., & Akdemir, O. (2004). Energy and exergy analysis of a ground source (geothermal) heat pump system. Energy Conversion and Management, 45(5), 737-753. doi: 10.1016/S0196-8904(03)00185-7.
Jenkins, D., Tucker, R., Ahadzi, M., & Rawlings, R. (2008). The performance of air-source heat pumps in current and future offices. Energy and Buildings, 40(10), 1901-1910. doi: 10.1016/j.enbuild.2008.04.015.
Kelly, N. J., & Cockroft, J. (2011). Analysis of retrofit air source heat pump performance: Results from detailed simulations and comparison to field trial data. Energy and Buildings, 43(1), 239-245. Elsevier B.V. doi: 10.1016/j.enbuild.2010.09.018.
Kotas, T. J. (1980). Exergy concepts for thermal plant. First of two papers on exergy techniques in thermal plant analysis. International Journal of Heat and Fluid Flow, 2(3), 105-114. doi: 10.1016/0142-727X(80)90028-4.
Kotas, T. J., Mayhew, Y. R., & Raichura, R. C. (1995). Nomenclature for exergy analysis. Proceedings of the Institution of Mechanical Engineers, Part A: Journal of Power and Energy, 209(41), 275-280. doi: 10.1243/PIME_PROC_1995_209_006_01.
Lohani, S. P., & Schmidt, D. (2010). Comparison of energy and exergy analysis of fossil plant, ground and air source heat pump building heating system. Renewable Energy, 35(6), 1275-1282. Elsevier Ltd. doi: 10.1016/j.renene.2009.10.002.
Miara, M. (2008). Two large field-tests of new heat pumps in Germany. 9th IEA Heat Pump Conference, 20 - 22 May 2008, Zurich.
Payne, R., Love, J., & Kah, M. (2009). Generating Electricity at 60% Electrical Efficiency from 1 - 2 kWe SOFC Products. ECS Transactions, 25(2), 231-239. ECS. doi: 10.1149/1.3205530.
Siemens AG. (2010). SGT5-8000H datasheet. Erlangen: Siemens Energy Inc.
Staffell, I. (2009a). Fuel Cells for domestic heat and power: Are they worth it? Thesis (PhD): University of Birmingham.
Staffell, I. (2009b). A review of small stationary fuel cell performance.
Thomas, B. (2008). Benchmark testing of Micro-CHP units. Applied Thermal Engineering, 28(16), 2049-2054. doi: 10.1016/j.applthermaleng.2008.03.010.
Utley, J. I., & Shorrock, L. D. (2008). Domestic energy fact file 2008. Energy. Garston: Building Research Establishment Ltd.
Warmepumpen-Testzentrum. (2010). Test results of air to water heat pumps based on EN 14511. Buchs, Switzerland: Institut fur Energiesysteme, Interstaatliche Hochschule für Technik.
Yamada, Y., & Nishizaki, K. (2009). Next generation model of the worldʼs first residential PEMFC cogeneration system goes on sale. 24th World Gas Conference, Buenos Aires, 5 - 9 October 2009 (pp. 1-7).