1 Thermodynamics, Economics and Politics Thermodynamics, Economics and Politics The practical constraints in climate change mitigation The practical constraints in climate change mitigation & Implications for Investment and Planning & Implications for Investment and Planning Kevin Leahy – Managing Director, Climate Policy HEPG 48 th Plenary, Kennedy School of Government Oct. 4, 2007
Transcript
1
Thermodynamics, Economics and PoliticsThermodynamics, Economics and PoliticsThe practical constraints in climate change mitigationThe practical constraints in climate change mitigation& Implications for Investment and Planning& Implications for Investment and Planning
Kevin Leahy –Managing Director, Climate PolicyHEPG 48th Plenary, Kennedy School of GovernmentOct. 4, 2007
2
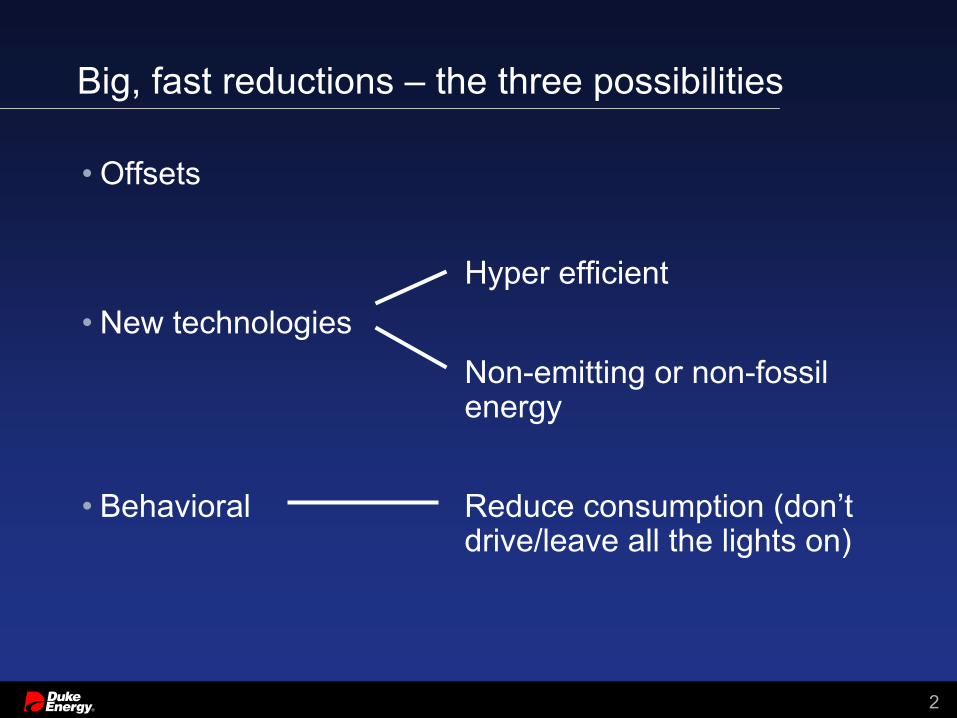
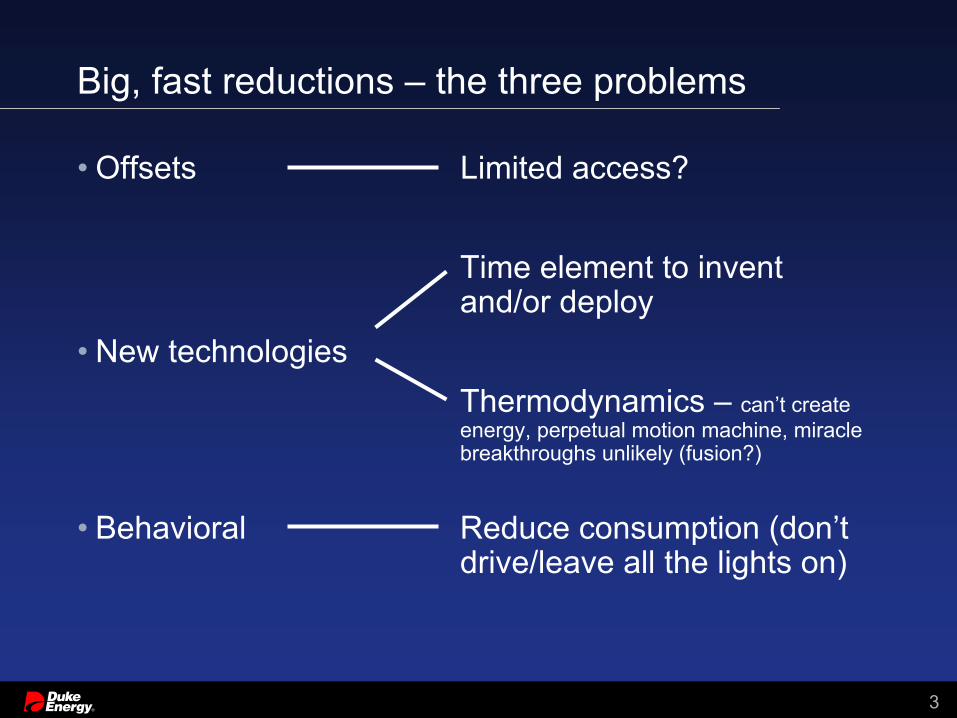
• Offsets
Hyper efficient• New technologies
Non-emitting or non-fossil energy
• Behavioral Reduce consumption (don’t drive/leave all the lights on)
• Behavioral Reduce consumption (don’t drive/leave all the lights on)
4
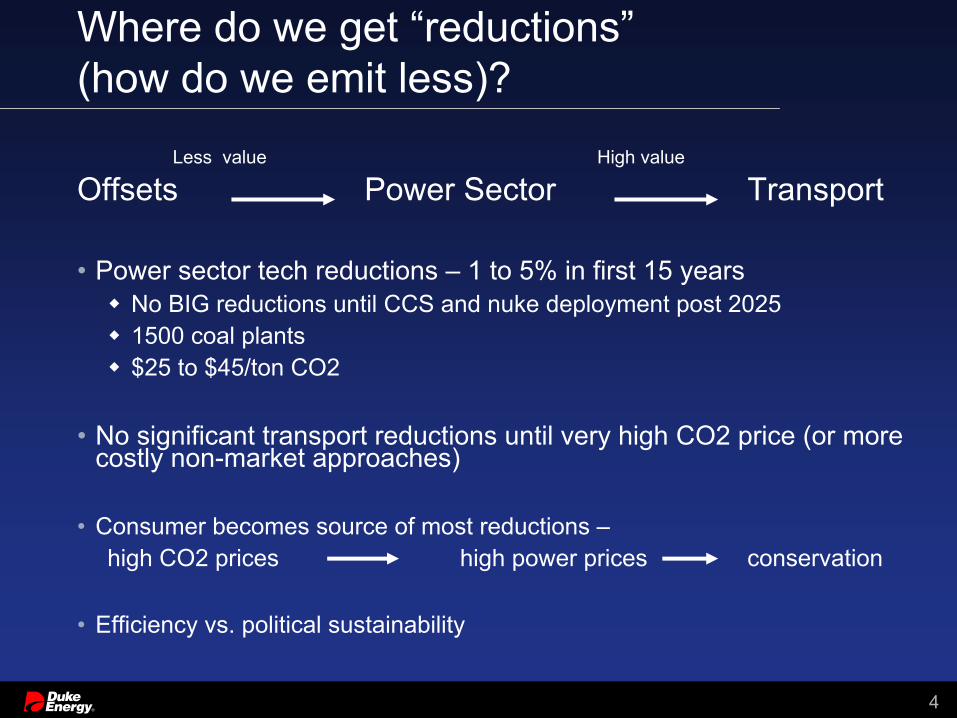
Where do we get “reductions”(how do we emit less)?
Less value High value
Offsets Power Sector Transport
• Power sector tech reductions – 1 to 5% in first 15 yearsNo BIG reductions until CCS and nuke deployment post 20251500 coal plants$25 to $45/ton CO2
• No significant transport reductions until very high CO2 price (or more costly non-market approaches)
• Consumer becomes source of most reductions –high CO2 prices high power prices conservation
• Efficiency vs. political sustainability
5
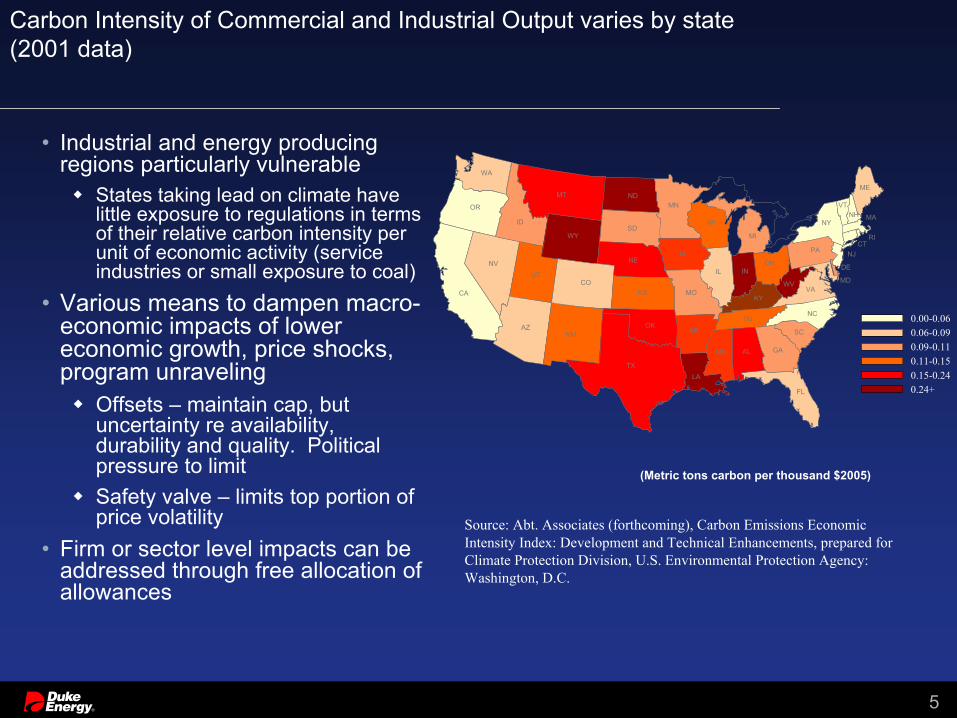
Carbon Intensity of Commercial and Industrial Output varies by state (2001 data)
• Industrial and energy producing regions particularly vulnerable
States taking lead on climate have little exposure to regulations in terms of their relative carbon intensity per unit of economic activity (service industries or small exposure to coal)
• Various means to dampen macro-economic impacts of lower economic growth, price shocks, program unraveling
Offsets – maintain cap, but uncertainty re availability, durability and quality. Political pressure to limitSafety valve – limits top portion of price volatility
• Firm or sector level impacts can be addressed through free allocation of allowances
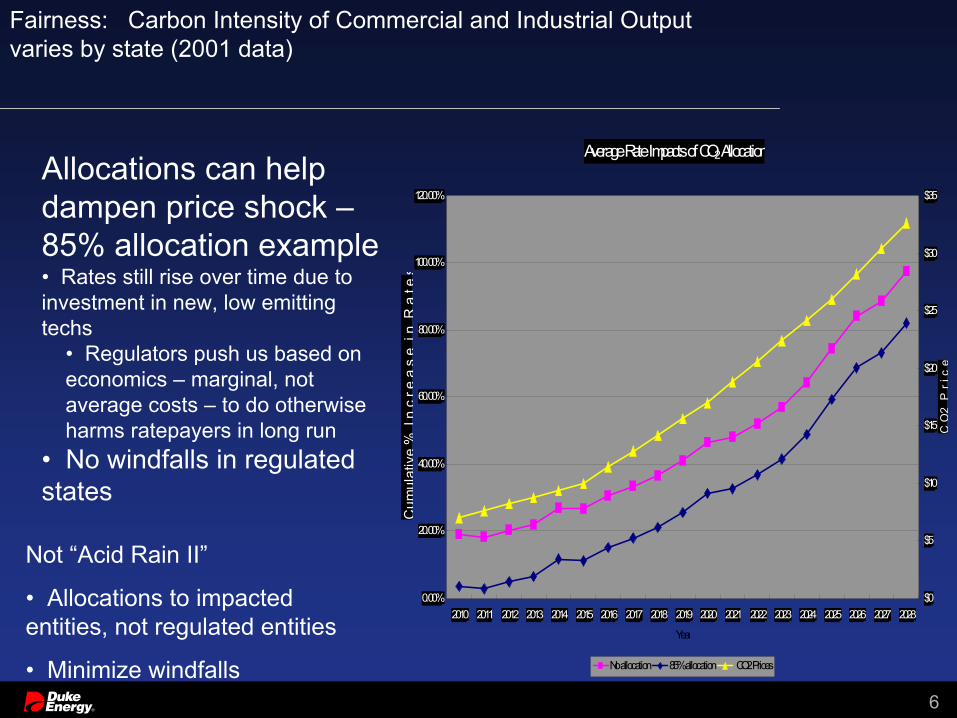
Allocations can help dampen price shock –85% allocation example• Rates still rise over time due to investment in new, low emitting techs
• Regulators push us based on economics – marginal, not average costs – to do otherwise harms ratepayers in long run
• No windfalls in regulated states
Not “Acid Rain II”
• Allocations to impacted entities, not regulated entities
• Minimize windfalls
7
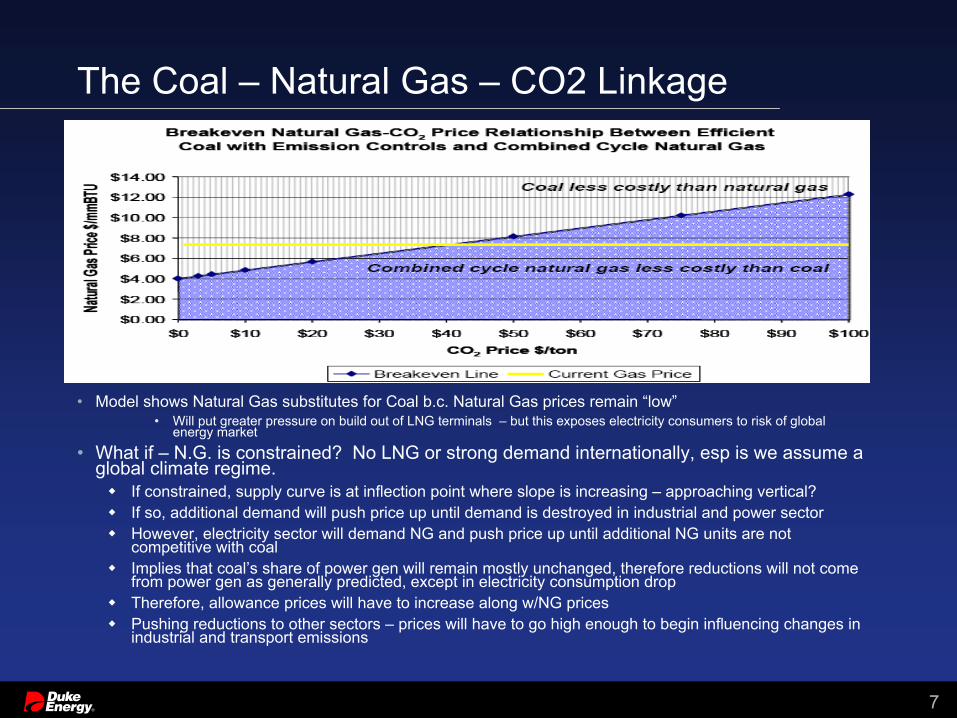
The Coal – Natural Gas – CO2 Linkage
• Model shows Natural Gas substitutes for Coal b.c. Natural Gas prices remain “low”• Will put greater pressure on build out of LNG terminals – but this exposes electricity consumers to risk of global
energy market
• What if – N.G. is constrained? No LNG or strong demand internationally, esp is we assume a global climate regime.
If constrained, supply curve is at inflection point where slope is increasing – approaching vertical?If so, additional demand will push price up until demand is destroyed in industrial and power sectorHowever, electricity sector will demand NG and push price up until additional NG units are not competitive with coalImplies that coal’s share of power gen will remain mostly unchanged, therefore reductions will not come from power gen as generally predicted, except in electricity consumption dropTherefore, allowance prices will have to increase along w/NG pricesPushing reductions to other sectors – prices will have to go high enough to begin influencing changes in industrial and transport emissions
8
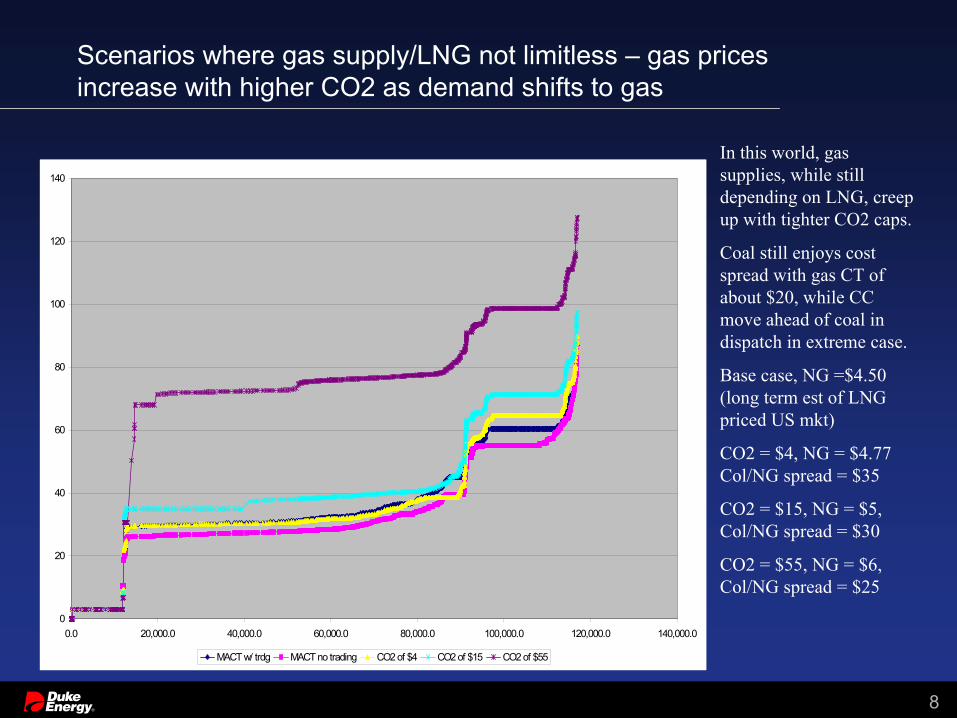
Scenarios where gas supply/LNG not limitless – gas prices increase with higher CO2 as demand shifts to gas
MACT w/ trdg MACT no trading CO2 of $4 CO2 of $15 CO2 of $55
In this world, gas supplies, while still depending on LNG, creep up with tighter CO2 caps.
Coal still enjoys cost spread with gas CT of about $20, while CC move ahead of coal in dispatch in extreme case.
Base case, NG =$4.50 (long term est of LNG priced US mkt)
CO2 = $4, NG = $4.77 Col/NG spread = $35
CO2 = $15, NG = $5, Col/NG spread = $30
CO2 = $55, NG = $6, Col/NG spread = $25
9
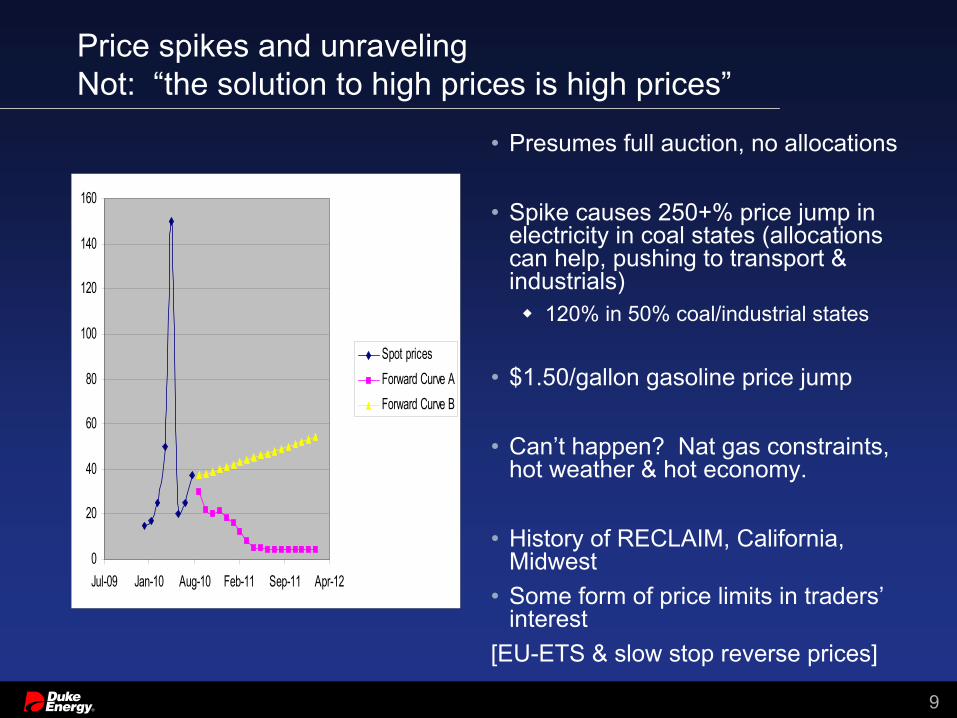
Price spikes and unravelingNot: “the solution to high prices is high prices”
0
20
40
60
80
100
120
140
160
Jul-09 Jan-10 Aug-10 Feb-11 Sep-11 Apr-12
Spot pricesForward Curve AForward Curve B
• Presumes full auction, no allocations
• Spike causes 250+% price jump in electricity in coal states (allocations can help, pushing to transport & industrials)
120% in 50% coal/industrial states
• $1.50/gallon gasoline price jump
• Can’t happen? Nat gas constraints, hot weather & hot economy.
• History of RECLAIM, California, Midwest
• Some form of price limits in traders’interest
[EU-ETS & slow stop reverse prices]
10
Seeing the future
• Markets tend to be very near sighted• Models can help, but not too good at anticipating
games• Blind spots• Fun with NOx, SOx and Mercury
11
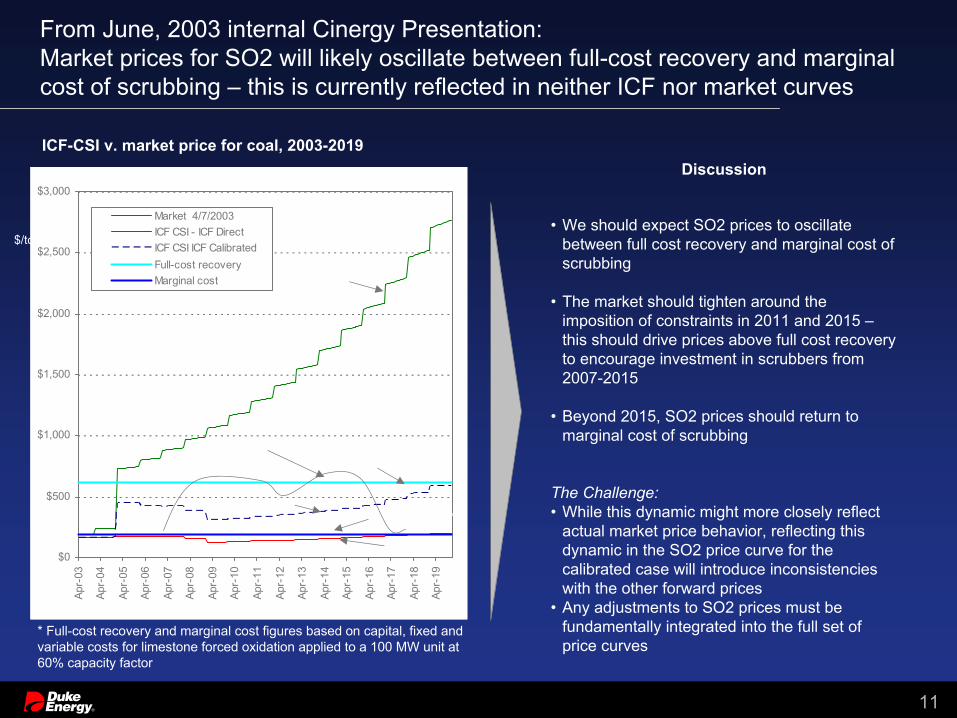
From June, 2003 internal Cinergy Presentation:Market prices for SO2 will likely oscillate between full-cost recovery and marginal cost of scrubbing – this is currently reflected in neither ICF nor market curves
• We should expect SO2 prices to oscillate between full cost recovery and marginal cost of scrubbing
• The market should tighten around the imposition of constraints in 2011 and 2015 –this should drive prices above full cost recovery to encourage investment in scrubbers from 2007-2015
• Beyond 2015, SO2 prices should return to marginal cost of scrubbing
The Challenge: • While this dynamic might more closely reflect
actual market price behavior, reflecting this dynamic in the SO2 price curve for the calibrated case will introduce inconsistencies with the other forward prices
• Any adjustments to SO2 prices must be fundamentally integrated into the full set of price curves
ICF-CSI v. market price for coal, 2003-2019
$/ton
* Full-cost recovery and marginal cost figures based on capital, fixed and variable costs for limestone forced oxidation applied to a 100 MW unit at 60% capacity factor
ICF-calibrated
12
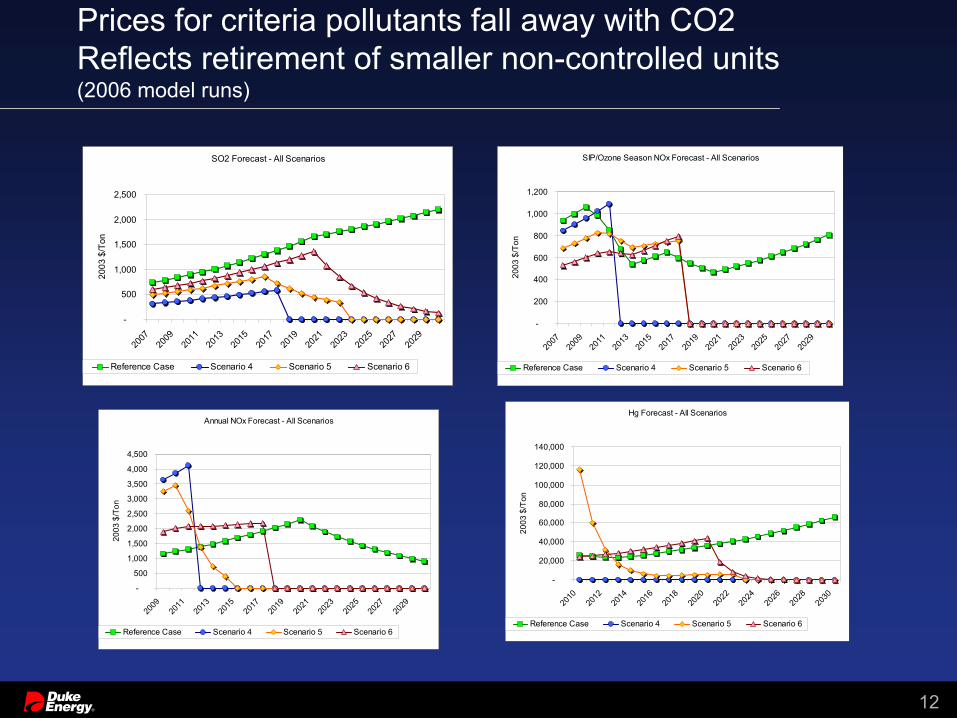
Prices for criteria pollutants fall away with CO2Reflects retirement of smaller non-controlled units (2006 model runs)
SO2 Forecast - All Scenarios
-
500
1,000
1,500
2,000
2,500
2007
2009
2011
2013
2015
2017
2019
2021
2023
2025
2027
2029
2003
$/T
on
Reference Case Scenario 4 Scenario 5 Scenario 6
SIP/Ozone Season NOx Forecast - All Scenarios
-
200
400
600
800
1,000
1,200
2007
2009
2011
2013
2015
2017
2019
2021
2023
2025
2027
2029
2003
$/T
on
Reference Case Scenario 4 Scenario 5 Scenario 6
Annual NOx Forecast - All Scenarios
-
500
1,000
1,500
2,000
2,500
3,000
3,500
4,000
4,500
2009
2011
2013
2015
2017
2019
2021
2023
2025
2027
2029
2003
$/T
on
Reference Case Scenario 4 Scenario 5 Scenario 6
Hg Forecast - All Scenarios
-
20,000
40,000
60,000
80,000
100,000
120,000
140,000
2010
2012
2014
2016
2018
2020
2022
2024
2026
2028
2030
2003
$/T
on
Reference Case Scenario 4 Scenario 5 Scenario 6
13
False premise
“Technologies that might be employed to render coal more environmentally benign, such as IGCC and carbon sequestration are either not economic without subsides or are technologically unproven.”
• Q: Economic relative to what or under what conditions?
• Certainly true if CO2 price = 0
• With a carbon constraint? -- $25 to $40/ton CO2Bingaman’s bonus allowances
• What timeframe?• Have to decide now? Will uncertainty resolve?
14
Purchasing OptionsThe value of delay until uncertainty resolves
Delay options for base load investments• Stall, yet invest in capacity
No base load – build combined cycle or CTsCapacity risk much worse than fuel price risks – Midwest 98/99 experience and California
• Go half wayBuild likely CCS candidate without the CCS hardwareDrill some holes – ensure good geology nearby
• Stall with increased Energy Efficiency Investment
To be cost effective, environmentally effective and fair i.e., Maybe not your typical compliance mandate
• Things a policy shouldn’t includeNo point source mandatesNo facility or company specific targetsNo sectoral targets (electricity, transport, cement, etc.)Wide use of performance or efficiency standards
• Policy should includeEmissions cap for the entire economyFewest regulated entities possible (fuel producers)Offset opportunities (non-regulated gasses or emission sources –methane, SF6, NO2, etc.)Allocations to compensate negatively impacted firms, sectors, regionsSupport for large scale technology demonstrations so that they’re ready when needed -- Carbon Capture and Sequestration is critical
17
Duke Energy Climate Principles and Policy Positions
Environmentally effective, cost effective and fairIs economy-wide in its reach, rather than targeting a single industry or sector for emission reductions
Covers the entire economy’s carbon emissions including transportation, electric sector and other emitting sources with a single CO2 cap, resulting in a single CO2 market pricePoint of regulation should be “upstream” at or close to where fossil fuels enter the economy (e.g. on oil refineries for motor vehicles – with the coal exception)
Is national in scope, yet considers varying impacts across regions and economic sectorsShould be federal policy, not state / regional patchwork - more economically efficient way to respond to the issueAppropriate allowance allocation is given to entities that incur a disproportional amount of economic harm from the programRegulated electric utility will lower price impact on consumer in hardest hit regionsAllowance allocation should be based on recent historical emissions or heat input (“input” basis)
Is market-based, with price signals leading to technological innovation and investment, energy efficiency and conservation
Support a “cap and trade” program that incents new technology development and allocates the majority of the emission allowances for freeSpecial programs to “jump start” deployment of large projects in preparation for full roll-out
Begins to reduce greenhouse gas emissions, now, and does so gradually over timeSupport a “slow, stop, reduce” emissions trajectoryPhase in over multiple decades with increasingly more stringent caps
Is simple to administer and provides price certaintyEmission allowance price caps should be used during the initial compliance phase to mitigate unintended economic consequences and prevent price shocks
American Institute of Physics History of Climate Sciencehttp://www.aip.org/history/climate/Resources for the Future for Environmental Economic Analysis
http://www.rff.org/Climate.cfmEPRI for general economics on climatehttp://my.epri.com/portal/server.pt?space=CommunityPage&cached=true&par